Embed Size (px)
Citation preview
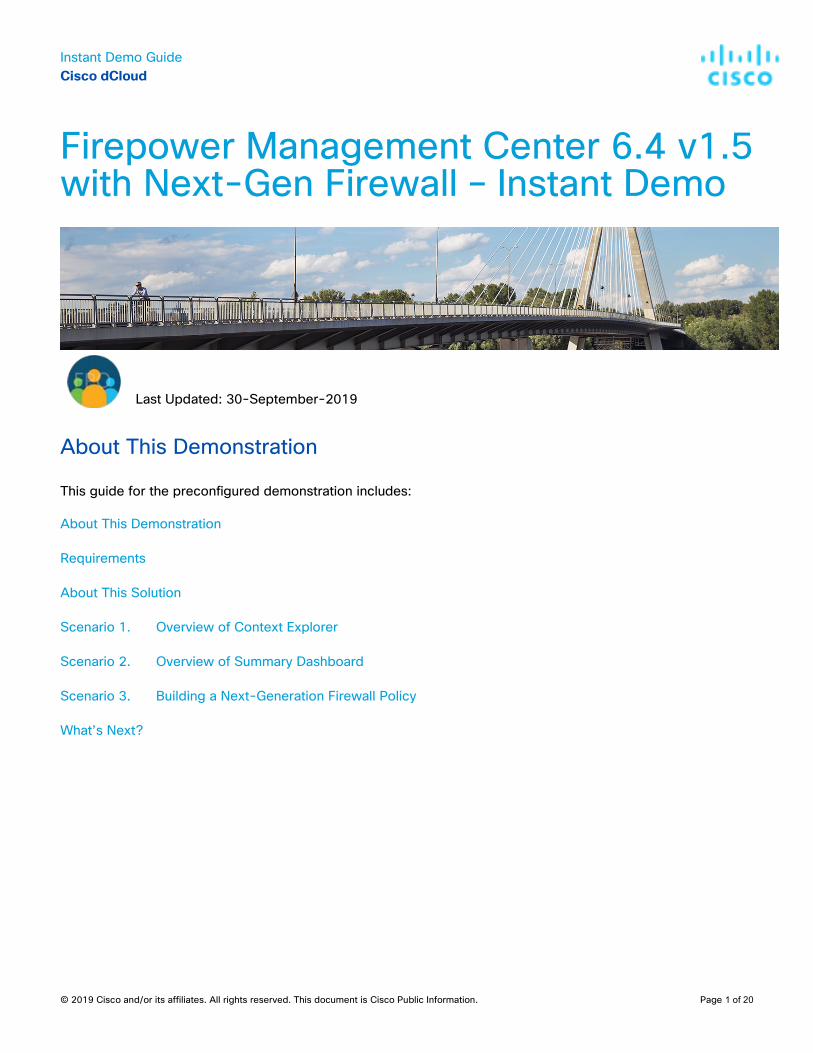
Instant Demo Guide Cisco dCloud
© 2019 Cisco and/or its affiliates. All rights reserved. This document is Cisco Public Information. Page 1 of 20
Firepower Management Center 6.4 v1.5 with Next-Gen Firewall – Instant Demo
Last Updated: 30-September-2019
About This Demonstration
This guide for the preconfigured demonstration includes:
About This Demonstration
Requirements
About This Solution
Scenario 1. Overview of Context Explorer
Scenario 2. Overview of Summary Dashboard
Scenario 3. Building a Next-Generation Firewall Policy
What’s Next?
Instant Demo Guide Cisco dCloud
© 2019 Cisco and/or its affiliates. All rights reserved. This document is Cisco Public Information. Page 2 of 20
Requirements
The table below outlines the requirements for this preconfigured demonstration.
Required Optional
Laptop Cisco AnyConnect®
About This Solution
The Firepower System is a threat-centric next-generation security system. It provides very powerful security controls using its firewall, IPS, and advanced malware protections, while providing enhanced visibility into advanced threats. By understanding the network environment, type types of hosts on the network, and the applications used by endpoints and servers, Firepower takes the guesswork out of deploying policies, and reduces the effort required to tune security devices and services. This makes the system more accurate and allows the network or security staff to rapidly focus on issues that require attention. Retrospective capabilities allow users to understand how threats and malware entered a network and trace the movement of malicious files.
The key components of the solution are:
• Firepower Management Center (FMC). FMC is a centralized management and reporting appliance running on either a dedicated hardware appliance or as a virtual machine running within VMware.
• Cisco Firepower, running as a service on a Cisco ASA Adaptive Security Appliance, dedicated Firepower appliance, or as a virtual appliance running in VMware, Amazon Web Service, KVM, or as a Firepower Threat Defense appliance, running on supported hardware or virtual appliances.
Instant Demo Guide Cisco dCloud
© 2019 Cisco and/or its affiliates. All rights reserved. This document is Cisco Public Information. Page 3 of 20
Scenario 1. Overview of Context Explorer
Value Proposition: Cisco Firepower has a very powerful set of Dashboards. Context Explorer is special kind of high-level dashboard that provides multiple views into the network, all focused around a common time frame and filter. These views are all included as panels within the Context Explorer:
• Traffic and Intrusion Events over Time • Indications of Compromise • Network Information (including Operating System information and top talkers by IP address and Username) • Application Protocol Information (including Web Applications and Client Applications) • Security Intelligence • Intrusion Information • File Information (including Malware) • Geolocation Information • URL Information
As filters are applied, or time ranges are modified, the data in each of these panels will change to match the desired information. As an example of what you might use this for, consider the possibility of troubleshooting a certain user’s network access. The user’s name can be applied as a filter, and all data shown above is filtered to show only data matching that username’s network traffic will appear in the panels.
Steps
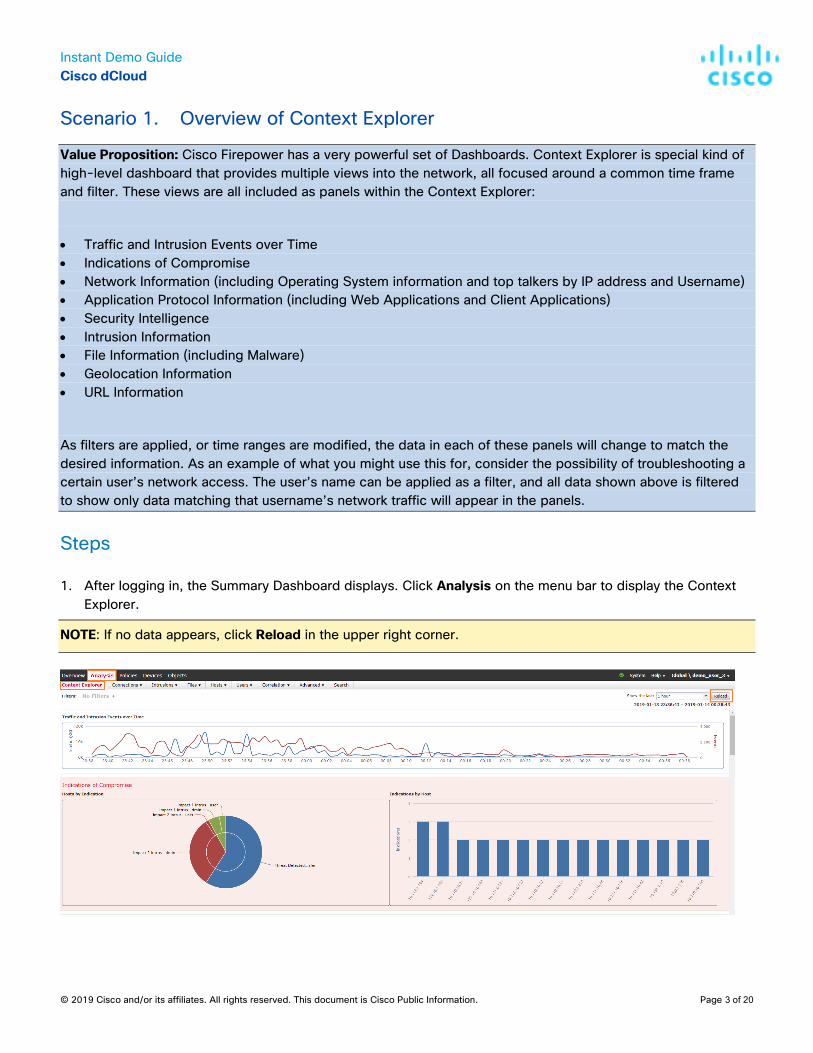
1. After logging in, the Summary Dashboard displays. Click Analysis on the menu bar to display the Context Explorer.
NOTE: If no data appears, click Reload in the upper right corner.
Instant Demo Guide Cisco dCloud
© 2019 Cisco and/or its affiliates. All rights reserved. This document is Cisco Public Information. Page 4 of 20
2. Scroll up and down the page and explore. You will see each of the individual panels, which:
• Are color coded
• Contain graphs and charts
• Are interactive and display detailed information when you mouse over them
• Have the ability to add or remove filters
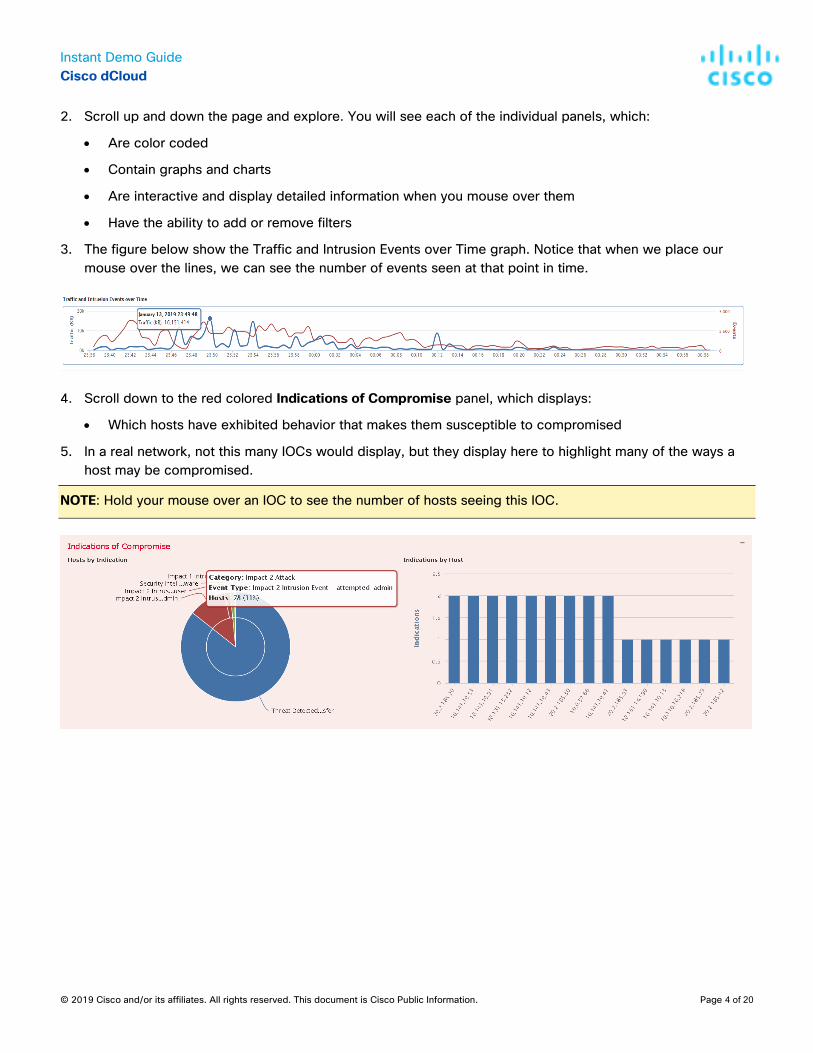
3. The figure below show the Traffic and Intrusion Events over Time graph. Notice that when we place our mouse over the lines, we can see the number of events seen at that point in time.
4. Scroll down to the red colored Indications of Compromise panel, which displays:
• Which hosts have exhibited behavior that makes them susceptible to compromised
5. In a real network, not this many IOCs would display, but they display here to highlight many of the ways a host may be compromised.
NOTE: Hold your mouse over an IOC to see the number of hosts seeing this IOC.
Instant Demo Guide Cisco dCloud
© 2019 Cisco and/or its affiliates. All rights reserved. This document is Cisco Public Information. Page 5 of 20
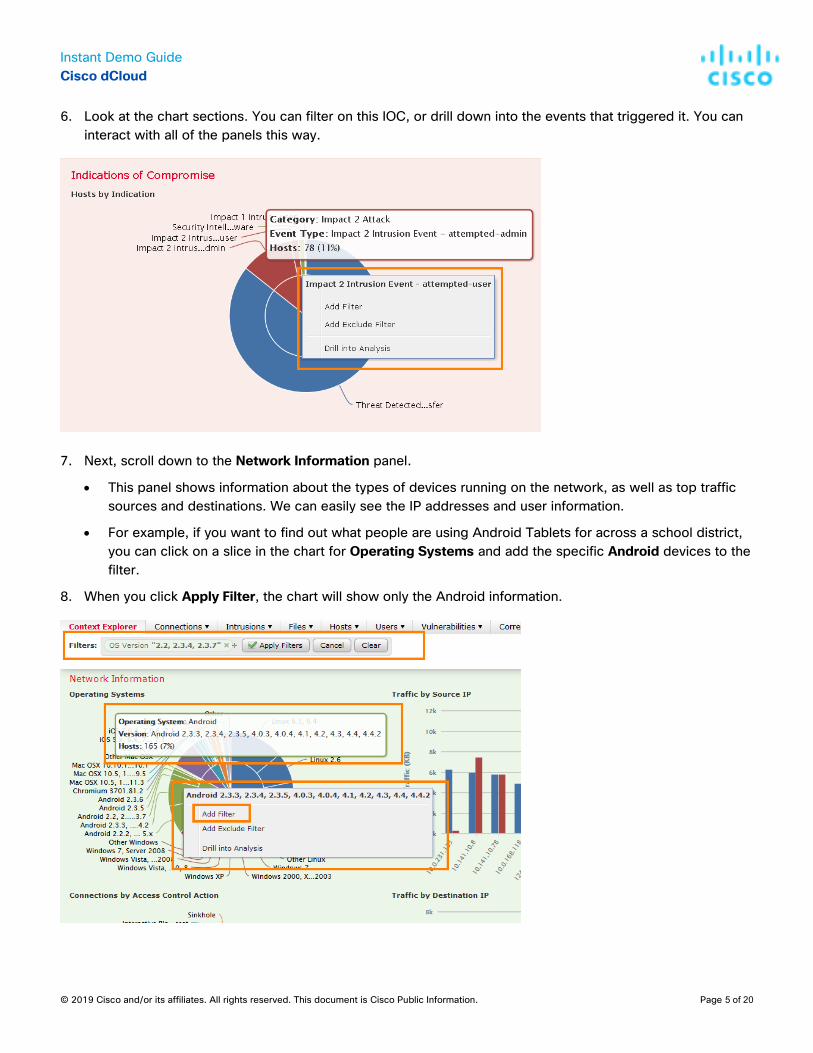
6. Look at the chart sections. You can filter on this IOC, or drill down into the events that triggered it. You can interact with all of the panels this way.
7. Next, scroll down to the Network Information panel.
• This panel shows information about the types of devices running on the network, as well as top traffic sources and destinations. We can easily see the IP addresses and user information.
• For example, if you want to find out what people are using Android Tablets for across a school district, you can click on a slice in the chart for Operating Systems and add the specific Android devices to the filter.
8. When you click Apply Filter, the chart will show only the Android information.
Instant Demo Guide Cisco dCloud
© 2019 Cisco and/or its affiliates. All rights reserved. This document is Cisco Public Information. Page 6 of 20
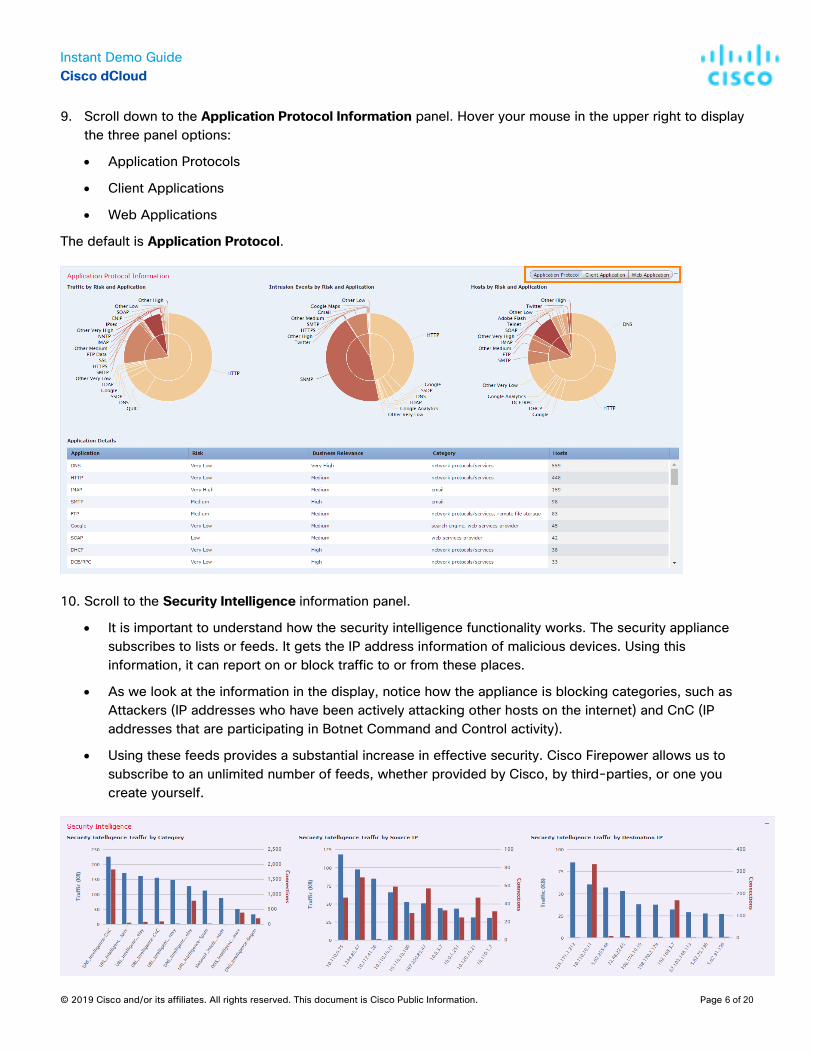
9. Scroll down to the Application Protocol Information panel. Hover your mouse in the upper right to display the three panel options:
• Application Protocols
• Client Applications
• Web Applications
The default is Application Protocol.
10. Scroll to the Security Intelligence information panel.
• It is important to understand how the security intelligence functionality works. The security appliance subscribes to lists or feeds. It gets the IP address information of malicious devices. Using this information, it can report on or block traffic to or from these places.
• As we look at the information in the display, notice how the appliance is blocking categories, such as Attackers (IP addresses who have been actively attacking other hosts on the internet) and CnC (IP addresses that are participating in Botnet Command and Control activity).
• Using these feeds provides a substantial increase in effective security. Cisco Firepower allows us to subscribe to an unlimited number of feeds, whether provided by Cisco, by third-parties, or one you create yourself.
Instant Demo Guide Cisco dCloud
© 2019 Cisco and/or its affiliates. All rights reserved. This document is Cisco Public Information. Page 7 of 20
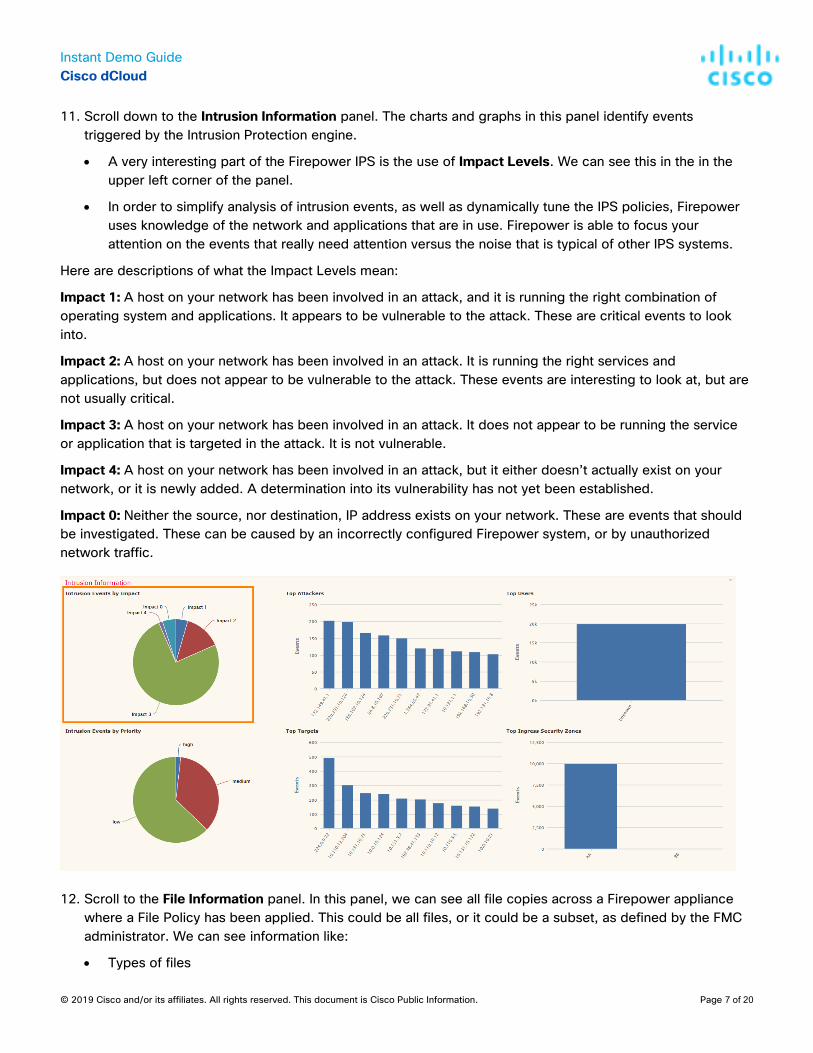
11. Scroll down to the Intrusion Information panel. The charts and graphs in this panel identify events triggered by the Intrusion Protection engine.
• A very interesting part of the Firepower IPS is the use of Impact Levels. We can see this in the in the upper left corner of the panel.
• In order to simplify analysis of intrusion events, as well as dynamically tune the IPS policies, Firepower uses knowledge of the network and applications that are in use. Firepower is able to focus your attention on the events that really need attention versus the noise that is typical of other IPS systems.
Here are descriptions of what the Impact Levels mean:
Impact 1: A host on your network has been involved in an attack, and it is running the right combination of operating system and applications. It appears to be vulnerable to the attack. These are critical events to look into.
Impact 2: A host on your network has been involved in an attack. It is running the right services and applications, but does not appear to be vulnerable to the attack. These events are interesting to look at, but are not usually critical.
Impact 3: A host on your network has been involved in an attack. It does not appear to be running the service or application that is targeted in the attack. It is not vulnerable.
Impact 4: A host on your network has been involved in an attack, but it either doesn’t actually exist on your network, or it is newly added. A determination into its vulnerability has not yet been established.
Impact 0: Neither the source, nor destination, IP address exists on your network. These are events that should be investigated. These can be caused by an incorrectly configured Firepower system, or by unauthorized network traffic.
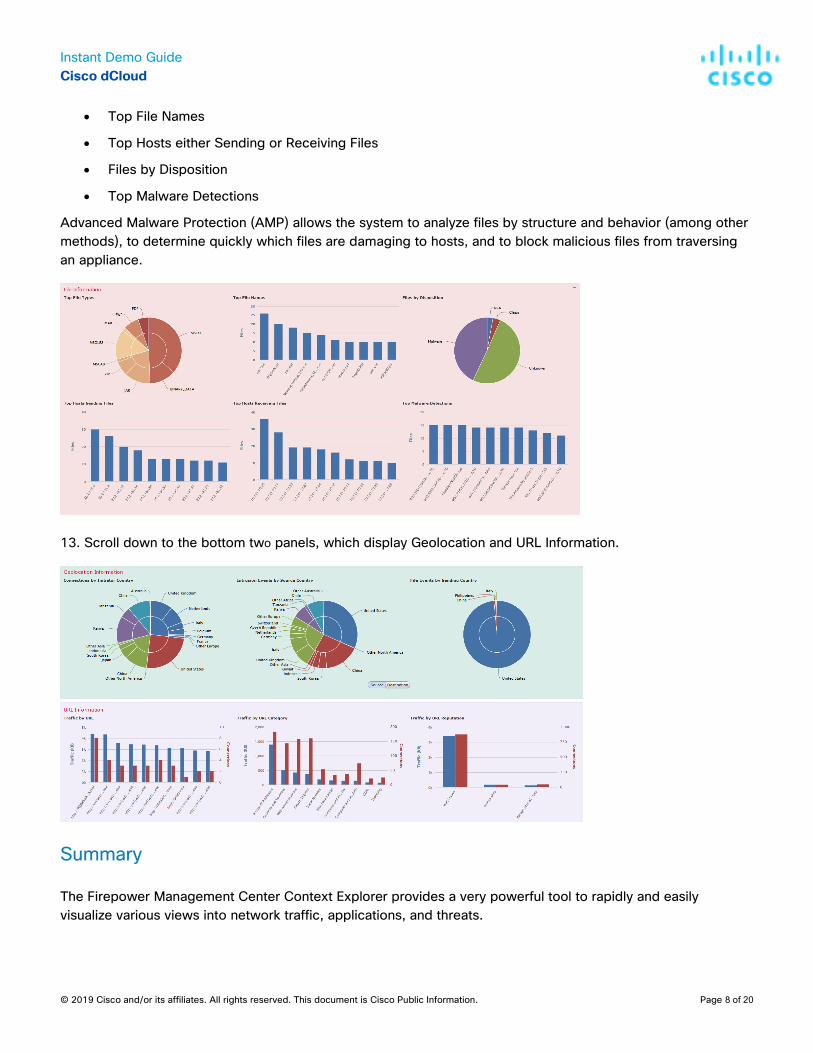
12. Scroll to the File Information panel. In this panel, we can see all file copies across a Firepower appliance where a File Policy has been applied. This could be all files, or it could be a subset, as defined by the FMC administrator. We can see information like:
• Types of files
Instant Demo Guide Cisco dCloud
© 2019 Cisco and/or its affiliates. All rights reserved. This document is Cisco Public Information. Page 8 of 20
• Top File Names
• Top Hosts either Sending or Receiving Files
• Files by Disposition
• Top Malware Detections
Advanced Malware Protection (AMP) allows the system to analyze files by structure and behavior (among other methods), to determine quickly which files are damaging to hosts, and to block malicious files from traversing an appliance.
13. Scroll down to the bottom two panels, which display Geolocation and URL Information.
Summary
The Firepower Management Center Context Explorer provides a very powerful tool to rapidly and easily visualize various views into network traffic, applications, and threats.
Instant Demo Guide Cisco dCloud
© 2019 Cisco and/or its affiliates. All rights reserved. This document is Cisco Public Information. Page 9 of 20
Scenario 2. Overview of Summary Dashboard
Value Proposition: Cisco Firepower provides many detailed Dashboards. These are all highly customizable, and the customer can add additional Dashboards to their system. These provide at-a-glance visibility into the areas of your network that you are interested in seeing. Since FMC is a multi-user system, with role-based access, each user with a login can determine which Dashboards provide the information they need to see, and this can be the landing page for them whenever they login. The Summary Dashboard is a great place to start, as it provides an overall view of the network and applications, and also provides a view into the threats that have been seen. This is the default landing page for new users.
Steps
1. Begin by clicking on Overview on the menu bar, and then select Dashboards > Summary Dashboard.
NOTE: In demo after login, by default it lands to Summary Dashboard page.
Instant Demo Guide Cisco dCloud
© 2019 Cisco and/or its affiliates. All rights reserved. This document is Cisco Public Information. Page 10 of 20
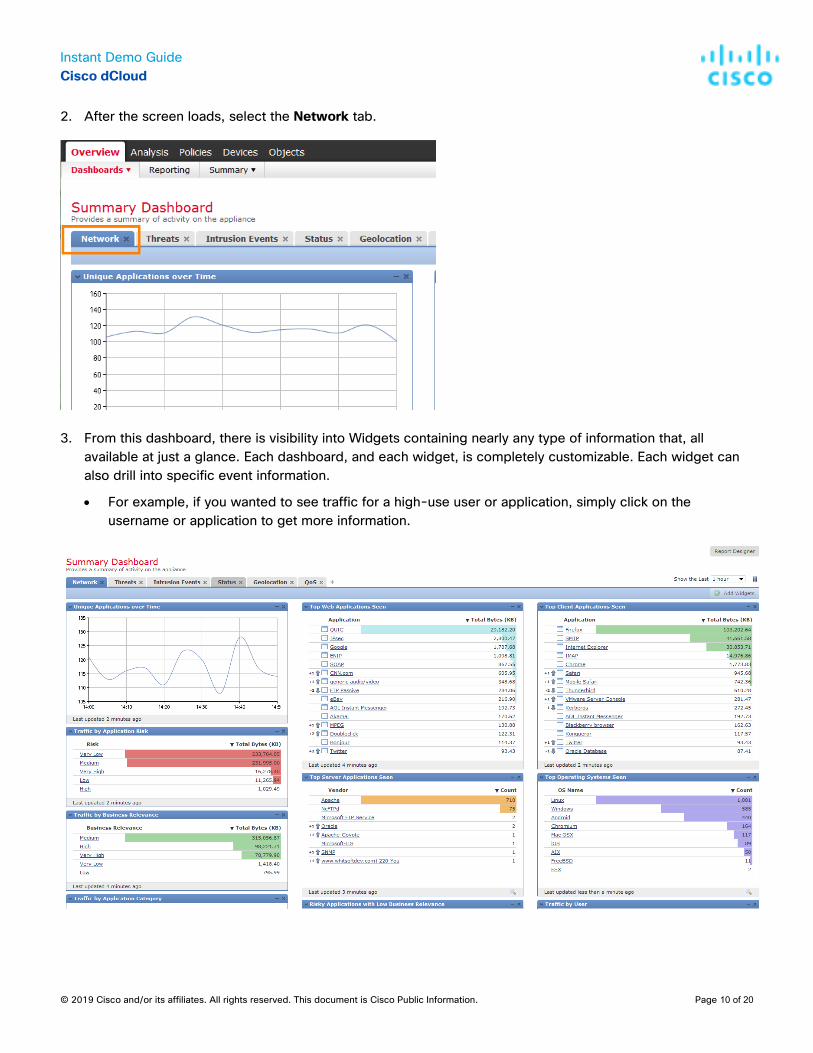
2. After the screen loads, select the Network tab.
3. From this dashboard, there is visibility into Widgets containing nearly any type of information that, all available at just a glance. Each dashboard, and each widget, is completely customizable. Each widget can also drill into specific event information.
• For example, if you wanted to see traffic for a high-use user or application, simply click on the username or application to get more information.
Instant Demo Guide Cisco dCloud
© 2019 Cisco and/or its affiliates. All rights reserved. This document is Cisco Public Information. Page 11 of 20
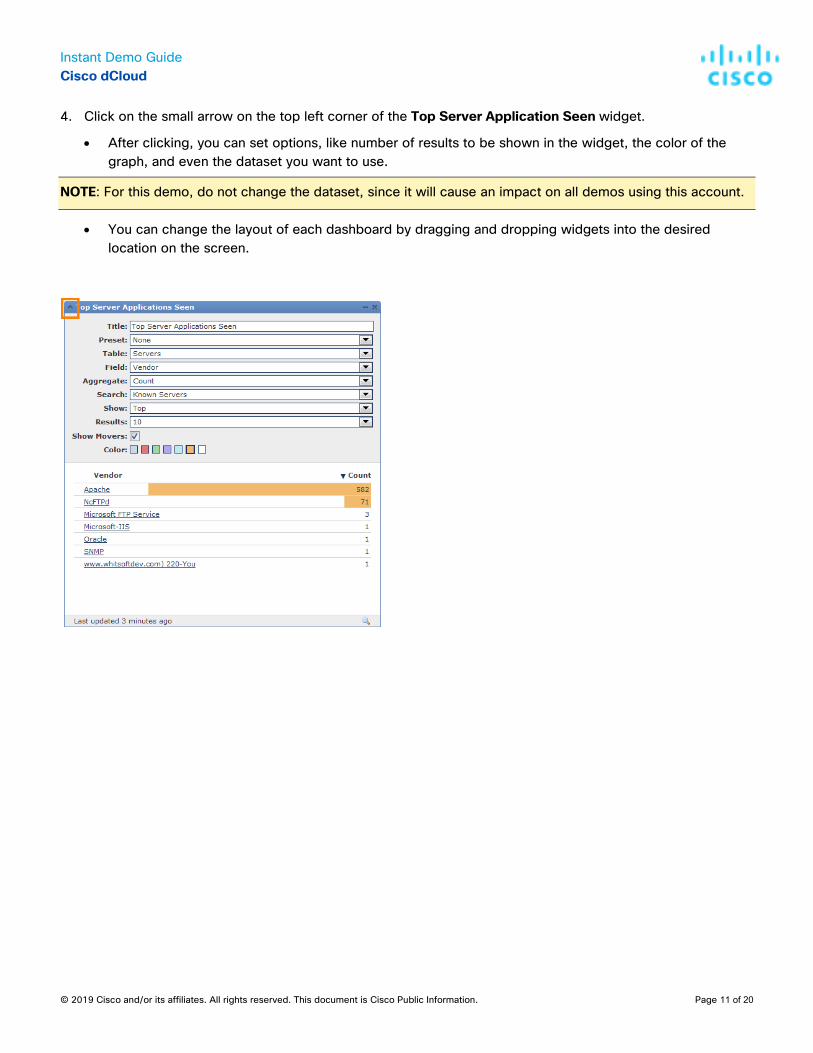
4. Click on the small arrow on the top left corner of the Top Server Application Seen widget.
• After clicking, you can set options, like number of results to be shown in the widget, the color of the graph, and even the dataset you want to use.
NOTE: For this demo, do not change the dataset, since it will cause an impact on all demos using this account.
• You can change the layout of each dashboard by dragging and dropping widgets into the desired location on the screen.
Instant Demo Guide Cisco dCloud
© 2019 Cisco and/or its affiliates. All rights reserved. This document is Cisco Public Information. Page 12 of 20
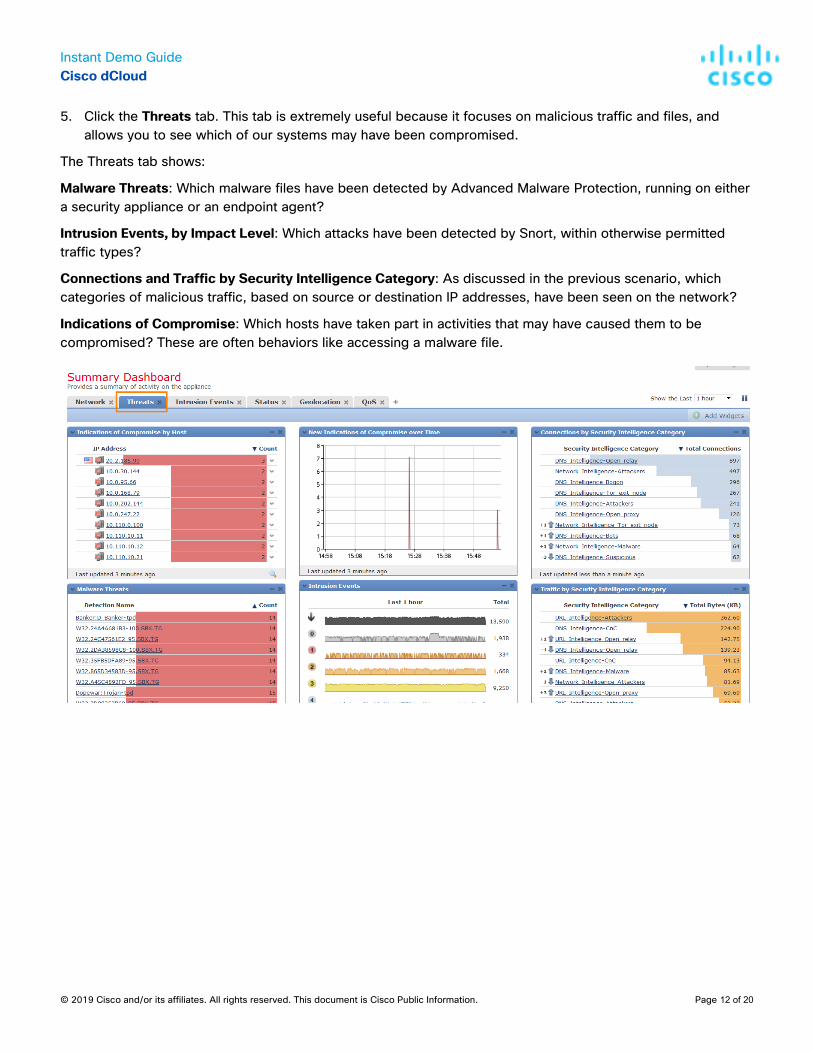
5. Click the Threats tab. This tab is extremely useful because it focuses on malicious traffic and files, and allows you to see which of our systems may have been compromised.
The Threats tab shows:
Malware Threats: Which malware files have been detected by Advanced Malware Protection, running on either a security appliance or an endpoint agent?
Intrusion Events, by Impact Level: Which attacks have been detected by Snort, within otherwise permitted traffic types?
Connections and Traffic by Security Intelligence Category: As discussed in the previous scenario, which categories of malicious traffic, based on source or destination IP addresses, have been seen on the network?
Indications of Compromise: Which hosts have taken part in activities that may have caused them to be compromised? These are often behaviors like accessing a malware file.
Instant Demo Guide Cisco dCloud
© 2019 Cisco and/or its affiliates. All rights reserved. This document is Cisco Public Information. Page 13 of 20
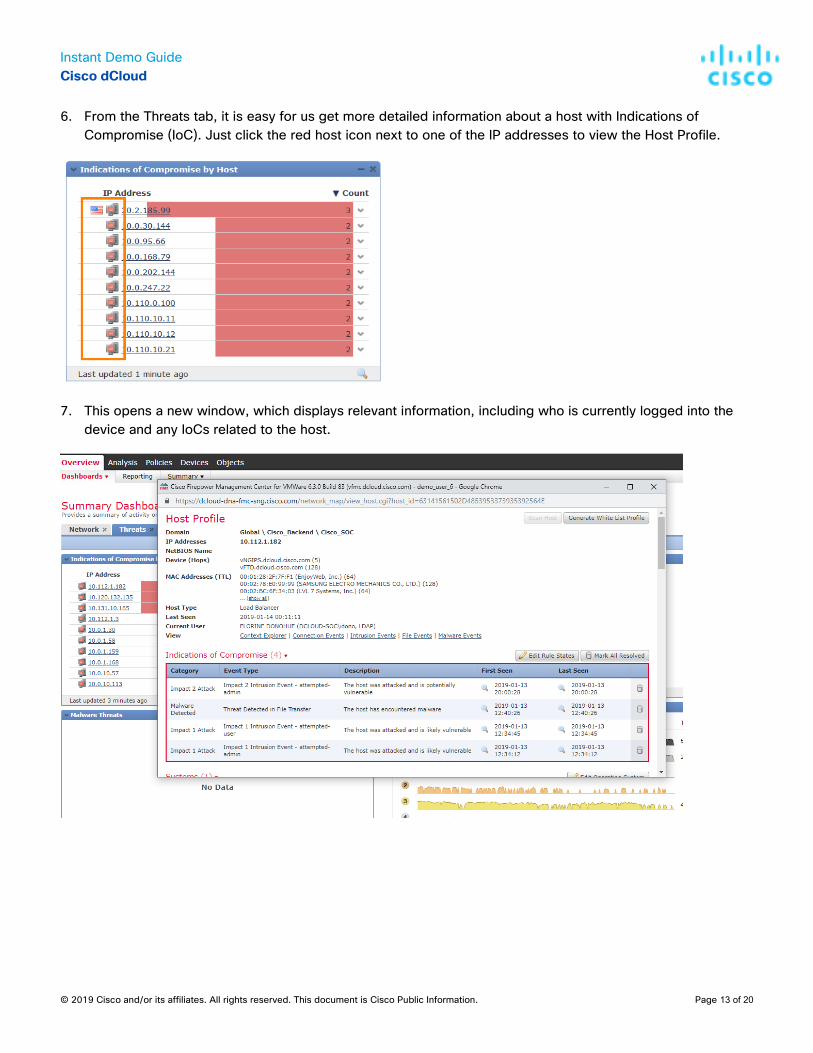
6. From the Threats tab, it is easy for us get more detailed information about a host with Indications of Compromise (IoC). Just click the red host icon next to one of the IP addresses to view the Host Profile.
7. This opens a new window, which displays relevant information, including who is currently logged into the device and any IoCs related to the host.

Instant Demo Guide Cisco dCloud
© 2019 Cisco and/or its affiliates. All rights reserved. This document is Cisco Public Information. Page 14 of 20
8. Scroll further down to see things like the operating system information, which applications are in use, and a history of which users have previously been logged into this device.
Summary
Cisco Firepower contains a powerful set of easy-to-use Dashboards, allowing the network or security administrator to fully understand the applications and threats running on their networks. The information displayed in the dashboards is available within the policy engines to enforce network policies, allowing the most powerful and accurate Next-Generation Security systems on the market today.
Instant Demo Guide Cisco dCloud
© 2019 Cisco and/or its affiliates. All rights reserved. This document is Cisco Public Information. Page 15 of 20
Scenario 3. Building a Next-Generation Firewall Policy
Value Proposition: The first two scenarios focused on visibility and reporting. This scenario shows how to enforce Next-Generation policies instead. A traditional security appliance is able to enforce traffic based on IP addresses, protocols, and ports. A Next-Generation security appliance has those same capabilities, but adds contextual information, as well. Cisco’s Next-Generation security appliances support policies based on many more attributes, including:
• Geolocation • VLAN • Username or Group within Active Directory • Application or Client Application • URL Category and Reputation • Security Group Tag • Network Device Type
In addition to traditional controls, such as permitting or blocking traffic, Cisco Next-Generation security policies also allow fine-tuned IPS policies, SSL decryption, and Advanced Malware Protection policies to be applied through the access controls.
Steps
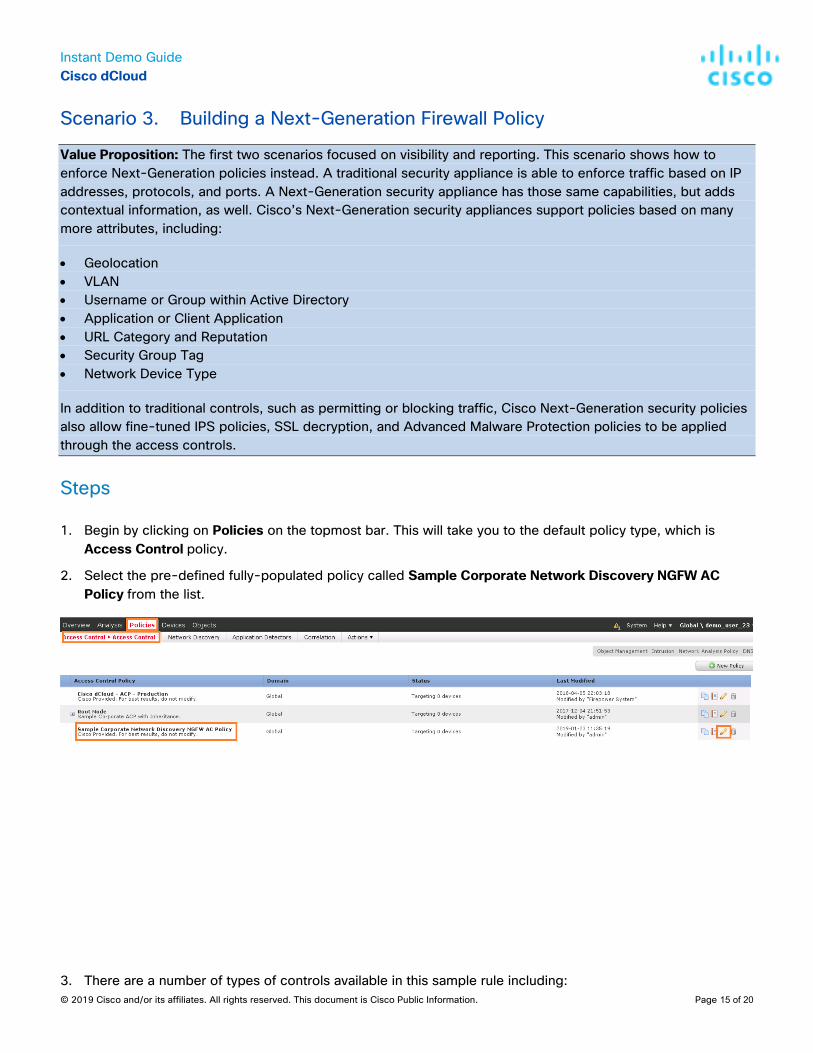
1. Begin by clicking on Policies on the topmost bar. This will take you to the default policy type, which is Access Control policy.
2. Select the pre-defined fully-populated policy called Sample Corporate Network Discovery NGFW AC Policy from the list.
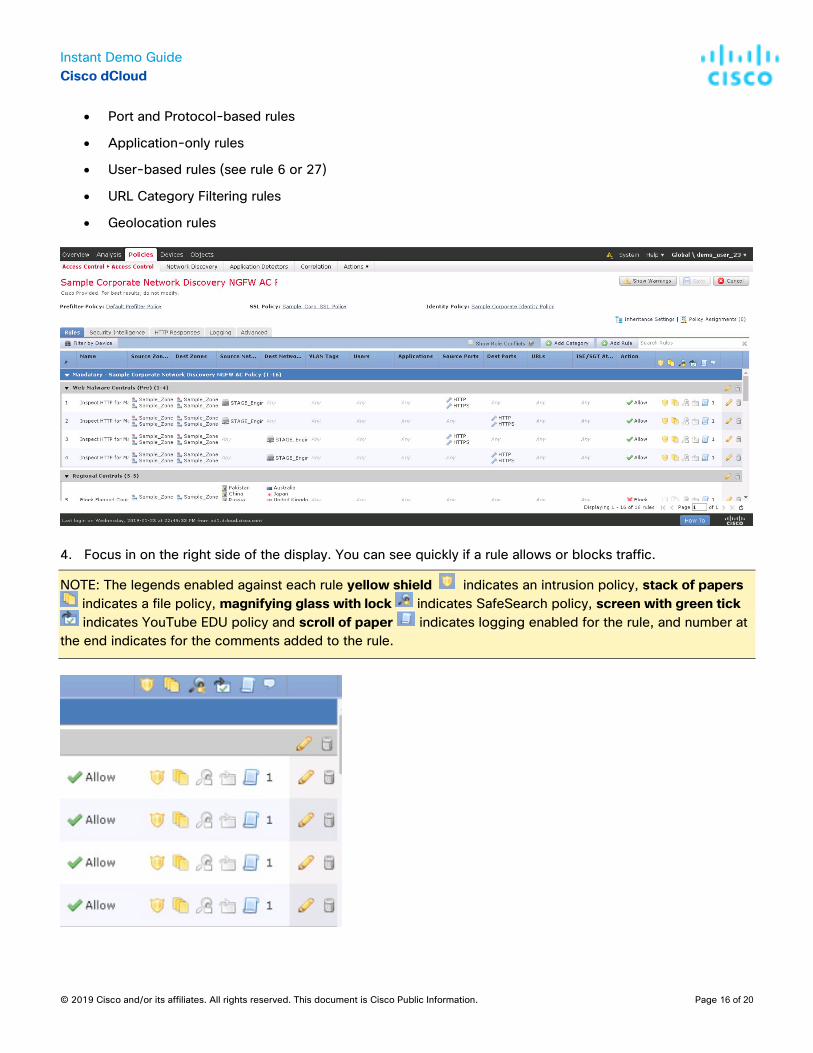
3. There are a number of types of controls available in this sample rule including:
Instant Demo Guide Cisco dCloud
© 2019 Cisco and/or its affiliates. All rights reserved. This document is Cisco Public Information. Page 16 of 20
• Port and Protocol-based rules
• Application-only rules
• User-based rules (see rule 6 or 27)
• URL Category Filtering rules
• Geolocation rules
4. Focus in on the right side of the display. You can see quickly if a rule allows or blocks traffic.
NOTE: The legends enabled against each rule yellow shield indicates an intrusion policy, stack of papers indicates a file policy, magnifying glass with lock indicates SafeSearch policy, screen with green tick indicates YouTube EDU policy and scroll of paper indicates logging enabled for the rule, and number at
the end indicates for the comments added to the rule.

Instant Demo Guide Cisco dCloud
© 2019 Cisco and/or its affiliates. All rights reserved. This document is Cisco Public Information. Page 17 of 20
NOTE: For new features SafeSearch and YouTube EDU access control policy reference, please see rule number 15 and 16. For official documentation reference visit here.
5. After looking at this policy, add a rule to it by clicking Add Rule at the right of the screen.
6. Name the rule block Facebook chat and set the action to Block.
7. Designate the new rule as an applications rule by selecting the Applications tab.
8. Enter Facebook in the Available Applications field. This filters the results to only show us types of Facebook applications.
Instant Demo Guide Cisco dCloud
© 2019 Cisco and/or its affiliates. All rights reserved. This document is Cisco Public Information. Page 18 of 20
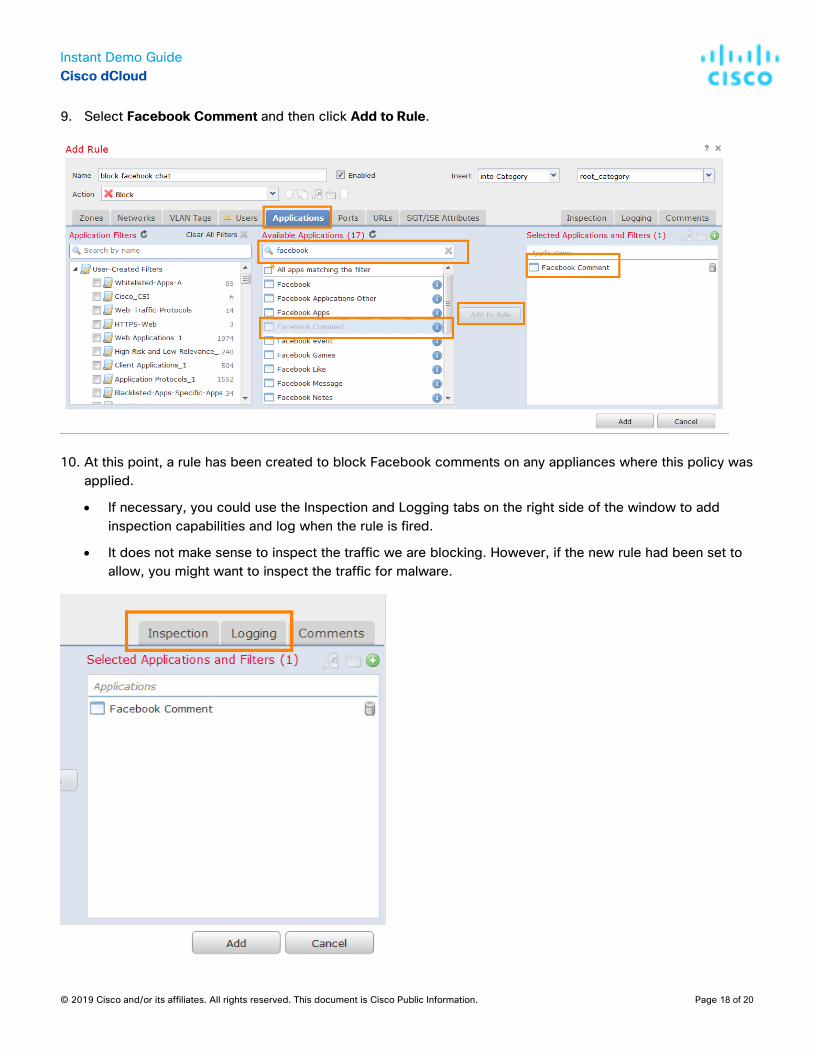
9. Select Facebook Comment and then click Add to Rule.
10. At this point, a rule has been created to block Facebook comments on any appliances where this policy was applied.
• If necessary, you could use the Inspection and Logging tabs on the right side of the window to add inspection capabilities and log when the rule is fired.
• It does not make sense to inspect the traffic we are blocking. However, if the new rule had been set to allow, you might want to inspect the traffic for malware.
Instant Demo Guide Cisco dCloud
© 2019 Cisco and/or its affiliates. All rights reserved. This document is Cisco Public Information. Page 19 of 20
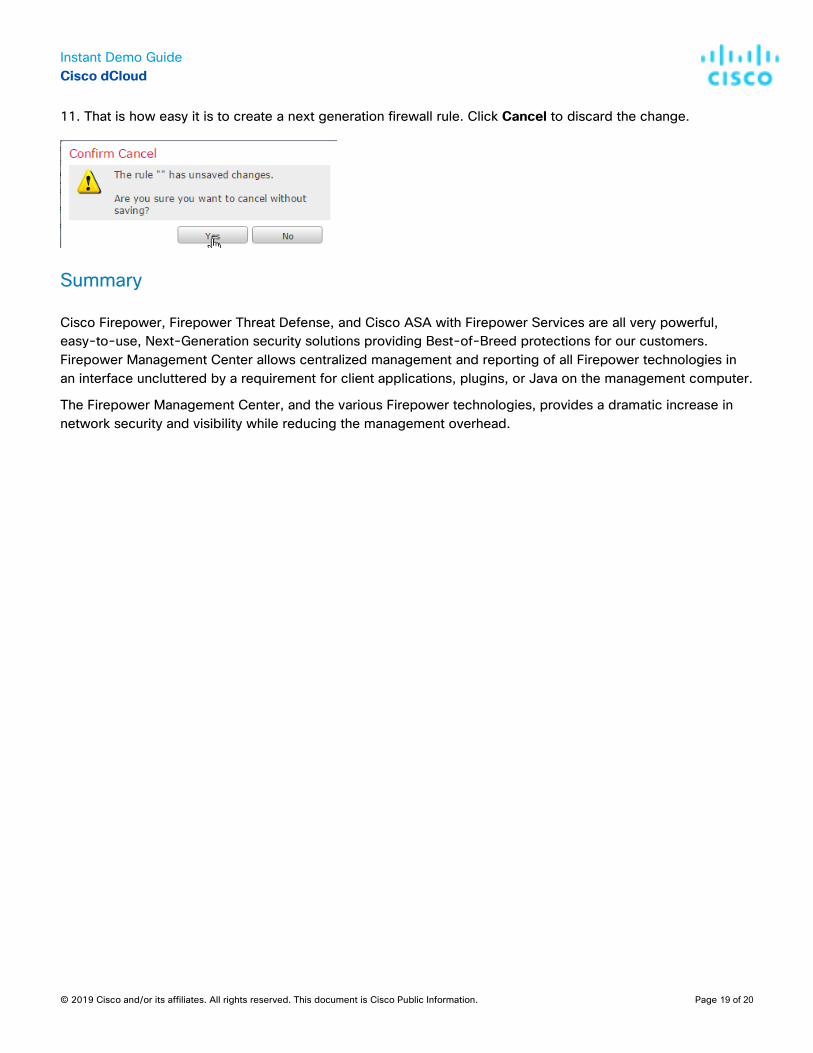
11. That is how easy it is to create a next generation firewall rule. Click Cancel to discard the change.
Summary
Cisco Firepower, Firepower Threat Defense, and Cisco ASA with Firepower Services are all very powerful, easy-to-use, Next-Generation security solutions providing Best-of-Breed protections for our customers. Firepower Management Center allows centralized management and reporting of all Firepower technologies in an interface uncluttered by a requirement for client applications, plugins, or Java on the management computer.
The Firepower Management Center, and the various Firepower technologies, provides a dramatic increase in network security and visibility while reducing the management overhead.
Instant Demo Guide Cisco dCloud
© 2019 Cisco and/or its affiliates. All rights reserved. This document is Cisco Public Information. Page 20 of 20
What’s Next?
Check out the related information to learn more about Firepower offerings.
Cisco Firepower Next-Generation Firewall 6.3 Basics Lab v2.4
Cisco Firepower Next-Generation Firewall 6.3 Advanced Lab v2.4
Cisco Firepower Management Center - Executive Summary for Cisco Sales
Cisco Firepower 6.4 FXOS Multi-Instance Lab v1.1