Embed Size (px)
Citation preview

MERGERS & ACQUISITIONS REVIEWREUTERS / Lucas Jackson
MERGERS & ACQUISITIONS REVIEWFINANCIAL ADVISORS
First Half 2016

Any New Zealand Involvement Announced (AD39)
Any New Zealand Involvement Completed (AF46)
Japan M&A
Americas Deals Intelligence
M&A Financial Advisory ReviewFirst Half 2016 | Mergers & Acquisitions | Financial Advisors
1
Japan Deals Intelligence
Any European Involvement Announced (AD21) 17
17
18
18
Global M&A
Global Deals Intelligence
Scorecard: Worldwide Announced M&A
Scorecard: Worldwide Completed M&A
Top Fifteen Worldwide Announced Deals
Any German Involvement Announced (AD35)
Americas M&A Any Spanish Involvement Completed (AF41)
Any UK Involvement Announced (AD32)
Any UK Involvement Completed (AF39)
Any European Involvement Completed (AF3) 10
12
12
Any French Involvement Announced (AD33)
Worldwide Completed (AF1)
Top Ten Japanese Involvement Announced Deals
19
Any French Involvement Completed (AF40)
Any Japanese Involvement Completed (AF23)
19
Any Spanish Involvement Announced (AD34)3
3
6
6
11
12
11
Worldwide Announced (AD1)
20
10
18
Any Japanese Involvement Announced (AD19)
2
2
Table of Contents
1
20
2
11
Fairness Opinion Rankings
Worldwide Announced Fairness Opinion
11
Any Americas Involvement Announced (AD49) 7
US Target Completed (AF2)
6
US Target Announced (AD2) 7
Any Americas Involvement Completed (AF55)
13
12
Any Italian Involvement Announced (AD36)
Any Nordic Involvement Announced (AD37)
Any Italian Involvement Completed (AF43)
20
20
Top Ten US Announced Deals20
15
Mergers & Acquisitions Criteria Summary
Any EMEA Involvement Announced (AD47)
European Deals Intelligence
Any Benelux Involvement Announced (AD40)
8
8
7
Any German Involvement Completed (AF42)
16
Any Canadian Involvement Completed (AF49)
Any Australian Involvement Completed (AF31)
10
9
Any Canadian Involvement Announced (AD42)
16
Any Asia (ex-Japan) Involvement Completed (AF32)
Any EMEA Involvement Completed (AF53)
Any Benelux Involvement Completed (AF47)
10
Any US Involvement Completed (AF48)
Top Ten Any Asia (ex-Japan) Involvement Announced Deals 15
7
8
9EMEA M&A
Any US Involvement Announced (AD41)
Any Japanese Announced Fairness Opinion13
Asia Pacific (ex-Japan) M&A
Asia Pacific (ex-Japan) Deals Intelligence
20
21
21
22
21
20
13
13
Regional Contacts
Criteria Summary
Any EMEA Announced Fairness Opinion
14
Any Asia Pacific Announced Fairness Opinion
8
16
16Any Australian Involvement Announced (AD24)
9
Top Ten European Involvement Announced Deals
Thomson Reuters Soultions for the Deal the Deal Making Community
Any Asia (ex-Japan) Involvement Announced (AD25)
20
15
Worldwide Announced Fairness Opinion
Any Americas Announced Fairness Opinion
Any USAnnounced Fairness Opinion
14
Any Nordic Involvement Completed (AF44)
https://www.thomsonone.com

WORLDWIDE DEAL MAKING FALLS 19%, AS MEGA DEALS SLOW - Worldwide M&A activity totaled US$1.6billion during the first quarter of 2016, a 19% decrease from comparable 2015 levels and the slowest opening sixmonth period for worldwide deal making in two years. Forty-eight deals with a value greater than $5 billion wereannounced during the first half, their combined value down 33% compared to the first half of 2015. Overall, 21,087worldwide deals were announced during the first half of 2016, a 5% decrease compared to last year.
DEAL MAKING UP 24% FROM FIRST QUARTER - The value of worldwide M&A announced during the secondquarter of 2016 totaled US$913.4 billion, an increase of 24% compared to the first quarter of last year.
UNITED STATES M&A FALLS 20%; ASIA PACIFIC DEALS DOWN 24% - M&A activity for United States targetstotaled US$708.9 billion during the first half of 2016, a decrease of 20% compared to the level of activity seenduring first half 2015. With US$441.3 billion in announced deals during the first half, Asia Pacific M&A fell 24%compared to a year ago. Asia Pacific targets account for 27% of worldwide M&A, compared to 21% for Europe.TECH, MATERIALS & INDUSTRIALS LEAD BALANCED SECTOR MIX - Deal making in the Technology sectortotaled US$233.2 billion during the first half of 2016, an increase of 2% compared to 2015 levels, while Materialsincreased 75% and Industrials deal making increased 23% compared to a year ago. Seven of 12 major industrysectors account for at least 10% of year-to-date M&A, the most balanced first half sector breakdown since recordsbegan in 1980.
Worldwide M&A Falls to 2-Year Low l Deals Over $5 billion Down 33% l Tech, Materials & Industrials Lead Balanced Sector Mix l Goldman Sachs Top Advisor
Global Deals Intelligence Worldwide Completed M&A by Region - Imputed Fees
First Half 2016 FINANCIAL ADVISORS
MERGERS & ACQUISITIONS REVIEW
$2
$3
$4
$5
Impu
ted
Fees
(US
$b)
Americas EMEA Asia Pacific Japan
RECORD OUTBOUND CHINA M&A POWERS CROSS-BORDER DEALS – Powered by a record level ofoutbound M&A from Chinese acquirors, cross-border M&A activity totaled US$595.1 billion during the first half of2016, accounting for 36% of overall M&A volume and an 6% decrease over 2015 levels. Cross border M&Aaccounted for 31% of total M&A activity during the first half of 2015.
COMPLETED M&A ADVISORY FEES DOWN 13% - According to estimates from Thomson Reuters/FreemanConsulting, M&A advisory fees from completed transactions totaled US$13.2 billion during the first half of 2016, a13% decrease from the comparable period in 2015 and the slowest opening quarter for advisory fees since 2014.
Worldwide Cross Border Volume Worldwide Announced Buyside Financial Sponsor Activity
$203.1
$78.5$16.0 $32.3 $65.8 $63.0
$117.1 $148.8 $163.7$73.6
$318.2
$82.6
$24.7$60.2
$87.7 $79.9
$79.6
$118.9$136.2
$140.6
$163.2
$57.7
$35.8
$73.7
$70.5 $99.7$82.1
$136.2$172.9
$113.8
$35.8
$52.7
$100.7
$106.6 $99.4$110.7
$118.1
$233.1
22.5%
9.2%
5.6%
11.1%
13.0%
12.5%15.1%
12.1% 11.5%
15.4%
0%
5%
10%
15%
20%
25%
$0
$100
$200
$300
$400
$500
$600
$700
$800
$900
2007 2008 2009 2010 2011 2012 2013 2014 2015 2016
% o
f Glo
bal M
&A
Ran
k Va
lue
(US
$b)
Q4 Volume (US$b) Q3 Volume (US$b) Q2 Volume (US$b) Q1 Volume (US$b) % of YTD Global M&A
$0
$1
2Q11 3Q11 4Q11 1Q12 2Q12 3Q12 4Q12 1Q13 2Q13 3Q13 4Q13 1Q14 2Q14 3Q14 4Q14 1Q15 2Q15 3Q15 4Q15 1Q16 2Q16
$405.6$258.1
$113.4 $175.6 $235.4 $172.5 $132.2$239.8 $287.3 $313.6
$640.6
$364.6
$111.5$204.0
$247.2$272.2
$167.8
$381.4 $342.2 $281.5
$371.3
$326.0
$146.9
$272.3$204.3 $202.8
$178.4
$313.2$424.8
$430.9
$154.2
$166.0
$261.5 $197.9 $252.2
$221.4
$305.3
$479.6
45.3%
40.5%
25.2%
37.6%36.5%
42.4%
31.8%
38.8%
28.8%
30.8%
0%
5%
10%
15%
20%
25%
30%
35%
40%
45%
50%
$0
$200
$400
$600
$800
$1,000
$1,200
$1,400
$1,600
$1,800
$2,000
% o
f Glo
bal M
&A
Ran
k Va
lue
(US
$b)
Q4 Volume (US$b) Q3 Volume (US$b)
Q2 Volume (US$b) Q1 Volume (US$b)
% of YTD Global M&A
https://www.thomsonone.com Visit http://dmi.thomsonreuters.com to view archives and order custom League Tables
2007 2008 2009 2010 2011 2012 2013 2014 2015 20162007 2008 2009 2010 2011 2012 2013 2014 2015 2016
1

Western Europe
Mergers & Acquisitions
Jan 1 - June 30 Scorecard: Worldwide Completed M&A Jan 1 - June 30
First Half 2016 | Mergers & Acquisitions | Financial Advisors
1/1/2016 - 06/30/2016
2,145.0
441 339 0
Worldwide5,876
No. Deals
No. Deals
Rank Val US$m
1,556,219.9
1/1/2016 - 06/30/2016 1/1/2015 - 06/30/2015
883,126.1
8,743.158108
783,407.4
9,636.7
971,468.9
Target Region/Nation
Mexico
401,012.363,689.5
236
15,486.6
9,431.1
884,744.3
13,766.8
934,447.4
Rank Val US$m
49,703.1United States
Caribbean
2,694.9
Brazil
Worldwide 21,0871,648,362.2
1,180Switzerland
North America
336,163.8
United Kingdom
Chile 9,573.6
Asia Pacific
France
700
Middle East
10,939.8Sub-Saharan Africa
Canada
Western Europe16,093.5
352,257.3
29,306.4
41456
60,474.7176
1,268
15,027.1
Americas1,935.5
6 062
72
5,336
Central America
South America37,467.2
1,682
708,895.7
54
746,362.9
31,982.9
4,636
615.2583 033 6 5 976
8,025.124 3
26,260.2234
Europe
81
Africa/Middle East
1,031.7289
637
424,668.3
North AfricaMiddle East
-17.17,313335
14,209.81,155.5
10,139.7 7.9
165
Eastern Europe
1,365
7,604
54,510.9195,632.6
57,399.0
6,0095,63123,655.9
▲
▼
234
-16.2
12.0
1,595
71
1,337-69.1
▲
▼United Kingdom16.8
▼-32.0Europe
30,398.0France▼
318,882.2
▼Italy▲
Eastern Europe
181,338.81,155
Asia Pacific22,450.5
273 680 9
941
28 7
15,744.2
3433 130
1,355
9,485.9 316383 807 7
5,300
3 333
367,869.6
▼10.8
▼
4,498
383,613.8
136.7
5,853▲
1,235
6,658
48233
94,784.0
1,358
9.8
33,762.8
380
336,322.7 -12.317,440.5
197
3,486.0
31,405.2
68
479
896.113,545.0
▲Sub-Saharan AfricaNorth Africa
-20.2
152 11,726.3
177▲ 139
▲
12,876.4
10,809.5664
Brazil11.6 ▲ 24,639.1
9.0Africa/Middle East
768
4,745.160
-24.6 Canada 22,613.3▼27,654.5
Chile 16,988.4
▼
282
6,0905,322
▲600.6
1.5▲
▼
479 132.3
17,13214,921
Caribbean-85.8
▼
-19.9
-19.4-19.1
733,295.1 10.9
-15.69739
-4.25,889
9,844.212,220.813,618.0
2,037,110.8
Rank Val US$m
566,733
22,153
No. Deals
44812,965.1▼
64Central America▼
4,835▼
Americas
-69.2 Mexico765,712.7
83-20.1 4,399
▼5,356
1,490,957.8
Rank Val US$m
% Change in Rank Value
South America
3,907
328
-67.653
Target Region/Nation
North America
240
39,013.9
No. Deals
8,307.011,290.9
7,460.0 9,415.5
743,099.4
51
492United States 644,107.7
24,385.8
▼4,721
▼
-74.3▼▼▼
▲▼
2,458.439728,108.5
591.0
-21.5-80.5
49 ▲
-20.812.1
-42.0
-7.6
-1.6
▼
15.4635
1/1/2015 - 06/30/2015
683,121.6 ▲▲
▲▼
% Change in Rank Value
▼▼
Worldwide Announced M&A Target Industry by ValueScorecard: Worldwide Announced M&A
1,248▲
-10.091.3
-13.3 ▼
▲▼
14.1%
13.1%
12.6%
11.1% 10.8%
9.9%
9.9%
4.7%
4.2%4.0%
2.8%2.4%
South East Asia
United States / United States 12,634.2
Pending
441,339.0
Pending
878.9
Abbott Laboratories
Target (% Sought/Acquired)Rank Date Date Effective
Singapore
530
Intended
Australia
South Korea
1,199
29,707.8
40,165.0
5/23/2016
Asia-Pacific
7,919.0
44735,665.0
14,428.11,040
216
6,062
Pending
72.5548-52.0
Thailand
2,719
4/11/2016Pending China / China
2/17/2016Pending
Pending
6/13/2016
Pending
2/3/2016
1/25/2016
Pending5/3/2016
16,829.8
IMS Health Holdings Inc (100%)13,897.82/23/2016
United States / United StatesAnnaly Capital Management Inc
Pending
Deutsche Boerse AG
NorthStar Realty Finance Corp (100%)13,017.5
Apollo Global Management LLC
NorthStar Asset Mgmt Grp Inc
Microsoft Corp
Maanshan Dingtai Rare Earth &
Quintiles TransnationalGermany / United Kingdom
20,060.2France / France
St Jude Medical Inc (100%)
17,792.0
24,617.5
Shareholders
Netherlands / SwitzerlandMonsanto Co (100%)
United States / United StatesSF Holding (Group) Co Ltd (100%)
London Stock Exchange Grp PLC (100%)
Johnson Controls Inc (100%)
14,514.5
SACAM Mutualisation
25,344.1
▼586
Hatteras Financial Corp (100%)
31,679.9
5/23/2016
Syngenta AG (100%)30,466.327,700.7
Germany / United States
Tyco International PLC
▲
Danaher Corp-Industrial Growth (100%)
Boehringer Ingelheim-CHC Bus
61,738.5CNAC Saturn (NL) BV
773
Ireland-Rep / United States
Credit Agricole-Regional Banks (25%)
United States / United States
United States / United StatesHershey Co (100%)
Pending
21,913.8South AsiaCentral Asia 96.2
Pending
4/28/2016
6/13/2016
28,346.8
▲
Australasia
2,731664
299,542.6
552
1,558.9 New Zealand▲
South Asia 28,346.8
-9.0
▲
North Asia
23,264.2ChinaHong Kong
8,850.9
217,076.4
30,132.4
▲
100,484.01,133
59
77
86 Thailand
▲
▼
-37.8
202867
15,854.9
159.173
North AsiaChina 284,364.2
343,595.2
27,967.8
1,176
12,700.5
494,017.7
1,724.4
3,911116
3,940
33
58,249.4750
▲57.1
42,052.1Japan24
▼
Top Fifteen Worldwide Announced Deals
2,647.9Japan
2,168.2
583,033.6 5,976
555
265.2
52.4
47,748.7
26,360.5
650-24.3
South East Asia
-28.617,031.1
▼Australasia
▼19,463.7
586502,384.1
307
Asia-Pacific 273,680.9360▼49,954.9
46,596.5
Central Asia43,350.0
21
Rank Value (US$m)Acquiror
Australia
583
▼
32.7
▼-5.1-30.4 ▼
79.924,098.221
285,825.4
-76.8-5.9
723
136 -39.3
167
-97.8
1,8561,835
Singapore7,034.9
166
169,970.1▼
6.2159,993.2
14,582.8
1921,132
42.3-24.1
-5.930,132.4 583
-28.7
494,943.0
49,927.7
3,130
62948.2
383,807.752,907.1
3,333
-65.9417492 -63.2
▲
▼
Jan 1 - June 30 2016
Mondelez International Inc
Pending
6/30/2016
6/3/2016United States / United States
Bayer AGAcquiror / Target Nation
LinkedIn Corp (100%)United States / United States
Industrials / Machinery
Financials / Banks
Consumer Staples / Food and Beverage
Real Estate / REITs
Industrials / Other Industrials
High Technology / E-commerce / B2B
Industrials / Transportation & Infrastructure
Healthcare / Pharmaceuticals
151.4
▼▼
▼▲▼
▼▲
Target Macro / Mid Industry
4,038.8New Zealand
The ADT Corp (100%)6/27/20162/16/2016
Pending5/2/2016
Sanofi SA-Animal Health Bus (100%) Germany / FranceUnited States / United States
12,581.412,269.4 Consumer Products and Services / Professional Services
Materials / ChemicalsMaterials / Chemicals
Healthcare / Healthcare Equipment & Supplies
Financials / BrokerageHigh Technology / Computers & Peripherals
Real Estate / REITs
High Technology Materials Industrials
Energy and Power Real Estate Healthcare
Financials Consumer Staples Consumer Products and Services
Media and Entertainment Retail Telecommunications
Government and Agencies
Visit http://dmi.thomsonreuters.com to view archives and order custom League Tables https://www.thomsonone.com
2

Lazard
Guggenheim Securities LLCCenterview Partners LLC 20
61,738.567,716.5
3.2
▲86,661.7 5.3
2 948 314 2
4.14.7
3.556,905.453,456.7
6.3-2.2
7814
103,144.7
3.6
N+1
14
UBS6
1611
19
17
CITICHSBC Holdings PLC
351
12
15
78
10
-
9
-42
2.3
2
157,115.8RothschildBarclays 6
+60.8
-25
▲
Worldwide Announced (AD1)
▲6.0
▼
-8.18.8
2Morgan Stanley1
Morgan StanleyGoldman Sachs & Co
▼
1.8
▲▼
▼21.1
-5.8
6.3
172,229.7 10.511
4
Citi235,542.90.5
14.314.4
443,404.1
13 87,675.313
298,214.4
412.0
3.8
-6.8
▼
-2.315
3.11
▲
11+1
0.1 -50.0
32
▲▼
2 9▼▲
▲3.8
0.2
0.2-190.342 0.0
18 ▼40 134 506 6 29 1 0 2 0 0▲ Societe Generale ▲1 8+19-8 -1.3175.636,389.3 -1.52.4 ▼
▼▼
52▼20
+19▲0.3
2 317
81,009.7
2.520
Jefferies LLC
21
19 37,424.4RBC Capital Markets
207.1-230.4
▼0.453
0.0
▲1.6
41.7 ▲1.1 0.4
6▲ 0.0
61.50 0.2
▲0.10.3
+4-
▲▲
▲ 0.5
144.1▲ 5.4 1
6618▲ BNP Paribas SA 3.044,680.4 ▲
▲4.817
85,982.86.3
Robey Warshaw LLP
▲16 5.8
50
19108,551.7 -1.714
13
▼ 15
Evercore Partners
LionTree Advisors LLCUBS 7.3
97,786.3 6.69
73Allen & Co Inc
8.9133,319.4275.9297.10.4 ▼
0.5 ▲71▼
5.9
84▼
0.40.5
52.1
-6-5 ▲
0.8 ▲
0.0 ▲
0.50.2
+20.5
▲
67.7
0.117
▲▲
550.1138,977.5
44 9.5
2.3▼
0.91.63.09.3
▲
12.58.8
-1.9▲
0.411
▼ ▼
▼211.8-2+3 114.3
0.87.8
▼-9 3.1
230.757 -53
▲368.8431.4 0.1402.9
-3.515.3
▲
▲2.0
-28
▲▼ 0.613.9 139▼ Lazard ▼▲ 111
207,313.3▲ 0.9
1.0305,978.93.2▲ -37329,318.4 87
▼0.3▼
2.80.7 -10
▼▲
3.3
-9 452.40.50.0
▲718120.5116
8 235,651.6Barclays
397,666.5▼0.6
0.9 ▲2.3419.1
1.4
0.512.2
15.8
3 513,247.6 ▲
3.1▲
34.4
22.1939.5532.2
132 -10
▲
▼0.6
-37132 953.7
Sh (%)
# of Deals per Advisor
First Half 2016 | Mergers & Acquisitions | Financial Advisors
-62
Market2015 Rank
35.3
Fees135
US$m
-160.918.4
▲589,379.9Sh (%)Share Ch.
2 539.5
526,026.8▼ -
2.8
Market Rank Value Market2016 Rank
Rank Value per Advisor (US$m)
▼
MarketSh (%)
# of Deals per Advisor
42
US$m DealsShare Ch.26.9
345
▼-
0.7 JP MorganBank of America Merrill Lynch
-3.3
108
151
-9.9
99
-6.9
▲
83
▼148
0.6
-18
132
-2.9 0.5
0.5
0.1
▼
0 2
40Wells Fargo & Co
▼
Ducera Partners LLC
21
8.2
9.5
18
5.3
145,302.6
104,205.4
9
77,375.61629
RBC Capital Markets
Deutsche Bank
China International Capital Co
144,497.512134,861.2130,805.6
Evercore Partners
21
186,401.7
Market
Citi 8
3
Credit Suisse45
JP Morgan
# of
26.7
153▼
▲
▼94 0.4
1
0
8.8
18.1
7 10
5
0.8
3 236,562.7
Rank ValueFinancial Advisor
9311.9
1
Change in
Goldman Sachs & Co# of Deals-53
Jan 1 - June 30
0.7347,387.7 -4.4 0.7
2016 Rank
Rank Value per Advisor (US$m)
1 ▼Sh ($)
Jan 1 - June 30
Worldwide Rankings
2015 RankFinancial Advisor Deals
Imputed Fees (US$m)
0.1
Bank of America Merrill Lynch
-3.4
24
5.471 0.3+14+20
13
27 0.1▼0.2
+23
60.4
7980
▲
33
12
Deutsche Bank
+18 Centerview Partners LLC
▼Guggenheim Securities LLC
-13
37
228,578.279+11 Rothschild
▲12
141,481.110
▲
8
11-42
+17
▼
-28▲▲
7Credit Suisse
0.20.40.40.6
-2-9
▼1.27.3 ▲
# of DealsMarket Advisor
▼▼
# of
Worldwide Completed (AF1)
Market
1.8
3.4
7.1
0.74.0 0.0
96168
7.9
Market
1,190.8
Change in
0.9Share Ch.Sh (%)
9.1
* tie
Jan 1 - June 30 2016
77,337.5 35.8
15
Credit Suisse
1
5 15.532
183,745.1
Morgan Stanley
18.5Lazard42.5
JP Morgan
3208,327.9
110,874.3
38,513.3
Bank of America Merrill Lynch
Industry Total†24*
Goldman Sachs & Co
China Construction Bank 2.9
46,596.5Dyalco 46,596.5
2.8Industrial & Comm Bank ChinaLakeside Capital Advisers LLC
2.8
47,615.847,768.7
2.948,314.2N+1 35122122
-492.9
2.9+2
25▲0.0
329
23
3,128
1
Top WW Announced M&A Advisors by Target Industry
-19.1%
1
Mkt.
2.82.8
2.9
1.3▲▲
0.1
-4.2%
29,779.030,281.6
62
16▲
▲
100.01,490,957.8
+1▼
No. Deals
-1,0661,648,362.2
24.3% ▲
Rank
232425
233,227.0
▼
▲21,087
Share
Top Worldwide Announced M&A Advisors by Transaction Size (AD1)
0.9%
Perella Weinberg Partners LP
▲▲
Industry % Change from Same Period Last Year
Deloitte
Industry Total
PJT Partners LP39
22
-8.7%▲
0.0 +1 Greenhill & Co, LLC 29,600.136
▼
21
-12.9%▼
2.0 0.8 ▲1.61.1 ▲
2.0 ▲ 0.1
▼
+1 0.7-1
90.5
▼
▼ 59.0
-12.6%
13,163.4▲
-2,2110.1 0.2
▼▼
100.0
0.20.5
0.1▲▲
0.226.584
0.19 0.10.6-52 ▼
18
0.6-1
▼-4▼
0.132,345.334,506.6 -29.1 0.2
79.20.0
▼-2.22.2▲ Societe Generale ▲1.8+19 52 2.321
Goldman Sachs & CoMorgan Stanley
3
2
19
37.1
178,507.0
1
0.2
Jan 1 - June 30
7 27,687.8 3
10 41,364.127,921.8
Wells Fargo & Co
32,888.6Real Estate
68,082.9
Industry % Change from Same Period Last Year
216,307.7Materials
Energy and Power
▼
Lazard
51.3
1
32,225.4
2
CITIC
68,713.9
88,445.9
75,834.3
24*
35,317.1
Rank Val US$mHigh Technology
58,372.3Morgan Stanley
21
Industrials
Goldman Sachs & Co
Industry % Change from Last Quarter
-100.0
23 32-
1,720
57,124.2
8
Industry % Change from Last Quarter -3.6%
22
15.5
1,527
21 31.117.9
1,494 23.215.6
8
Goldman Sachs & CoBank of America Merrill Lynch
24
2,988
3
16
5
21
15.1
-1.6%-4.8%
13 35.12
25.0
1
0.0
31 29.5
▼
2.014
14,921
▼
268.15 211.51
154.63 163.43
94.51 92.71 62.74
95.18 71.37 80.68 74.21
101.0
74.1
51.4 26.5
32.7 51.8
32.6
50.1
26.5 26.5 56.6
27.7
27.7
27.7
30.5
46.6
46.6
46.6 46.6
61.7
61.7
61.7
61.7
$0
$50
$100
$150
$200
$250
$300
$350
$400
$450
$500
Goldman Sachs & Co
Morgan Stanley
Bank of America
Merrill Lynch
JP Morgan Credit Suisse Barclays Rothschild Citi UBS Lazard Deutsche Bank
Ran
k Va
lue
(US
$bil)
Monsanto Co/Bayer AG
Syngenta AG/CNAC Saturn NL BV
St Jude Medical Inc/Abbott Laboratories
Johnson Controls Inc/Tyco International
Hershey Co/Mondelez International
Other Top 15 Deals
All Other Transactions
Visit http://dmi.thomsonreuters.com to view archives and order custom League Tables https://www.thomsonone.com
3
Jan 1 - June 302016 UP
2016 DOWN 2015EMEAAmericas
Worldwide M&A Matrix
25.7x
Japan
11.1x
Asia ex. JapanEurope
15.0x
8.7x
20.5x
12.1x18.5x
21.1x
13.4x
15.8x
15.4x
Exit Multiple Matrix - Average Rank Value / EBITDA
Canada
First Half 2016 | Mergers & Acquisitions | Financial Advisors
15.3x
9.7x
USA
12.3x
15.3x 21.9x
12.7x
15.6x12.7x
Telecommunications
Real Estate
Media and Entertainment
Retail
12.6x
11.4x
9.0x
21.5x 18.7x
7.7x
12.9x
-
14.9x
31.4x
10.6x
5.5x
12.9x
8.8x
Industrials 13.2x13.8x
15.4x
20.6x 13.7x
World
11.2x 18.5x
15.8x
12.6x
22.9x
8.4x
11.9x
15.7x
UK
14.8x
14.7x
-
9.4x 15.1x10.2x
10.8x20.8x
11.5x 13.6x
8.7x
16.6x
12.1x
-
17.2x
4.7x
17.8x
4.7x9.5x
-
9.7x
27.5x 20.9x7.7x
23.9x14.5x 17.8x
15.9x15.9x
17.8x28.1x 9.9x
18.9x 15.8x
15.3x15.3x15.0x
6.2x
18.4x18.4x 9.9x
10.3x6.3x
15.4x
10.4x11.3x
12.1x 12.1x
11.2x
12.2x
13.1x
14.1x
11.2x
20.2x10.7x
15.9x15.0x 20.2x
16.9x
14.1x
15.8x
5.7x25.0x
18.2x10.5x
11.1x
13.3x 16.2x19.5x
13.7x 12.6x
12.3x12.9x
10.2x 16.0x
13.1x 13.6x
14.1x
12.2x
20.5x13.3x 12.6x
13.3x
25.7x19.8x
8.1x16.5x
8.3x
19.8x
14.9x18.4x 15.5x15.7x
21.1x -
18.4x
10.3x8.5x
6.2x
6.4x
6.7x
15.3x 6.1x
-11.8x4.0x
13.3x
12.9x 20.7x
-11.5x
14.4x
17.2x
15.0x
15.1x 18.9x
16.6x
18.2x
12.7x
20.5x
12.0x
12.8x 13.6x
9.4x
-
12.3x
22.1x9.4x10.5x 11.5x 11.2x
9.2x
25.5x20.3x
13.6x
26.7x
9.2x
12.7x 11.9x
9.0x
13.1x
11.1x
10.4x
Energy and Power
14.4x
Materials
12.5x
14.2x
16.2x
Healthcare
12.0x
High Technology
12.2x
14.8x
11.7x 10.7x
Consumer Staples
Consumer Products and Services
Bid Premium Matrix - Average Premium to 4 Week Stock Price Jan 1 - June 30
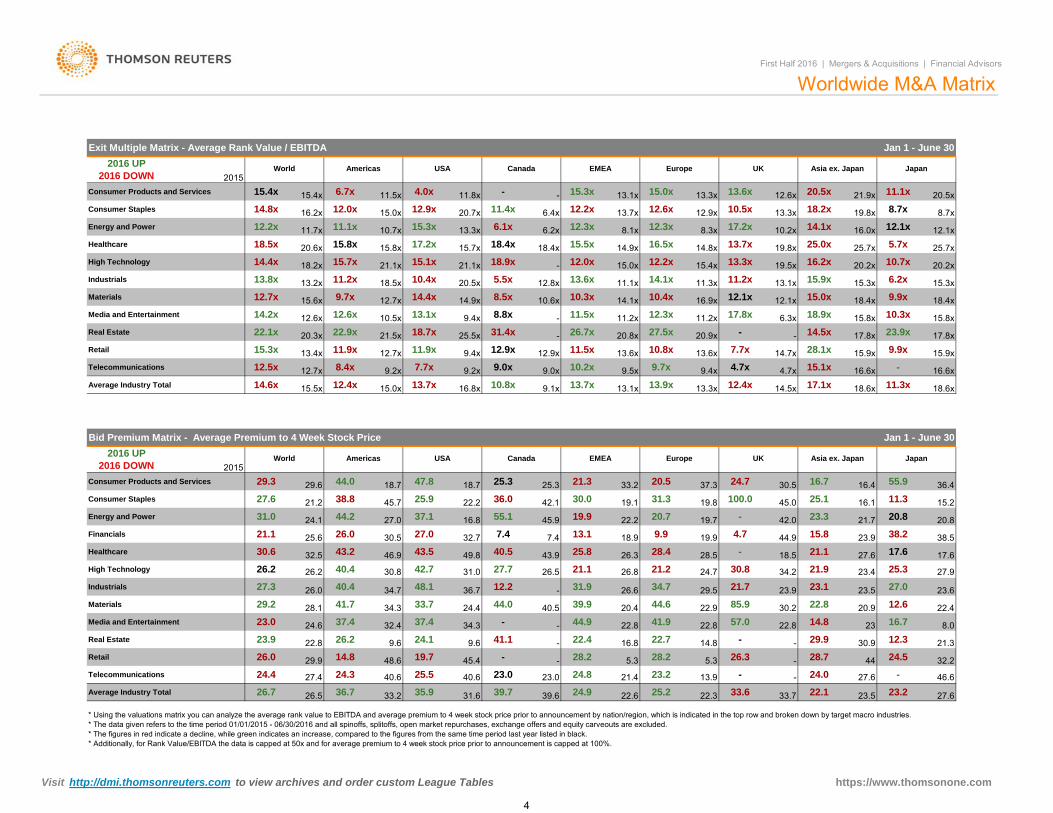
* Using the valuations matrix you can analyze the average rank value to EBITDA and average premium to 4 week stock price prior to announcement by nation/region, which is indicated in the top row and broken down by target macro industries. * The data given refers to the time period 01/01/2015 - 06/30/2016 and all spinoffs, splitoffs, open market repurchases, exchange offers and equity carveouts are excluded. * The figures in red indicate a decline, while green indicates an increase, compared to the figures from the same time period last year listed in black. * Additionally, for Rank Value/EBITDA the data is capped at 50x and for average premium to 4 week stock price prior to announcement is capped at 100%.
Consumer Staples
21.124.1
30.5
World
18.738.8
22.3
46.6
23.533.7 23.2
-24.0
27.6
- -
5.3
44.9
27.6
12.330.9
22.2
39.9
14.822.8
16.8
27.0
26.6
32.7
44.0
26.3
22.837.4
33.7
48.1
21.1
21.1
15.844.9
18.521.2
85.9 22.8
26.35.3
49.8
13.1
31.0 26.5
18.9
26.8
14.822.4
25.213.9
44
33.622.6 22.1
32.2
21.4 23.2
-24.528.7
-
29.9
Average Industry Total
9.6
22.822.7
31.9
24.1
29.5
2016 UP 2016 DOWN
32.424.6
32.5
Financials
41.7
25.334.2
29.3
15.0x
34.3 20.437.4
34.7
30.8
40.426.2
24.3
23.9
29.9
26.2
26.2
29.2
40.4
26.027.3
36.7
Media and Entertainment
28.1
Telecommunications 24.4
Materials
23.0
14.8
26.7
Retail
Energy and Power
25.6
Average Industry Total
30.6
22.8
High Technology
Industrials
27.4
26.0
26.5
Canada
27.6
Healthcare
Consumer Products and Services
46.9
29.6
45.731.0
21.2
43.2
44.2
44.0
43.5
26.027.0
Americas
18.7
37.1
36.0
USA
9.1x16.8x 10.8x
25.347.8
22.2
45.916.8
40.57.4
55.1
7.4
43.9
11.3x
55.9
17.6
21.7
17.6
38.2
20.8
27.6
38.523.9
20.8
13.1x 13.9x
30.5
16.1
20.5
11.3
Japan
25.1
Asia ex. Japan
23.3
37.3 16.424.7
42.0
16.7
15.2
21.3
25.8
42.1 31.3
4.719.99.919.7
28.5
19.1-19.9
100.0
30.8
-
20.719.8
Europe
13.3x
44.6
34.7
22.9
24.7
28.4
35.9
41.9
-
21.7
9.6
21.9
30.2
28.2-
40.640.6
41.1
39.7
19.748.6
23.1
24.939.6
28.2
23.9
-
-
36.7
24.4
-
34.3
12.6
23
42.7
-
27.7
12.2
-
23.4
16.757.0
23.6
36.4
22.4
27.0
20.9
25.5 24.8
23.5
40.5
45.4
14.5x12.4x 18.6x17.1x 18.6x
2015
25.9
15.5x
33.230.0
13.7x
EMEA
Real Estate 21.3
33.2 31.6
23.0 23.0
8.0
27.9
13.7x
45.0
UK
25.3
12.4x14.6x
Visit http://dmi.thomsonreuters.com to view archives and order custom League Tables https://www.thomsonone.com
4

First Half 2016 | Mergers & Acquisitions | Financial Advisors
Worldwide Announced Rankings* - A Decade in Review
1
2
3
4
1
2
3
4
Goldman Sachs & Co
Morgan Stanley
Bank of America Merrill Lynch
JP Morgan
* League Table positions reflect consolidation within the banking sector. Rankings shown are as of the current quarter end in each calendar year
5
6
7
8
9
102007 2008 2009 2010 2011 2012 2013 2014 2015 2016
5
6
7
8
9
10
Ran
k
Credit Suisse
Barclays
Rothschild
Citi
UBS
Lazard
Visit http://dmi.thomsonreuters.com to view archives and order custom League Tables https://www.thomsonone.com
5
JP Morgan 25,171.1 3 33.1 5
306 42.9 4
Wells Fargo & Co 27,649.1 2 36.3 6 1
12 32.5
5 33.1
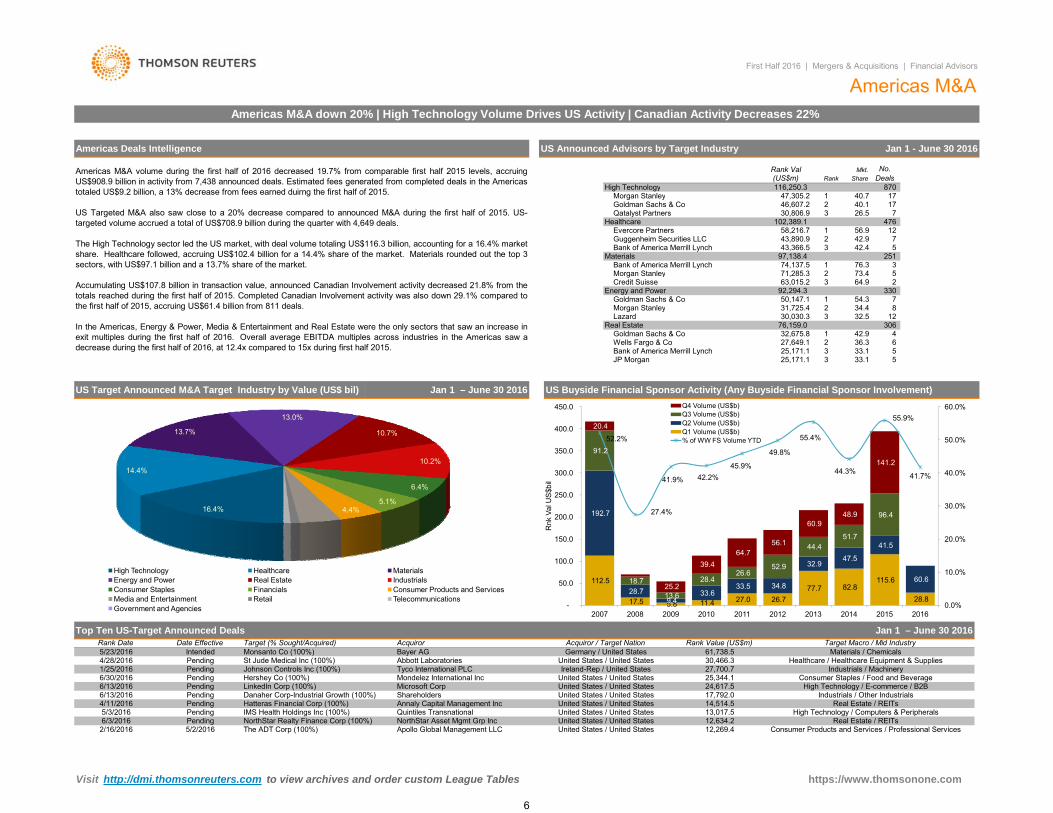
Americas M&A volume during the first half of 2016 decreased 19.7% from comparable first half 2015 levels, accruingUS$908.9 billion in activity from 7,438 announced deals. Estimated fees generated from completed deals in the Americastotaled US$9.2 billion, a 13% decrease from fees earned duirng the first half of 2015.
US Targeted M&A also saw close to a 20% decrease compared to announced M&A during the first half of 2015. US-targeted volume accrued a total of US$708.9 billion during the quarter with 4,649 deals.
The High Technology sector led the US market, with deal volume totaling US$116.3 billion, accounting for a 16.4% market share. Healthcare followed, accruing US$102.4 billion for a 14.4% share of the market. Materials rounded out the top 3sectors, with US$97.1 billion and a 13.7% share of the market.
Accumulating US$107.8 billion in transaction value, announced Canadian Involvement activity decreased 21.8% from thetotals reached during the first half of 2015. Completed Canadian Involvement activity was also down 29.1% compared tothe first half of 2015, accruing US$61.4 billion from 811 deals.
In the Americas, Energy & Power, Media & Entertainment and Real Estate were the only sectors that saw an increase inexit multiples during the first half of 2016. Overall average EBITDA multiples across industries in the Americas saw adecrease during the first half of 2016, at 12.4x compared to 15x during first half 2015.
76.3
First Half 2016 | Mergers & Acquisitions | Financial Advisors
Americas M&A down 20% | High Technology Volume Drives US Activity | Canadian Activity Decreases 22%
12
Americas M&A
17
476 56.9
31,725.430,030.3
1Goldman Sachs & Co92,294.3 50,147.1
Goldman Sachs & Co 32,675.8
Share
40.7
64.9373.4
26.5
3
3
54.38 2
3
2
34.4
330 7
5 3
17
7
251 42.442.92
5
Mkt.
870
No. Deals
40.17
Rank
12
74,137.571,285.363,015.2
12
1
30,806.9102,389.1
58,216.743,890.943,366.5
97,138.4
47,305.246,607.2Goldman Sachs & Co
Qatalyst Partners
Morgan StanleyCredit Suisse
Evercore PartnersGuggenheim Securities LLCBank of America Merrill Lynch
Bank of America Merrill Lynch
Americas Deals Intelligence
High Technology
Healthcare
Materials
Energy and Power
Real Estate
Morgan Stanley
Morgan Stanley
Bank of America Merrill Lynch 25,171.1 3
76,159.0
US Announced Advisors by Target Industry Jan 1 - June 30 2016
Lazard
Rank Val (US$m)116,250.3
US Buyside Financial Sponsor Activity (Any Buyside Financial Sponsor Involvement)
Consumer Products and Services / Professional Services
Real Estate / REITsHigh Technology / Computers & Peripherals
Real Estate / REITs
Industrials / MachineryConsumer Staples / Food and Beverage
30,466.327,700.725,344.1
United States / United States
6/13/2016
Bayer AG
ShareholdersDanaher Corp-Industrial Growth (100%)
Materials / ChemicalsHealthcare / Healthcare Equipment & Supplies
5/3/2016
12,269.4
Pending
2/16/2016
IMS Health Holdings Inc (100%)
Apollo Global Management LLC
Germany / United States
5/2/2016 The ADT Corp (100%)
Pending14,514.5
NorthStar Asset Mgmt Grp Inc 12,634.2
24,617.5 High Technology / E-commerce / B2B
United States / United StatesQuintiles TransnationalAnnaly Capital Management Inc
United States / United States13,017.5
Industrials / Other IndustrialsUnited States / United States
United States / United StatesMondelez International IncUnited States / United States
United States / United States
6/30/2016Pending
Pending
Microsoft Corp6/13/2016
Hatteras Financial Corp (100%)17,792.0
4/11/2016
LinkedIn Corp (100%)
Pending NorthStar Realty Finance Corp (100%)
4/28/2016
Date Effective
1/25/2016 Johnson Controls Inc (100%)
Intended Monsanto Co (100%)5/23/2016Rank Date
PendingHershey Co (100%)Pending
6/3/2016
Rank Value (US$m)
Pending61,738.5
Tyco International PLCUnited States / United StatesIreland-Rep / United States
St Jude Medical Inc (100%) Abbott Laboratories
Target (% Sought/Acquired) Acquiror Target Macro / Mid IndustryAcquiror / Target NationTop Ten US-Target Announced Deals Jan 1 – June 30 2016
Jan 1 – June 30 2016US Target Announced M&A Target Industry by Value (US$ bil)
16.4%
14.4%
13.7%
13.0%
10.7%
10.2%
6.4%
5.1%4.4%
High Technology Healthcare MaterialsEnergy and Power Real Estate IndustrialsConsumer Staples Financials Consumer Products and ServicesMedia and Entertainment Retail TelecommunicationsGovernment and Agencies
112.5
17.5 5.8 11.4 27.0 26.7 77.7 82.8
115.6
28.8
192.7
28.7 9.4
33.6 33.5 34.8
32.9 47.5
41.5
60.6
91.2
18.7
13.6
28.4 26.6
52.9
44.4 51.7
96.4
20.4
25.2
39.4 64.7
56.1
60.9 48.9
141.2
52.2%
27.4%
41.9% 42.2%45.9%
49.8%
55.4%
44.3%
55.9%
41.7%
0.0%
10.0%
20.0%
30.0%
40.0%
50.0%
60.0%
-
50.0
100.0
150.0
200.0
250.0
300.0
350.0
400.0
450.0
2007 2008 2009 2010 2011 2012 2013 2014 2015 2016
Rnk
Val
US$
bil
Q4 Volume (US$b)Q3 Volume (US$b)Q2 Volume (US$b)Q1 Volume (US$b)% of WW FS Volume YTD
Visit http://dmi.thomsonreuters.com to view archives and order custom League Tables https://www.thomsonone.com
6

Rothschild Centerview Partners LLC
▼1.6 -0.3 0.3 0.00.3 -3 ▼ 30.6 -0.8 ▲ 17 0.2 24 14,993.9Itau Unibanco 25 20-
CIBC World Markets Inc 25 31 17,035.9 1.92.2 1.9
-7 ▼65 19,958.2 0.1 0.0▼ 5.8▲ 17 0.3 -141.6 ▲ 17 0.2 Deloitte 24+5 ▲
▲Scotiabank 24 55 18,521.4 2.0
25 0.3 -3 ▼ 2.1 0.317 22,188.9 2.4 -1.1 0.8 -10 ▼ 192.0Jefferies LLC 231.8 0.70.7 +3 ▲ 160.4
▼ 47▲
BMO Capital Markets 23 18 18,574.6 2.0 -1.9 ▼▲ 44+7 ▲ Moelis & Co 22
0.8 0.727 22,823.715 26,881.9 0.3 -13
2.5 0.92.1▼
2.1 ▲-8 ▼
7 0.150 0.7
China International Capital Co 22 - 19,186.4
▲Jefferies LLC 21 25 23,933.2 2.6 0.8 ▲ ▼72.3
4 0.1 -2 ▼ ▲ 173.2 1.4Wells Fargo & Co 21Greenhill & Co, LLC 20
▼ 202.9 -1.825 29,271.0 0.3 +4 0.9 0.4▲ 82.8
3.2 2.5 0.6 0.30.2 +2 ▲ 59.0▲ 14 ▲Allen & Co Inc 20 14 25,142.5 2.8 -5.1 ▼
2.1 ▲ 28 0.4 40 29,779.0PJT Partners LP 19▲
Sandler O'Neill Partners 19 37 25,145.8 2.83.5 1.5
-8 ▼23 32,482.7 0.7 0.3▲ 60.6▲ 19 0.3 +22.1 ▲ 8 0.1 BNP Paribas SA 18-2 ▼
▲Qatalyst Partners 18 28 30,806.9 3.4
38 0.5 +14 ▲ 1.9 0.314 35,886.3 3.9 -1.4 0.6 -18 ▼ 172.0RBC Capital Markets 171.5 0.10.8 -10 ▼ 139.6
▼ 38▼
UBS 17 15 39,057.1 4.3 -2.7 ▼▲ 45-6 ▼ Rothschild 16
1.9 0.813 59,268.112 75,554.0 0.5 -2
6.4 1.05.9▼
-11.8 ▼-4 ▼
15 0.211 0.1
Centerview Partners LLC 16 7 53,456.7
▲Guggenheim Securities LLC 15 11 56,905.4 6.3 -4.1 ▼ ▲173.5
1 0.0 +1 ▲ ▲ 69.3 8.7UBS 15Allen & Co Inc 14
▲ 328.2 0.946 85,982.8 0.1 +4 0.7 0.2▲ 61.5
9.7 9.2 0.6 0.50.1 +1 ▲ 55.8▲ 4 ▲Ducera Partners LLC 14 - 61,738.5 6.8 6.8 ▲
2.1 ▲ 64 0.9 54 89,516.9LionTree Advisors LLC 13▼
RBC Capital Markets 13 16 62,101.6 6.811.8 -2.0
+17 ▲2.9 0.1▼ 267.8▼ 57 1.0 -12Lazard 12+12 ▲ 8 109,113.75.4 ▲ 39 0.5
-3.9 ▼ ▲Wells Fargo & Co 12 24 66,428.0 7.3
78 1.0 +1 ▲ 2.5 0.916 113,817.2 12.3 8.4 0.7 -2 ▼ 232.5Evercore Partners 112.3 0.20.3 0 - 211.8
▲ 44
1.3 0.7▲ 17 ▼
Lazard 11 8 88,582.2 9.8
0.2 +315.0 4.8
▲ 1115.3 14.190.7
-32 ▼ ▲ 114.310 138,977.529 141,481.1
6.3 ▲ 5243
10+7 ▲Guggenheim Securities LLC-1.3 ▼
10 19 90,825.8 10.0
▼Deutsche Bank 9 10 97,883.8 10.8 ▲0.6
▲ 3773 1.0 +23 ▲ Deutsche Bank 8 7 145,711.2 15.7 0.6 0.6 -28 163.222.4 5.2 3.4 0.10.9 -2351 ▲
Evercore Partners 8 13 100,671.1 11.1 1.8 0.8▼3.1 ▲-12.3 ▼11.6
26.2-14 ▼58 0.8 Barclays 7Citi 7 5 105,520.5
▲92 1.6 -13 8.56 207,715.8 ▼ 307.6▲
242,553.1JP Morgan 6 2 1.4▼ 774.80.9356.1 ▲1.4 +3 3.9
-9 ▼ ▼-7.6Credit Suisse 6 4 132,177.2 14.5107
-10.1 ▼ 64JP Morgan 1.39 266,190.9 28.7 17.5 0.8 -11 ▼50▲
3.50.9 -28 ▼ 319.7287,156.7 53▼▲ 82 ▲ 44.0
▲ Credit Suisse 54
▲▼ 8.0▲
5 3 132,209.5
0.4
14.6 -13.5Barclays 4 9 154,722.6Bank of America Merrill Lynch
▼0.3-33
31.0 8.0
88-12 ▼
369 0.9 3
1.2 ▼
+1817.0
1.12.5
1.1▲
Citi35.026.2 76Morgan Stanley 324,888.2
Bank of America Merrill Lynch5
215.2
353,046.3 -428.6 0.0▲ 661 -44
▼ 38.1 13.0Morgan Stanley3 6 237,818.8
Goldman Sachs & Co 1238,067.42 2
2016 Rank
2015 Rank
Change in
26.2 -1.9Goldman Sachs & Co▼102 1.4
-25 4.7▼1.3
Sh (%) Sh (%)Sh (%) # of Deals Fees
▲-12
93
# of
732.8
▼1 ▲42.3
Rank Value Market MarketShare Ch.
10.6
Rank Value per Advisor (US$m)
2.11 391,669.5 1.6 969.9
Jan 1 – June 30
Rank ValueShare Ch. Financial Advisor
Market
-32▲
MarketShare Ch.
# of
Jan 1 – June 30Any Americas Involvement Announced (AD49)
DealsUS$m
Americas Rankings
Rank Value per Advisor (US$m)2015 Rank
32.4294,826.9 3.6Sh (%) Sh (%)
Advisor
▼1.5
2016 RankFinancial Advisor
# of Deals per AdvisorMarket
# of DealsMarket Change in
Imputed Fees (US$m)
US$m
Any Americas Involvement Completed (AF55)
First Half 2016 | Mergers & Acquisitions | Financial Advisors
DealsMarketMarket
# of Deals per Advisor
†Note: Industry Totals include multiple competing bids for the same Target.
Rothschild Deutsche Bank
†Note: Industry Totals include multiple competing bids for the same Target.
Industry TotalMoelis & Co 25
▲
▲
12,199.2
Scotiabank 23
▼
27
87.0%-19.9%
▲24 48
708,895.7
▼
Industry Total
Industry % Change from Last Quarter ▲-8.1%
3,907
14.4%▼-8.6%▲
5.3%▼Industry % Change from Same Period Last Year
▲
13,548.2 7
-17.2%
100.0+4▼1.8-814
15.4% ▼
0.2 ▲▲ 1.1 0.572.56,835.7 100.0
0.1 ▲2.1 ▲ 3.15 0.1 -102.2
122Perella Weinberg Partners LP
24Deloitte▼2125
▲7 0.2 -2 ▼ 0.2 ▲0.7
1.047.4
0.1
0.1▼1.816,022.90.215,886.8 2.1
81.5
73 13,147.5-10China International Capital Co 22 Jefferies LLC0.1 +3
-0.1 ▼2.5
1.9 1.8-2.3 ▼
1922
Greenhill & Co, LLC 23▼
280.7- 15,357.7
-7▲ 4019,369.3 2.614
0.12.6▲ -243 0.9 21▼ 23Moelis & Co
-6 ▲▼ 0.5 ▲121.6
103.1▼1.81.53.3 -2.7 0.73.5 -6.2 -23 13 24,313.820
Sandler O'Neill Partners ▼ 18 0.52.7 0.9▲ 0.6 -6 1.0 ▼-2.7▼19 31 70.3▼25,145.8 3.6 Wells Fargo & Co0.3 +3
19 12 26,843.2 3.6 -11
+4 ▲▲
0.461.8 0.90.333 4.317
43,059.7 6.1
0.73.927.5
29 11 47.304.8
▲0.32.9 ▲ ▲- 0.40.1▲ 4
▲0.911 44,873.5 6.0▲▲5.4 0.4
1.8
▲34
3.531,988.9
58.350.4 -4 123.60.1
17 ▼4.3-5.2
-2.7 ▼UBS 150.985,707.8
▼Guggenheim Securities LLC 14 10 56,661.7 8.0 10.6 ▲
1.4▼ 2.40.9
0.7▲11.5Allen & Co Inc
13 89,185.6 ▼+3
RBC Capital Markets 15 19 47,612.1▲10 0.2▼ 14 32
-232955.8
165.912.0Lazard+2
74 ▲
13 - 61,738.5 1 -5.8▲0.0 +1▲14 9.1
8.7
Wells Fargo & Co0.6▼ LionTree Advisors LLCDeutsche Bank 12
Ducera Partners LLC
1564,620.0 -18-0.1 ▲89,516.9 12.1 11.5 ▲ 0.1
14.70.812 40
9.4 7.7 34 108,903.90.6
1111 24 66,389.3 +12 ▲ Evercore Partners▲ 0.7116,442.122 -201.4 ▲ 2367,924.3 9.6 7.9 13
10.4 ▲ 1.237 0.9 0 200.2 2.9-
-205.9 3.0
▲1.11.5101.8 ▼0.0138,497.5 +2 ▲0.416
0.615.7 ▼5.0 ▲
Guggenheim Securities LLC 8 25▼▼
38 0.8▼
▼18.6
▲0.311.0 Centerview Partners LLC-1
10 899Lazard 9 8 77,669.9
1047
▲
▲0.7▲ 9 ▲ 102.30.2 +1 1.5▼
Citi 8 4 90,146.7 12.7▼7
19.0 17.30.11.0 -1225.1 4.5 ▲ 241.140 3.5
8.60 - 625▲
JP Morgan 6186,435.7Barclays
1.6 -4 ▲Evercore Partners 7 12 93,072.7 13.1 3.2 ▲
17.2 -9.61.02 187,150.3 25.2 -10.9 ▼ 589.6▼1.6JP Morgan 6 3 119,985.9 16.9 -14.6 ▼
246.3▼ 0.8 Credit Suisse-635 ▼30 0.8 -11▼3.6 0.5
3.6 0.7 ▲244.7
20.431.6Credit Suisse 5 5 121,780.2 235,014.65 1018.5 Citi 264,666.1 35.6 7.3 324 3
▼Morgan Stanley4.1 ▲ 1.3 +1960 0.8 -27 ▼
-1636.9
▲▲ 0.9
▲1.5 -103
Bank of America Merrill Lynch1.6630.0
1.041.9 394 18.0 ▲311,242.4 ▼9.2▲ 5718.76
▼342.1 5.0▲
0.6-10▼-66 209,289.2 29.5 3.9
1.46344
▼29.6 -2.2
-28 ▼325,939.4 43.9 4.8 ▲▼
Financial Advisor2 267,058.1 2.011.263 1.61 177 766.01.7 -9 ▼ Goldman Sachs & Co
MarketShare Ch. Deals Sh (%) # of Deals
Market
37.7 6.0 ▲US$mDeals Sh (%) Share Ch.Sh (%)
AdvisorFees
# of Change in 2016 Rank
2015 Rank
Rank Value Market Change in Market# of Deals Sh (%)
2015 Rank
Market
US Target Announced (AD2) Jan 1 – June 30
MarketRank Value Market2016 Rank
Industry % Change from Same Period Last Year -0.2%
US Target Completed (AF2) Jan 1 – June 30
-17.7% ▼ -12.9% ▼Industry % Change from Last Quarter 20.5%
▼
100.0
-10.0% ▼▲
Imputed Fees (US$m)
▲
9,157.6
Rank Value per Advisor (US$m) # of Deals per Advisor
▼ 4.8%
Rank Value per Advisor (US$m) # of Deals per Advisor
Industry % Change from Last Quarter 61.6% ▲ -2.2%Industry % Change from Same Period Last Year -19.7% ▼ -10.6% ▼
Industry Total† -1,280927,093.7 5,932908,881.2 100.0 -8857,438 100.0Industry Total,,
741.2
3.1
▼
-15.9
+15
0.2
▲-12.7%
+5
1.0
0.8
0.5%
0.2
27
UBS7
34,323.9 +6
Allen & Co Inc 20
Morgan Stanley 2 1 209,916.6
Barclays 4 9 131,422.1Bank of America Merrill Lynch 3
Centerview Partners LLC 16
18
Market # ofFinancial Advisor US$m Sh (%) Share Ch.Goldman Sachs & Co 1
27
-0.2
▼0.7▲19,592.0Jefferies LLC 21 1.2
170.6
▼0.1▼
-675
39▲ -6▲
▲
0.9
▼
13 24,867.5
3
2.7 28,613.9-3
RBC Capital Markets21 22,089.0
Industry % Change from Last Quarter
Qatalyst Partners▼15
4.425 30,806.9
2.2
274,427.8
-3.418
2.2
7
▲
▲
▼ 0.30.4
▼
PJT Partners LP
40,413.4
743,099.4
4.6
▲
141,112.1
2
13
▼▲
8.7
▼
20
0.4 41100.0
Rothschild
+5
40 +12-4
-4BNP Paribas SA
-15.0-4.4
-10
28
▲16▼
+12
57
6.7
Industry % Change from Same Period Last Year
1.7Stifel/KBW 12,999.1
17
4,649
14
* tie
Visit http://dmi.thomsonreuters.com to view archives and order custom League Tables https://www.thomsonone.com 7

Lazard Deutsche Bank
2Credit Suisse
▲
▼
▼
0.1
▼-4.1
0.2
▲
0.2
12.3
11
0.6
6 047
26
13▲
33
1
1.3 Morgan Stanley
2016 Rank
-27
First Half 2016 | Mergers & Acquisitions | Financial Advisors
Rank Value per Advisor (US$m)
639.5
3
Any US Involvement Completed (AF48)
Market
383,837.3DealsSh (%)
Goldman Sachs & Co
Barclays
44.91
302,695.0 35.4
-6
+18
Americas Rankings
Share Ch.
8
8
141,481.1
11
US$m
Jan 1 – June 30
▼Financial Advisor
LionTree Advisors LLC
+5
2
▼▼
15
-
▼
▲
▲
▼10
14
▼▲
JP Morgan 6
▼▲
Industry Total
+3
100 0
38 0.6
+12
▼
▲
01.1
▲+23
JP Morgan
Citi 7
130,411.7
13
10
8
123,992.0
Evercore Partners 99,329.2
5
Rothschild 9 18 86,304.3
6
18 23 29,257.3 3.4
11
31,988.9
13 26,881.9
28
25
3.7
0.0UBS 8.4
17BNP Paribas SA 2.5 ▲▲
Greenhill & Co, LLC
1.413,014.324
560.5
25 1.6809 900 7
Market
▼
0.2
Rank Value per Advisor (US$m)
35.5
27.0
2016 Rank
2015 Rank
4.9Bank of America Merrill Lynch
Rank Value MarketImputed Fees (US$m)
2015 Rank
# of Deals per Advisor
▲
2.8Barclays
62
MarketSh (%)
▲1 287,415.35 224,964.5
1 3.9
3 3Bank of America Merrill LynchMorgan Stanley
# of
952
US$mFinancial AdvisorGoldman Sachs & Co
4
2.5 ▲
Market
218,945.117.1138,714.3
-2.427.8
9
Jan 1 – June 30Any US Involvement Announced (AD41)
0.8
3
Citi
▼
1.7
-15
1.0
▼
-31
1.1
Change in
-24
-1
Market
1.6Sh (%) # of Deals
1.2
-13
+14
DealsRank Value
-20.5 -70.1
0.5
0.0
-6
+1-4
▼
+4
7
# of Deals per Advisor
4
4
RBC Capital Markets
Jefferies LLC11
-2
-14.7▼-10.7
▲▼
-753 0.9
7631.7
8.4412.3
▼ 3.4▲704.5▼ 8.4▲
▼
0.8
21
23
▼▲
0.1
14
72,038.6-13.1 15
-2.7▲
0.8
42
Jefferies LLC
25,145.8Allen & Co Inc
China International Capital Co 22
-5.6 ▼
18,922.8
▲
▲
28Sandler O'Neill Partners
RBC Capital Markets1522
▲19Qatalyst Partners
332.4
3.13.1
1.12.3
2.3
2.3
-12.615.316.1
4
▲▲
▼
▼
12.46
Deutsche Bank
Ducera Partners LLC 13 - 61,738.5 7.6Wells Fargo & Co
1112 23
3.5
9.7811
8.2-1.6
7.210.585,131.5
100,020.5
66,428.0 6.178,126.0
68
35
10.7 ▲
▼68
7.6
6.37
14
50,758.953,456.7
-4.57.06.6
4.2
Guggenheim Securities LLC 10 56,905.4Centerview Partners LLC 15
17 38,833.516
UBS
2114
30,806.918 3.8
2024 2.9-
25,142.523,168.7
8
▲
▲
46
48
264.8
▼
133,119.2 15.6 3.3
37
Evercore Partners+12
16 113,562.20.6
▲
Guggenheim Securities LLC 16.6
▲
▲85,982.8 10.1Allen & Co Inc
▼
9.4
▲ 59
39
▲Credit Suisse
1
51
10071
337,887.8
1.81.9 1.7
68 1.4
54 +21
▲
▲
2
15,717.7
270,680.9▲
▲
4 4
Wells Fargo & Co20
▼
0.9
-23
Stifel/KBW
Scotiabank 23 67
7.6
28 14,371.8
-16▼
MarketChange in Advisor
871-50.7
Moelis & Co
1.24.3
12.017.9
▼
# of Market
-35Share Ch.
-1511.286 934.51.7
Sh (%) # of Deals Fees Sh (%) Share Ch.▲
4.9▲ 11.2
3.419.7 0.9 -8 3.7▼
281.0▲5 10 253,576.9 29.7 3.7
9.0 9.043
-33306.0
42 0.8
293.3 3.549 3.5▲85 1.7 -6 ▼ 753.7235,000.9
▼24.0 6.5 ▲204,825.0 1.0-4.4
527.5
▲15.2 ▲ 11 0.2 +3 ▲ 114.3 1.4 1.4 ▲
Centerview Partners LLC 9 9 138,977.5 16.3 4.5 ▲ 211.8 2.5143.7 1.7
2.5 ▲1.7 ▲
17 0.3 0 -
13.3 9.8 ▲ 4233 0.7 -26 ▼
2.7 ▲Lazard 12 7 101,561.0 11.9 -2.8
0.81.1 -10 ▼ 3.0253.3
2.7+3 ▲ 229.03.0
▲6 0.1 +4 ▲0.7
▲0.7
53▲44 89,516.9 0.1 +2 ▲ 55.810.5 10.0 4
1.90.5 -7 ▼ 158.00.7
1.90.761.5▲
▲Rothschild 16 21 56,790.6 6.7 4.5 ▲ 117.5 1.4 1.4 ▲35 0.7 -5 ▼
0.6 ▲12 0.2 +2 ▲ 46.8 0.6▲ 79.51.4 ▲ 13 1.00.3 +1 1.0 ▲
PJT Partners LP 19 32 28,613.9 3.4 2.6 ▲ 0.61.5 ▲31 0.6 -4 ▼ 124.40.6 ▲▲ 48.812 0.2 +2
▼ 1.526,934.8 3.23.2
-1.7▼ 72.3-2.2 ▼ 20 0.90.4 -13 0.9 ▲
Moelis & Co 22 24 21,323.7 2.5 0.8 ▲ 1.9 ▲40 0.8 +2 ▲ 155.2 1.915 20,448.9 0.9 -10 ▼ 182.02.4 -1.6 ▼ 44 2.2 2.2 ▲
Deloitte 24 56 19,879.8 2.3 2.0 ▲ ▲15 0.3 -13 ▼ 5.6 0.125 35 13,573.0 1.6 0.9
0.10.2 +2 ▲ 42.1▲ 12 0.5 0.5 ▲
8 361 2 100 0854 449 0 5 006100 0 1 103Industry TotalBMO Capital Markets
Bank of America Merrill Lynch TD Securities Inc
12
8
10
▲13
Stifel/KBW
23
Sandler O'Neill Partners 17
Rank Value per Advisor (US$m)Market
TD Securities Inc
15
7.613
5.5 -10.1Credit SuisseCiti
14 8 1.0▼
▲
1.1
7.1
-14.0
▲
5,917.75
2.1
-1.5
103*
+1
Change in
0.8▲
-15.9
▼
2.1
-5
▼
▲
-2
Market
+2
▼
0.9
-1
# of Deals per Advisor
6.8
▲13.914.4
12.8
1.5▼
17
99
6,047
7.0
8,132.1
14,986.1
17,035.9 15.816,702.2
7.78,259.6
15,567.8
15.5
0.9
Bank of America Merrill Lynch▲ Morgan Stanley▼
-2
-109
2424
Macquarie Group
100.0
Blair Franklin Capital Part1,978.323 82
25GMP Capital Corp51
2+2
2,297.1 0.22.1
2.1
-5.0 ▼
3,486.8 3.2
22-7
Industry Total
IMAP
1,729.3 1.61,878.8
▼1
+2-3.40.4▼
-4
1.7
-10.2 ▼
7.6
0.25.0 0.5
12
0.8-2
▲
▼
0.27,635.1
▼
5,382.2
▼13 4,230.87 ▼-2.9 35.51.8
0.0 3.6▲ 7 0.0 ▲ 32.7 3.4
-74
3,930.82.8 ▲
4
6.1
7.8
104.3
▲
▲0.50 ▼6.9Barclays
12
+26.4
-23.0 ▼9
-7
-113.2
▼
-1
0.4+2 ▲ 13.14,812.84.90.04 2.18.7 ▼
15 9
▲
20.60.1
1
10,845.1 28.6▲
8
15,690.1
12,357.6 ▼
2.613.2
13.8
0.1
▲
▼
4
0.1+3
▼0.6
▼
▼
2.2
▲▲
7.12.9
▼▲
8.4
▼▲0.0
0.730.2
▼3.4
45
RBC Capital Markets 1
+1
Financial Advisor
Industry Total
1124 47.5▼ 914.8
100.0
7
9.3 32.9
8
BMO Capital Markets 11 2410
15,902.190.1
91.0
5,950.93.44.9
109.7
▲
2.6
2▲
Macquarie Group
-
5,697.71
22+1
5,341.4111.4
Scotiabank1.0
13
Deutsche Bank 16 6
BBVA
8,132.1▲ 81*Stifel/KBW▲8,497.7Wells Fargo & Co
+10.00.0
13.817.7-2
-6
65
10
+4-
0.7-1 ▼-5
▼
-7
46.93.9 ▲▲14.5 38.5
0.1▲
4.8▼0.0
▼106
0.17.3
-717
BMO Capital Markets15.6
11,939.2 19.4
2CIBC World Markets Inc
16122JP Morgan
Jan 1 – June 30
0 20.1
RBC Capital Markets
34
▲1
0.44.0
6 18,068.525.5
2016 Rank
MarketFinancial Advisor
2015 Rank
▲▲
Deals
7
Share Ch.Sh (%)
5.5
Market# of Deals
Change in MarketSh (%)
00.0
Sh (%)
Imputed Fees (US$m)
1.2▲
- 53.65.011.4
71.0 1.0
MarketMarket
Industry % Change from Last Quarter67.9%
2015 Rank
MarketRank ValueSh (%)
# of# of DealsUS$m
▲Industry % Change from Last Quarter
▼
Rank Value per Advisor (US$m)
Any Canadian Involvement Announced (AD42) Any Canadian Involvement Completed (AF49)
2016 Rank
Jan 1 – June 30
29.41Share Ch.
4Lazard
▲15.8▲
9 30.0 20.523.7
32,379.5
Scotiabank
5Wells Fargo & CoMorgan Stanley
2
20.922.1
25,586.623.224,984.7
CIBC World Markets Inc
7
1141
-67
3
JP Morgan 3 18,303.3
23,866.7
▼22,566.2
1017.0
▲
809,900.7
DealsRank Value
2,348.5
0.3
-
Goldman Sachs & Co
Industry % Change from Last Quarter
Sh (%)
1.0
-0.60
▲3.83.7
14
2,297.1
153.8
▼-19.9
61,443.4
1
11.9
13.2
2.1
0.0▼
23.5
0.1 +2+610
-9▲
1.5
-12.6%
Credit Suisse
4
0.8
0.8
13 Citi
▼
PJT Partners LP
▲ 20 3,765.2Moelis & Co 16▼ 26
▼
▼
▼1.8
3,429.9 3.2
21
Industry % Change from Same Period Last Year -21.8% -8.7%-49.8%
▼Canaccord Genuity
24
22
Industry % Change from Last Quarter
* tie
▲2.1%
20 19 2,845.3
103*
-8.7
2.1
HSBC Holdings PLC
Rothschild
▼▼
19 18 -1.8
107,779.3
22.6
▲11Barclays
Goldman Sachs & Co 9
17
-2.0%
20.9
Industry % Change from Same Period Last Year -20.5% ▼
-871 8,361.2 100.0854,449.0
▼
5,006
Industry % Change from Same Period Last Year 6.1% -18.1%
100.0
▲-9.0% ▼
-10.7% 5.8%
-1,103
▲
14,440.6
▲
# of Deals per Advisor
21.2%
Share Ch.
-1.4
▼
▼18.4
US$mAdvisor# of
▲Fees110.9▼0.116 -10
2.4 0.5 ▲2.4
▲ 22.9
0.126.9▲▲ 23.2
0.0 2.8 ▲0.1 1.8
1781*9
10
Deutsche Bank
2,104.5▲18
+5 Jefferies LLC
▲+1
40
3 2,323.7
0.02.8▲▲
3.7BBVA3.4
18 31 ▲0.0 02 0.2- 2.4 0.1
21 12 2,463.5 2.3 ▲-1 1,878.8Blair Franklin Capital Part
▲
5.30.5▼
19 ▲ 22.97 1.62.4
▼.40.0 ▼
0.10.527
-1 5
-23
▲-10.0
20 ▲64 1,978.342
-52.6
3.2
1,723.6▲
2.6
3.11.11,726.7
▲ 0.20.0 0 0.52Nomura
81*100.0
2.01.9
-1.5▲
0.02.8
0.1 1,230.0 ▼
100.0
3 +2▲
-6.4%13.1%Industry % Change from Same Period Last Year ▼
▲
-0.8 0.56
3.9%-17.2%
▼
-168 973.5
▼
-12.82.8
▼-
-20.4%
▲
-0.8
6.4▲ 10.9 1.1
0.70.7
1.8
-7 ▼
▲
▼
11.4 ▲
▼0.1
1,1481,165.225
▲
IMAP2.6Moelis & Co
2 0.0+248
04.8
811Industry Total0.0 00.0
3,853.7 3.6 -0.5
▲1.011
-1.6
▲0.9
▼20
Industry Total
3 -1▼
0.3
14.67
0.0▼
▼+4
5
-29.1%
UBS
https://www.thomsonone.com Visit http://dmi.thomsonreuters.com to view archives and order custom League Tables
8

49.3
45.4638
Morgan Stanley
EMEA Targeted Financial Sponsor Investments (Buyside Sponsor Activity)
12
46.8
58.6
2
12
11 41,074.1
Energy and Power
1
3
9
Goldman Sachs & Co
Real Estate
Bank of America Merrill Lynch
Bank of America Merrill Lynch
Industrials
Financials
Goldman Sachs & Co
Rothschild
Lazard
21,013.3
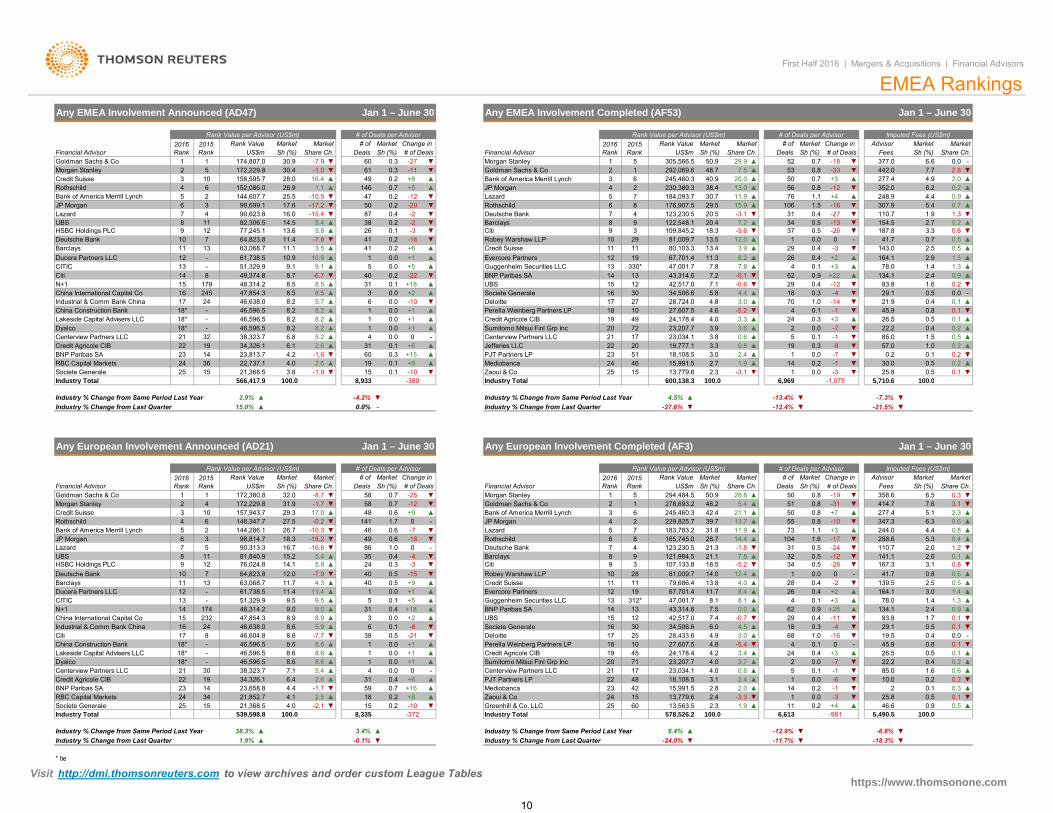
Announced M&A activity with EMEA involvement totaled US$566.4 billion from 8,933 deals in the first half of 2016, up 2.9%compared to the same period last year.
Estimated fees accumulated on EMEA deals completed in the first half of 2016 were down 7.3% compared to the same periodlast year, totaling US$5.7 billion, according to estimates from Thomson Reuters/Freeman Consulting.
The Materials sector led the EMEA marketplace, with 623 deals totaling a combined US$135.5 billion, including the acquisition ofMonsanto Co by Bayer AG, which was the largest European deal of the quarter, valued at US$61.7 billion. Industrials accruedUS$70 billion, and Financials totaled US$69.3 billion of activity.
Financial sponsors were less active in the first half of 2016 compared to the first half of 2015. EMEA-targeted buyside financialsponsor activity reached US$59.9 billion in the first half of 2016, down 15.9% from the US$71.2 billion reported for the sameperiod last year.
Acquirors listed on the Frankfurt Stock Exchange were EMEA's most acquisitive companies for the first half of 2016, with acombined total of US$84.9 billion in offers.
Morgan Stanley
Morgan Stanley
Morgan Stanley
32,009.5
17 24,571.9
6
1,027 45.7
69,264.4
3
18
32.7
623 Share
3
No. Deals
1,387 47.9
EMEA Involvement Announced Advisors by Target Industry
70,039.4
5
4 6
EMEA Deals Intelligence
First Half 2016 | Mergers & Acquisitions | Financial Advisors
EMEA M&AEMEA Announced M&A up 3% | Materials Highest Valued Sector | Financial Sponsor Activity Drops
636 6
15,804.3
15,038.6
9 27.1
Goldman Sachs & Co
14,277.8
Primary Listing of Most Acquisitive EMEA Companies - Top 10 (US$b) Jan 1 - June 30 2016
18,789.7
48,976.7
3 UBS 3
2
Rank Val US$m
109,611.8
Rank
Credit Suisse
3
22,993.3
58,425.0
64,938.5
Citi
80.9
Mkt.
Materials
2
135,489.2
50.067,690.2 1
2
22,664.8
1
1
35.5
32.2
33.2
26,512.1
68.9
9
Jan 1 - June 30 2016
46,596.5 Materials / Chemicals
France / United States
Industrials / MachineryIreland-Rep / United States
g p ( y p y)
Germany / United StatesAcquiror Target Macro / Mid Industry
Pending
Bayer AG5/23/2016
Tyco International PLC
6/27/2016
Pending
Sanofi SA-Animal Health Bus (100%)
Intended
Johnson Controls Inc (100%)1/25/20162/17/2016
Pending
Pending Mylan NV4/28/2016
2/3/2016
2/10/2016
Netherlands / Switzerland
Pending
9,917.0Pending Medivation Inc (100%) Sanofi SA
6/21/2016
61,738.5Acquiror / Target Nation
CNAC Saturn (NL) BV
Target (% Sought/Acquired)
Syngenta AG (100%)Monsanto Co (100%)
13,897.8SACAM Mutualisation
* UndisclosedMexico / SpainIntended
Pending
Meda AB (100%)
Germany / United KingdomPending
London Stock Exchange Grp PLC (100%)20,060.2France / France Financials / Banks
Healthcare / Pharmaceuticals
Credit Agricole-Regional Banks (25%)
Healthcare / PharmaceuticalsUnited States / Sweden
Deutsche Boerse AGGermany / France
3/4/2016China / Finland
27,700.7
Primary Listing of Most Acquisitive EMEA Companies - Top 10 (US$b) Jan 1 - June 30 2016
Rank Value (US$m)
Supercell Oy (84.3%)
StatusRank Date
2/23/2016
8,601.4Healthcare / Pharmaceuticals
12,581.4
Jan 1 – June 30 2016
Financials / Brokerage
Top Ten EMEA Involvement Announced Deals
Control Empresarial de Capital Industrials / Building/Construction & Engineering8,600.08,074.5
High Technology / SoftwareTencent Holdings LtdFCC (70.5%)
Boehringer Ingelheim-CHC Bus
Materials / Chemicals
$74.4
$27.2$4.1
$21.9 $18.5 $25.8$48.0
$28.4 $19.0
$85.6
$44.2
$9.0$16.5
$38.8$24.1
$33.3
$43.6
$42.8$40.9
$54.1
$29.6
$14.5
$36.3
$23.9$27.0
$23.8
$30.4
$28.0
$69.7
$24.9
$18.7
$29.2$22.3
$27.4$33.7
$44.2
$35.8
17.2%
10.3%
7.5%
13.7%14.3%
11.3%
18.6% 18.3%
13.8%
15.7%
0%
5%
10%
15%
20%
25%
$0
$50
$100
$150
$200
$250
$300
2007 2008 2009 2010 2011 2012 2013 2014 2015 2016
% o
f EM
EA
Ran
k Va
lue
(US
$b)
Q4 Volume (US$b)
Q3 Volume (US$b)
Q2 Volume (US$b)
Q1 Volume (US$b)
% of YTD EMEA M&A$84.9
$34.8
$30.1
$12.0
$11.3$6.2
$5.8 $5.2 $5.0 $4.4
Frankfurt
New York
Euronext Paris
Swiss Stock Exchange
New York
Zurich
Nasdaq
Madrid
OMX Stockholm
BMFBOVESPA
https://www.thomsonone.com Visit http://dmi.thomsonreuters.com to view archives and order custom League Tables
9
Deutsche Bank
▼7.8
▲
-0.1▼
▲
-0.6▲
3.3
# of
EMEA Rankings
Financial Advisor
Jan 1 – June 30
Rank Value per Advisor (US$m)2016 Rank
▼-5.2▲
Financial Advisor# of DealsSh (%)
Any EMEA Involvement Announced (AD47)
Market
30.41Goldman Sachs & Co
172,229.8 -1.0530.91
2015 Rank US$m
# of Deals per Advisor
Jan 1 – June 30
Market
60
82,306.5
Rank Value Market
174,807.0 -7.9
▼
MarketShare Ch.
▲
16.0 -15.4
491.1
-17.287
14647
16.4▲
▼
18*Industrial & Comm Bank China
Ducera Partners LLC
77,245.1
103
3
13
China Construction Bank
N+116China International Capital Co
CITIC 13
15
4UBS
97
Barclays
18*
17
-
11
-
Lakeside Capital Advisers LLC
Citi
12
14
HSBC Holdings PLC
11
+8
50
5.4
10.9Guggenheim Securities LLC
0.2
-7.826
0.063,068.764,823.8
▲▲
11.4 41
+14111.1 3.5
2
8
JP Morgan 6Lazard
Credit SuisseMorgan Stanley
Bank of America Merrill LynchRothschild
7
13.6
4
10
152,086.05
90,623.814.5
6
12
2
14
5.834,506.628,724.0
154.4
12 42,517.0
27 3.0
BNP Paribas SA
30UBS
7.2
Societe Generale
18 27,607.5Perella Weinberg Partners LP
43,314.6
17
3.924,178.4 4.0
173.6 ▲23,207.7
4972
23,034.1
▲ 16
8
0.00.3
Deloitte
0.0
8.2
3.8
4.6
21Jefferies LLC
104.86
3
1▲
Credit Agricole CIB 19
7.1
+1+1
1
2.65.2
▲▲
Mediobanca▼ PJT Partners LP▲ ▲
60 +1531
▲0.3
▲▲
4+110
206.8
4.26.1
8.55.7
8.28.28.2
▲▲
▲
2.6
100 0
24
18*
19
8.2Dyalco3221
BNP Paribas SA 23 14
Centerview Partners LLCCredit Agricole CIB 22
36Societe Generale 25RBC Capital Markets
Industry Total15
8.58.5 ▲ 31
▲▲
0.2
0.0▲
▲5.8
-22
▲▼
0.1
-6.7
38 7.2-3
Barclays
▼Citi
13.5
-2 20.4122,548.1
-16
49,374.8
10.95161,738.5
4051,329.9
▼8.7330*+5
12
▼9.1
9839
10
7.8Evercore Partners
47,001.79.1
-31
▲ Credit Suisse▲
8.2 0.411
67,701.480,103.3
29
19
12.02911 13.4
76
0.0
▼
1313
8 ▲
37
0.41.5
31▼▼
-27-16
34 0.5▲
307.9
-13▼▼
245,460.36
4
▲106
1.1+5
Bank of America Merrill Lynch
184,093.7
154.5
+4
+313.0 ▲
40.9-12
▲292,069.6 48.7
▼
0.2
1Goldman Sachs & Co
50.92
5 377.0
0.70.8▲61 -110.3
-270.3▼
▼Sh (%)Deals
▼
72▲ 4
1Morgan Stanley
7.7442.020.0
▼
248.9
-33277.450
53
0.8
7.5
230,389.3
Sh (%)US$m
0.7 38.4
Market
▼305,566.5 ▲ 0.729.9 52 -18
2016 Rank DealsShare Ch.
Rank Value AdvisorMarketMarketSh (%)
# of2015 Rank
Rank Value per Advisor (US$m)Change in
Imputed Fees (US$m)
First Half 2016 | Mergers & Acquisitions | Financial Advisors
# of Deals per Advisor
0.02.8
Sh (%) # of Deals
Any EMEA Involvement Completed (AF53)
Share Ch.Market
-
0.9
Change in
-26
Fees
2.9
6.6
▲
▲
2.0
▲
▼-
▲
0.6
▲0.5
0.1
▲▼
164.1
0.70.5
▲1.3+2
▲
▼
▲
4.9
-12
0.7
2.7▼▲
62
352.0
0.429
4
0.5
0.4
134.1
187.8
▼▲
563
11.9
▲
▲JP Morgan
▲▼
6 969
46
Industry Total1
4
▼▼
191
-918,108.5
18
▼
70▼
0.0
-10.324
2
14
5
2.4 ▲3.00.80.6
▲▲
19,777.1 3.3
600 138 32.313,779.6
15,991.5
100 0
1.90.1 0.2
-1
1 075
30.0
1.0
25.8
0.2
0.0 0.1
0.2
0.5100 0
▲0.5-1 ▼
0.2-3
5 710 6
▼-7
0.1▲▲
▼
▼ 0.2
0.2
0.3
0.1
-70.1
1.0
▲
▲
▼
93.8+22
▲
-14-4
+3
0.9
0.2
0
▲▼
▼
0.4
-
85.0
45.9
143.0
0.5
▲
▲4.4
1.9
6.2
5.4
0.2
1.37 123,230.5
30.729.5
-3.16 15.9
110.7▼
5Rothschild 176,907.5
▼
20.5-2-20
▼ Deutsche Bank
28.0
99,699.125.526.9
17.6
158,595.7
144,607.7 -10.5 0.2
0.4
-12 Lazard
81,009.7
▼0.2
▼Robey Warshaw LLP
▲ 26
-5.6
11.33.9
109,845.2 ▼18.3
0.00.2
▲
29.1
0.1
0.91.3
1.6▼
+3
22.2
▼
1.478.0
2.5
3.3
0.5
2.4
0.8
41.7
▲
21.9
57.0
26.5 0.1
▼0.5
1.50.4
▼
51
▲
15
20Sumitomo Mitsui Finl Grp Inc
Zaoui & Co
Centerview Partners LLC
-3.12.7
2322
▲▲
2524
▼15▼8 933
-1019
0.2
+6
+6
0.20.1 +18
0.0
0.0+2
▲
389
0.0
0.1 +9
0.1
0.0
0.1
-
-100.0
▼
179
46,596.5 8.2
8.548,314.247,854.3245
8.2-
24 46,638.0
46,596.546,596.5
--
34,326.138,323.7
-1.9
23,813.74.022,737.1
566 417 9
-1.6
21,368.5 3.8
Deutsche Bank Robey Warshaw LLP
93.8
167.3
78.0
+7
-26107,133.8
123,230.5
2
8
79,686.41128
19
230.7
▲
25 21,368.5
1.9%
-2.1Societe Generale100.0
0.2
▼
▲ Zaoui & Co
-▼
▲
▲
4.8
14
28,433.6
1434 2.5 ▲
10
▲4.1 0.24.4
0.0
1.4
414.7
244.0
277.4▲
5.3288.6
▼3.1
110.7
7.6
AdvisorSh (%)# of Deals
358.6-19
Change in Fees
▼
134.1
164.1
▼
▲347.3
312*
121,984.5
7
15.2
18.3
58
-40
58
1.0
0.7
46
0.4
13 7.5
25
7.41243,314.6
30
18
67,701.447,001.7
4.5
▲8.1
-0.70.0
4.9
42,517.0
1181,009.7
31.9
26.70141
▲
Perella Weinberg Partners LP
Barclays
-18
Credit Suisse
0.1+1
-15
Guggenheim Securities LLC
UBS
▲
▲
-8.7
9▼Citi
7
▼ 3
435
0.7
89
-
JP Morgan-5▼
▼ Rothschild-16.8 ▼-18.2
Deutsche Bank
▼
98,814.790,313.3 16.7
▼-10.3
▲
0.60.6
27.5 1.75 2
▲
144,286.1▼
4Rothschild 6Credit Suisse
148,347.73 157,943.710
172,229.8 ▼
Sh (%)
-0.217.0-1.7
29.3
Market
Any European Involvement Announced (AD21)
4
100.0
▲Industry % Change from Same Period Last Year
2016 Rank
Goldman Sachs & CoUS$m
Rank Value
▲
1
2.9%Industry % Change from Last Quarter
Industry Total
1Morgan Stanley
Financial Advisor
2
Rank Value per Advisor (US$m)
▼Share Ch.
2015 Rank
Barclays
Centerview Partners LLC
Lakeside Capital Advisers LLC
N+1China International Capital CoIndustrial & Comm Bank China
CITIC
Dyalco
China Construction BankCiti
PJT Partners LP170.0 -48▲
21
▼Industry % Change from Same Period Last Year
Industry Total
2425
6.4%
Greenhill & Co, LLC15 13,779.6
▲
22Mediobanca
Industry % Change from Last Quarter
22 34,326.1
17
15
3
11710
UBS 8
Industry % Change from Same Period Last Year
Credit Agricole CIB
Industry % Change from Last Quarter▲
50.9294,484.5
Rank Value
278,693.2
US$m
-27.6%
19
100.0578,526.2
4.0
6,969
Sh (%)
27,607.5
2.8
60
-13.4%
42
23,207.7
2.4
24,178.4
18,108.5
71
15,991.5
23,034.13.14.0
2423
4.015
▲
▼Industry Total 8,335
BNP Paribas SA
539,598.8
38.3%
* tie
Industry % Change from Last Quarter ▲
RBC Capital Markets
▲
14.3
▼13 40
12.064,823.8
▲ 31
0.0▲
▲-
51,329.9
+1
-63
5
0.3
0.0
0.54024
0.0
+16+6
+8
0.4
▼
+1
2.0
4.2
2.4
45
2.313,563.5
6
4.5%
# of Deals per Advisor
▼
29.1
Any European Involvement Completed (AF3)
-12.4%▼
Industry Total
▼
600,138.3 100.0 -1,075
▼
MarketImputed Fees (US$m)
100.0
22.2 0.20.4
▲
▼
1.3
141.1
41.7
26.5
0.445.9
▲
3.0 1.4
0.50.1
▲0.52.5
19.5
▲▲
0.4
▲▼0.8
▼0.3
2.3
0.8
2.62.0 1.2
0.6
0.1
6.5Share Ch.
0.8
3.1
Market
▲4.4
0.65.1 ▲6.3
▼
5,710.6
▲
Jan 1 – June 30
▼
-10
-18.3%
-11+25
▼
-12
▼
-3 0.1
▼
▼
0.0
0.4
26
▼
6,613
-12.9%
0.2
11
-173132
104
0.1
0.4
0.9
-1-6
0.00.534
0.850
0.5
1.11.60.5
1
MarketShare Ch.
5128.8
48.2▲
Deals# ofMarket
▲
165,745.0
229,825.721.1
39.7 13.7183,783.2
245,460.3
11.931.8
42.45.4
14.4
▲
13.8
▲
505573
▼
▲
4.0
▼
▲
18.5▲
▲
21.1-5.2
▲21.328.7
8.4
12.4
8.1
-5.4
-1.8
3.06.0
14.0
7.8
3.7
11.7
3.4
▲▲
28
4
▲
4
▲0.6
2
▼
5
▲
24
▼ 29
68
62
▲ 1
-3.3▲+4
0.0-1
-11.7%
0.2
14
▼
-31
▼
▼
-
▲▼
+3
0
0.3
MarketSh (%)
0.8
0.4
0.8
+30.8
+2
0
-24
-2
0.1-16
-7.3%-21.5%
139.5
10.0.2
+3 ▲
Deloitte
Goldman Sachs & CoBank of America Merrill Lynch
-24.0%
Societe Generale1.0
1.91
0.0
▲
20
▼18
-0.1%
48
-10
0.6
-7
1
+90.5
+18
3.4%
2015 Rank
5-12+9
Rank Value per Advisor (US$m)2016 Rank
▼
# of Deals Financial Advisor
2-25 ▼ Morgan Stanley
15BNP Paribas SA
Lazard
16
Industry % Change from Same Period Last Year
12
31
1
4
13
Centerview Partners LLC
17
Credit Agricole CIBSumitomo Mitsui Finl Grp Inc
Evercore Partners
10
6
▼
▲
▲▲
▲
▲
▼
▲
▼0.5
+1-21
+50.4
0.1+2
▲
▼
8649
-3
-4.2%
# ofDeals
Change in
-▼
Jan 1 – June 30
# of Deals per Advisor
8,933
0.0%
-389
Sh (%)Market
▲
▼
46.6
▼
25.8 ▼
0.2▲0.30.1
▲
▼0.0
▲
2.4 ▲0.9
-0.1
0.10.1
▼
▼
0.5
1.7
0.5
34,506.6
▲
▼-4
0.8▲
18
0.4
0.1
▼
▼
-
48.6
1
-7.9
9.0▲
31▲▲0.6
46,596.5
6.4
▲ 11.6▲0.2
-7▼
15
6
0.00
-3720.9
-6.8%
85.0
-981 5,490.5 100.0
0.5
▼7.1
▲
11.711.4 11.4
9.09.5
8.9
▲
-7.7▲▼
▲
23,658.8 -1.72.6
▼
46,638.0 5.9
46,596.5 8.68.6 8.68.68.6
46,604.8
30
-
8.638,323.7
18*46,596.5
5.4
8.6-
21,852.7
18*
14
16
18*
21
23224
1959
47,854.3 8.9
388
5.814.1
9.5
5
174
61,738.563,068.7
-48,314.2
76,024.8125.481,840.911
32.0
566,417.9
15.0%
172,380.8
Market
Bank of America Merrill Lynch6
13
JP Morgan
HSBC Holdings PLC
Lazard 7
9
12Ducera Partners LLC
Visit http://dmi.thomsonreuters.com to view archives and order custom League Tablest e
https://www.thomsonone.com
10
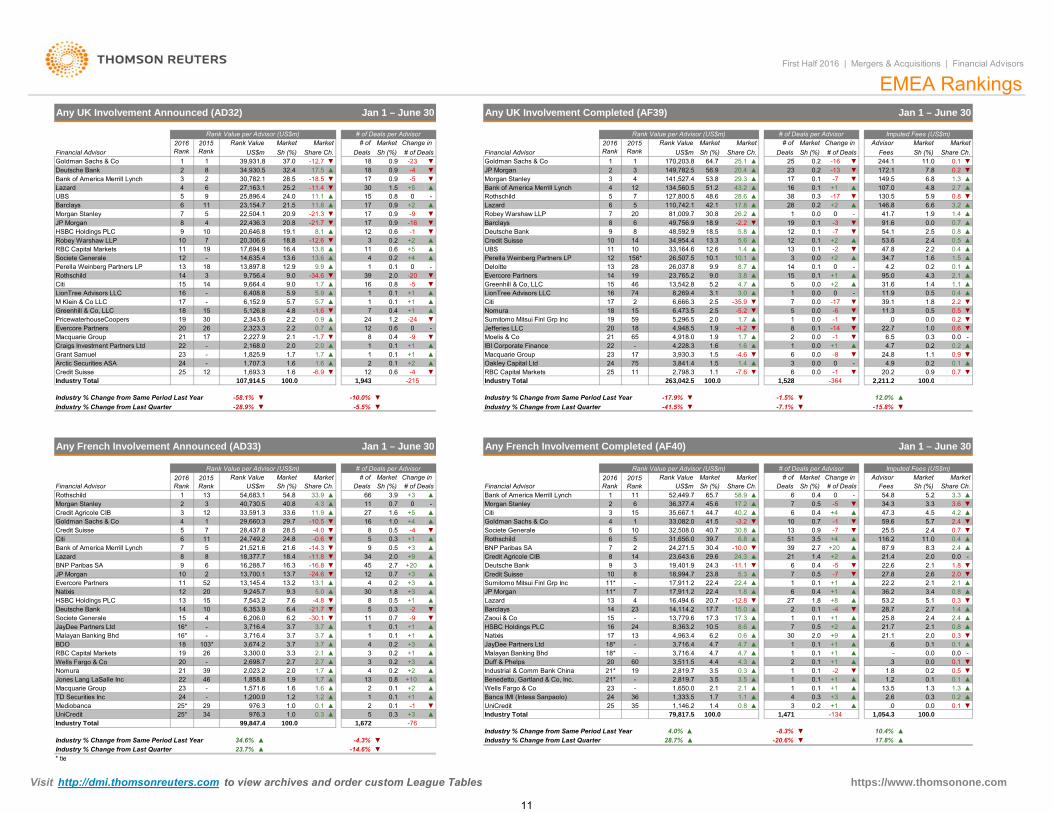
Robey Warshaw LLP Credit Suisse
Jefferies LLC
3,841.4▼-4.6
Rothschild
23
Bank of America Merrill Lynch
# of Deals2016 RankFinancial Advisor
Rank Value per Advisor (US$m)
3
12
149,782.5
4
1
Rank Value
6
Morgan Stanley
Goldman Sachs & Co
2015 Rank
1JP Morgan
64.7
110,742.1
48,592.9
33,164.6
53.8
49,756.9
42.1
56.9
127,800.5134,560.5141,527.4
6,666.36,473.5
1.7
Goldman Sachs & CoDeutsche Bank
Sh (%)
Any UK Involvement Announced (AD32)
25
2,227.9
1.6 ▲▲
Rank Value2015 Rank
▼
1
# of Deals per AdvisorChange in 2016
RankMarket
1+10.1
Rank Value per Advisor (US$m)
▼-4
1.7
4
▲
▼
Jan 1 – June 30
Market
▲
▲
0.8
▲
0.2
1.00.0
2.2
▼0.2
1.8
0.9
0.3
0.5
0.21.10.2
100 0
0.00.0
Market
▼17
# of Deals
▲2325
0.1 -7
Share Ch.Financial Advisor# ofMarket
Sh (%)US$mMarket
170,203.8Sh (%)
▲ 0.2Deals
0.1Share Ch.Sh (%)Sh (%)
20.4
51.2
1.9
43.2
-2.226.2
▲
30.8
▲
0.0
0.1
18.9
1.6
8.7
4.7
81,009.7
48.6
▲
5.6
13,542.88,269.4
0.4-35.9
18.5
26,037.8
▲
4,918.0
3.0
5.8
74
12
5,296.5 2.059
Citi
0.2
-4.2
16
17.8
12▲▲
▲
19▼0.01
-3
+213
0.1
0.1
0
-20.0
+10.1
0.1 +2
0.10
-16
# of
-17
-▲28
0.1 +1▼
+20.338
-13
▲▼
EMEA Rankings
Market Market
25.1 ▼
29.3
US$m
First Half 2016 | Mergers & Acquisitions | Financial Advisors
4.30.2
146.8
107.0
95.0
5.9
39.1
+2
-7
11.3▼
+1▼
▼▼
6
1 528100 0
Any UK Involvement Completed (AF39)
# of Deals per Advisor
▲28.6
20
1
▼
14 13.3
13.6
▲
▲
▼
11
7
Deals
0.6
2
1
0.4
0.6
0.10.1
-24
0.1
▼+5
-23 ▼
+1 ▲
▲-
-90
+1
0
-16▼
▲1.2 ▼
-
0.1▼
+1 ▲
+2
IBI Corporate Finance ▲
▼
▲
6.5
▼0.5
.0
4.7
▼
4.9
▲
- 0.5▲▲
1.111.931.6 1.4
▲
-0.00.6 ▼
2.1
0.7
▼
▼
22.70.2
2.40.4
1.6
0.4
▲
0.1
2.2
▲1.4
0.8
1.5 ▲
▼
▲▲
▲2.7▲6.8
0.7
3.21.9
▲6.6
0.0
172.1 0.2
Jan 1 – June 30
Share Ch.11.0
▼1
130.5
Change in Advisor
244.1-4-5 1.3
4.8
▼91.654.1
-
▼
▲
▲▼
34.7
53.6
4.2
41.7
149.57.8
2.50.5
0.1
47.8
2 211 2
24.8-0
-1
-8
364▼
▼0.01.5
Moelis & Co4,228.33,930.3
263 042 5Industry Total
17
1.918
21 651.6
4,948.5
2423
34,954.4
10.1
8
19Sumitomo Mitsui Finl Grp IncNomura
LionTree Advisors LLC 16
11
7BarclaysRobey Warshaw LLP
20
Deutsche Bank
10
15
Perella Weinberg Partners LP
1718
7
910
22
2
6
5
15
5
156*
Imputed Fees (US$m)Market
Fees
18
31813
14
20,306.6
-
14-
6,152.9
27,163.1
14,635.4
9
24
12
-1.7
▼
1.7
1 943Industry Total
24Credit Suisse
1519
23-
12
22Grant SamuelArctic Securities ASA
17
-
12
Rothschild
Evercore PartnersPricewaterhouseCoopers
17LionTree Advisors LLC 16
26
Societe GeneralePerella Weinberg Partners LP
107 914 5
-
Greenhill & Co, LLC30
-
20
Craigs Investment Partners Ltd
M Klein & Co LLC
21Macquarie Group2,323.3
15
1,693.3
5,126.82,343.6
Citi
215
+1▲
0.7
1.6100 0
2.12.0
2.22.2
0.9
0.918
3▼1217
11.1
1
▲
81
▲
0.9
19
-21.34
12
17
▲
-21.719.1
11.8
-11.4-18.5
21.5
17.537.032.4
JP Morgan
34,930.582
8
Bank of America Merrill Lynch
20.8
65
2
Lazard 4
Morgan Stanley
3
RBC Capital Markets 11
UBSBarclays
10
5
9
7HSBC Holdings PLC
7
39,931.8
1022,436.3
20.9
30,782.16
28.525.2
1124.0 0.815
0.9
-12.7
▼1.530
0.9▼
18
Lazard
▼17
0.9
17-9
▲+20.9
0.618.8 -12.6
▼ 8-10.6+20.2 ▲
1514
▲▲9.9
14 3.8
312 10.1
23,765.2-20Deloitte
26,507.5
39 Evercore Partners
4 ▲+40.2▲1.4
-59.0▼
-
12.6+5 ▲ UBS
0.12.0
Greenhill & Co, LLC
1319460.8 ▼
280
7-5.2 ▼
3.151▲
▲5.2
2.50.0
2.5
▲
0
▼ 0.1
-65-17
0.0
0.082
▲ -11
▲-14
0.01.5
3
0.0▼
▲1.4
▲ 1
0.0
-
75Macquarie Group
RBC Capital Markets 25Oakley Capital Ltd
▲▲
▼
-6.9▲
16
▼▲
▲
9.9 ▲-34.6
5.95.7
▼
20,646.8
23,154.725,896.4
▲
1.7
▼
▲
17,694.9
-1.6
▲13.8
22,504.1
8.1
1.71,825.92.0
9,756.4
6,408.8
1.6
5.95.7
9,664.4
16.413.6
4.8
9.0
13,897.8
2,168.0
9.012.9
1,707.311 2,798.3 1.1 -1 20.2 0.9-7.6 ▼ 6
* tie
JP Morgan Credit Suisse
Wells Fargo & Co
▲Industry % Change from Last Quarter
5 0.3 +3 ▲25* 34 976.3 1.0 0.3
+1
▲
▲
28.7% 17.8%-20.6%
16,494.6
19
1,650.0
60 3,511.5
▲
0.10.5
10.1
▼ ▲
▲
UniCredit
17.7
0.9
0.417,911.2
19,401.9
40.7
23.8
30.4
0.1
20.7
▼
Rank ValueRank Value per Advisor (US$m)
Any French Involvement Completed (AF40)
▼
0.1
0.1
1
0.10.1
Market
2
72.0
+1
-4
112
0.1
+1+2
▲
▲+1
0.1▲+1
+9
10.4%
+1+3
▲Sh (%)
Change in
-28.9%
1 13
2016 Rank # of Deals
▼
▼
Share Ch.Sh (%)
100.0
▲
Jan 1 – June 30
Market
▲
# of Deals per Advisor
-7 25.559.6
4.55.7
47.3
3.3
▲
2.4
5.2
▲3.6
11.08.3
▲
-
2.0
116.287.9
▼▼
0.1
21.7
36.2
28.7
▲
▲
▼
▲53.2
▼-2
+8
+1
2.425.8▲
▲2.0
0.0
.621.1
▲
13.5
.31.8
▲
0.8
0.3
-
▲
2.1
0.0
▲2.6
1.2 0.13.54.4 ▲
▲
2.1
4.3
▼0.0 0.1.0▲1,054.3
▲100.0
+10.2
-76
▼Industry Total
+2
Fees
▲31,656.0
0.2▼
2.1
22.2
▼
39.7
1.8
27.822.6
▼
21.4▲
7
13
0.5
1.8 ▲
▲7 39▼
14
8
▼-7.1%
▼15.0
▲
1.40.4
2.7
24
▲0.2 +3+2
▲
23.7%
4.0%Industry Total
1.2976.3
▲
-14.6%-4.3%
1.2Mediobanca
1
* tie▲
21.0 0.1
▼
1,672100.0
▲
▲ ▲
1.4
-Banca IMI (Intesa Sanpaolo)
- 3.5▲▲
0.1
-1
2.1
0.8
+1
+101.7 0.2
0.10.1
13
-30.1
3.3
42.7 3
13.73.7
4
1,200.01,571.6
3.7
2.0
3,716.4
1,858.8
Bank of America Merrill Lynch
6.2
3.73,300.0
21,521.618.416.3
13.1
-11.8
-4.8
Goldman Sachs & Co
57
28,437.84
13.716,288.7
Credit Suisse29.7
8
621.6
33.6
24.8
11
29,660.3
40.833,591.3
5
2016 Rank
# of
-1.5%
1,528
Bank of America Merrill Lynch
3
100.0
12.0%
AdvisorImputed Fees (US$m)
Market
-15.8%
6.8Rothschild
1▲32,508.010
41.5
+3Financial Advisor
15 35,667.10
533,082.0
Citi4Goldman Sachs & Co
28.5
13,145.4
▼
9.3
24,271.52
Societe Generale
7.6
-16.8
6,353.9
+9 Credit Agricole CIB2.7 ▲0.7 +3
2.045
+1
-958
▲12
▼
13.29,245.7
-24.6
5.0
410 6.4
3.7 3.7
147,543.2
15 6,206.03,716.4-16*
20
16*JayDee Partners Ltd
13
25*
Malayan Banking Bhd
2,698.72,023.2
-2619RBC Capital Markets
-BDO
Nomura 21
1.61.946
39
Macquarie Group 230.1
▼
0.1
▲Industry % Change from Last Quarter
Citi
Lazard
11
18
Evercore Partners
99,847.4
Societe Generale
22--
HSBC Holdings PLC
Industry % Change from Same Period Last Year
Deutsche Bank
24
Jones Lang LaSalle Inc
TD Securities Inc
12
18,377.7
20
6
52
8
2109
13,700.1BNP Paribas SA
15Natixis
24,749.211
▼▲
11▼
▲
1
3
100.0
29
103* 3,674.2
▲
▲▲
2▲▲
-21.7
1.7
▲
2.7
▲
▼▼▼
+5
Sh (%)3.9
# of Deals per Advisor
0.5
▼▼
0.51.01.6
Market
+4
# of Deals
0.7 -
-4
3+208
5
+1
+1 ▲
+3
▲-
+3
+3
Wells Fargo & Co
▲
UniCredit 325
23
1,146.21.7
0.8
10.524
4.73,716.44.7
2,819.7
-
8,363.26.24,963.4
6▲
+20+2
51
-5▼21
6▲
+1
30.8-3.2
▲40.2 ▲
+4
-7
▲ 3.5
▼+4
100.460.7 -1
0.40.5
0
4.234.3 3.354.8
▼▲
-5
2,211.2
Change in
-364
▲
▼
▲0.70.4
0.02.4
-
▼2.4
▼2.0
2.7 ▲0.3
▲0.83.42.12.6
▲
▲
1.8
5.1
▲2.4
▼
2.1
1.4
▼
▲0.3
0.1
▲0.11.3
0.00.1
-▼
▲
▼0.50.2▲
0.31.3
0.2
0.6
2,819.73.5
Duff & Phelps
Benedetto, Gartland & Co, Inc.
Industry % Change from Same Period Last Year
1,333.5
-12.8
-10.0
1
17.3 1▲
27▲
-11.1
22.4
30
-41.5% ▼
MarketSh (%)
65.736,377.4
44.7
US$m
Industry % Change from Same Period Last Year
52,449.7
263,042.5Industry Total
11.9
▲4.3 ▲
1
# of
1,943
-10.512
54,683.1
16
0.3-4.0
66
▼
-10.0%
Rank Value per Advisor (US$m)
US$m
-58.1%
▼
5
11▲
+3▲▼8
9
▲
1.6 ▲1.1
2.1
▼
-5.5%
7
33.9Deals
Market
-14.3▼-0.6
27
Share Ch.
40,730.5
Rank Value
Any French Involvement Announced (AD33)
▲
▼
Rothschild
3
34.6%
0.7-2
Credit Agricole CIBMorgan Stanley
54.8
▲
2 3
Industry Total
Financial Advisor
Industry % Change from Same Period Last Year
2015 Rank
Industry % Change from Last Quarter
107,914.5
Market
▼
Jan 1 – June 30
-215100.0
▲
34
▲
+1
▲30
14
JP Morgan
Deutsche Bank
Lazard
109
Barclays
11*
Industrial & Comm Bank China2018*18*
Natixis
▼
JayDee Partners Ltd
15Zaoui & Co
Malayan Banking Bhd
71311*
1317
234
-16
36
21*
▲
35
21*
0.2
0.30.51.8
HSBC Holdings PLC
3,716.4
1
8.6
5.3
24.3
Morgan Stanley
-
6
Sumitomo Mitsui Finl Grp Inc
BNP Paribas SA
2015 Rank Sh (%)
▲
4
Industry % Change from Last Quarter-17.9%
Share Ch.
258.9 6
717.2▲
6 45.6
Deals
29.624.3
18,994.722.4
13,779.614,114.2
17.3
23,643.6
17,911.2 22.4
4.7
1
+14
1,471
▲4.7
▲
79,817.5
0.3
0.2-134
-8.3%▼ ▲
Market
https://www.thomsonone.com
t e
Visit http://dmi.thomsonreuters.com to view archives and order custom League Tables
11
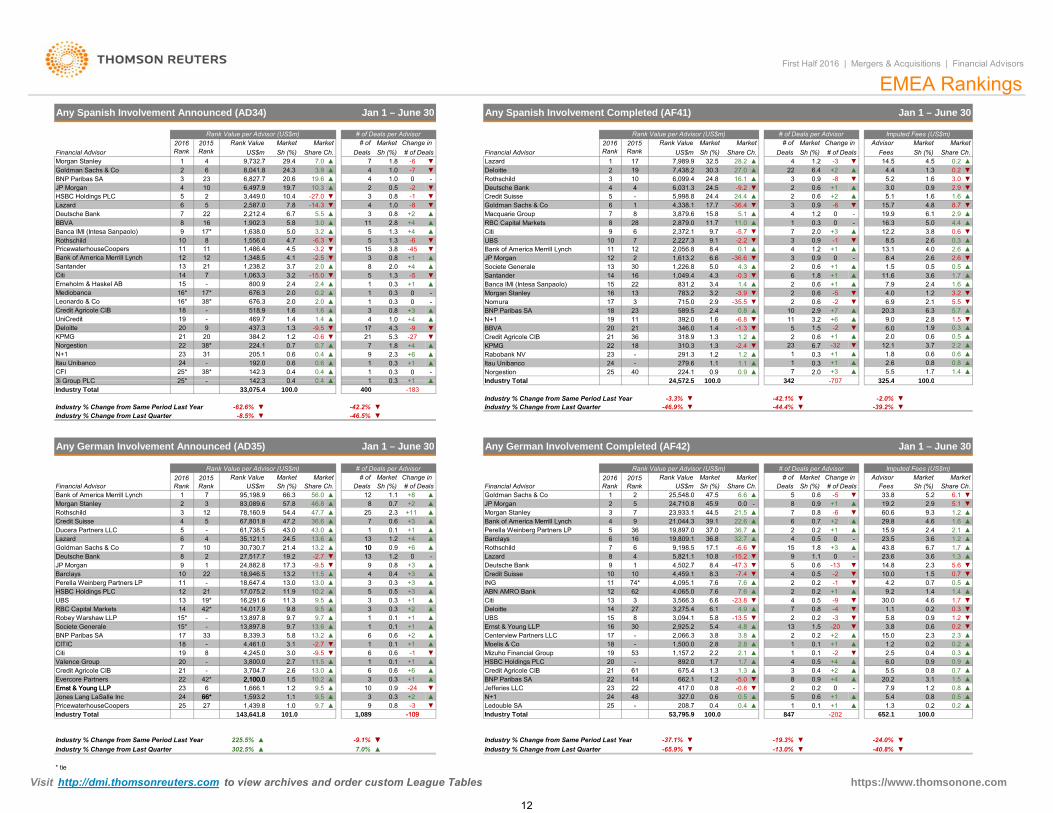
Rothschild UBS
▼
0 4 ▲ 1 0 3 +1 ▲0
+4+6+1
3i Group PLC 25* 142 3 0 4
▲▲▲-
1.10.9
▲
▼▲▲▼▲--▲▲+4
-9-27 ▼
0.30.3
-45+1+4-5
+100
+30.81.04.35.31.82.39
11
3.80.82.01.30.30.30.31
34
1721
7
1538511
▼▼▲▲▲▲0.4
▼▼▲▼▲▲▲▲▲1.4
-9.5-0.60.70.40.60.6
0.4
-3.2-2.52.0
-15.02.40.22.01.61.6
1.41.31.20.70.6205.1
192.0142.3
4.54.13.73.22.42.02.0676.3
518.9469.7437.3384.2224.1
1,486.41,348.51,238.21,063.3
800.9676.3
92038*31-
38*25*
1112217-
17*38*
--19
2021222324Itau Unibanco
CFI
111213141516*16*18Credit Agricole CIB
UniCreditDeloitteKPMGNorgestionN+1
PricewaterhouseCoopersBank of America Merrill LynchSantanderCitiErneholm & Haskel ABMediobancaLeonardo & Co
2.0▲▲▲▲
12.11.8
▼▲
▲▲
0.30.52.20.60.81.4
2.65.5
1.90.63.70.60.81.7
▼▲▲▲
-2+1-32+1+1+3
23117
1.50.66.70.30.32.0
1.31.31.21.10.9 ▲
KPMGRabobank NVItau UnibancoNorgestion
213618--
40
1.2-2.41.2
346.0318.9310.3291.3279.6
1.4202122232425
BBVACredit Agricole CIB
224.1
30
8.4 0.1
First Half 2016 | Mergers & Acquisitions | Financial Advisors
# of Deals▲
MarketSh (%)
0.2Share Ch.
Change in
▼Fees
1.63.0
Advisor
▲ 0.9 2.9
Imputed Fees (US$m)
14.50.2
▼▼
4.819.9
5.18.7
0.9 ▼-86.422
▲▼0.9
1 --▼
0.6
4
+2
0.5
1.34.4
2.9
▼
▲
▼
-61.2
1.6 ▲
▼
2.4
5.76.3
3.2
▲
1.25.5
EMEA Rankings
Market
5.2
1.6
+2
+1
▲-3
# of Deals per Advisor
Any Spanish Involvement Completed (AF41)
6.1
4.5
1.6
▲▼
3.0
Jan 1 – June 30
15.7
▼
1.7▲0.5
▲
▼2.6
2.6
▲
0.6
▼1.59.0 2.8-1.3
342
6.0▼▲▼▲
52
▲2,227.32,056.8 +1
▼▲
4
4.3
-5.7
3,879.6
12
6
10
4,338.11
2,372.1
1,226.8 5.0
11.7
16.1
▼2,879.0
▼
5,998.8 24.4 24.4
▲
-2.2
▲
▲
▼ 3▲ 2
Deals
2
Share Ch.32.5
Market
▲
MarketSh (%)Sh (%)
1.2
# of
28.2
2015 Rank
Rank Value per Advisor (US$m)
▼
▲
▼
# of
1,638.0-6
0.82.8
6.7
▲5.81,902.3
54.7
Change in MarketFinancial Advisor
Morgan Stanley
# of Deals per AdvisorMarket
Lazard 7,989.9
JP Morgan 12
+4
-20.8
▼Citi
0.5
1.8
Goldman Sachs & Co-8
15
Societe Generale14
Banca IMI (Intesa Sanpaolo)Santander
13
7▲
210
Banca IMI (Intesa Sanpaolo) 910
8BBVA 16
8
19.73
20.6 ▲19.6JP Morgan 4
5 10.4HSBC Holdings PLC
3.9
# of Deals29.4
6 ▼-7-6
Share Ch.
1.07.0 ▼
Sh (%)7
Sh (%) DealsMarket
41
Market
▲
Rank ValueFinancial Advisor
Any Spanish Involvement Announced (AD34)
US$m2015 Rank
2016 Rank
2,587.02,212.4
67
Lazard22Deutsche Bank5 7.8
BNP Paribas SA
Morgan Stanley
9,732.7▲24.3
3,449.0
BNP Paribas SA 3Goldman Sachs & Co
Rank Value per Advisor (US$m)
423 6,827.7
6,497.9
-14.3
2▲
8,041.8
1,556.0
24
▼
3.0
10.3▼
3.2
Jan 1 – June 30
▼
Deloitte
+2
Deutsche Bank
Macquarie Group▲5.5▲ +4
5-6.3▲
RBC Capital Markets
1.35.017*
01.0
-27.0
1134 1.0
-1
19
4
8
5
102
24.830.3
6,099.427.0
171
2016 Rank
1.3 9
11
-
8
10
▼
6Credit Suisse
-
N+1
715.018
11Bank of America Merrill Lynch
3Rothschild
1.4 ▲0.60.6
-2
+611 3.2 ▲
7
-9.2
-36.45.1
17.7
11.0
24.5
▲
US$m
00
-13
3
6.61,613.2
3.4
7
4
9.79.1
6,031.3
28
17
15.8
Rank Value
7,438.2
831.24.3
22
231.6
16
0.6▲
3▼
2.6
0.30.9
4.4
13.1
16.3
▲
▲+30.32.0 12.2
8.51.2
4
2.63.85.0
11.6
4.08.4
▲
-5
▼ +1 ▲
0
▼
6+1
-
2.1▼
1.52
6.9
3.6▲
0.6
0.6
▼▲
22 +1
20.3▲
4.07.9
-36.6 0.9▼▲
3
16 -0.3
2
1,049.4 1.8
-35.513
2.4
3.2783.2
2.92.9
-3.9
589.5 0.8-6.8 ▼
Nomura
19 392.0
2+7
Industry Total 24 572 5 100 0 707 325 4 100 0
Industry % Change from Last Quarter
Barclays Credit Suisse
HSBC Holdings PLC
Industry % Change from Same Period Last Year
0.4 ▲ 1 0.3 +1 ▲3i Group PLC 25 - 142.3 0.4
-39.2%
3
-44.4%
21
8
1,157.2
▲+1
16
+10.6
▲
+2
▲
+1
11
13CitiDeloitteUBS
12INGABN AMRO Bank
-3.3%Industry % Change from Same Period Last Year
0.025,548.0Goldman Sachs & Co 47.5
-46.9%
21
Rank Value per Advisor (US$m)
▼
Jan 1 – June 30
Imputed Fees (US$m)
5.2
MarketShare Ch.
▼
▲
▲
3.6
9.3
▼
1.2
▲
▼2.9+1
FeesAdvisor Market
4.6
6.1Sh (%)
5.1
1.6
33.8
0.7 ▼
▲▼5.6
1.31.7 ▲
▲
19.21.2
▼▲
▲2.1
342
Deutsche Bank
62
8
1
14
▼
0.9101.2
74*
910
-
▲
Morgan StanleyJP Morgan
Perella Weinberg Partners LP7
▲
3
+1
+30.40.3
0.3
1
0.8▼
+2
+3+3
0.6
▲
1
+30.55
▲
▼Moelis & Co
Jefferies LLC+2
+1+6
▲+1▼ 2223
61
Ledouble SA 25
22-24 417.0
327.0▲ ▲
-109208.7
48▼9 -3
24
7.0%-37.1% ▼
Industry Total▲
N+1
▼
0.8 - 0.453,795.9 652.1
▼1.2▼
▲
2.3
0.3
▲
▲0.9
0.8
1.1
0.3
0.2
0.2
▼
0.2
0.9
▲
▲
100.0
0.8
0.8
▲
1.3
0.2
▲
▲
0.1
0.57.95.4
0.2
0
+1
▼
▲▲
-65.9%Industry % Change from Same Period Last Year ▲225.5% ▼-9.1%
10
▲13.2▲
0.6
13.21
▲3
0.31.1▲
1,089
0.9
36.6 ▲
847.7
0.6
▼
46.8
1.2
13
25
0.3
4
0.1
0.3
6
6
0.13
3
1
Sh (%)
400
# of Deals per Advisor
-46.5%
Change in
Jan 1 – June 30
# of Market
+2
-183
2.3
# of DealsDeals56.0
-42.2%
Share Ch.12
24,882.8
13.6
+11 ▲
▼
▲▲
-
14,017.913,897.8
17,075.2
▲
10.2
27,517.7
18,647.4
9.5
-2.7
3.0
42*
9.713,897.8-
9.819*
9.7
9.5
Industry % Change from Last Quarter
16,291.6
42*
4,245.08
10.2Credit Agricole CIB 21
1,439.8Industry Total
Evercore Partners
▲
Ernst & Young LLP 1,666.12322
Ernst & Young LLP2,100.0
272566*66*Jones Lang LaSalle Inc
143,641.8
302.5%
1.5
1.0101.0
6 1.2
▼
1920
2.6
▼
13.0
2113
-3,704.7
CITIC 18 4,461.0
Valence GroupCiti
▼Ernst & Young LLP 30
3.1 -2.7
HSBC Holdings PLC
Societe Generale 15*15*Robey Warshaw LLP
BNP Paribas SA 17-
33 8,339.3
3,275.4
-
▼
▲
1-9.5
3,800.0
RBC Capital MarketsUBS
14 ▼-23.8 0.5
9.5 ▲
▲0.2
▼+1 ▲
30.0-9
61,738.535,121.1
1.71.4 ▲
0.5
4.61.4
0.7
▼
Goldman Sachs & Co 21.4
-67,801.8
▲
13.0-18,946.5
17.3 -9.5
▲46
10 30,730.724.5
2Deutsche Bank
11.3
19.27
JP Morgan 198
11.9
22Perella Weinberg Partners LP 11 13.0
5.813.6
11.5
9.7
10
9.7
▲
▲
60.1
11.5 ▲
▲
▲
0.1
Credit Agricole CIB
Market
4,459.1
6
10
+4
▲
18
12 ▲
Industry % Change from Last Quarter
2,100.0
2.7
15
Centerview Partners LLC
0.1
7.6
8.3
3,094.1
10.84,502.7
2,925.2
7.66.63,566.3
+6 Rothschild
4.9
4,095.1
0 4
4,065.0
10▲
▲+8
▲+1+3
1.10.7
▲
Financial Advisor
▲
▲
▲▼
7.6
2015 Rank
2
21.5
892.0
▲
BNP Paribas SA 14
13
PricewaterhouseCoopers9.5
▲
▼
-1
0.63
-109
1,593.224
847
▼
Lazard▲
▲9
Sh (%)
43.0
Rank Value per Advisor (US$m)
95,198.9
2015 Rank
MarketUS$m
278,160.9
412
13.2Lazard
3Morgan Stanley
5
57.83
Ducera Partners LLC 43.05 47.2
100.033,075.4
Rank Value
▼Industry % Change from Last Quarter
83,089.6
-62.6%
7
Industry Total
-8.5%
2016 Rank
1Financial AdvisorBank of America Merrill Lynch
Industry % Change from Same Period Last Year
-13
0.4▲
20.2
6.0
-
▲+4
-24.0%-40.8%
-202
1.50.7
3.15.5
1.2
▼ 2.3
1.22.5
0.6
1.5
15.0
0.9
2.33.8
0.2
9.2
5.8
-2
15.9
23.6
29.82.4
60.6
23.543.8
3.66.7
14.8
0
-3
▼+1
-20▲
▼▼
+2
-42.1% ▼
-1 4.2▼
-6+2
-
10.0
▲1.1
Barclays
Share Ch.
▲
-58
-
Any German Involvement Completed (AF42)
+1
▼▲
▼-20.5
0.744.5
▲
7
Rank Value
3
Sh (%)2016 Rank
Market
45.96.6
-▲
24,710.8
39.119,897.05
923,933.1
Market
37.04
75
▲36.8
9,198.5
Bank of America Merrill Lynch36
22.6
716
▲21,044.3
▼
32.76 -6.617.1
19,809.1
5,821.1▼
-15.28.4
-20
▲19
▲▲
Mizuho Financial Group 53
17 -
6.15.8
1,500.02.2
-3.82,066.3
27
25.4
1
213
3.84.8
-13.5
▲2.8
▼
1.7
-5.0
1
2
4
662.1
▲675.4 1.3
1.7
▲
2.8▲
▲
1.2
▲0.4
▲
▲▼
1
0.250.5
-0.8
▲8 0.9
0.10.6
3 +2+4
0.4
+1
▼-13.0%-19.3%
▲
66.3
Any German Involvement Announced (AD35)
▲
Credit Suisse54.4Rothschild
▼
2.1
▲1.3
0.8
▼
+3
2
0
2
0.27
0.6
60.8
Change in # of Deals
5
-4
1.8
0.242
15
0.2
9
4
36.7
Market# ofDeals
5
0.6Sh (%)
4
0.1
100.0
US$m
0.5
0.9
1.5
7.6-7.4
-47.3
0.8
# of Deals per Advisor
▼
0.2
0.5
Industry Total 24,572.5 100.0
▼ ▼ ▼
-707 325.4 100.0
-2.0%
* tie
https://www.thomsonone.com Visit http://dmi.thomsonreuters.com to view archives and order custom League Tables
12

Equita SIM SpA Banco BTG Pactual SA
Vitale & Co SpA
2015 Rank
Banca IMI (Intesa Sanpaolo)
Rank Value per Advisor (US$m)Market
Jan 1 – June 30
# of Deals per Advisor
16
0.9
2.9
-
# of Deals
-2856
1.4
10
▼
Sh (%)
24.7
Rank Value
-10
1.1▼
Change in Share Ch. Share Ch.
2 18,571.150.2
Morgan Stanley19
1.1
+4
Sh (%)
17.6
5
47.3 ▲40.9 ▲
▼
24.22.9
MarketMarket
Any Italian Involvement Completed (AF43)
0.7▲ +1
▲
13
87
14
28.5+7
# of Deals per Advisor
Share Ch.
4*
11,184.2
▲
▲16.6
-3.723.824.211
16
▲
▲
▲▲
▼
▲
23.4
10,980.3
23.4
-5
1.69
4.2 ▲
Imputed Fees (US$m)
▼
▲1.024.6
▼
+57
0.5
43
+11
0.72.9
-4
4.7
▲
+40.42
+3+3
62.4
▲
▼▼
▲
5
1.624*
-18.5-27.22.2
-9
1.3 06
3.5
▼▼
0.21
7
26
2.66.0
▲
42.7
33.9
5.56.6 2.25.2▲
1.8
+1
+11
3.1
4
1.2
▲
▲0.4 +2
-20.2
15.4
+20.9
16.6
62
0.2
+17,788.8
21.2
15.4
5.6
6,715.4
4,325.2
17.2
11.0▲14.814.8
8.3-
6,985.3
▲
19 76
▼
5.6
-22.9
▲5.5
1,840.123UniCredit 2,472.718 18 2.4
4.1
Evercore PartnersMacquarie Group
2.4Credit Agricole CIBBanco Bradesco SA
25
21
48*24
362.8
-
542.723 -20
1,101.7590.022
▲
32*
Nomura
+711,159.1
15,991.5
▲
▼▲
512.6
20
Banco BTG Pactual SA
▼ 4
▲
1.3
▼
▼
▲ 1.1
1.1
# of
-36.1-15.4
▲▼
335*
16
3.8
-6.2
-20.5
▼▲
▼
8
4,233.6
18
1.6
33
UBS
12,412.6
193.9
24*
BNP Paribas SA
15
1,383.3
976.31,083.3
-
1,686.9Credit Agricole CIBHoulihan Lokey
KPMG
557
La Compagnie Financiere 723.8▲-Philippe Villin Conseil
44 097 5 100 0Industry Total3723.8
7.9
5.2-22.3-11.5
6.7
3.8
7.70.5
+88
Credit Suisse
1.6
10
2020
2223
21 45*
13 4.2
3.1
3,499.4-
Leonardo & Co 1,847.918Vitale & Co SpA 1,726.217
42*
UniCredit
162,934.715 7
11 2,939.6
2,298.4
12*
Nomura
5
14Colombo & Associati
Goldman Sachs & Co
9 24101112*
7
Citi
6,442.6
236
8 50
4,058.6
Lazard
Morgan Stanley
2
Rank Value
6
2016 Rank
Market2015 Rank Sh (%)
43.7 ▼2 19,273.2
-15.3
Rank Value per Advisor (US$m)
Financial Advisor
4Mediobanca
Any Italian Involvement Announced (AD36)
▼
Rothschild
3Itau Unibanco
7,044.3
4
US$m
3 13,939.8
5
EMEA Rankings
Deutsche BankBank of America Merrill Lynch
11,184.2 25.4 25.2
2.4
14.5
9.6
16.015.8
10.44,593.2
6.7
9.2
2.5
2.1902.61.6
Market
3,499.4
4.414.6
▲
3
2
7.9
-33.6
-0.3
18
31.6
First Half 2016 | Mergers & Acquisitions | Financial Advisors
19
Deals
▼
▲3.2
▲
-
Industry Total
1,724.8
17,126.422,777.6
Financial Advisor6.4
Jan 1 – June 30
1
3
6,974.91
2016 Rank
▲+24
▲
Deals
1.6
0.9
0.7
+2+8
1.10.6
+2
+2
▲
0.811.6
7.6
9.1
1.11.5
8.9
6.6
6.2
4.8 2.1
▲
+30 447 3 100 0
-
▲1.0
▼0.3 2.2
3.4
▼
3.5
1.2
-
▲
3.5
15.0
0.2
-+6
-2
1.3
2.0▲
26.8
21.6
Advisor
▲Fees
▲
1.25.1
29.5
▲
11.8
▼
▼27.6
▲▲
1.8
▲
3.40.2
▲0.9▼
1.5
▲0.2
▲0.4▲
2.0
▲0.00.2
▲
0.62.9
0.8--
Sh (%)# of Deals
▼
▲
4.5
8.2
2.0
15.9
▲
▲0.8
-
▲
2.6 1.3
5.60.2
1.0 ▲
5.51.3
-
US$m Sh (%)Market # of
35.28.82▼
▼ Mediobanca
1Bank of America Merrill Lynch
83
Market
3
Market
▲
5▲
1.8
1.3
1.6
32*
-3▲
-
Deutsche Bank
-3
▼0
Citi
+29 ▲▼
9.53
8.7▲10.4
115
3,421.813
0.0120.0
7.5
4,723.8
+83.3
▲2,527.4 -8.4
▲▼
▲2,551.014
44845 374 9
39
1.3
0.8
+5
0.7▲
3
+11▲
5.1
100 0
1.20.6
3.82.4
1.3 ▲+3
0.2
211
0.200
3.1 -517
3.83.6
1.2
4,997.2
Banca IMI (Intesa Sanpaolo)
14
9
23
12
7
13Barclays
HSBC Holdings PLCRothschild 16
BNP Paribas SA 31
-
7.9 -35.1
▲▲
-30.1
-2
8UBS
▼0.50.4 JP Morgan
11BDT & Co LLC
7
15KPMG
-
1
▼
0
65
10+3
0.5
38.8
28.2
▼-12.1▲9,638.6
10,795.0
Change in
LazardItau Unibanco
2 ▼3
▲
▲
▲
-8
-
-20.9
+1
+3+4
+22
▼
0.49
Credit Suisse
0.90.2
5
-4.5-3.9
1.1
▼-0.8
0.8
+10.4
1▲▲
0.4-
+10.2▲ 1.7
.8
Industry % Change from Same Period Last Year ▲
Pangea Property Partners AB Societe Generale
Industry % Change from Last Quarter
▲113.9%
-59.7% ▼ -17.1% ▼ -36.1% ▼
2.039
▼
15
▲
5.35.6
5
16.5
▲
0.1
1
17.0
3.0
40.0
▼
▲40.1
39.4
Danske Bank 21Evercore Partners
UBS
PricewaterhouseCoopers
KPMG
Industry % Change from Same Period Last Year
222324
629.8
9
34,950.9
1.9
▲
William Blair & CoGCA Savvian Group Corp
Deloitte 20▲ 2.2
▼▲
1.91.1681.2
-8.1 0.9
▼Industry Total
2
25
▲
▲
▼-14.3%
754100.01.8 0.7
-3
-0.4% -10.8%
+1
+1-10
▲
▲
0.32.30.4 ▲
▼-15.2
3671.8 1.9-4.5 17677.2
6
▼
▲12.0
-5▼ 0.8 5.8▼ 7 6.9
+3
1,630.6
22▲
2.9 +11▲
4.7 -32
3.1
▼
2.3
Rothschild 0.51,783.53
19 51 803.1 2.3
14.0 0.61.0
14.5 2.1
5.0
2.9▲+10.4
-12.5
4.1 ▲4.14
+2
5.1
0.3 ▲
1.2▲
▼
▲0.32
1,417.62.4
+1
▼-2
7.1 ▲▲
4.6 ▲
0.80.7
▲1.6
5
▲7
▲12
0.9
3.1
751.7
54*
1,079.7
62.2
54*
2.036*
1.8
764.5
▲
Rank Value per Advisor (US$m)
18.8%▲
Financial Advisor
-32.0%
US$m2015 Rank
▼
Sh (%)
Industry % Change from Last Quarter
Rank Value per Advisor (US$m)
Any Nordic Involvement Completed (AF44)
FeesDealsChange in 2016
RankMarketMarket
11
557
# of Deals per AdvisorMarketMarket
-1.8%▲
44,097.5 100.0Industry Total
▲
▼7.6%
Industry % Change from Last Quarter
+1
Change in
25
0
Jefferies LLC-2
▲
Credit Agricole CIB
SEB
-
Moelis & Co
0.3
Goldman Sachs & CoCiti
Credit Suisse
+1
0.3
Zaoui & Co▲
▼
▲7*
▼
Ernst & Young LLP
CIMB Group Sdn Bhd
12
16
39.4
39.4
1514
34
7*
13 211,844.2
2,959.21,940.3
54*
127*
--7*
7*-
14,596.66
4
13,779.6
13 14,823.4
▼
-1
+1
10
54*17
41
-18▲
1.3
0.6
0.6
33
0.6
140.5
1
-1
1.40.4
+4
6
▲
4
0.1
+3
+2 ▲-1
▲Industry % Change from Last Quarter
5
▲
▲
0.6▲+3+3
-1+1
▲
7
▲
0.6
+3
+1
▲
4
14,183.9
Market
Jan 1 – June 30
28.1
+88
2016 Rank
Any Nordic Involvement Announced (AD37)
US$mRank Value2015
RankFinancial Advisor
Industry % Change from Same Period Last Year
19.7
27.6
Sh (%)
139.5%
-37.0
-14.9
-21.517.019.7
26.8
4,943.5
▲
▲▼
8
-11.6
8,600.0
9,955.224.9 5.0
9,917.1
14.6
19.7
3.8
▼
-32.2
▲-25.4 ▼5.9
0.1
5.93,013.3
2,961.0
5,197.32
3,554.6169.8
5
4
▼
+3
+2
▲
15
+2
+4
▼5.6
3.5
17.0
56.0
-45.6
9.2
▲
3.7
4.3
# of
7
▲▼
▲
DealsShare Ch.
▲0.7
12 1.1
JP Morgan
1.0Lazard
2.6
2.5
-12.9
0.4
2.6
0.43
1.8
▲
0.3
2.8
2.5
2.7
100.01.8
▲2.5
7
1.82.0
▼
9.20.4
▲1.4+4 6.7
100.0499.2
0.6▲
▲
▲
▲+2+10.7+1
▲1.0
▲
▲36.9
39.4
1▲ 1.8
11.04.8
▲39.4
▲
1.5
5.20.5
5.2
▲2.0
0.5
10.5+5+2
18.752.5
▲
▲
1.0 ▼2.2
3.10.5
▲0.6
2.20.4
-3
0.1+1+1
0.1 0
00.1
13,779.613,779.613,779.613,779.6
39.5
1
▲
139.439.4
▲
Sh (%) # of Deals7
39.4
39.4
41.8
38
Rank Value
13,798.1
▲49.7 +1
▲
Sh (%)
-14
Morgan Stanley 1 17,352.6
Industry Total +30
+9
3
1.2
447.3
1
# of Deals
4
6.6
5.4
▼
100.0
Imputed Fees (US$m)
Sh (%)Market
0.2
1.4
1.6
▼
1.3
▼
1.5▲
▲
▼
0.5
2.3
▲0.6
0.7
1.40.1
2.8
▲
2.4
▼
0.53.8
0.5
0.50.4
0.40.4
▲
▼
▲
Share Ch.▲
1.6
▼
▲8.31.7
Jan 1 – June 30
MarketMarket
▲ 38.6%
2.126.8
Advisor
47.7
-17.1%
616,656.7
# of
448
# of Deals per Advisor
45,374.9
Share Ch.
2.50.3
2.5
1,085
0.1
1,320.3
1,257.70.1 +1
311
0.3
▲1,276.7
▲ 3
▲▲
1,249.150,465.2
25 34
23.5%14.5%
+85
13.6%
Moelis & Co
N+1
China International Capital Co
Danske Bank
-
21
2324
56
Nordea
Jefferies LLC
--
22
Ernst & Young LLP16 6
ABG Sundal Collier20
12,566.3
UBS
11
1,844.21,763.5
7*
42,989.7
13
JP Morgan
Morgan Stanley1 24
10.3
Rothschild
7The Raine Group LLC
SEBBank of America Merrill Lynch
13,936.42
-
42
9
33
10
7*
6
35
Credit Suisse
15Deutsche Bank
Arctic Securities ASA
412
Citi
12Lazard
Goldman Sachs & Co
1,915.8
118
2,143.5
1372*
1718
21-
1,880.9
Industry % Change from Same Period Last Year
19
Perella Weinberg Partners LP
3.3
8.5%
Centerview Partners LLC -
7,379.38
5
14
Carnegie
2,133.3
1,393.41,641.9
3.5
3.8
+2
3.7 2.0
4.2
17.6▲
▲
▲
1.3
▲▲
1.8-
7.319.2
▲
25.82.5
11.6
3.0
▲
-29.7%
6
42.4
▲
3.5
▲▲
-31.63.3
2.5
8.5
0.1
0.5
0.6
Deutsche Bank
15
5
▼
2
100.0
7.2%
48.5
37.1
41.516,946.2
Industry Total
▲
+2
▲▲
+3
▲
▲
7.0
3.7
Bank of America Merrill Lynch
▼
4
6
▼
▲
+1
▼
▼
https://www.thomsonone.com * tie
Visit http://dmi.thomsonreuters.com to view archives and order custom League Tables
13

China Construction Bank Guggenheim Securities LLC11.5
-0.6▲
▼1
3.223
-1.7
1,209.5
.7
0.6
0.9
974.7
1
▼
▲
11
1.1
-11.1
9
1.4
1 0.1
-4.1
# of
▲
▼
-10
+2
-1
Share Ch. Sh (%)1.656.9
10
1 0.12.3
11.52
32.9
38.5
32.9▲
+1
▲
3.2 ▲
1▲5.2
1 0.1
129,224.3US$m
Any Benelux Involvement Completed (AF47)
81.8JP Morgan 5Financial Advisor
-
▼
11.5
73.3
51.3
12 19
2
12+1
Goldman Sachs & Co▲ Bank of America Merrill Lynch 4 121,504.8
▲-2
▲
9.9Citi
13*
18,148.5
10* 18,108.5
918,108.5 11.5
11.5
▼ 1
2.3
7
Credit Suisse0 -
Jefferies LLC
Centerview Partners LLC1
0.6
ING0.1
Vitale & Co SpA1.7
▲ 10.3
▲
0
100 0946 249100 0Industry Total 157 930 7122-4▲
708
▼-3.2
20.5▼
311-1.7
0.1 0.3
0.4 ▼0.0
1.10.4 -
▼
▼-1 0.20.30.0.1 -▲+1
▼▲
▼
0.3
-20.0
+4 4.01.60.4
-111 +1
▼
3.1
2.92
▲
-5+8
0.60.1
4
▲
▼
▲
4
16
7
▲
Market
0.3
51.3
1247.1
55.6
76.9
11.5
▲
Rank Value per Advisor (US$m)2015 Rank
Rank Value Market Change in
▼ 85.9 9.1
Imputed Fees (US$m)
Deals
78.5▲
3.78.3▲
# of Deals per AdvisorMarket
+2
# of Deals
▼▲
51.7
-12.5
Rank Value per Advisor (US$m)
Share Ch. Sh (%)1
# of Deals
# of Deals per Advisor
Jan 1 – June 30
First Half 2016 | Mergers & Acquisitions | Financial Advisors
62,176.2
Market 2016 Rank
Market
58.8 55.5
Sh (%)Market
46.6
▲54.6-23.6 ▼
Deals
▲
0.20.348.2
50.8
44.846.6
47.7
0.1▲▲▲
Barclays
0.6
▲ 2 0.20.5
-
15 17
+10.1
-9
+1 PJT Partners LP
8+1
▼-45.5
1.1▼
Rabobank NV
9.014,239.2
1,719.0
63
15
-0.70.92120 1
▲13* 14,239.2 9.0
15,700.4
0.9
0.6
2,740.1-
1,386.30.9
27
5621 0.7
172231
19
22
1,485.8
0.81,106.4
UBS2423 20
▼Deutsche Bank
+21,379.2-
25
Industrial & Comm Bank ChinaWestern Securities
▲
▼
+10
NIBC NVDeloitte
-
▲
5
-3+1
-60.6
16
0.10.2
1.8 -6
100 540 7
1,719.02
▼878
1.5 -4.3100 0
2,437.7 5
1.70.6
0.2
2.0▼
12.0 ▲2,036.6
3.5▲
1,536.7
-50.7▼
2▼
6
▲
▼ 3.1▼
▲0.8 +1+7-50.7
▲
27 4,000.0 2.55,072.4
18
3.2▲
ABN AMRO Bank 16▲
▲2.5
0.32 -1
18
▼10.0
▼ 24.011.3
0.1 7.2
0.4
-
0.1
.7
1.6
32.5
0
1.1
1.72.2
+1
1.8
▼▲
▲
0.80.8
0.1
1.1
1.3
▼
▼
5,568.7
-6
▲+4
-
54.27
-3
-10.32.9
▲
▲ ▼
▼
▼
37.74.46.2
▲
33.1115,712.6
1.061.623
24.397,243.887,801.6
1.7▲
11.1
AdvisorFees
Market
104.5
▲
▲
5.2
▲
▲0.3
14.0
9.3
2.6▲
▼
0.3
▼
22.2
20.1
0.9▲
2.1 ▲
0.4
▲0.1
1.1
▼
1.2
▼
▲
▲
3.5
Share Ch.
1.8 ▲
7.1 ▲
Jan 1 – June 30
Sh (%)
▼ 1.3
▲6.5 ▼
4.4
4.8
10.0
88.4
41.7▲58.6
12.6
2.4
1.3
8.61.5
1.34.0
0.3
▲
▲
BNP Paribas SA▼-
Rothschild
8
6Robey Warshaw LLP 81,009.7
10*
3
6
9
4
85,561.5
18,219.77
5
32Morgan Stanley
Lazard+1-12
▲+2▲+4
▲▼
+3
-6+1
Market
▲▼ 1.3
0.9
47,916.83
▲
59,087.7
48,416.8
44.246.48* 19 46,596.5
47,316.6 47.147.7
61.8
Rank ValueFinancial Advisor US$m
EMEA Rankings
Sh (%)2015 Rank
1Goldman Sachs & Co
Change in
6
11JP Morgan
3
5
13
2016 Rank
4
1UBS
91*2
Credit Suisse2
Any Benelux Involvement Announced (AD40)
China International Capital Co
N+1
+7
1.3 -4+1CITIC -7
+5
Industrial & Comm Bank China46,869.0
8
-
8* -
LionTree Advisors LLC 6.4
8*8* -
-
13 54.4
46,596.5Dyalco
14*
46.4
8,957.546.4
46.4
8.946.4
91*
BarclaysVitale & Co SpA
Lakeside Capital Advisers LLC
20
17
Lazard
14*
8*
24
Robey Warshaw LLP
Rothschild
Industry Total
23
20
Sycomore Corporate Finance SAS
21
6
4
Morgan Stanley
Greenhill & Co, LLC
Citi
4,642.3
6,042.3
Deutsche Bank
16
Evercore Partners
8
7
22
1819
38
24
-
3
Bank of America Merrill Lynch
4.14,092.5
10
-66.2
-65.6
-25
3,420.0
6,408.8
6,021.4
46,596.5
6,408.8
46,596.5
54,900.7
46.4
0.9
-10.2
6.0 4.5-48.3
2.4
6.4
3.4 3.42.8
-48.4
▼
▲
3.2
46.4 46.4
2
▲ 1
5
▼1
▲0.5
0.11
0.1
▲
40.1
2,800.0
46,596.5
4.66.0
1.10.3
17HSBC Holdings PLC4
▲
# of
811
46.4 1
Quarterly EMEA Cross Border Volume
-19.8%
100.0
-10.2%▼
946.2
-51.7% ▼▼
-49100.0
-13.4%▼
Industry Total
69.1%
157,930.7-122 708
▼▲▼
▼-5.2%Industry % Change from Last Quarter
-32.1%▼ Industry % Change from Last Quarter-2.7%
Jan 1 – June 30 2016
Industry % Change from Same Period Last Year-67.4%-59.9%
* tie
Industry % Change from Same Period Last Year ▼
100,540.7 878100.0Industry Total
EMEA Inv. Announced M&A Target Sector by Value ($bil)
$135.5
$70.0
$69.3$58.4
$49.0
$48.9
$37.5
$23.7$22.6
$17.9 $16.7 $13.5
Materials Industrials Financials
Energy and Power Real Estate Healthcare
High Technology Consumer Staples Telecommunications
Retail Consumer Products and Services Media and Entertainment
Government and Agencies
`
0
500
1,000
1,500
2,000
2,500
$0
$100
$200
$300
$400
$500
$600
$700
2 3 4 1 2 3 4 1 2 3 4 1 2 3 4 1 2 3 4 1 2 3 4 1 2 3 4 1 2 3 4 1 2
2009 2010 2011 2012 2013 2014 2015 2016
# of
Dea
ls
Ran
k Va
lue
(US
$b)
Inbound (US$b) Outbound (US$b) Number of deals
https://www.thomsonone.com Visit http://dmi.thomsonreuters.com to view archives and order custom League Tables
14
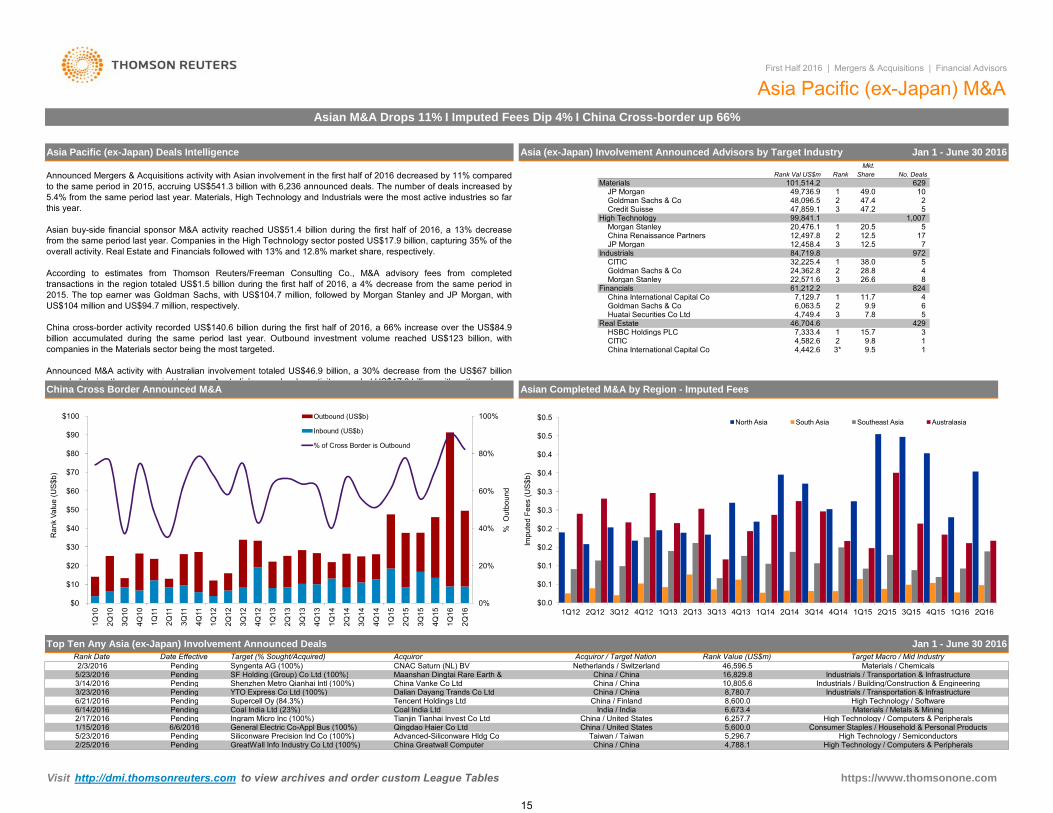
824
Goldman Sachs & Co7,129.7 6,063.5
China International Capital Co 11.7
46,704.6 53
4169.9
429 37,333.4
24,362.8
China Renaissance Partners
84,719.8 IndustrialsCITIC
Jan 1 - June 30 2016
4
12.5
10
47.22
5
No. Deals
Asia (ex-Japan) Involvement Announced Advisors by Target Industry
3
972
3
1712.53
20.5
38.028.8
2
7
226.6
5
1,007 1
5
Huatai Securities Co LtdReal Estate
8
2
47.4
Announced Mergers & Acquisitions activity with Asian involvement in the first half of 2016 decreased by 11% comparedto the same period in 2015, accruing US$541.3 billion with 6,236 announced deals. The number of deals increased by5.4% from the same period last year. Materials, High Technology and Industrials were the most active industries so farthis year.
Asian buy-side financial sponsor M&A activity reached US$51.4 billion during the first half of 2016, a 13% decreasefrom the same period last year. Companies in the High Technology sector posted US$17.9 billion, capturing 35% of theoverall activity. Real Estate and Financials followed with 13% and 12.8% market share, respectively.
According to estimates from Thomson Reuters/Freeman Consulting Co., M&A advisory fees from completedtransactions in the region totaled US$1.5 billion during the first half of 2016, a 4% decrease from the same period in2015. The top earner was Goldman Sachs, with US$104.7 million, followed by Morgan Stanley and JP Morgan, withUS$104 million and US$94.7 million, respectively.
China cross-border activity recorded US$140.6 billion during the first half of 2016, a 66% increase over the US$84.9billion accumulated during the same period last year. Outbound investment volume reached US$123 billion, withcompanies in the Materials sector being the most targeted.
Announced M&A activity with Australian involvement totaled US$46.9 billion, a 30% decrease from the US$67 billionrecorded during the same period last year Australia’s cross border activity recorded US$17 3 billion with outbound
22,571.6
12,458.4
Rank Val US$m101,514.2
Asia Pacific (ex-Japan) Deals Intelligence
Financials
49,736.9
61,212.2
9.5
629 1
99,841.1 47,859.1 48,096.5 Goldman Sachs & Co
JP MorganMaterials
High Technology
Mkt.Rank
49.02
Share
Credit Suisse
1Goldman Sachs & Co
JP Morgan
Morgan Stanley
20,476.1
4,442.6 4,582.6
Morgan Stanley12,497.8
1China International Capital CoCITIC
3* 1
15.7HSBC Holdings PLC
27.84,749.4
19.8
Asian M&A Drops 11% I Imputed Fees Dip 4% I China Cross-border up 66%
32,225.4
First Half 2016 | Mergers & Acquisitions | Financial Advisors
Asia Pacific (ex-Japan) M&A
Industrials / Transportation & Infrastructure
Top Ten Any Asia (ex-Japan) Involvement Announced Deals
Syngenta AG (100%)
Materials / Metals & MiningSupercell Oy (84.3%)
3/23/2016 YTO Express Co Ltd (100%)Pending
2/17/20166,673.4
Pending Ingram Micro Inc (100%) Tianjin Tianhai Invest Co Ltd
High Technology / Computers & PeripheralsHigh Technology / Semiconductors
General Electric Co-Appl Bus (100%) Qingdao Haier Co Ltd6/6/2016
Jan 1 - June 30 2016
Industrials / Building/Construction & Engineering
1/15/2016
6/14/2016
recorded during the same period last year Australia’s cross border activity recorded US$17 3 billion with outbound
Pending
Asian Completed M&A by Region - Imputed Fees
8,780.7China / Finland
China / China 10,805.6Industrials / Transportation & Infrastructure
Shenzhen Metro Qianhai Intl (100%)
Pending High Technology / SoftwareChina / China
Consumer Staples / Household & Personal ProductsChina / United States 5,600.0
Materials / ChemicalsDate Effective Target (% Sought/Acquired)
6/21/2016Pending Coal India Ltd (23%)
3/14/2016 Pending
Tencent Holdings Ltd
5/23/20162/3/2016
China Cross Border Announced M&A
CNAC Saturn (NL) BVSF Holding (Group) Co Ltd (100%) China / ChinaPending
Rank Date Acquiror / Target Nation Target Macro / Mid IndustryAcquiror46,596.5
Rank Value (US$m)Netherlands / Switzerland
Maanshan Dingtai Rare Earth &
6,257.7
16,829.8
Coal India LtdChina / United States
India / India
Dalian Dayang Trands Co LtdChina Vanke Co Ltd
8,600.0
High Technology / Computers & Peripherals
5/23/2016 Siliconware Precision Ind Co (100%)China / China 4,788.1
Pending Taiwan / Taiwan 5,296.7Pending GreatWall Info Industry Co Ltd (100%) China Greatwall Computer
Advanced-Siliconware Hldg Co2/25/2016
0%
20%
40%
60%
80%
100%
$0
$10
$20
$30
$40
$50
$60
$70
$80
$90
$100
1Q10
2Q10
3Q10
4Q10
1Q11
2Q11
3Q11
4Q11
1Q12
2Q12
3Q12
4Q12
1Q13
2Q13
3Q13
4Q13
1Q14
2Q14
3Q14
4Q14
1Q15
2Q15
3Q15
4Q15
1Q16
2Q16
% O
utbo
und
Ran
k Va
lue
(US
$b)
Outbound (US$b)
Inbound (US$b)
% of Cross Border is Outbound
$0.0
$0.1
$0.1
$0.2
$0.2
$0.3
$0.3
$0.4
$0.4
$0.5
$0.5
1Q12 2Q12 3Q12 4Q12 1Q13 2Q13 3Q13 4Q13 1Q14 2Q14 3Q14 4Q14 1Q15 2Q15 3Q15 4Q15 1Q16 2Q16
Impu
ted
Fees
(US
$b)
North Asia South Asia Southeast Asia Australasia
https://www.thomsonone.com Visit http://dmi.thomsonreuters.com to view archives and order custom League Tables
15
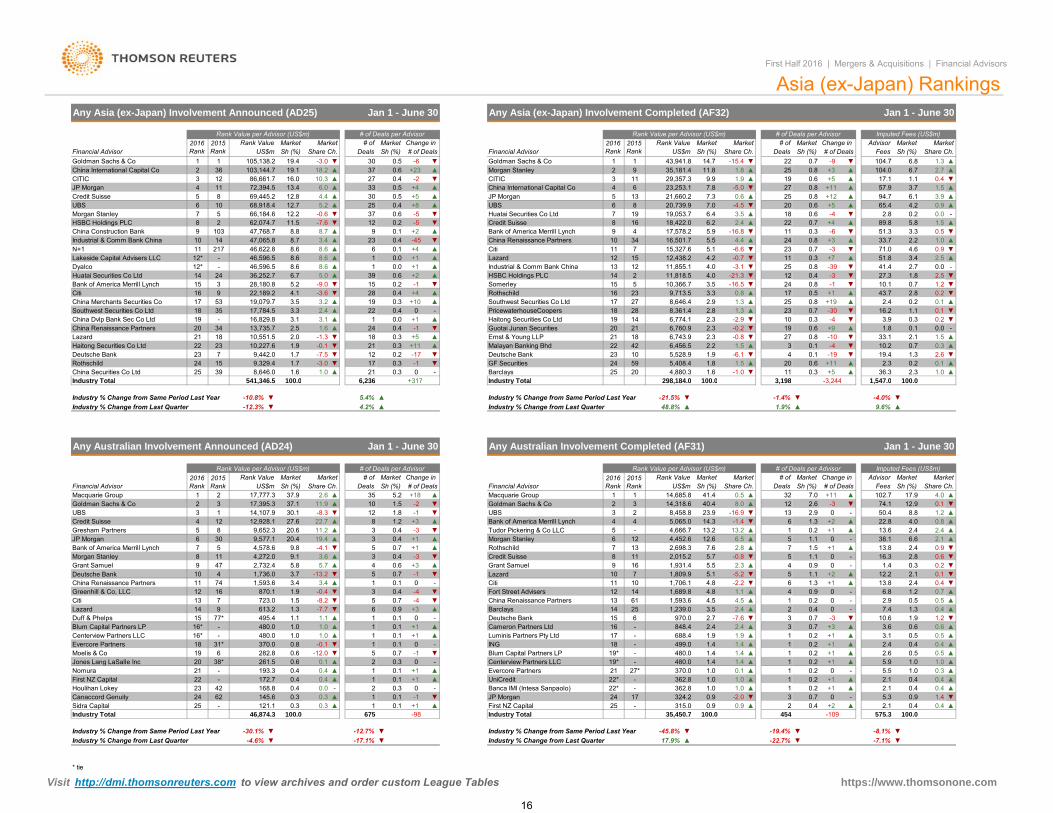
Industrial & Comm Bank China China Renaissance Partners
2016 RankDeals
103
+825
# of Deals per Advisor
9Credit Suisse
-5HSBC Holdings PLC 8China Construction Bank 9
-21.3Bank of America Merrill Lynch 15 3
Industrial & Comm Bank China
-16.516 9
8,646.0Industry Total
1.22.5
Sh (%)Market
39
▼
2.3
0.8
0.0
Asia (ex-Japan) Rankings
Citi
Jan 1 - June 30
0.1
2.5
First Half 2016 | Mergers & Acquisitions | Financial Advisors
Any Asia (ex-Japan) Involvement Announced (AD25)
25China Securities Co Ltd 1.6
Haitong Securities Co Ltd 22 23 10,227.6
▲13,735.7
0.3
100 0
1.81.61.0
+317▲4,880.3 ▲2.3 1.036.3
3 244100 0
59 1.5+511
0.620Barclays
24▼-1.0
▲0.3
-190.1▲ 20 +11 ▲0.21.7 GF Securities▼
6,456.5 2.2▼1.3
-117Deutsche Bank 23 7
-3.0Rothschild 24 15 9,329.49,442.0 2.6▼ 19.41.7 5,528.9-7.5 ▼ -6.112 Deutsche Bank
▲ 0.14
1.9-17
▼ 1.50.310
21 ▲-4 ▼ 10.2 0.73 0.3
-1.8-0.8 ▲▼ 27 0.8 -10 1.5
0.1Ernst & Young LLP
21▼6,743.9+5 ▲ 2.3
19-1 -0.2▼ 10▼ 0.6
0.3 ▼▲+9
0.0China Dvlp Bank Sec Co Ltd 16,829.8 ▲3.1 3.119 -0.11.1
0.3-417,784.5 PricewaterhouseCoopers3.3 2.4 2.88,361.4 1.3
Haitong Securities Co Ltd 14+1 2.319 ▼3.9 0.2▼0.70.4 28
-2.9▲0
China Merchants Securities Co 1716.2-3018Southwest Securities Co Ltd
19,079.7 3.5 3.235
0.8+10▼▲ 23
17 +198,646.4- 18
▲▲3.32.9 1.3
2.8▲ 2.4 0.10.225
43.7+10.2 5
230.4 0.8▼
0.522,189.2 4.1 1716 ▲▲28 +4-3.6 Rothschild
▼ 27.3-30.4 1.8 ▼12 ▼10.1-1
0.2 ▼24
▲▼0.728,180.8 -9.0 ▼5.2
Huatai Securities Co Ltd 14 24 36,252.7
12 15 12,438.2 4.2 -0.72.741.44.0
0.3▼
Lakeside Capital Advisers LLC▲ 1 0.0 25 0.8
0.0 +1 ▲ Lazard- 46,596.5
6.7 5.0
8.68.6
12* - 46,596.5-3.1 ▼121312* ▲
▼18.611,855.1
11 ▲+7 ▲ 51.8▲-39
3.40.9 ▼71.0
0.0 -
▲2.2▲ 33.74.6
1.0▼23N+1 11 -6.67217 5.111+4 15,327.6
10 14 47,065.8 8.7 3.40.16
24 +351.3
34Citi8.6 ▲ ▼ 0.7 -3
4.45.917,578.2 3.30.3 -6 ▼
▲ 0.8▼
-45
2 62,074.747,768.7
0.4-16.8
16,501.7▼ 10 5.5
6.218,422.0▲9 4+2 Bank of America Merrill Lynch0.1
12 2.4 ▲ 22 5.8 1.511 ▼
0.7 +4 ▲ 89.80.5
▲--4 ▼ 2.8 0.00.219,053.7Huatai Securities Co Ltd 7
160.6
80.2 -5 ▼19
25 ▲▲0.6
3.5 ▲20 0.6
0.618
6.1 3.9▲+5
6.4▲▼-4.5 65.4
94.7▲68,918.4
▼7.0
▲0.8 +124.2 0.9
5 21,660.2 7.3UBS 8
1320,739.96
Credit Suisse 5 8 69,445.2 12.8+1127 0.86 23,253.1 ▲▼
1116.0 ▲33
10.36.0 4
3▲-5.0 1.5▲ 7.8▼▲
3.757.9+5 0.4
▲2.70.8 +3 ▲ 104.0 6.79.9
35,181.40.6 1.11929,357.3 1.9
▲17.1▲
-3.0 0.5309
-15.4▲ 2Morgan Stanley 11.8 1.8
14.743,941.81
# ofRank ValueShare Ch.
2015 Rank Sh (%)
25▼
MarketChange in Advisor
▲6.8 1.3104.7
Market MarketMarket Market# of Deals FeesDeals Sh (%)
-9Share Ch.Sh (%)Financial Advisor
0.7▼1US$m
Goldman Sachs & Co 22
MarketFinancial Advisor
1 1 105,138.2US$m
19.1 ▲
Rank Value per Advisor (US$m)Market
Share Ch.
China International Capital Co19.4Goldman Sachs & Co
36
# of Deals# of
10,366.7
22
39
9,713.5Southwest Securities Co Ltd▲
27
4.0
37
12.7-0.6 37
8.6 ▲
11,818.5
5.2 ▲
15
1
0.6 14SomerleyHSBC Holdings PLC
0.319
▲+2
Imputed Fees (US$m)
Sh (%)▼
CITIC 3 12 86,661.7
▼103,144.7 +23
72,394.5
46,622.8
Rank Value per Advisor (US$m)2016 Rank
2015 Rank
Rank Value
▼
-60.6
Change in
13.4
18.2
0.5
66,184.6 12.2
▲4.4▲
30
0.4
Dyalco +18.6▲
UBS7Morgan Stanley 56 0.4
Any Asia (ex-Japan) Involvement Completed (AF32) Jan 1 - June 30
# of Deals per Advisor
10
JP Morgan 4 11
2
186,760.9▼
▲
Guotai Junan Securities24 2021
+11 Malayan Banking Bhd
2.3
42
▼25
0.2
21
▼
0.4Lazard 0.3China Renaissance Partners 20 34 2.5
+5China International Capital CoJP Morgan▲
-2+4
CITIC0.5
0.3▲
1.6
-0.1
▼11.5 ▼-7.6
▲
541 346 5
53
21 18
23
10,551.5 2.0 -1.3 ▼
▲
▲8.78.8
▼
▲
-1
0
15
2223
▼
-
33.1
▼1.9
2
298 184 0
5,408.4
6,774.1
3.5
27
18 2.1
6 236 3 198 1 547 0 100 0Industry Total
Deutsche Bank Lazard
Rank Value per Advisor (US$m)
Industry % Change from Last Quarter▼
Industry Total
16-5.2
▼23.914.3
0.5
▲-
▼
13.2
0.90.4
7.6
2.31,931.4
17.912.9-3 74.12.6
10 -2.2
2.8
Share Ch.
UBSBank of America Merrill Lynch
▲
Citi
1.0▼
0.9-2.0
US$m
5.1
5.7 -0.8
▲
-
1.021 370.0
362.8
1.4-19*
3
Industry % Change from Last Quarter
1.1
-
0.4
7.4
▲-10.8%
+18
▲▲
0.1
-1
100.0
Industry % Change from Same Period Last Year▼▼
+317
4.2%
Any Australian Involvement Announced (AD24)
Rank Value per Advisor (US$m)
US$m Share Ch.2.6
Financial Advisor
-12.3%
Sh (%)
12
# of Deals per Advisor
Macquarie Group 1 2
Rank Value
6
Credit Suisse5
▼
37.9Goldman Sachs & Co 2
16
3
8
112
3
0.7-
UBS
11.0
3.7▲
5▲3.4
450.4
0-13.2
0.6 Grant Samuel▲-1
+34
5
▼
-2 ▼-1 -▼
▼▲13.2
Sh (%)102.7
Sh (%)
1.10.2
7
12
1.5
13.6-
# of Deals per Advisor
1.9%
1
▲Fees# of Deals
+117.032
2015 Rank
# ofMarketRank Value Market
▲Share Ch.Financial Advisor Deals
Market2016 Rank
Change in AdvisorSh (%)
Market
▼Industry % Change from Last Quarter
▼ ▼0.1▲4.0
▲
Imputed Fees (US$m)
Jan 1 - June 30
9.6%
-3,244100.0
Market
▼-4.0%▲
Any Australian Involvement Completed (AF31)
▲-1.4%Industry % Change from Same Period Last Year
Sh (%)
Jan 1 - June 30
-21.5%
145.60.4
0.3
0.0
0.325
Industry % Change from Same Period Last Year
▲168.8
0.11675
-30.1%Industry % Change from Last Quarter
Industry Total 46,874.3
-4.6%
1,593.6
10.3
3.4 1
0.3
14LazardCiti
First NZ Capital
Duff & Phelps
Evercore PartnersCenterview Partners LLC 16*
Moelis & Co
13
24Sidra Capital
▼
42
121.1
0.423
172.7
100.0
Houlihan Lokey
11.9 ▲5.21.5
5.4%
17,777.3
Market
541,346.5
Market
▲
Change in 2016 Rank
2015 Rank
MarketDeals
Gresham Partners
3.6
27.6
9,577.1
117
Morgan Stanley
4
JP Morgan 30
1,736.04
Bank of America Merrill Lynch
2,732.4
4,578.6
10
4,272.0
7
5
China Renaissance Partners 11
479
74Greenhill & Co, LLC
Grant Samuel8
▲
14,107.9
9,652.312,928.1
5.8
▲▼
37.1
5.7
▲
9.1
11.2
▲
20.4
▲▼
0.4
30.117,395.3
9.8
22.7
-4.119.4
20.6
101.8
35
-3
-3
-8.3
0.4
12
0.73
0.433 ▲
▲+1
8
Macquarie Group
Tudor Pickering & Co LLC
Goldman Sachs & Co
+1
1.2 +3
# of Deals▲
# of
48.8%
298,184.0
2.8▼
6.6
4.0
▲50.9
2.1
13
+11.3
▲
02.96
2.4
▲
▲
8.8
2.4
1.2
6.8
1.416.3
0.40.5
▼
0.9
▲
0.2▼
▼▼
0.7
▲
0.4
▲
0.82.4
▲
0.6
2.1
0.1
1.3
-
+1-▲
0.5-
13.8 2.4
012.2
0.3
38.1
0.20.9▲
▼ 13.81.2
2.9
3
▲
5
2
+2
041
61.1
▲ 4▼▲
0
5 0
1.1
10.6▲
1.9
0
0.2+10.2
3.6
0.5
0
▲
0.4
+1
0.7
1.3 +1
▼
-
-3
-
1.00.9
1.0-22*
7 2,698.32,015.2
910
40.438,458.83
Credit Suisse 8
4,452.613
Morgan StanleyRothschild
6.55
12
2
4,666.7
▲
12.6
4
6
14,318.6-16.9
-1.4
1 14,685.8 41.41
5,065.0
2
+2 ▲ 22.8
6,236
8.0
▲▲
4.8
▼2.4
▼ 115.5
2.7
4.87
1.9
1,809.9
480.01.4
1,593.6
-
14
2.4
1,706.1
3.51,239.04.5
1.4- 499.0
61 4.5
▲ 16
▼
27*480.0 1.4
0.1 11▼▼
1.41.9
1,689.8
688.417 -18
▲1.0▲
1.4
0.1
1.0 1
▼
0.1
0
256
▲
Deutsche Bank
-49 -7.7
▲ 15014▼613.2 ▲
-Blum Capital Partners LP 1.0
1.177*1516* -
1.1 0.1
Luminis Partners Pty LtdCameron Partners Ltd
495.4480.0
-
-
370.0282.8261.5
31*
38*
0.1
▲
▲18
0.16
0.4
0.6
-0.10.80.6
193.3 0.4NomuraJones Lang LaSalle Inc
▼-12.0
0.1▲
22
2519 0.7
-2120
0.4 0.10.3
1Evercore Partners1
0.1-▲
▼
+1
-▲▲
+1
Blum Capital Partners LP
UniCredit22*
▲▲
0 19*Centerview Partners LLC
0
848.4
ING
Fort Street Advisers3 12China Renaissance Partners 13
+1+1
1▲
1 2.4
0.4
0.9-7.6
+30.7▲
0.7
▲
970.0
2.4▲ 0.2 ▲+11▲ 0.2
▲
3.10.6
1.01.00.4
▲
0.4
0.6
1.0
0.2
▲
▲
▲
▲
0.2
0.40.4
▲
0
0.4
1.4
▲▲
0.5
2.1
0.5
-45.8%
2
0.4
1
1
11
1 0.3
▼
0
17.9%-17.1% ▼▼ -12.7% ▼ ▼
-100.0 100.0
-8.1%
-109+2
Industry % Change from Same Period Last Year
32
24JP Morgan 324.20.9 ▲
454
5.30.40.7
▼
62
575.3▲
-22.7% ▼
2.1
5.5
1
-19.4%
0.2
▲
▲+1▲+1 2.1
2.6
-
-
5.9
▼
3,198 1,547.0
-7.1%
315.017
362.8--1
First NZ Capital 25+1
Banca IMI (Intesa Sanpaolo)
▲
-
Industry Total
▼
35,450.7
100.0
0.5+1
Industry Total
723.0 ▲
▼1.2+3 Barclays
870.1 -0.4-8.2
-4▼1.9
1.31.5
65
480.0 1.0▼
Canaccord Genuity 0.3-
-98
▼
Visit http://dmi.thomsonreuters.com to view archives and order custom League Tables* tie
https://www.thomsonone.com
16
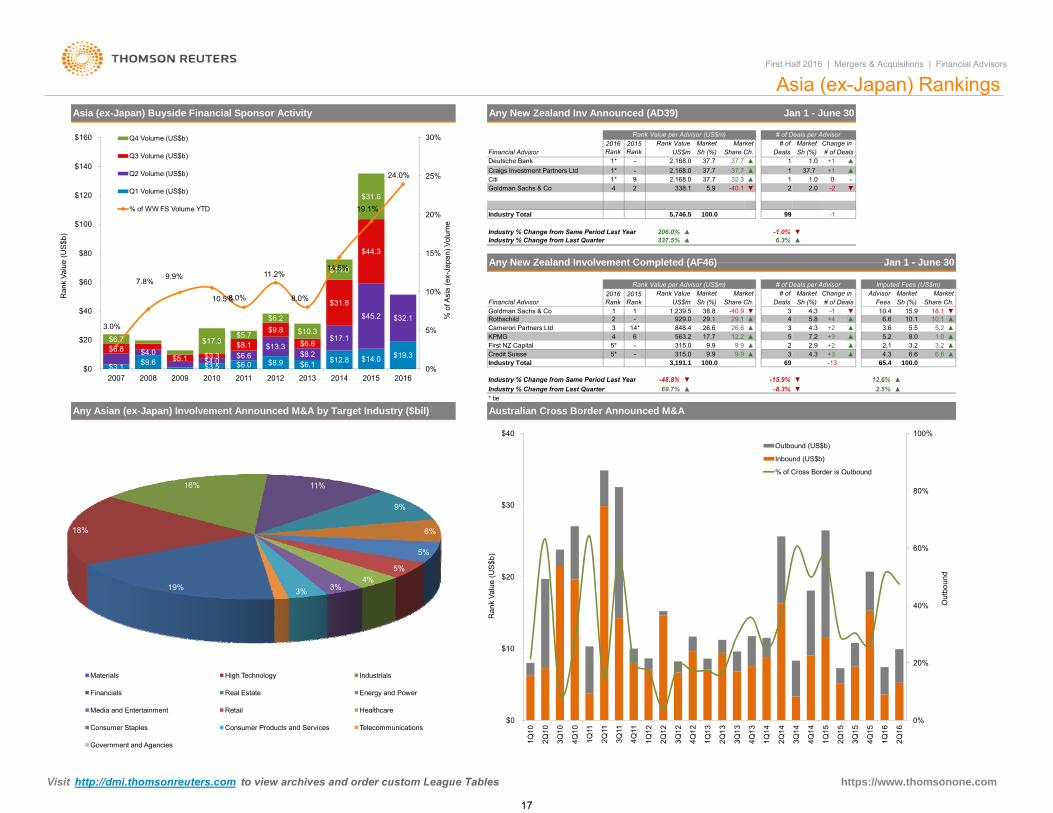
Deals-
Any New Zealand Inv Announced (AD39)
Financial Advisor1
Citi
1* ▲37.7
# of
1*338.1
37.737.7
▼-
-2
+1
2.0
1
-40.132.3
▲
2Goldman Sachs & Co 5.924
-Rothschild 929.0
Industry % Change from Same Period Last Year
315.0
-48 8% ▼
3,191.1
Industry % Change from Same Period Last Year
-First NZ Capital563.2848.4
US$m
6▲9.9
12
Rank Value per Advisor (US$m)2016 Rank
4
Asia (ex-Japan) Buyside Financial Sponsor Activity
2016 Rank
Craigs Investment Partners Ltd
Industry Total
Cameron Partners Ltd
Goldman Sachs & CoFinancial Advisor
3
5*
99
Change in Market# of Deals
-1
Any New Zealand Involvement Completed (AF46)
Market2015 Rank
337.5%
1
1.0
6.3%-1.0%
1
38.8▲
Jan 1 - June 30
100.0
4
Deals
# of Deals per Advisor
▼
▲
▲
3.28.0
6.6
# of
2015 Rank
Share Ch.▼4.3
# of Deals
▲
Sh (%)Market
KPMG
Industry Total
29.1 5.8
Sh (%)Sh (%) Share Ch.
▼
Jan 1 - June 30
Rank Value per Advisor (US$m)
37.7
Fees
-
First Half 2016 | Mergers & Acquisitions | Financial Advisors
26.617.7
29.1
MarketAdvisor
10.4
Market
15.9 18.1
7.22 3.2
3 -1
9.9
26.6 ▲▲
▲▲
10.16.6
▲
3 +2 5.53.6
+25
Change in
+3 1.02.9
5.2
▲Industry % Change from Last Quarter
1*
14*
MarketShare Ch.
-40.9
2,168.0
1,239.5
+137.7
037.7
▲12.2
Sh (%)
69
▼
-13
12 6%-15 9%
65.4
Imputed Fees (US$m)
Asia (ex-Japan) Rankings
▲
# of Deals per Advisor
1.0
100.0
2.1
▲▲
4.3
▼
Market
100.0
▲
MarketRank Value
5,746.5
Deutsche Bank
2,168.0
▲
Credit Suisse 5* - 315.0
2,168.0
9
US$m
4.39.9 9.9 6.6
▲
▼
Rank Value
206.0%
5.2
▲▲ 3 4.3 +3
Sh (%)
10.1+4▲▲
$3.1 $9.6 $3.5 $6.0 $8.9 $6.1 $12.8 $14.0 $19.3$4.0$4.0
$6.6$13.3
$8.2
$17.1
$45.2 $32.1
$6.8$5.1 $3.3
$8.1
$9.8
$6.6
$31.8
$44.3
$6.7 $17.3$5.7
$6.2
$10.3
$14.0
$31.6
3.0%
7.8%9.9%
10.5%8.0%
11.2%
8.0%
14.5%
19.1%
24.0%
0%
5%
10%
15%
20%
25%
30%
$0
$20
$40
$60
$80
$100
$120
$140
$160
2007 2008 2009 2010 2011 2012 2013 2014 2015 2016
% o
f Asi
a (e
x-Ja
pan)
Vol
ume
Ran
k Va
lue
(US
$b)
Q4 Volume (US$b)
Q3 Volume (US$b)
Q2 Volume (US$b)
Q1 Volume (US$b)
% of WW FS Volume YTD
▲-48.8% ▼Industry % Change from Same Period Last Year69.7%
▲▲2.5%
* tie
Any Asian (ex-Japan) Involvement Announced M&A by Target Industry ($bil)
-8.3% ▼▼ 12.6%-15.9%
Australian Cross Border Announced M&A
Industry % Change from Last Quarter
19%
18%
16% 11%
9%
6%
5%
5%4%
3%3%
Materials High Technology Industrials
Financials Real Estate Energy and Power
Media and Entertainment Retail Healthcare
Consumer Staples Consumer Products and Services Telecommunications
Government and Agencies
0%
20%
40%
60%
80%
100%
$0
$10
$20
$30
$40
1Q10
2Q10
3Q10
4Q10
1Q11
2Q11
3Q11
4Q11
1Q12
2Q12
3Q12
4Q12
1Q13
2Q13
3Q13
4Q13
1Q14
2Q14
3Q14
4Q14
1Q15
2Q15
3Q15
4Q15
1Q16
2Q16
Out
boun
d
Ran
k Va
lue
(US
$b)
Outbound (US$b)
Inbound (US$b)
% of Cross Border is Outbound
2007 2008 2009 2010 2011 2012 2013 2014 2015 2016
Visit http://dmi.thomsonreuters.com to view archives and order custom League Tables https://www.thomsonone.com
17

Mitsubishi UFJ Morgan Stanley
* tie
JP Morgan 380.0 3* 5.4 1
NomuraMitsubishi UFJ Morgan StanleyEvercore Partners 5.4 1 380.0
389
1
1
3*25,927.5 84.0
7,057.9
2
2 84.4
10,720.5 Real Estate
3,800.3 3,845.8
2
5,958.4
25.8
252
2
26
35.9
2
275 9 1
10
3 114
Japanese Involvement Announced M&A - Top Advisors by Target Industry Jan 1 - June 30 2016Mkt.
The Raine Group LLC
5 28.2
Japan Deals Intelligence
8,600.0 8,600.0
19,126.6 1
Bank of America Merrill Lynch
High TechnologyMitsubishi UFJ Morgan Stanley
Japanese M&A volume in the first half of 2016 decreased 16.6% compared to the first half of 2015, accruing US$70.1billion in value from 1,632 announced deals. This was the lowest first half volume since 2014’s US$74.2 billion worth ofdeals. 13 Japanese involvement deals valued at US$1 billion or more, worth an accumulated US$38.9 billion, wereannounced during the first half of 2016; a 20% decrease compared to the first six months of 2015, which postedUS$48.6 billion in value.
Any Japanese involvement deal making in the High Technology sector totaled US$19.1 billion, with a 27.3% marketshare. Industrials was the second most targeted sector, with deal volume totaling US$13 billion from 252 deals. RealEstate followed closely, accruing US$10.7 billion in value from 114 deals.
Almost half of the announced Any Japanese Involvement deals during the first six months of 2016 were domestic, withvalue reaching US$34.5 billion, an 18.2% increase compared to the first half of 2015. The first half of 2016 nearlyovertook 2013’s volume of deals worth US$38.5 billion, the last time Japanese domestic deals were larger than crossborder transactions during the first half of the year. Six out of the top 10 announced deals were domestic deals.
Japanese outbound activity was down 64.1% compared to the same period last year, totaling US$17.2 billion from 340deals. This was the lowest first half Japanese outbound volume since 2014’s US$33.9 billion.
Completed Japanese involvement activity was up 15.4% compared to the first half of 2015, accruing US$77.7 billion.Estimated advisory fees, according to Thomson Reuters/Freeman Consulting, reached US$765.7 million.
45.045.0
No. DealsRank
13,699.3 2*2*
Share
NomuraIndustrials
Daiwa Securities Group Inc
Sumitomo Mitsui Finl Grp Inc
31.0
21.835.5
Consumer StaplesDeutsche Bank
3,672.8 3
Nomura
Healthcare
First Half 2016 | Mergers & Acquisitions | Financial Advisors
Japan M&AJapanese M&A Down 17% | High Technology Highest Valued Sector | Domestic Deals Dominate Market, Up 17%
3,359.9
4,032.0 1
71.6
Rank Val US$m
Mitsubishi UFJ Morgan Stanley 2
1
2,338.3
13,005.5
73.6 4 Lazard
3,911.8
2,879.7 1*Rothschild 2,879.7 1* 73.6 4
129 2,879.7 1* 73.6 4
Sharp Corp (72.3%)Daihatsu Motor Co Ltd (48.7%)Dell Systems Corp (100%)
Supercell Oy (84.3%) 8,600.0Tencent Holdings Ltd
Investor Group
3,055.0
High Technology / ElectronicsIndustrials / Automobiles & Components
Jan 1 - June 30 2016
Birra Peroni Srl (100%)NTT Data CorpAsahi Group Holdings Ltd
3,468.6Taiwan / Japan
Rank Value (US$m)
Nomura Real Estate Master Fund
Daiwa House Reit Investment (100%) 2,338.3
Japan / Japan
1,462.0Japan / JapanJapan / Japan
2,879.7Japan / United States
Japan / Japan
High Technology / Software
Any Japanese Involvement by Market
Toyota Motor Corp
China / FinlandJapan / Japan
Nissan Motor Co Ltd
Consumer Staples / Food and BeverageTelecommunications / Telecommunications Services
Japan / Italy
Daiwa House Residential Invest Japan / JapanIndustrials / Automobiles & Components
2,630.8
2,189.0Real Estate / REITs
Mitsubishi Motors Corp (34%)Real Estate / REITs
High Technology / IT Consulting & Services
Acquiror / Target Nation
Healthcare / Healthcare Equipment & Supplies
Pending
Completed
5/12/2016
1/29/20162/10/2016 Pending
PendingPending
5/26/2016
4/15/2016
Date EffectiveTop Ten Japanese Involvement Announced Deals
Toshiba Medical Systems Corp (100%) Canon IncPending
3/17/2016
NTT DOCOMO Inc (3.11%) NTT DOCOMO Inc
Any Japanese Involvement Announced M&A
AcquirorTarget (% Sought/Acquired)Rank Date Target Macro / Mid Industry
3,131.63/28/2016
Pending
PendingPending
1/29/2016
6/21/2016
Pending
2/25/2016
Top REIT Inc (100%)
5,901.7
$50.1$34.0 $23.4 $35.2 $38.2 $37.0 $25.6
$42.3 $51.0 $41.3
$31.0$37.1
$21.6$19.2
$45.9 $41.0$32.8
$31.9$33.0
$28.8
$28.7 $47.5
$42.4$50.3
$50.5$42.4
$32.6$24.0
$45.7
$51.9 $28.6
$38.9$30.2
$50.4$59.3
$35.2 $26.8
$65.2
0
500
1,000
1,500
2,000
2,500
3,000
3,500
$0
$25
$50
$75
$100
$125
$150
$175
$200
$225
2007 2008 2009 2010 2011 2012 2013 2014 2015 2016
# of
Dea
ls
Ran
k Va
lue
(US
$b)
Q4 Volume (US$b) Q3 Volume (US$b) Q2 Volume (US$b) Q1 Volume (US$b) # of Deals Q2
100
200
300
400
500
600
700
.0
5.0
10.0
15.0
20.0
25.0
30.0
35.0
40.0
2Q13 3Q13 4Q13 1Q14 2Q14 3Q14 4Q14 1Q15 2Q15 3Q15 4Q15 1Q16 2Q16
# of
Dea
ls
Ran
k Va
lue
(US
$b)
Domestic Value Inbound Value Outbound Value Outbound # Inbound # Domestic #
https://www.thomsonone.com Visit http://dmi.thomsonreuters.com to view archives and order custom League Tables
18

Imputed Fees (US$m)
Financial Advisor
Credit Suisse
First Half 2016 | Mergers & Acquisitions | Financial Advisors
2016 Rank
Jan 1 - June 30
# of Deals# of 2016
Rank
Any Japanese Involvement Announced (AD19)
Rank Value per Advisor (US$m)Market
-20.1 82
41.6-17
Deals2015 RankSh (%)
Change in Rank Value per Advisor (US$m)
Sh (%)
# of Deals per Advisor
13.210,312.9
583.626
▼▲31.9
44
Market2015 Rank
▼
29,160.522,357.9
US$m
9,237.7
Rank ValueSh (%)
▼▲
▲
14.7
3
12.3-6.0
11.1
21.9
1
6
13
Daiwa Securities Group Inc
Bank of America Merrill Lynch
JP Morgan 6 5
Rothschild
7
10
2.5
12
1025
4.4
5.5
17
14*
86,051.0
2
8,600.07,795.7
12
1,726.616
3
Plutus Consulting Co Ltd
14*Wells Fargo & CoLazardDeutsche Bank
UBS
3,870.9
0.2Frontier Management Inc ▲Barclays
6.35.1
Evercore Partners306.6 ▲ +9
5
Financial Advisor Share Ch.
# of Deals per Advisor
Japan Rankings
Share Ch.Market MarketAdvisor
Sh (%)MarketMarketMarket
Fees# of Deals# of
Share Ch.US$mRank Value
DealsMarket Change in
Sh (%)
13 29,358.1 37.845,104.8
47.5▲
5.135.0 ▼58.1-1 ▼
-7 ▼▼
5.0
12
1.6
6▲▲ 0.6
24▼-40▼
-32.4
0
▼
▼
+6
+1
8.0
8.7
-7
▼
▲
4.7
12.4
3.5
▲
8.6
28.5
7.4
75.6
12.4
935.8
▲
▼
▼
42.9
65.9
- ▲
1.9
5.6
1.6
9.9
0.4
1.6
▲
▲
▲
1.1
0.1
-3
-7▲
▲
▼
1.9
▼
0.4
0.9
0.1
0.7
-1
.4
26.5
▼
0.9
0.4-15
0.8 0.8
▼
15
▼21
▲▼
1.52.1
18
1,000.0
1.110▲
2
1.8
0.323
▲0.9
2412 ▼ 2
▼
4.0-
-3
3 6 1
3.6
2.10.2 ▼
+10.8-6.6
0.11
▲3.2▲▲
2 0
0.2 0
110.3
▲
19 38
0 8
▼
17
20
▲2.4
111.0 14.5
▲▲6.2
2.7
37.9 5.0 2.50.7
0.5
0.6
▼
3.5
▲2.4
▼▲
▲
56.4
24.7
▲0.3
4.4 0.6
-
1.1
0.8
▲▲
▲▼
0.80.2
▲
0.5
▲
▲
1.5
0 3
1.1
1.7
0.5
0.0
7.5 -6.6 ▼▲
23 27
-2.83.7
-3.6
7.58.71
▼
-48Nomura
1.8
▲10
5,792.15,801.0
50.5 Lazard+414-2
3,531.43,055.0
5.0
7.25,072.6
100*
4,380.34,641.0
13
11
3,055.0
6-6.5 ▼ 6
12.3
4.4
▲8.6
-4.7
Sumitomo Mitsui Finl Grp Inc
8-4.8
5.73,961.3 3.611
▼
▼
58
45
24,268.4-
Sumitomo Mitsui Finl Grp IncRothschild
3.6243
21,083.6 27.2
Citi
9
19
7
24
The Raine Group LLC
4
▼
18
Mitsubishi UFJ Morgan Stanley52
Mitsubishi UFJ Morgan Stanley
Mizuho Financial Group
8
▲7
4
2
18.8 0.6-1
Nomura25,099.9
2
6
30.5
-832.3
-3
1
415.6
520,762.2
▲31.3
5.33▲0.2
1-3 ▼
Citi▼Goldman Sachs & Co▲Bank of America Merrill Lynch
+10.1
▼▲
62.3 +138
616,025.4
77
0.4
3.646
-17.49 ▲
9
0.620.6 -124.3 4.5▲
68 26.7
▼1.1
0.8
0.43
▲
3 0.37.6
6.9 +116.412,754.4
▲
11
2.7
6,789.2
3,654.00.3
0.4 ▼1
4.72.2
0.1-1
+1 12
+10.3
▲2.10.9
1314
+12.1
35
189
-1.81,601.5
▼
1.51,631.1
3
-5.1 ▼
13.3-11.1 0.2 -3
14.532.0
-13
789.4651.6
2.318 37 1,018.2 1.5
1.1Societe Generale 20 -Goldman Sachs & Co 19 7 0.2
0.93
1.3-7▼ Frontier Management Inc
▲ 1.3-11.4
▼▲ 0.1 +1
0.1 ▲1,000.0- ▲
Evercore PartnersKPMG
21-2.8
▲CIBC World Markets IncPerella Weinberg Partners LP 1.3
0.92
Trustees Advisory 23 73* 521.4 0.7▼0.9
0.722 20
▲2 3GCA Savvian Group Corp 25 22 0 7-
638 3▼ 27PricewaterhouseCoopers1 0 1 50 8+1 25 ▼
14 611.5 0.9 ▼BNP Paribas SA▼601.1 -17
-8.8 -1
1,182.8
0.2
6 0.4 -18 1.5
Deloitte15 15
▲
Any Japanese Involvement Completed (AF23)
▼
261.0
45 1,609.0-7.2
▼
-0.8 -4.5
-1.2
11
-14▼
24720.31 0.1
▲ +4 651.60
50▲
0.41,673.7
▲
KPMG▲
0.2GF Securities+2 -Credit Suisse
▲0.9957.8
1
0.6-
22
512.8 ▲0.7
▼▼
18
▼
22 1.3UBS
1.3
Societe Generale
16
43
1,013.9
2.1
0.8
GCA Savvian Group Corp1.71,331.5
▲ 8
511 690.5Yamada Consulting Group Co Ltd
16
.00.1
-19 ▼
0.1
0.0+1 0.8+11.3
6.020*20*
6.00.80.8▲
Ernst & Young LLP
▲
3-5
+13
Jan 1 - June 30
1,616.8
JP MorganMizuho Financial Group
2.1
Daiwa Securities Group Inc
4.4 ▲
Industry % Change from Same Period Last Year Industry % Change from Same Period Last YearIndustry % Change from Last Quarter Industry % Change from Last Quarter ▼▼-16.1%
▼-3 6.1
-7.3%
Industry Total
Japanese Target Completed M&A Fees
Vi it htt //d i th t t i hi d d t L T bl
-6.0%
2.0
-7.4%
0.8201,015
▲
▼
100.0
▼
-65
htt // th
765.70.3▲
100.0 1,63270,110.1-2.3
Industry Total +19GCA Savvian Group Corp 25 22 0.7
* tie
-30.1%-16.6%
▼
638.3▼ 27
15.4%▼
▲▼ 1.2%-21.6%
▲▼-2.9%
PricewaterhouseCoopers1.0 -1.50.8+1 25100.0
▼77,660.7
Japanese Involvement Announced M&A Target Industry by Value
511.6 16
27.3%
18.6%
15.3%
10.1%
5.6%
5.4%
High Technology Industrials Real Estate
Healthcare Consumer Staples Materials
Financials Telecommunications Retail
Media and Entertainment Energy and Power Consumer Products and Services
$190.6 $225.9
$98.6
$241.6 $212.7$170.1
$219.4 $225.1$143.9 $120.9
$270.4 $180.8
$148.0
$238.7
$130.7 $202.2 $116.4 $82.9$141.7
$236.0
$208.1
$161.2
$144.4
$148.7
$106.3
$223.1$192.4
$147.1$90.2
252.8
175.1
241.4
178.1
156.9
238.8
209.9
154.9214.9
0.0
0
100
200
300
400
500
600
700
800
$0
$100
$200
$300
$400
$500
$600
$700
$800
$900
$1,000
2007 2008 2009 2010 2011 2012 2013 2014 2015 2016
Num
ber o
f Dea
ls
Impu
teed
Fee
s (U
S$m
il)
4Q 3Q 2Q 1Q # of Deals YTD
Visit http://dmi.thomsonreuters.com to view archives and order custom League Tables https://www.thomsonone.com
19

Industry Total
Industry Total
1.86.9
0.00.1
22.60.20.7
22.3▼▲
.0159.7
41,072.0303.0
1,238.340,548.1
3,269.212,513.2
▲▲-▼▼▼
2.12.1
+4+30-1-1-2-1
+1
2.82.12.12.12.12.1
15*28*
43333333
--
20*15*15*12*
Guggenheim Securities LLC
10*13*13*13*13*13*13*13*
KPMGBarclaysRaymond James Financial IncJefferies LLCLazardPJT Partners LP
8,721.1
+4
0.27.50.3
3,112.62.10.7
620.0 100.0
2,202.21,342.9
0.50.3
1.61.5
0+1
-▲
Sandler O'Neill PartnersHoulihan Lokey
21*4*
109
▲
314.315,115.0
651.3
-10
Primary Capital Inc-
444
2.12.12.1Canaccord Genuity
21*
▼ 16,092.3
12*12*12*0.8
1.35,708.2
569.13,603.1
46,089.2784.4
12,625.8823.3
6,580.9
▲-▼
+20
-10+1+3
▲
14*5*
0.46.20.43.3
2.12.1
2.65
14*
12*
0.1Citi
440.9
23*FirstEnergy Capital Corp12*
▼▼ -45.3%Industry % Change from Last Quarter▼-64.4%
-82620
Guosen Securities Co LtdGreat Wall Securities Co Ltd
4*
Huatai Securities Co Ltd
Fairness Opinion Provider US$m Sh (%)
JP Morgan
1*
1*
12.117
4
35
DealsMarket
10JP MorganFairness Opinion Provider
Sandler O'Neill Partners
# of Deals# of
Jan 1 – June 30Any US Involvement Announced Fairness Opinion
Rank Value (US$m)Based on Number of TransactionsBased on Number of Transactions
# of Deals per Advisor
Jan 1 – June 30 Jan 1 – June 30Any Americas Involvement Announced Fairness Opinion
Change in Sh (%) Sh (%)
# of Deals per AdvisorBased on Number of Transactions
Change in # of Market2016 Rank
Market2016 Rank
Rank Value (US$m)
Worldwide Announced Fairness Opinion
Rank Value (US$m)MarketRank Value
# of Deals per Advisor
4
-29.5%
56*
▲
5
Citi 18*18* 19*18*21*
10
Citi
2*
8923*
Raymond James Financial Inc55*
BarclaysEvercore PartnersMorgan Stanley
6*
▲
6.4-12
▼Sh (%) # of Deals
2016 Rank
2015 Rank
1 37.1
-47*2*
4-14
+1
7*
85.0
7-3
5.04.3
▼
▼+110*
12*65
5
2.8
-65.6%
▼7.1-6
10
7
9
-9▼
▼0 8.3
▼784.4
5.7
▲
3.66.7
▼
4 -102.8
Industry % Change from Last Quarter
15*Chartwell Financial Advisory
10*10*
0.449,512.7 27.2
-06
-
▼-
+3202,038.8 100.0-88
-38.4%-30.1%
47.0.0
Industry Total 181,989.3
Industry % Change from Same Period Last Year
100.0
Industry % Change from Same Period Last Year
191
▼
-80
-16.3%
+1+4
Duff & Phelps
Deals0
-65 1*
4.74 5*
2015 Rank
0.8
Rank Value
JP Morgan21 51* 38
Fairness Opinion Provider2015 Rank
6.1Gram Capital
Rank Value
28,577.317US$mSh (%) Deals Sh (%)US$m
3,565.8
Sandler O'Neill Partners
# of Market Change in
1 1*# of Deals
-8.3
Market
0.48.9 -5 ▼
2* 7* 10 5.2 +1
14.12* 1* 10 5.2
9
799.3-12 ▼
▼8,721.1
▲
4.2
7 +13.73.7 -97
-1482,202.2
▲
▼▼
China Securities Co Ltd 11*19 ▲+106* 6*
1.9 6*19 3.1
19
China International Capital CoSouthwest Securities Co Ltd
4China Merchants Securities Co
10*+8
14
2.6
Prairie Capital Advisors IncStout Risius Ross Inc
Sinolink Securities Co Ltd
16 ▼
8
TD Securities Inc1213*12
0.7
CITICHaitong Securities Co Ltd
Duff & Phelps
16*
13*GF SecuritiesKPMG
10*
13*New Times Securities Co Ltd
12
1.617*1.8
10
Guotai Junan Securities
16*
12*
+7
0
▼
▲+3
3,905.0
3,503.7▲
2.6
3.1
▲3,573.8
10,059.70.8
6▼2.4+1 9*
9*9*
Stout Risius Ross Inc
24.50.0
5Morgan StanleyEvercore Partners22.82.6
3.1
Duff & Phelps
Houlihan Lokey
Prairie Capital Advisors IncGoldman Sachs & Co
2,859.0.0
4.31.11.4
Stifel/KBW
0.0
8.2 ▼.0
4.5
49,512.7Goldman Sachs & Co
Stifel/KBW
24* 149 24* 166* 8
21*6* 6
21
-37*
Houlihan Lokey4.2
-1 34,946.0
4 38*3 3
-25
1.9 -31.9
11
121.8
2
▼
+34
▲
▲22
4.0
3.1 -1
5.7
▲
17,779.9
2.3
7,929.2
+23.6
2,160.0
3.4 +17
0.3
13 2.10.5
3.8
2.3
▼
1.9 -11
1,217.9▼
-3
14*
1 +6
21*51*
9*
-2
-20
Shenwan Hongyuan Securities Co
3,001.3
0.8
34,659.4▲
19,079.7
▲
8.2▼
35,232.4
First Half 2016 | Mergers & Acquisitions | Financial Advisors
28,577.3 15.78,721.1 4.8
799.3 0.436,538.9 8.6251.2
2,859.0 1.62,202.2
.0
-55.2%
0.0.0 0.0
▼▼
12,275.815,115.0
1.6 -1
▼
141
Fairness Opinion Rankings†
55*
44Chartwell Financial Advisory
National Bank of Canada Fin'l 0.3
12*12*12*
2.12.12.1
23*-
4
▲▲▲ 516.8
0.00.0
Stifel/KBWChangjiang Securities Co Ltd
21*21*
12*60*
99
1.51.5
-13-6
▼▼
y
Industry % Change from Same Period Last Year ▼ ▼Industry % Change from Last Quarter ▼ ▼
0.10.3
39.723.4
▼▲▲-
63.4359.6
47,916.828,259.7
3.23.2
-2+2+20
--
8*
2222
5*5*5*
PricewaterhouseCoopersGuggenheim Securities LLCN+1Lazard
7
1.612 2.8
-1
34,659.4
Sh (%)Sh (%)
17,779.9▲22 +17
▲ 3,603.1New Times Securities Co Ltd 11*
CITIC
35,232.4
Rank ValueUS$m
8.2
Guosen Securities Co Ltd
Rank Value (US$m)
3.24.44.4
-2
+3
7
3.23.2
Rothschild
1
Sinolink Securities Co LtdHaitong Securities Co Ltd
Rank Value
Any Asia Pacific Inv Announced Fairness Opinion
Houlihan Lokey 5*5*
Based on Number of Transactions
Fairness Opinion ProviderUS$m
13*
# of Deals per Advisor
10*
# of Deals per Advisor
4.8
-14,733.4
5*
Huatai Securities Co Ltd
# ofFairness Opinion ProviderKPMGCITIC
SEB
1
China Merchants Securities Co
China International Capital Co10,427.2▲
▲
* tie
8* 10 2.3 0▲
Shenwan Hongyuan Securities Co9 2.1Changjiang Securities Co Ltd
Guotai Junan Securities
4
3.0
16
19China Securities Co Ltd
9
-53.0%-27.3% -44.2%
0.2
+33
Based on Number of Transactions
2016 Rank
210*
31*
4.8
31*251.52
-3
Gram Capital1
0.6
Sh (%)
3.9
8.623*
2015 Rank
-11.7%
▲▼ 2.5
Market
Jan 1 – June 30
Rank Value (US$m)
3,503.75,708.2
# of Deals
2
Market2015 Rank
Change in Deals
9Sh (%) # of Deals
▼4
16.4 +4
14.3
Southwest Securities Co Ltd
2016 Rank
-
Jan 1 – June 30Any EMEA Inv Announced Fairness Opinion
Market
3* -3*
38*
34*
2
11
0.6
11 2.6+72.6
- 0.5+6
9,063.81,342.91,217.9
+538*
▲
-Citi 18 16*Nuada Ltd
JP Morgan 16*
100.0-2463
-32.0% ▼Industry % Change from Last Quarter -34.2% ▼ -74.7%Industry % Change from Same Period Last Year
Industry Total
▼
120,765.7
-27.6%
▲ 19,079.721
1.63,565.8▲
-1 7.915.4
8.5
15.6
2.8
3.312* 3.712* 145 13
Industry % Change from Same Period Last Year 8.1%
GF Securities
13*15
6 12
7
Industry % Change from Last Quarter -30.8% ▼ -45.6%
Industry Total 100.0
▲
428
3,905.0▼ 3,001.3
34,946.0▲7,929.2 3.5
15.54.5
11,412.5 5.11.2+6
4
5*
11*
-2.1%▲
+32
4,582.0 2.0
4.9 ▼
1.71.3
# ofDeals
▲
Change in Market
-3
10,059.7
5.1
1.4
38 +348.9+235
+4
▼
-3
225,321.5
+103
2.11.6 -
▲
19
81.63,573.8
▲
12*
1,424.9
+6
▼
5*
+84.419
▲
+1
1.2
0 - 703.6
▼
▼
4.0
UBS 20* 66* 5
31* 9
6 ▲
†Fairness Opinion rankings include fairness opinions provided as a standalone mandate as well as fairness opinions provided as part of a broader advisory mandate.
393.9 0.20
0.8
▼
1.6
Duff & PhelpsJP Morgan
5*5*
4*2*
22
3.23.2
-4-5
10
16*
19
Great Wall Securities Co Ltd
▼▼
.0205.5
0.00.2
5 1.2 -3 ▼ 1,850.4Industrial Securities Co Ltd 20*
https://www.thomsonone.com Visit http://dmi.thomsonreuters.com to view archives and order custom League Tables
20

-
-
-
-
- Financial and legal advisors receive full credit for each deal on which they provide financial or legal advisory services, unless they represent minority sellers or advise on only a portionof the transaction or Thomson Reuters has not been made aware of their participation in that transaction. For pending transactions, advisors to targets of multiple bids receive credit forthe transaction agreed to or, in the absence of an agreement, the value of the highest offer.
EMEA
Tel: +44 (0) 20 7542 2246
E-mail: [email protected]
Japan
Ewelina JareckaDeals with undisclosed dollar values are rank eligible but with no corresponding Rank Value. Non-US dollar denominated transactions are converted to the US dollar equivalent at thetime of announcement of terms.
First Half 2016 | Mergers & Acquisitions | Financial Advisors
Ranking Criteria Summary
If you would like to participate in the submissionprocess, receive quarterly press releases, or havequestions about league table criteria pleasecontact:
League tables include rank eligible mergers, acquisitions, repurchases, spin-offs, self-tenders, minority stake purchases and debt restructurings.
A tender/merger transaction is considered to be effective at the time of consummation of the merger or the date on which it is declared wholly unconditional.E-mail: [email protected]
AmericasRobert LevineTel: +1 646 223 5682
Announced league tables include all deals that were announced between January 1, 2015 and June 30, 2016 and of which Thomson Reuters was made aware. All current data andprevious year's data is as of 5:00pm EDT on June 30, 2016.
Tel: +65 9832 8945
E-mail: [email protected]
Asia-PacificKai Soriano Sta-Cruz
Kaori Motohashi
-
-
-
-
League tables, commentary, and charts citing announced activity are based on Rank Date and include intended, pending, partially complete, completed, pending regulatory, andunconditional transactions. Rank Date is defined as the earliest public announcement of when a value can be applied to a transaction.
League table volumes for Mitsubishi UFJ Financial Group and Morgan Stanley, included herein reflect the changes after the commencement of their jointly established securities firmsin Japan: (1) Mitsubishi UFJ Morgan Stanley Securities and (2) Morgan Stanley MUFG Securities. Accreditation for transactions involving the newly established joint ventures arereflected in totals for Morgan Stanley. For Japanese related rankings, Morgan Stanley is represented as "Mitsubishi UFJ Morgan Stanley”.
Any Involvement league tables include deals where the target, acquiror, or either ultimate parent are domiciled (nation of headquarters) in the specified region or nation. Anyinvolvement league tables also include the nation of the seller and seller ultimate parent on privately negotiated stake purchases
Imputed fees are calculated using Freeman & Co. proprietary algorithm where spreads or fees are not disclosed. Deal fees are on a gross basis before all expenses. Each underwriteror advisor is allocated its share of deal fees using Freeman & Co. allocation methodology, based on the number of underwriters or advisors on the deal and their role. No fees areallocated to syndicated members.
Tel: +813 6441 1338Kaori Motohashi
E-mail: [email protected]
While Thomson Reuters has used reasonable endeavors to ensure that the information provided in this document is accurate and up to date as at the time of issue, neither Thomson Reuters nor its third party content providers shall be liable forany errors, inaccuracies or delays in the information, nor for any actions taken in reliance thereon, nor does it endorse any views or opinions of any third party content provider. Thomson Reuters disclaims all warranties, express or implied, as tothe accuracy or completeness of any of the content provided, or as to the fitness of the content for any purpose to the extent permitted by law. The content herein is not appropriate for the purposes of making a decision to carry out a transactionor trade and does not provide any form of advice (investment, tax, legal) amounting to investment advice, nor make any recommendations or solicitations regarding particular financial instruments, investments or products, including the buying orselling of securities. Thomson Reuters has not undertaken any liability or obligation relating to the purchase or sale of securities for or by any person in connection with this document.
© 2016 Thomson Reuters. All rights reserved.
Thomson Reuters and the Thomson Reuters logo are registered trademarks and trademarks of Thomson Reuters and its affiliated companies. Any third party name or mark herein belongs to the relevant third party.
https://www.thomsonone.com
21

Thomson Reuters Solutions for the Deal Making Community
FOR STRATEGY AND PLANNING TEAMSFOR INFORMATION PROFESSIONALSSDC Platinum is the world’s foremost financial transactions database, covering new issues, M&A, syndicated loans, private equity, project finance, poison pills, and more.
Solution for:• Market Analysis & Trends (Geography, Sector, Asset Class, Deal Type, Deal Size, etc.)• Deal Origination (Debt Maturity Analysis, Company Lifecycle including Private Equity)• Pitch Creation (Firm Credentials, Representative Acquirors)• M&A Targeting (Active Strategic/Sponsor Acquirors, Target Company Screener)• Negotiation (T&C Benchmarking)
Thomson Reuters Deals Business Intelligence enables you to slice and dice our renowned Deals and Fees data to create ad hoc reports, analyze market trends, benchmark your performance and identify opportunities – all within a tool built into your workflow in Excel®, saving you valuable time and giving you a competitive edge.
Solution for:• Conducting market analysis and identifying trends• Benchmarking your performance and monitoring competitors• Targeting clients by wallet size and banking relationship• Allocating resources more effectively by evaluating and analyzing lost deals
FOR INVESTMENT BANKERS
©2016 Thomson Reuters
evaluating and analyzing lost deals
Send us a sales enquiry at: financial.thomsonreuters.com/salesRead more about our products at: financial.thomsonreuters.com/products
To purchase individual Thomson reuters Deals or League Table reports, please contact our Thomson Reuters On Demand group:
Email: [email protected]
Access unique analysis for free anytime using Thomson Reuters Deals Intelligence website and receive regular updates, delivered direct to your inbox.
Go to: dmi.thomsonreuters.com/dealsintelligence
Thomson Reuters Eikon is the most intuitive and comprehensive way of staying informed. With natural-language search, you can quickly find global information,news, charts and analytics. Company and industry views provide top-level summaries, and then detailed information is just a click away. Identify new opportunities and gain deep understanding of markets, industries, companies and events.
Thomson Reuters Eikon also includes an Add-In for Microsoft® Office to help you increase your efficiency. From screening and targeting to comparables analysis, building league tables, valuing a company
and developing a client pitch book, you can do all this without leaving Microsoft Office. Search and autosuggest features in Excel make model-building easier.
Solution for:• Managing Client Relationships• Deal Origination• New Issues Pre-Marketing/Roadshows• Financial Modeling• Customized League Tables• Simple Deals screening• Valuation analysis and comparabledeal screening• On-brand pitch book creation
©2016 Thomson ReutersThomson Reuters and the Kinesis logo are trademarks of Thomson Reuters.
22


![1 Panel cover.ppt - IARIA · Title Microsoft PowerPoint - 1_Panel cover.ppt [Compatibility Mode] Author ��owner Created Date 1/21/2013 12:41:03 PM](https://img.pdfslide.net/doc/110x75/604d449134e88a586226b6cb/1-panel-coverppt-iaria-title-microsoft-powerpoint-1panel-coverppt-compatibility.jpg)


![00 GRACE Workshop Cover.ppt [Kompatibilitätsmodus]](https://img.pdfslide.net/doc/110x75/62378d63eda0c33d8a387d4d/00-grace-workshop-coverppt-kompatibilittsmodus.jpg)

![Cover.ppt [compatibility mode]](https://img.pdfslide.net/doc/110x75/54bc90c24a7959d1778b45b9/coverppt-compatibility-mode.jpg)