Embed Size (px)
Citation preview
1
Paris, April 27, 2018
First-quarter 2018 Business EPS(1)
up 1.4% at CER
Q1 2018 Change Change
at CER
IFRS net sales reported €7,898m -8.7% -0.4%
IFRS net income reported €1,016m -82.2%(2)
-
IFRS EPS reported €0.81 -82.0%(2)
-
Business net income(1)
€1,598m -10.7% +0.4%
Business EPS(1)
€1.28 -9.9% +1.4%
First-quarter 2018 reflected strong Specialty Care sales offset by U.S. Lantus®
and sevelamer exclusivity losses
Net sales were €7,898 million, down 8.7% on a reported basis, down 0.4%(3)
at CER and down 1.1% at CS/CER(4)
.
Sanofi Genzyme sales grew strongly, up 16.2%(5)
, driven by contribution from the new immunology franchise.
Vaccines sales (-0.9%) reflected strong performance in EU, offset by expected Pentaxim® supply constraint in China.
CHC sales grew 2.0% supported by double-digit growth in Emerging Markets(6)
.
Diabetes and Cardiovascular GBU sales down 15.7%; global Diabetes franchise sales declined 10.0%.
Emerging Markets sales(6)
increased 8.3%, driven by double-digit growth in China and Latin America.
2018 guidance confirmed
First-quarter 2018 business EPS(1)
increased 1.4% at CER to €1.28.
First-quarter 2018 IFRS EPS was €0.81 (-82.0%) due to a gain on disposal of the Animal Health business in 2017.
Sanofi continues to expect 2018 Business EPS to grow between 2% and 5% at CER(7)
barring unforeseen major adverse events. Applying the average April 2018 exchange rates, the currency impact on 2018 Business EPS is estimated to be around -7%.
Announcement of a €1.5bn share buyback program(8)
expected to be completed in mid-2019
Sanofi strengthens leadership in Specialty Care through the addition of a Rare Blood Disorder franchise
Sanofi completed the acquisition of Bioverativ and consolidated its financial results from March 9.
First patient dosed with fitusiran, a novel RNAi therapeutic for hemophilia, in phase 3 ATLAS program.
Ablynx acquisition(9)
will add caplacizumab for aTTP(10)
(submitted in EU) and innovative Nanobody® platform.
Sustaining innovation in R&D
Praluent® significantly reduced the risk of cardiovascular events in high risk patients in the ODYSSEY OUTCOMES
study and was associated with a lower death rate.
Dupixent® supplemental BLA filed in the U.S., Japan and EU for moderate-to-severe asthma in adults and adolescents.
Cemiplimab filed in EU for metastatic cutaneous squamous cell carcinoma.
Sotagliflozin submitted in the U.S. and EU for type 1 diabetes.
Sanofi Chief Executive Officer, Olivier Brandicourt, commented: “In the first quarter, the performance of our global operations, coupled with disciplined expense management, allowed us to manage the impact of the losses of exclusivity for Lantus
® and sevelamer in the U.S. Furthermore, with the
consolidation of Bioverativ and the acquisition of Ablynx(9)
, we have established the foundation for a global Rare Blood Disorder franchise which will further enhance our leadership in Specialty Care. Importantly, we continue to execute on our business priorities and position the Company for a new period of growth which is expected to begin in the second half of 2018.”
(1) In order to facilitate an understanding of operational performance, Sanofi comments on the business net income statement. Business net income is a non-GAAP financial
measure (see Appendix 8 for definitions). The consolidated income statement for Q1 2018 is provided in Appendix 3 and a reconciliation of reported IFRS net income to
business net income is set forth in Appendix 4; (2) Excluding Animal Health gain on disposal, IFRS net income was down 19.9% and IFRS EPS was down 19.8%;
(3) Changes in net sales are expressed at constant exchange rates (CER) unless otherwise indicated (see Appendix 8); (4) CS: Adjusted for Bioverativ acquisition;
(5) Adjusted for Bioverativ acquisition: + 11.2% at CER/CS; (6) See definition page 7; (7) 2017 business EPS was €5.52; (8) Subject to the renewal of the authorization to
repurchase Sanofi’s own shares at the May 2, 2018 shareholders’ meeting; (9) Subject to the completion of the acquisition; (10) Acquired thrombotic thrombocytopenic
purpura
Investor Relations: (+) 33 1 53 77 45 45 - E-mail: [email protected] - Media Relations: (+) 33 1 53 77 46 46 - E-mail: [email protected]
Website: www.sanofi.com Mobile app: SANOFI IR available on the App Store and Google Play

2
2018 first-quarter Sanofi sales
Unless otherwise indicated, all percentage changes in sales in this press release are stated at CER(11)
.
In the first quarter of 2018, Company sales were €7,898 million, down 8.7% on a reported basis. Exchange rate movements had a negative effect of 8.3 percentage points mainly driven by the movement of the U.S. Dollar accompanied by the Brazilian Real, Chinese Yuan, Japanese Yen and Argentine Peso. At CER, Company sales decreased slightly (down 0.4%).
Global Business Units
The table below presents sales by Global Business Unit (GBU). Please note that Emerging Markets sales for Specialty Care and Diabetes and Cardiovascular are included in the General Medicines and Emerging Markets GBU.
Net Sales by GBU (€ million)
Q1 2018 Change at CER
Sanofi Genzyme (Specialty Care)(a)
1,460 +16.2%
Diabetes and Cardiovascular(a)
1,088 -15.7%
General Medicines & Emerging Markets(b)
3,401 -1.5%
Total Pharmaceuticals 5,949 -0.9%
Consumer Healthcare (CHC) 1,238 +2.0%
Sanofi Pasteur (Vaccines) 711 -0.9%
Total net sales 7,898 -0.4% (a) Does not include Emerging Markets sales- see definition page 8; (b) Includes Emerging Markets sales for Diabetes & Cardiovascular and Specialty Care
Global Franchises
The tables below present first-quarter 2018 sales by global franchise, including Emerging Markets sales, to facilitate comparisons. Appendix 1 provides a reconciliation of sales by GBU and franchise.
Net sales by Franchise (€ million)
Q1 2018 Change at CER
Developed Markets
Change at CER
Emerging Markets
Change at CER
Specialty Care 1,710 +16.3% 1,460 +16.2% 250 +16.9%
Diabetes and Cardiovascular 1,484 -8.7% 1,088 -15.7% 396 +17.9%
Established Rx Products 2,320 -6.4% 1,327 -16.1% 993 +9.7%
Consumer Healthcare (CHC) 1,238 +2.0% 829 -3.5% 409 +14.4%
Generics 435 +0.9% 256 -0.8% 179 +3.0%
Vaccines 711 -0.9% 471 +10.9% 240 -18.4%
Total net sales 7,898 -0.4% 5,431 -4.1% 2,467 +8.3%
Pharmaceuticals
First-quarter Pharmaceutical sales were down 0.9% to €5,949 million primarily due to Diabetes and Established Rx Products.
Rare Disease franchise
(11) See Appendix 8 for definitions of financial indicators.
Net sales (€ million) Q1 2018 Change at CER
Myozyme®
/ Lumizyme® 196 +11.1%
Cerezyme® 175 +10.2%
Fabrazyme® 170 +6.8%
Aldurazyme® 51 +5.7%
Cerdelga® 36 +25.8%
Others Rare Diseases 67 -14.9%
Total Rare Disease 695 +6.9%
3
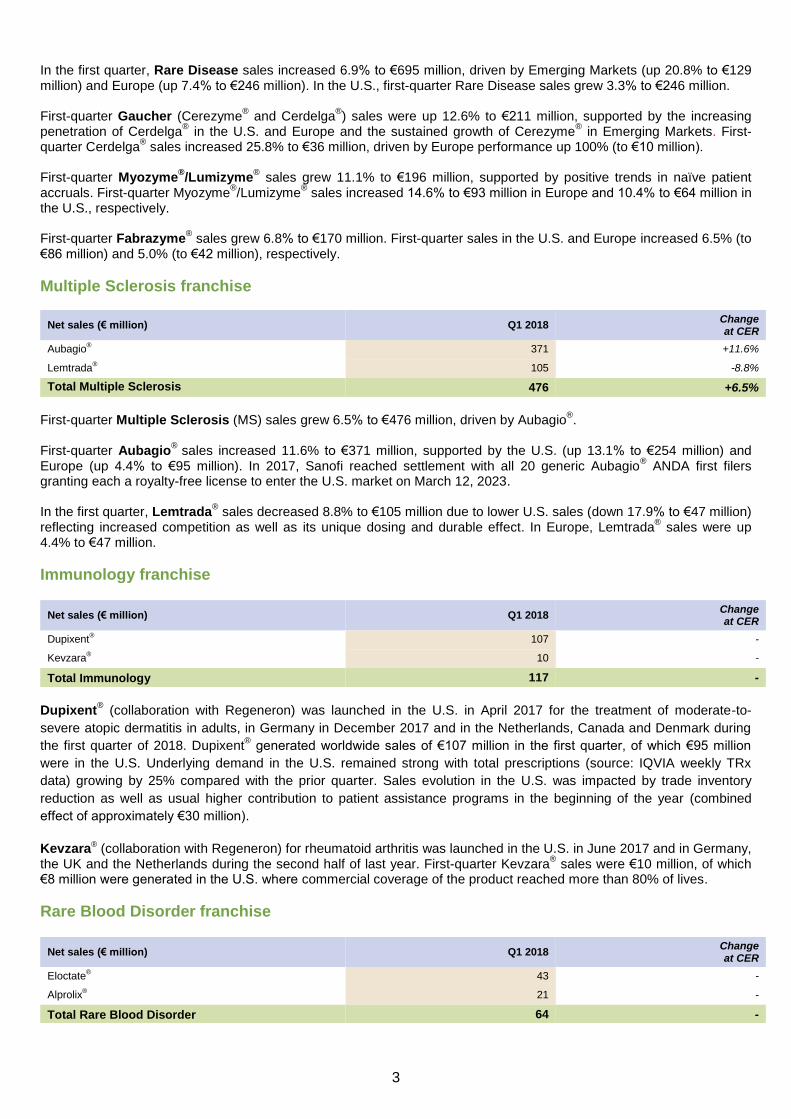
In the first quarter, Rare Disease sales increased 6.9% to €695 million, driven by Emerging Markets (up 20.8% to €129 million) and Europe (up 7.4% to €246 million). In the U.S., first-quarter Rare Disease sales grew 3.3% to €246 million. First-quarter Gaucher (Cerezyme
® and Cerdelga
®) sales were up 12.6% to €211 million, supported by the increasing
penetration of Cerdelga® in the U.S. and Europe and the sustained growth of Cerezyme
® in Emerging Markets. First-
quarter Cerdelga® sales increased 25.8% to €36 million, driven by Europe performance up 100% (to €10 million).
First-quarter Myozyme
®/Lumizyme
® sales grew 11.1% to €196 million, supported by positive trends in naïve patient
accruals. First-quarter Myozyme®/Lumizyme
® sales increased 14.6% to €93 million in Europe and 10.4% to €64 million in
the U.S., respectively. First-quarter Fabrazyme
® sales grew 6.8% to €170 million. First-quarter sales in the U.S. and Europe increased 6.5% (to
€86 million) and 5.0% (to €42 million), respectively.
Multiple Sclerosis franchise
First-quarter Multiple Sclerosis (MS) sales grew 6.5% to €476 million, driven by Aubagio
®.
First-quarter Aubagio
® sales increased 11.6% to €371 million, supported by the U.S. (up 13.1% to €254 million) and
Europe (up 4.4% to €95 million). In 2017, Sanofi reached settlement with all 20 generic Aubagio® ANDA first filers
granting each a royalty-free license to enter the U.S. market on March 12, 2023. In the first quarter, Lemtrada
® sales decreased 8.8% to €105 million due to lower U.S. sales (down 17.9% to €47 million)
reflecting increased competition as well as its unique dosing and durable effect. In Europe, Lemtrada® sales were up
4.4% to €47 million.
Immunology franchise
Dupixent
® (collaboration with Regeneron) was launched in the U.S. in April 2017 for the treatment of moderate-to-
severe atopic dermatitis in adults, in Germany in December 2017 and in the Netherlands, Canada and Denmark during
the first quarter of 2018. Dupixent® generated worldwide sales of €107 million in the first quarter, of which €95 million
were in the U.S. Underlying demand in the U.S. remained strong with total prescriptions (source: IQVIA weekly TRx
data) growing by 25% compared with the prior quarter. Sales evolution in the U.S. was impacted by trade inventory
reduction as well as usual higher contribution to patient assistance programs in the beginning of the year (combined
effect of approximately €30 million).
Kevzara® (collaboration with Regeneron) for rheumatoid arthritis was launched in the U.S. in June 2017 and in Germany, the UK and the Netherlands during the second half of last year. First-quarter Kevzara
® sales were €10 million, of which
€8 million were generated in the U.S. where commercial coverage of the product reached more than 80% of lives.
Rare Blood Disorder franchise
Net sales (€ million) Q1 2018 Change at CER
Aubagio® 371 +11.6%
Lemtrada® 105 -8.8%
Total Multiple Sclerosis 476 +6.5%
Net sales (€ million) Q1 2018 Change at CER
Dupixent® 107 -
Kevzara® 10 -
Total Immunology 117 -
Net sales (€ million) Q1 2018 Change at CER
Eloctate® 43 -
Alprolix® 21 -
Total Rare Blood Disorder 64 -
4
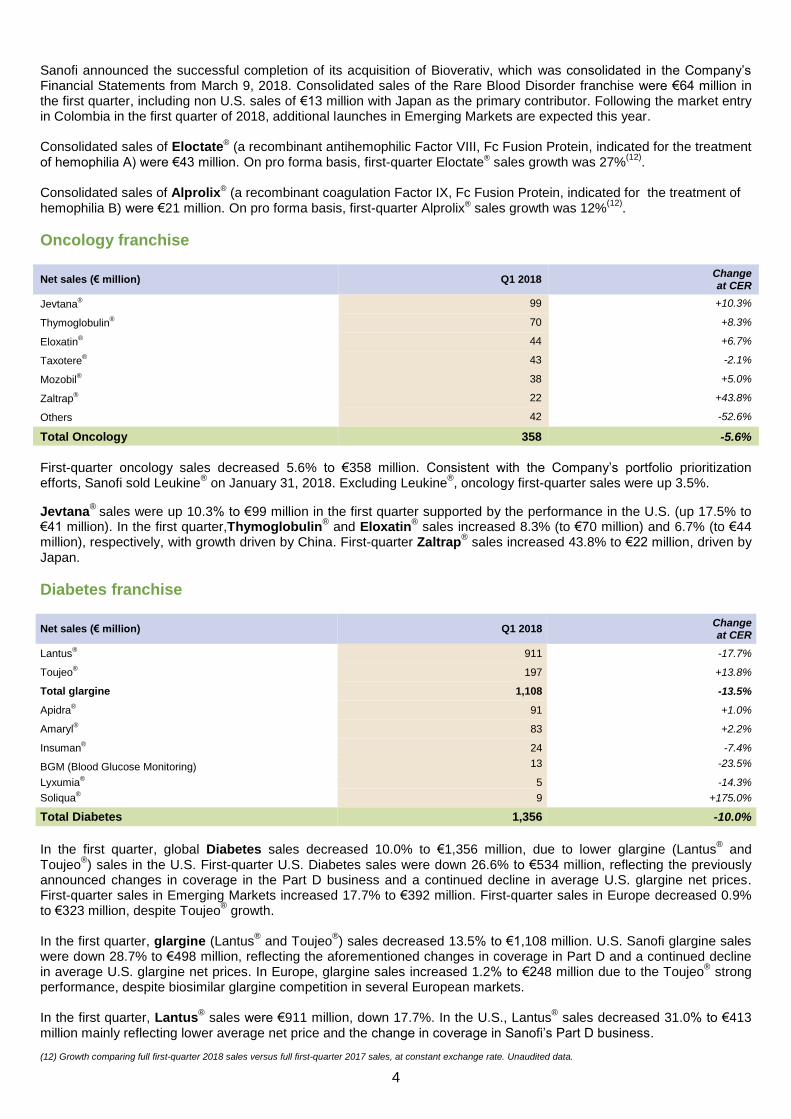
Sanofi announced the successful completion of its acquisition of Bioverativ, which was consolidated in the Company’s Financial Statements from March 9, 2018. Consolidated sales of the Rare Blood Disorder franchise were €64 million in the first quarter, including non U.S. sales of €13 million with Japan as the primary contributor. Following the market entry in Colombia in the first quarter of 2018, additional launches in Emerging Markets are expected this year. Consolidated sales of Eloctate® (a recombinant antihemophilic Factor VIII, Fc Fusion Protein, indicated for the treatment of hemophilia A) were €43 million. On pro forma basis, first-quarter Eloctate® sales growth was 27%
(12).
Consolidated sales of Alprolix® (a recombinant coagulation Factor IX, Fc Fusion Protein, indicated for the treatment of hemophilia B) were €21 million. On pro forma basis, first-quarter Alprolix® sales growth was 12%
(12).
Oncology franchise
Net sales (€ million) Q1 2018 Change at CER
Jevtana® 99 +10.3%
Thymoglobulin® 70 +8.3%
Eloxatin® 44 +6.7%
Taxotere® 43 -2.1%
Mozobil® 38 +5.0%
Zaltrap® 22 +43.8%
Others 42 -52.6%
Total Oncology 358 -5.6%
First-quarter oncology sales decreased 5.6% to €358 million. Consistent with the Company’s portfolio prioritization efforts, Sanofi sold Leukine
® on January 31, 2018. Excluding Leukine
®, oncology first-quarter sales were up 3.5%.
Jevtana®
sales were up 10.3% to €99 million in the first quarter supported by the performance in the U.S. (up 17.5% to €41 million). In the first quarter,Thymoglobulin
® and Eloxatin
® sales increased 8.3% (to €70 million) and 6.7% (to €44
million), respectively, with growth driven by China. First-quarter Zaltrap® sales increased 43.8% to €22 million, driven by
Japan.
Diabetes franchise
Net sales (€ million) Q1 2018 Change at CER
Lantus® 911 -17.7%
Toujeo® 197 +13.8%
Total glargine 1,108 -13.5%
Apidra® 91 +1.0%
Amaryl® 83 +2.2%
Insuman® 24 -7.4%
BGM (Blood Glucose Monitoring) 13 -23.5%
Lyxumia® 5 -14.3%
Soliqua® 9 +175.0%
Total Diabetes 1,356 -10.0%
In the first quarter, global Diabetes sales decreased 10.0% to €1,356 million, due to lower glargine (Lantus
® and
Toujeo®) sales in the U.S. First-quarter U.S. Diabetes sales were down 26.6% to €534 million, reflecting the previously
announced changes in coverage in the Part D business and a continued decline in average U.S. glargine net prices. First-quarter sales in Emerging Markets increased 17.7% to €392 million. First-quarter sales in Europe decreased 0.9% to €323 million, despite Toujeo
® growth.
In the first quarter, glargine (Lantus
® and Toujeo
®) sales decreased 13.5% to €1,108 million. U.S. Sanofi glargine sales
were down 28.7% to €498 million, reflecting the aforementioned changes in coverage in Part D and a continued decline in average U.S. glargine net prices. In Europe, glargine sales increased 1.2% to €248 million due to the Toujeo
® strong
performance, despite biosimilar glargine competition in several European markets. In the first quarter, Lantus
® sales were €911 million, down 17.7%. In the U.S., Lantus
® sales decreased 31.0% to €413
million mainly reflecting lower average net price and the change in coverage in Sanofi’s Part D business.
(12) Growth comparing full first-quarter 2018 sales versus full first-quarter 2017 sales, at constant exchange rate. Unaudited data.
5
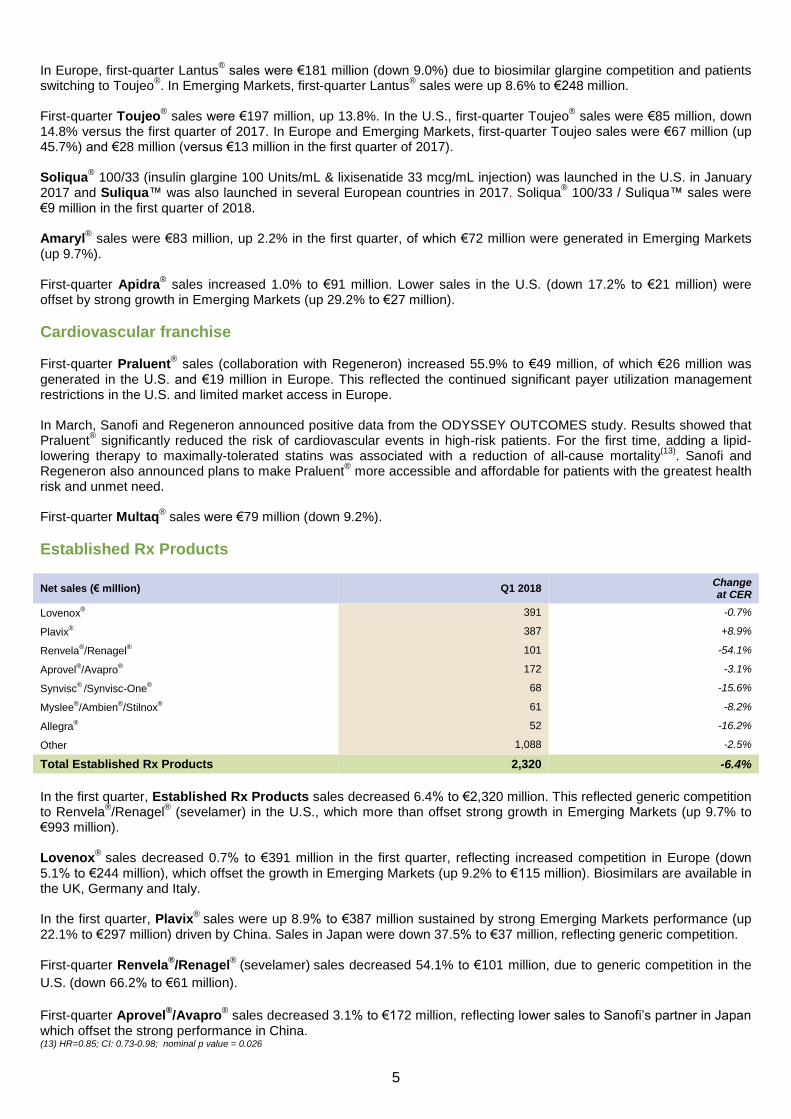
In Europe, first-quarter Lantus® sales were €181 million (down 9.0%) due to biosimilar glargine competition and patients
switching to Toujeo®. In Emerging Markets, first-quarter Lantus
® sales were up 8.6% to €248 million.
First-quarter Toujeo
® sales were €197 million, up 13.8%. In the U.S., first-quarter Toujeo
® sales were €85 million, down
14.8% versus the first quarter of 2017. In Europe and Emerging Markets, first-quarter Toujeo sales were €67 million (up 45.7%) and €28 million (versus €13 million in the first quarter of 2017). Soliqua
® 100/33 (insulin glargine 100 Units/mL & lixisenatide 33 mcg/mL injection) was launched in the U.S. in January
2017 and Suliqua™ was also launched in several European countries in 2017. Soliqua® 100/33 / Suliqua™ sales were
€9 million in the first quarter of 2018. Amaryl
® sales were €83 million, up 2.2% in the first quarter, of which €72 million were generated in Emerging Markets
(up 9.7%). First-quarter Apidra
® sales increased 1.0% to €91 million. Lower sales in the U.S. (down 17.2% to €21 million) were
offset by strong growth in Emerging Markets (up 29.2% to €27 million).
Cardiovascular franchise First-quarter Praluent
® sales (collaboration with Regeneron) increased 55.9% to €49 million, of which €26 million was
generated in the U.S. and €19 million in Europe. This reflected the continued significant payer utilization management restrictions in the U.S. and limited market access in Europe. In March, Sanofi and Regeneron announced positive data from the ODYSSEY OUTCOMES study. Results showed that Praluent
® significantly reduced the risk of cardiovascular events in high-risk patients. For the first time, adding a lipid-
lowering therapy to maximally-tolerated statins was associated with a reduction of all-cause mortality(13)
. Sanofi and Regeneron also announced plans to make Praluent
® more accessible and affordable for patients with the greatest health
risk and unmet need. First-quarter Multaq
® sales were €79 million (down 9.2%).
Established Rx Products
Net sales (€ million) Q1 2018 Change at CER
Lovenox® 391 -0.7%
Plavix® 387 +8.9%
Renvela®/Renagel
® 101 -54.1%
Aprovel®/Avapro
® 172 -3.1%
Synvisc®
/Synvisc-One® 68 -15.6%
Myslee®/Ambien
®/Stilnox
® 61 -8.2%
Allegra® 52 -16.2%
Other 1,088 -2.5%
Total Established Rx Products 2,320 -6.4%
In the first quarter, Established Rx Products sales decreased 6.4% to €2,320 million. This reflected generic competition to Renvela
®/Renagel
® (sevelamer) in the U.S., which more than offset strong growth in Emerging Markets (up 9.7% to
€993 million). Lovenox
® sales decreased 0.7% to €391 million in the first quarter, reflecting increased competition in Europe (down
5.1% to €244 million), which offset the growth in Emerging Markets (up 9.2% to €115 million). Biosimilars are available in the UK, Germany and Italy. In the first quarter, Plavix
® sales were up 8.9% to €387 million sustained by strong Emerging Markets performance (up
22.1% to €297 million) driven by China. Sales in Japan were down 37.5% to €37 million, reflecting generic competition. First-quarter Renvela
®/Renagel
® (sevelamer)
sales decreased 54.1% to €101 million, due to generic competition in the
U.S. (down 66.2% to €61 million).
First-quarter Aprovel
®/Avapro
® sales decreased 3.1% to €172 million, reflecting lower sales to Sanofi’s partner in Japan
which offset the strong performance in China. (13) HR=0.85; CI: 0.73-0.98; nominal p value = 0.026

6
Generics In the first quarter, Generics sales increased 0.9% to €435 million, sustained by Emerging Markets sales (up 3.0% to
€179 million), partially offset by lower sales in Europe (down 6.1% to €184 million). In April, Advent International and
Sanofi entered into exclusive negotiations under which Advent would acquire Zentiva, Sanofi's European generics
business for an Enterprise Value of €1.9 billion. The transaction is expected to close by the end of 2018, subject to
finalization of definitive agreements, completion of the appropriate social processes and approval of relevant regulatory
authorities.
Consumer Healthcare CHC sales by geography and category are provided in Appendix 1.
Net sales (€ million) Q1 2018 Change at CER
Allergy Cough & Cold 341 -8.1%
of which Allegra® 130 +2.1%
of which Mucosolvan® 27 -6.5%
of which Xyzal® 14 -62.8%
Pain 324 +8.9%
of which Doliprane® 84 +2.4%
of which Buscopan® 54 +45.2%
Digestive 248 +15.0%
of which Dulcolax® 53 +23.4%
of which Enterogermina® 49 +12.8%
of which Essentiale® 43 +15.0%
of which Zantac® 31 +33.3%
Nutritionals 164 +3.4%
Other 161 -5.3%
of which Gold Bond® 49 +12.0%
Total Consumer Healthcare 1,238 +2.0%
In the first quarter, Consumer Healthcare (CHC) sales increased 2.0% to €1,238 million, sustained by Emerging Markets (up 14.4% to €409 million) especially Latin America. In Europe, first-quarter CHC sales were down 5.0% to €382 million, due to a high base for comparison in the first quarter of 2017 which benefited from an early cough and cold season. As a consequence, first-quarter sales of Allergy Cough & Cold and Pain categories were down 4.7% and 5.0%, respectively. In the U.S., first-quarter CHC sales decreased 4.9% to €287 million due to inventory build-up for the U.S. launch of Xyzal
® Allergy 24HR in the prior year period as well as increased competition from private labels especially on intranasal
spray allergy products. In Emerging Markets, first-quarter CHC sales increased 14.4% to €409 million driven by strong performance of Pain and Digestive categories (up 30.4% and 23.7%, respectively) mostly driven by Brazil and Argentina.
Vaccines
Net sales (€ million) Q1 2018 Change at CER
Polio/Pertussis/Hib vaccines
(incl. Hexaxim® / Hexyon
® Pentacel
®, Pentaxim
® and Imovax
®)
380 -4.6%
Travel and endemic vaccines 102 +2.8%
Adult Booster vaccines (incl. Adacel ®
) 92 +26.6%
Meningitis/Pneumonia vaccines (incl. Menactra®) 89 +7.4%
Influenza vaccines (incl. Vaxigrip®, Fluzone HD
® & Fluzone
®) 29 -15.8%
Other vaccines (including Dengvaxia®) 19 -35.3%
Total Vaccines 711 -0.9%
First-quarter Vaccines performance was impacted as expected by the constrained supply of Pentaxim
® in China and low
sales of Dengvaxia® (€1 million versus €17 million in the first quarter of 2017) following the announced label update in
7
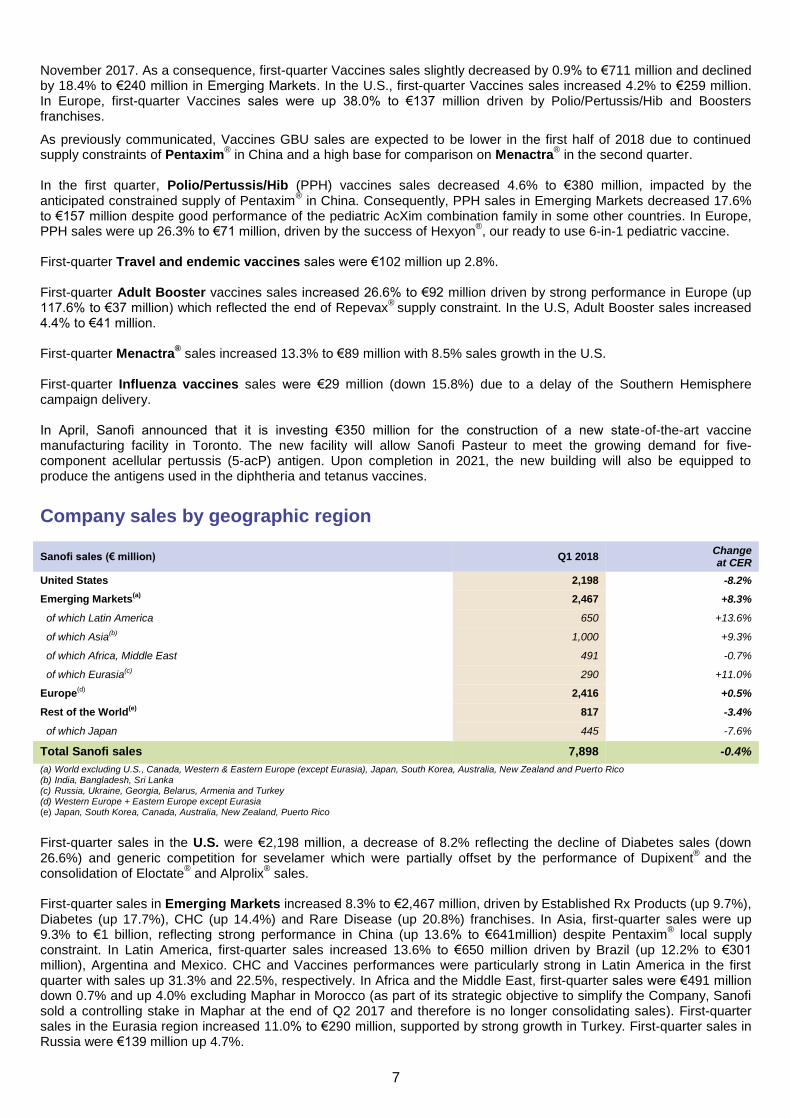
November 2017. As a consequence, first-quarter Vaccines sales slightly decreased by 0.9% to €711 million and declined by 18.4% to €240 million in Emerging Markets. In the U.S., first-quarter Vaccines sales increased 4.2% to €259 million. In Europe, first-quarter Vaccines sales were up 38.0% to €137 million driven by Polio/Pertussis/Hib and Boosters franchises.
As previously communicated, Vaccines GBU sales are expected to be lower in the first half of 2018 due to continued supply constraints of Pentaxim
® in China and a high base for comparison on Menactra
® in the second quarter.
In the first quarter, Polio/Pertussis/Hib (PPH) vaccines sales decreased 4.6% to €380 million, impacted by the anticipated constrained supply of Pentaxim
® in China. Consequently, PPH sales in Emerging Markets decreased 17.6%
to €157 million despite good performance of the pediatric AcXim combination family in some other countries. In Europe, PPH sales were up 26.3% to €71 million, driven by the success of Hexyon
®, our ready to use 6-in-1 pediatric vaccine.
First-quarter Travel and endemic vaccines sales were €102 million up 2.8%. First-quarter Adult Booster vaccines sales increased 26.6% to €92 million driven by strong performance in Europe (up 117.6% to €37 million) which reflected the end of Repevax
® supply constraint. In the U.S, Adult Booster sales increased
4.4% to €41 million. First-quarter Menactra
® sales increased 13.3% to €89 million with 8.5% sales growth in the U.S.
First-quarter Influenza vaccines sales were €29 million (down 15.8%) due to a delay of the Southern Hemisphere campaign delivery. In April, Sanofi announced that it is investing €350 million for the construction of a new state-of-the-art vaccine manufacturing facility in Toronto. The new facility will allow Sanofi Pasteur to meet the growing demand for five-component acellular pertussis (5-acP) antigen. Upon completion in 2021, the new building will also be equipped to produce the antigens used in the diphtheria and tetanus vaccines.
Company sales by geographic region
Sanofi sales (€ million) Q1 2018 Change at CER
United States 2,198 -8.2%
Emerging Markets(a)
2,467 +8.3%
of which Latin America 650 +13.6%
of which Asia(b)
1,000 +9.3%
of which Africa, Middle East 491 -0.7%
of which Eurasia(c)
290 +11.0%
Europe(d)
2,416 +0.5%
Rest of the World(e)
817 -3.4%
of which Japan 445 -7.6%
Total Sanofi sales 7,898 -0.4%
(a) World excluding U.S., Canada, Western & Eastern Europe (except Eurasia), Japan, South Korea, Australia, New Zealand and Puerto Rico (b) India, Bangladesh, Sri Lanka (c) Russia, Ukraine, Georgia, Belarus, Armenia and Turkey (d) Western Europe + Eastern Europe except Eurasia (e) Japan, South Korea, Canada, Australia, New Zealand, Puerto Rico
First-quarter sales in the U.S. were €2,198 million, a decrease of 8.2% reflecting the decline of Diabetes sales (down 26.6%) and generic competition for sevelamer which were partially offset by the performance of Dupixent
® and the
consolidation of Eloctate® and Alprolix
® sales.
First-quarter sales in Emerging Markets increased 8.3% to €2,467 million, driven by Established Rx Products (up 9.7%), Diabetes (up 17.7%), CHC (up 14.4%) and Rare Disease (up 20.8%) franchises. In Asia, first-quarter sales were up 9.3% to €1 billion, reflecting strong performance in China (up 13.6% to €641million) despite Pentaxim
® local supply
constraint. In Latin America, first-quarter sales increased 13.6% to €650 million driven by Brazil (up 12.2% to €301 million), Argentina and Mexico. CHC and Vaccines performances were particularly strong in Latin America in the first quarter with sales up 31.3% and 22.5%, respectively. In Africa and the Middle East, first-quarter sales were €491 million down 0.7% and up 4.0% excluding Maphar in Morocco (as part of its strategic objective to simplify the Company, Sanofi sold a controlling stake in Maphar at the end of Q2 2017 and therefore is no longer consolidating sales). First-quarter sales in the Eurasia region increased 11.0% to €290 million, supported by strong growth in Turkey. First-quarter sales in Russia were €139 million up 4.7%.

8
First-quarter sales in Europe were €2,416 million, up 0.5% mainly driven by Vaccines (up 38.0%) and Rare Disease (up 7.4%) which offset lower sales in Established Rx Products (down 4.3%) and CHC (down 5.0%) sales. Sales in Japan decreased 7.6% to €445 million in the first quarter, impacted by generic Plavix
® competition, together
with lower sales of Aprovel® and Allegra
®.
R&D update
Consult Appendix 6 for full overview of Sanofi’s R&D pipeline
Regulatory update
Regulatory updates since February 7, 2018 include the following:
In March, the European Medicines Agency (EMA) accepted for review the Marketing Authorization Application for cemiplimab (collaboration with Regeneron) for the treatment of patients with metastatic cutaneous squamous cell carcinoma (CSCC) or patients with locally advanced CSCC who are not candidates for surgery.
In March, the EMA accepted for review an application for Dupixent® as an add-on maintenance treatment in
certain adults and adolescents with inadequately controlled moderate-to-severe asthma. The U.S. Food and Drug Administration (FDA) also accepted for review the supplemental Biologics License Application of Dupixent
® as an add-on maintenance treatment in certain adults and adolescents with moderate-to-severe
asthma. Per the Prescription Drug User Fee Act, the target action date is October 20, 2018.
In March, the EMA accepted for review Sanofi’s regulatory submission for sotagliflozin (developed in partnership with Lexicon) for adults with type 1 diabetes. Sotagliflozin was also submitted in the U.S. for type 1 diabetes.
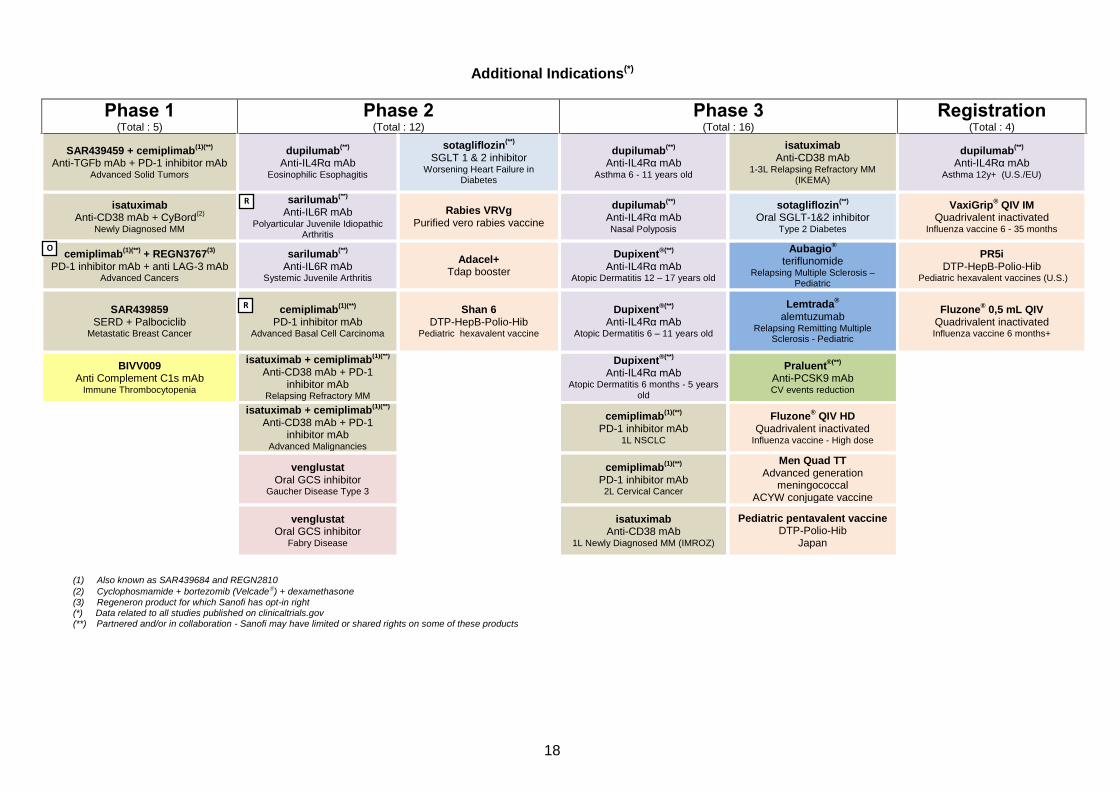
At the end of April 2018, the R&D pipeline contained 74 projects including 37 new molecular entities in clinical development. 28 projects are in Phase 3 or have been submitted to the regulatory authorities for approval.
Portfolio update
Phase 3:
The fitusiran phase 3 ATLAS program was reinitiated and the first patient was dosed in the ATLAS-INH study which will assess the benefit of fitusiran in adults and adolescents with hemophilia A or B with inhibitors.
In March, ODYSSEY OUTCOMES results were presented during a late-breaker session at the American College of Cardiology. This trial met its primary endpoint, showing Praluent
® (alirocumab, collaboration with Regeneron)
significantly reduced the risk of major adverse cardiovascular events (MACE) in patients who had suffered a recent acute coronary syndrome (ACS) event. Praluent
® was also associated with a lower risk of death overall,
known as “all-cause mortality”(1)
, and there were also numerically fewer CHD deaths(2)
. In a pre-specified analysis, the patients with baseline LDL-C levels at or above 100 mg/dL experienced a more pronounced effect from Praluent
®, reducing their risk of MACE by 24%
(3). In a post-hoc analysis of this group, Praluent
® was
associated with a lower risk of death from any cause by 29%(4)
.
BIVV009 entered into Sanofi’s portfolio through the acquisition of Bioverativ. BIVV009 is being evaluated in Cold Agglutinin Disease, a rare blood disorder and the first patient was dosed in phase 3.
Phase 2:
The phase 2 proof of concept study evaluating the dual-agonist (SAR425899) in overweight and obese type 2 diabetic patients confirmed SAR425899 is a potent hypoglycemic agent and can induce significant weight loss. However, the gastrointestinal tolerability observed with the dose escalation regimen used in the study is not considered to be acceptable for clinical use. An additional study was initiated in the first quarter to explore alternative titration regimens to facilitate improved tolerability and adherence and is expected to read-out in 2018.
SAR440340 (collaboration with Regeneron), a monoclonal antibody anti IL33, moved into phase 2 for the treatment of asthma.
Alliances/Collaboration
In March, Evotec and Sanofi entered into exclusive negotiations for Evotec to accelerate infectious disease research and development through a new open innovation platform near Lyon in France.
(1) HR=0.85; CI: 0.73-0.98, nominal p=0.026; (2) HR=0.92; CI: 0.76-1.11, p=0.38 ; (3) HR=0.76, CI: 0.65-0.87; (4) HR=0.71, CI: 0.56-0.90

9
2018 first-quarter financial results(14)
Business Net Income(14)
In the first quarter of 2018, Sanofi generated net sales of €7,898 million, a decrease of 8.7% (down 0.4% at CER). First-quarter other revenues decreased 8.4% (up 4.4% at CER) to €228 million, reflecting VaxServe sales contribution of non-Sanofi products of €169 million (up 12.7% at CER). First-quarter Gross Profit decreased 9.6% to €5,611 million (down 0.8% at CER). The gross margin ratio was 71.0% (71.5% at CER) versus 71.7% in the first quarter of 2017. The positive impact of business mix toward Specialty Care was more than offset by the negative U.S. Diabetes net price evolution, sevelamer generic competition, Pentaxim
® supply
constraint in China, and currency variations. In the first quarter of 2018, the gross margin ratio of segments were 74.3% for Pharmaceuticals (down 0.7 percentage points), 67.8% for CHC (down 0.2 percentage points) and 57.1% for Vaccines (down 1.4 percentage points). Sanofi expects its gross margin ratio to be between 70% and 71% at CER in 2018. Research and Development (R&D) expenses decreased 2.2% to €1,280 million in the first quarter of 2018. At CER, R&D expenses increased 4.5% mainly reflecting the spend on immuno-oncology programs and medical investment behind the immunology franchise, partially offset by the end of the Regeneron antibody discovery program. First-quarter selling general and administrative expenses (SG&A) decreased 6.9% to €2,310 million. At CER, SG&A expenses were up 1.0% reflecting investments in immunology, additional expenses in China and consolidation of Bioverativ’s operating expenses from March 9, which were partially offset by lower Diabetes expenses in the U.S. General expenses decreased in the first quarter, driven by cost containment measures. In the first quarter, the ratio of SG&A to sales increased 0.5 percentage points to 29.2% compared to the first quarter of 2017. First-quarter other current operating income net of expenses was -€31 million versus €34 million in the first quarter of 2017 and included the share of profit to Regeneron of the monoclonal antibodies Alliance. In the first quarter of 2018, this line also included the Bioverativ acquisition-related fees. The share of profits from associates was €74 million in the first quarter versus €24 million for the same period of 2017 partly driven by the increased contribution of the share of profits in Regeneron. In the first quarter, non-controlling interests were -€30 million versus -€35 million in the first quarter of 2017. First-quarter business operating income decreased 16.5% to €2,034 million. At CER, business operating income decreased 6.5%. The ratio of business operating income to net sales decreased 2.4 percentage points to 25.8% versus the first quarter of 2017. Over the period, the business operating income ratio of segments were 37.5% for Pharmaceuticals (down 1.5 percentage points), 34.2% for CHC (down 1.2 percentage points) and 18.0% for Vaccines (down 2.8 percentage points). Net financial expenses were an income of €2 million in the first quarter versus -€63 million in the same period of 2017. In the first quarter of 2018, net financial expenses included a gain of €76 million related to the shareholding in Impact Biomedicines which was acquired by Celgene. The first-quarter effective tax rate was 22.0% compared to 24.5% in the first quarter of 2017 mainly reflecting the net positive impact of the U.S. tax reform and lower tax rates in different countries. First-quarter business net income
(14) decreased 10.7% to €1,598 million and increased 0.4% at CER. The ratio of
business net income to net sales decreased 0.5 percentage points to 20.2% versus the first quarter of 2017.
In the first quarter of 2018, business earnings per share(14)
(EPS) decreased 9.9% to €1.28 on a reported basis and increased 1.4% at CER. The average number of shares outstanding was 1,248.2 million versus 1,262.4 million in the first quarter of 2017.
(14) See Appendix 3 for 2018 first-quarter consolidated income statement; see Appendix 8 for definitions of financial indicators, and Appendix 4 for reconciliation of IFRS net income reported to business net income.

10
Reconciliation of IFRS net income reported to business net income (see Appendix 4)
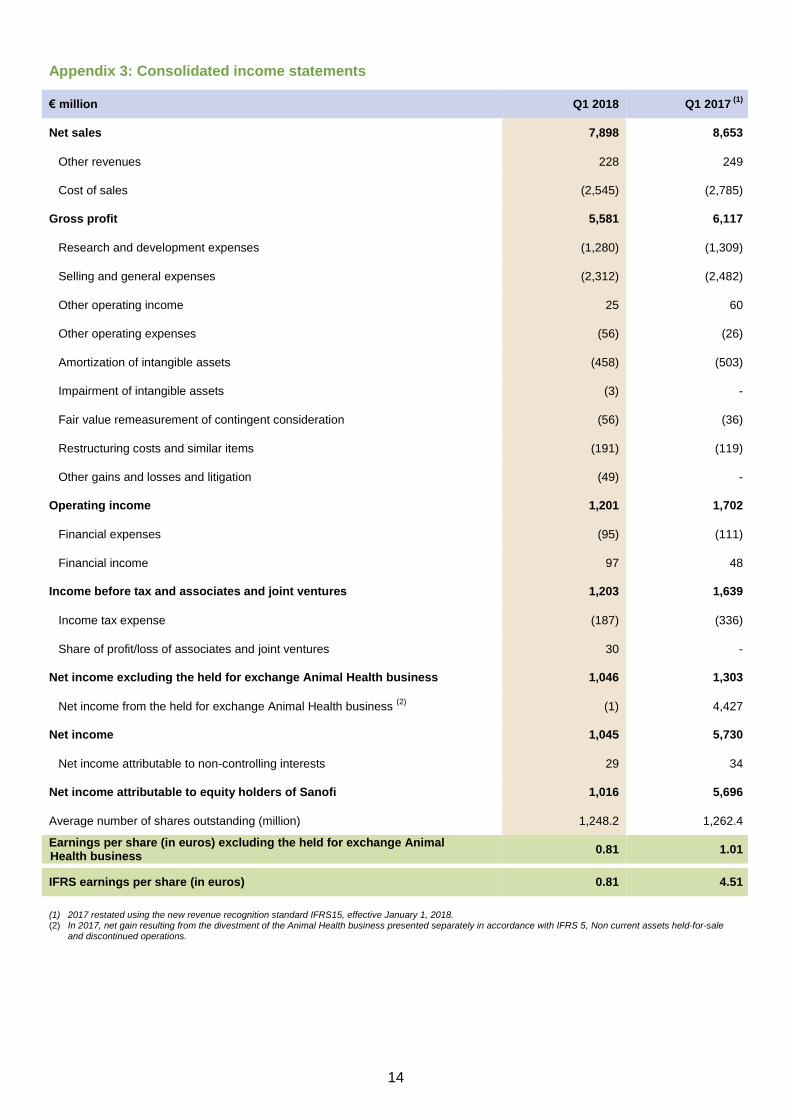
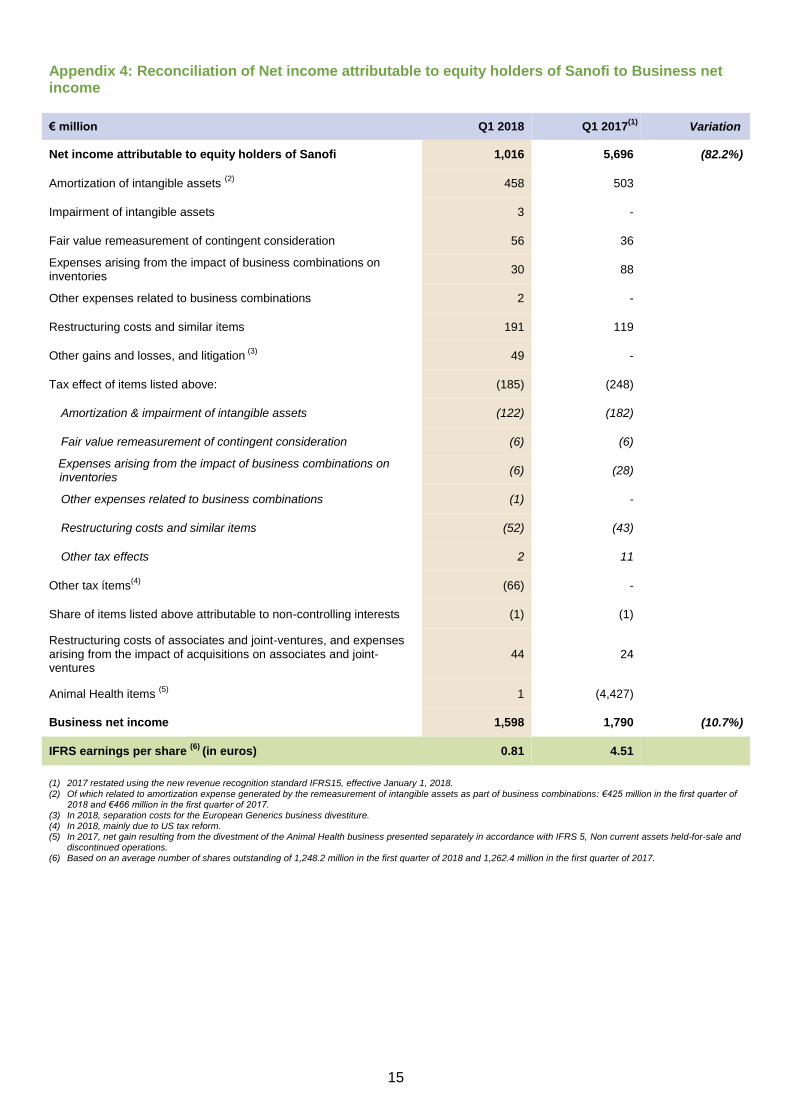
In the first quarter of 2018, the IFRS net income was €1,016 million. The main items excluded from the business net income were:
An amortization charge of €458 million related to fair value remeasurement on intangible assets of acquired companies (primarily Aventis: €73 million, Genzyme: €194 million, BI CHC business: €60 million and Bioverativ: €37 million) and to acquired intangible assets (licenses/products: €33 million). These items have no cash impact on the Company.
A charge of €56 million mainly reflecting a decrease of Bayer contingent considerations linked to Lemtrada® (a
charge of €14 million) and fair value adjustment of contingent consideration linked to Sanofi Pasteur MSD termination (a charge of €33 million).
Restructuring costs and similar items of €191 million mainly related to streamlining initiatives in the U.S. and Japan.
A €185 million tax effect arising from the items listed above, mainly comprising €122 million of deferred taxes generated by amortization and impairments of intangible assets, and €52 million associated with restructuring costs and similar items (see Appendix 4).
A €66 million tax effect arising mainly from the U.S. tax reform.
An income of €44 million net of tax related to restructuring costs of associates and joint ventures, and expenses arising from the impact of acquisitions on associates and joint ventures.
Capital Allocation In the first quarter of 2018, net cash generated by operating activities was €915 million after capital expenditures of €332 million and an increase in working capital of €445 million. This net cash flow funded restructuring costs and similar items (€170 million) and share repurchases (€603 million). Over the period, acquisitions and partnerships net of disposals were €8,888 million (including €8,979 million related to Bioverativ). As a consequence, net debt increased from €5,229 million at December 31, 2017, to €14,142 million at March 31, 2018 (amount net of € 12,799 million cash and cash equivalents).

11
Forward-Looking Statements This press release contains forward-looking statements as defined in the Private Securities Litigation Reform Act of 1995, as amended. Forward-
looking statements are statements that are not historical facts. These statements include projections and estimates and their underlying assumptions,
statements regarding plans, objectives, intentions and expectations with respect to future financial results, events, operations, services, product
development and potential, and statements regarding future performance. Forward-looking statements are generally identified by the words "expects",
"anticipates", "believes", "intends", "estimates", "plans" and similar expressions. Although Sanofi's management believes that the expectations reflected
in such forward-looking statements are reasonable, investors are cautioned that forward-looking information and statements are subject to various risks
and uncertainties, many of which are difficult to predict and generally beyond the control of Sanofi, that could cause actual results and developments to
differ materially from those expressed in, or implied or projected by, the forward-looking information and statements. These risks and uncertainties
include among other things, the uncertainties inherent in research and development, future clinical data and analysis, including post marketing,
decisions by regulatory authorities, such as the FDA or the EMA, regarding whether and when to approve any drug, device or biological application that
may be filed for any such product candidates as well as their decisions regarding labelling and other matters that could affect the availability or
commercial potential of such product candidates, the absence of guarantee that the product candidates if approved will be commercially successful,
the future approval and commercial success of therapeutic alternatives, Sanofi's ability to benefit from external growth opportunities, to complete
related transactions, and/or obtain regulatory clearances, risks associated with intellectual property and any related pending or future litigation and the
ultimate outcome of such litigation, trends in exchange rates and prevailing interest rates, volatile economic conditions, the impact of cost containment
initiatives and subsequent changes thereto, the average number of shares outstanding as well as those discussed or identified in the public filings with
the SEC and the AMF made by Sanofi, including those listed under "Risk Factors" and "Cautionary Statement Regarding Forward-Looking Statements"
in Sanofi's annual report on Form 20-F for the year ended December 31, 2017. Other than as required by applicable law, Sanofi does not undertake
any obligation to update or revise any forward-looking information or statements.
Appendices
List of appendices
Appendix 1: 2018 first-quarter net sales by GBU, franchise, geographic region and product
Appendix 2: 2018 first-quarter business net income statement
Appendix 3: 2018 first-quarter consolidated income statement
Appendix 4: Reconciliation of IFRS net income reported to business net income
Appendix 5: Appendix 6: Appendix 7:
Currency sensitivity R&D pipeline Expected R&D milestones
Appendix 8:
Definitions of non-GAAP financial indicators
12
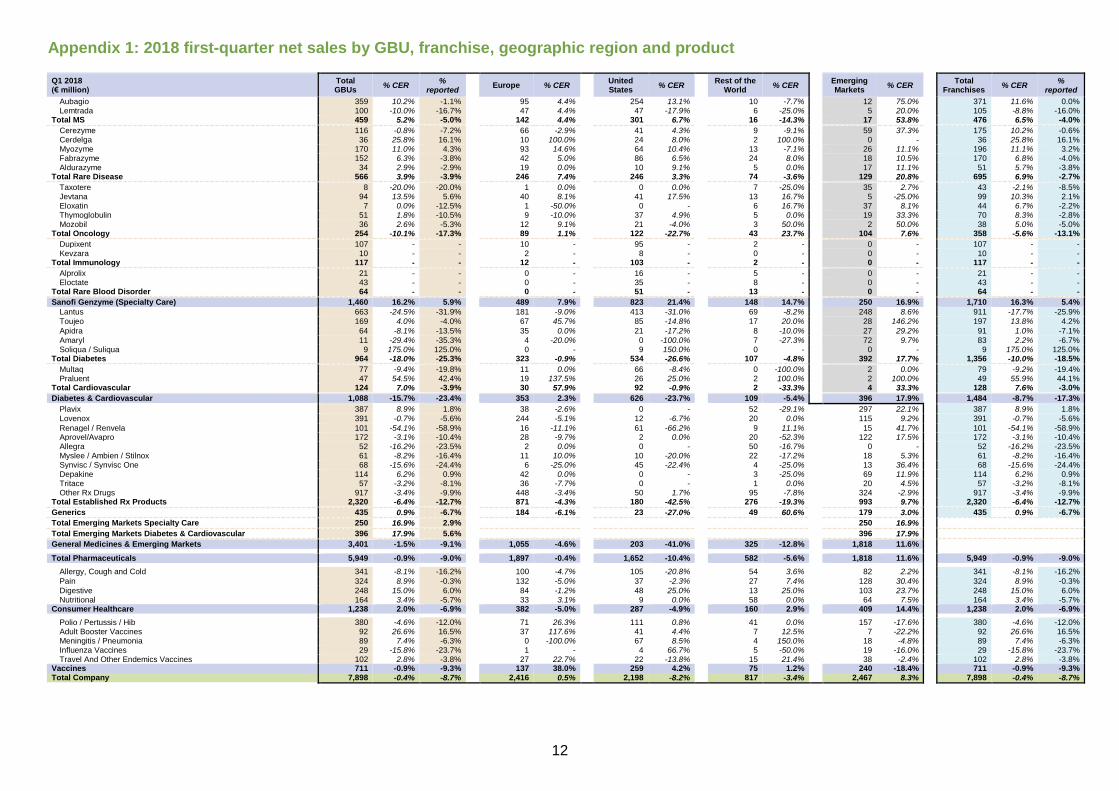
Appendix 1: 2018 first-quarter net sales by GBU, franchise, geographic region and product
Q1 2018 (€ million)
Total GBUs
% CER %
reported Europe % CER
United States
% CER
Rest of the World
% CER Emerging Markets
% CER Total
Franchises % CER
% reported
Aubagio 359 10.2% -1.1%
95 4.4%
254 13.1%
10 -7.7% 12 75.0% 371 11.6% 0.0% Lemtrada 100 -10.0% -16.7%
47 4.4%
47 -17.9%
6 -25.0% 5 20.0% 105 -8.8% -16.0%
Total MS 459 5.2% -5.0%
142 4.4%
301 6.7%
16 -14.3% 17 53.8% 476 6.5% -4.0%
Cerezyme 116 -0.8% -7.2%
66 -2.9%
41 4.3%
9 -9.1% 59 37.3% 175 10.2% -0.6% Cerdelga 36 25.8% 16.1%
10 100.0%
24 8.0%
2 100.0% 0 - 36 25.8% 16.1%
Myozyme 170 11.0% 4.3%
93 14.6%
64 10.4%
13 -7.1% 26 11.1% 196 11.1% 3.2% Fabrazyme 152 6.3% -3.8%
42 5.0%
86 6.5%
24 8.0% 18 10.5% 170 6.8% -4.0%
Aldurazyme 34 2.9% -2.9%
19 0.0%
10 9.1%
5 0.0% 17 11.1% 51 5.7% -3.8% Total Rare Disease 566 3.9% -3.9%
246 7.4%
246 3.3%
74 -3.6% 129 20.8% 695 6.9% -2.7%
Taxotere 8 -20.0% -20.0%
1 0.0%
0 0.0%
7 -25.0% 35 2.7% 43 -2.1% -8.5% Jevtana 94 13.5% 5.6%
40 8.1%
41 17.5%
13 16.7% 5 -25.0% 99 10.3% 2.1%
Eloxatin 7 0.0% -12.5%
1 -50.0%
0 -
6 16.7% 37 8.1% 44 6.7% -2.2% Thymoglobulin 51 1.8% -10.5%
9 -10.0%
37 4.9%
5 0.0% 19 33.3% 70 8.3% -2.8%
Mozobil 36 2.6% -5.3%
12 9.1%
21 -4.0%
3 50.0% 2 50.0% 38 5.0% -5.0% Total Oncology 254 -10.1% -17.3%
89 1.1%
122 -22.7%
43 23.7% 104 7.6% 358 -5.6% -13.1%
Dupixent 107 - -
10 -
95 -
2 - 0 - 107 - - Kevzara 10 - -
2 -
8 -
0 - 0 - 10 - -
Total Immunology 117 - -
12 -
103 -
2 - 0 - 117 - -
Alprolix 21 - -
0 -
16 -
5 - 0 - 21 - - Eloctate 43 - -
0 -
35 -
8 - 0 - 43 - -
Total Rare Blood Disorder 64 - -
0 -
51 -
13 - 0 - 64 - -
Sanofi Genzyme (Specialty Care) 1,460 16.2% 5.9%
489 7.9%
823 21.4%
148 14.7% 250 16.9% 1,710 16.3% 5.4%
Lantus 663 -24.5% -31.9%
181 -9.0%
413 -31.0%
69 -8.2% 248 8.6% 911 -17.7% -25.9% Toujeo 169 4.0% -4.0%
67 45.7%
85 -14.8%
17 20.0% 28 146.2% 197 13.8% 4.2%
Apidra 64 -8.1% -13.5%
35 0.0%
21 -17.2%
8 -10.0% 27 29.2% 91 1.0% -7.1%
Amaryl 11 -29.4% -35.3%
4 -20.0%
0 -100.0%
7 -27.3% 72 9.7% 83 2.2% -6.7% Soliqua / Suliqua 9 175.0% 125.0%
0 -
9 150.0%
0 - 0 - 9 175.0% 125.0%
Total Diabetes 964 -18.0% -25.3%
323 -0.9%
534 -26.6%
107 -4.8% 392 17.7% 1,356 -10.0% -18.5%
Multaq 77 -9.4% -19.8%
11 0.0%
66 -8.4%
0 -100.0% 2 0.0% 79 -9.2% -19.4% Praluent 47 54.5% 42.4%
19 137.5%
26 25.0%
2 100.0% 2 100.0% 49 55.9% 44.1%
Total Cardiovascular 124 7.0% -3.9%
30 57.9%
92 -0.9%
2 -33.3% 4 33.3% 128 7.6% -3.0%
Diabetes & Cardiovascular 1,088 -15.7% -23.4%
353 2.3%
626 -23.7%
109 -5.4% 396 17.9% 1,484 -8.7% -17.3%
Plavix 387 8.9% 1.8%
38 -2.6%
0 -
52 -29.1%
297 22.1% 387 8.9% 1.8%
Lovenox 391 -0.7% -5.6%
244 -5.1%
12 -6.7%
20 0.0%
115 9.2% 391 -0.7% -5.6%
Renagel / Renvela 101 -54.1% -58.9%
16 -11.1%
61 -66.2%
9 11.1%
15 41.7% 101 -54.1% -58.9%
Aprovel/Avapro 172 -3.1% -10.4%
28 -9.7%
2 0.0%
20 -52.3%
122 17.5% 172 -3.1% -10.4% Allegra 52 -16.2% -23.5%
2 0.0%
0 -
50 -16.7%
0 - 52 -16.2% -23.5%
Myslee / Ambien / Stilnox 61 -8.2% -16.4%
11 10.0%
10 -20.0%
22 -17.2%
18 5.3% 61 -8.2% -16.4% Synvisc / Synvisc One 68 -15.6% -24.4%
6 -25.0%
45 -22.4%
4 -25.0%
13 36.4% 68 -15.6% -24.4%
Depakine 114 6.2% 0.9%
42 0.0%
0 -
3 -25.0%
69 11.9% 114 6.2% 0.9% Tritace 57 -3.2% -8.1%
36 -7.7%
0 -
1 0.0%
20 4.5% 57 -3.2% -8.1%
Other Rx Drugs 917 -3.4% -9.9%
448 -3.4%
50 1.7%
95 -7.8%
324 -2.9% 917 -3.4% -9.9% Total Established Rx Products 2,320 -6.4% -12.7%
871 -4.3%
180 -42.5%
276 -19.3%
993 9.7% 2,320 -6.4% -12.7%
Generics 435 0.9% -6.7%
184 -6.1%
23 -27.0%
49 60.6%
179 3.0% 435 0.9% -6.7%
Total Emerging Markets Specialty Care 250 16.9% 2.9%
0 -
0 -
17 53.8%
250 16.9%
Total Emerging Markets Diabetes & Cardiovascular 396 17.9% 5.6%
396 17.9%
General Medicines & Emerging Markets 3,401 -1.5% -9.1%
1,055 -4.6%
203 -41.0%
325 -12.8%
1,818 11.6% 2,755 -5.3% -11.8%
Total Pharmaceuticals 5,949 -0.9% -9.0%
1,897 -0.4%
1,652 -10.4%
582 -5.6%
1,818 11.6% 5,949 -0.9% -9.0%
Allergy, Cough and Cold 341 -8.1% -16.2%
100 -4.7%
105 -20.8%
54 3.6%
82 2.2% 341 -8.1% -16.2%
Pain 324 8.9% -0.3%
132 -5.0%
37 -2.3%
27 7.4%
128 30.4% 324 8.9% -0.3%
Digestive 248 15.0% 6.0%
84 -1.2%
48 25.0%
13 25.0%
103 23.7% 248 15.0% 6.0% Nutritional 164 3.4% -5.7%
33 3.1%
9 0.0%
58 0.0%
64 7.5% 164 3.4% -5.7%
Consumer Healthcare 1,238 2.0% -6.9%
382 -5.0%
287 -4.9%
160 2.9%
409 14.4% 1,238 2.0% -6.9%
Polio / Pertussis / Hib 380 -4.6% -12.0%
71 26.3%
111 0.8%
41 0.0%
157 -17.6% 380 -4.6% -12.0% Adult Booster Vaccines 92 26.6% 16.5%
37 117.6%
41 4.4%
7 12.5%
7 -22.2% 92 26.6% 16.5%
Meningitis / Pneumonia 89 7.4% -6.3%
0 -100.0%
67 8.5%
4 150.0%
18 -4.8% 89 7.4% -6.3%
Influenza Vaccines 29 -15.8% -23.7%
1 -
4 66.7%
5 -50.0%
19 -16.0% 29 -15.8% -23.7%
Travel And Other Endemics Vaccines 102 2.8% -3.8%
27 22.7%
22 -13.8%
15 21.4%
38 -2.4% 102 2.8% -3.8% Vaccines 711 -0.9% -9.3%
137 38.0%
259 4.2%
75 1.2%
240 -18.4% 711 -0.9% -9.3% Total Company 7,898 -0.4% -8.7%
2,416 0.5%
2,198 -8.2%
817 -3.4%
2,467 8.3% 7,898 -0.4% -8.7%

13
Appendix 2: Business net income statement
First quarter 2018 Pharmaceuticals Consumer Healthcare Vaccines Others(2)
Total Group
€ million Q1
2018 Q1
2017(1)
Change
Q1 2018
Q1 2017
(1)
Change Q1
2018 Q1
2017(1)
Change
Q1 2018
Q1 2017
(1)
Change Q1
2018 Q1
2017(1)
Change
Net sales 5,949 6,539 (9.0%) 1,238 1,330 (6.9%) 711 784 (9.3%) - - - 7,898 8,653 (8.7%)
Other revenues 58 76 (23.7%) - - - 170 173 (1.7%) - - - 228 249 (8.4%)
Cost of sales (1,587) (1,710) (7.2%) (399) (425) (6.1%) (475) (498) (4.6%) (54) (64) (15.6%) (2,515) (2,697) (6.7%)
As % of net sales (26.7%) (26.2%) (32.2%) (32.0%) (66.8%) (63.5%) (31.8%) (31.2%)
Gross profit 4,420 4,905 (9.9%) 839 905 (7.3%) 406 459 (11.5%) (54) (64) (15.6%) 5,611 6,205 (9.6%)
As % of net sales 74.3% 75.0% 67.8% 68.0% 57.1% 58.5% 71.0% 71.7%
Research & Development expenses
(978) (1,000) (2.2%) (28) (22) 27.3% (126) (123) 2.4% (148) (164) (9.8%) (1,280) (1,309) (2.2%)
As % of net sales (16.4%) (15.3%) (2.3%) (1.7%) (17.7%) (15.7%) (16.2%) (15.1%)
Selling and general expenses
(1,254) (1,385) (9.5%) (389) (436) (10.8%) (153) (170) (10.0%) (514) (491) 4.7% (2,310) (2,482) (6.9%)
As % of net sales (21.1%) (21.2%) (31.4%) (32.8%) (21.5%) (21.7%) (29.2%) (28.7%)
Other current operating income/ expenses
(7) 33 5 32 2 (3) (31) (28) (31) 34
Share of profit/loss of associates* and joint-ventures
75 24 - - (1) - - - 74 24
Net income attributable to non-controlling interests
(26) (27) (4) (8) - - - - (30) (35)
Business operating income
2,230 2,550 (12.5%) 423 471 (10.2%) 128 163 (21.5%) (747) (747) - 2,034 2,437 (16.5%)
As % of net sales 37.5% 39.0% 34.2% 35.4% 18.0% 20.8% 25.8% 28.2%
Financial income and expenses 2 (63)
Income tax expenses (438) (584)
Tax rate** 22.0% 24.5%
Business net income 1,598 1,790 (10.7%)
As % of net sales 20.2% 20.7%
Business earnings / share (in euros) ***
1.28 1.42 (9.9%)
* Net of tax. ** Determined on the basis of Business income before tax, associates and non-controlling interests.
*** Based on an average number of shares outstanding of 1,248.2 million in the first quarter of 2018 and 1,262.4 million in the first quarter of 2017 (1) 2017 restated using the new revenue recognition standard IFRS15, effective January 1, 2018. (2) Others include the cost of global support functions (Medical Affairs, External Affairs, Finance, Human Resources, Information Solution & Technologies, Sanofi Business
Services, etc.).
14
Appendix 3: Consolidated income statements
€ million Q1 2018 Q1 2017 (1)
Net sales 7,898 8,653
Other revenues 228 249
Cost of sales (2,545) (2,785)
Gross profit 5,581 6,117
Research and development expenses (1,280) (1,309)
Selling and general expenses (2,312) (2,482)
Other operating income 25 60
Other operating expenses (56) (26)
Amortization of intangible assets (458) (503)
Impairment of intangible assets (3) -
Fair value remeasurement of contingent consideration (56) (36)
Restructuring costs and similar items (191) (119)
Other gains and losses and litigation (49) -
Operating income 1,201 1,702
Financial expenses (95) (111)
Financial income 97 48
Income before tax and associates and joint ventures 1,203 1,639
Income tax expense (187) (336)
Share of profit/loss of associates and joint ventures 30 -
Net income excluding the held for exchange Animal Health business 1,046 1,303
Net income from the held for exchange Animal Health business (2)
(1) 4,427
Net income 1,045 5,730
Net income attributable to non-controlling interests 29 34
Net income attributable to equity holders of Sanofi 1,016 5,696
Average number of shares outstanding (million) 1,248.2 1,262.4
Earnings per share (in euros) excluding the held for exchange Animal Health business
0.81 1.01
IFRS earnings per share (in euros) 0.81 4.51
(1) 2017 restated using the new revenue recognition standard IFRS15, effective January 1, 2018. (2) In 2017, net gain resulting from the divestment of the Animal Health business presented separately in accordance with IFRS 5, Non current assets held-for-sale
and discontinued operations.
15
Appendix 4: Reconciliation of Net income attributable to equity holders of Sanofi to Business net income
€ million Q1 2018 Q1 2017(1)
Variation
Net income attributable to equity holders of Sanofi 1,016 5,696 (82.2%)
Amortization of intangible assets (2)
458 503
Impairment of intangible assets 3 -
Fair value remeasurement of contingent consideration 56 36
Expenses arising from the impact of business combinations on inventories
30 88
Other expenses related to business combinations 2 -
Restructuring costs and similar items 191 119
Other gains and losses, and litigation (3)
49 -
Tax effect of items listed above: (185) (248)
Amortization & impairment of intangible assets (122) (182)
Fair value remeasurement of contingent consideration (6) (6)
Expenses arising from the impact of business combinations on inventories
(6) (28)
Other expenses related to business combinations (1) -
Restructuring costs and similar items (52) (43)
Other tax effects 2 11
Other tax ítems(4)
(66) -
Share of items listed above attributable to non-controlling interests (1) (1)
Restructuring costs of associates and joint-ventures, and expenses arising from the impact of acquisitions on associates and joint-ventures
44 24
Animal Health items (5)
1 (4,427)
Business net income 1,598 1,790 (10.7%)
IFRS earnings per share (6)
(in euros) 0.81 4.51
(1) 2017 restated using the new revenue recognition standard IFRS15, effective January 1, 2018.
(2) Of which related to amortization expense generated by the remeasurement of intangible assets as part of business combinations: €425 million in the first quarter of 2018 and €466 million in the first quarter of 2017.
(3) In 2018, separation costs for the European Generics business divestiture. (4) In 2018, mainly due to US tax reform. (5) In 2017, net gain resulting from the divestment of the Animal Health business presented separately in accordance with IFRS 5, Non current assets held-for-sale and
discontinued operations. (6) Based on an average number of shares outstanding of 1,248.2 million in the first quarter of 2018 and 1,262.4 million in the first quarter of 2017.

16
Appendix 5 : currency sensitivity
2018 Business EPS currency sensitivity
Currency Variation Business EPS Sensitivity
U.S. Dollar +0.05 USD/EUR -EUR 0.10
Japanese Yen +5 JPY/EUR -EUR 0.01
Chinese Yuan +0.2 CNY/EUR -EUR 0.02
Brazilian Real +0.4 BRL/EUR -EUR 0.02
Russian Ruble +10 RUB/EUR -EUR 0.03
Currency exposure on Q1 2018 sales
Currency Q1 2018
US $ 28.9%
Euro € 26.4%
Chinese Yuan 7.8%
Japanese Yen 5.3%
Brazilian Real 3.7%
British Pound 2.1%
Russian Ruble 1.8%
Australian $ 1.5%
Canadian $ 1.5%
Mexican Peso 1.3%
Others 19.7%
Currency average rates
Q1 2017 Q1 2018 Change
€/$ 1.06 1.23 +15.4%
€/Yen 121.12 133.16 +9.9%
€/Yuan 7.32 7.81 +6.8%
€/Real 3.35 3.99 +19.3%
€/Ruble 62.53 69.93 +11.8%

17
Appendix 6: R&D Pipeline
O : Opt-in rights products for which rights have not been exercised yet R : Registration Study (other than Phase 3)
Immuno-inflammation
Oncology
Rare Diseases
Rare Blood Disorders
MS, Neuro, Gene therapy
Diabetes
Cardiovascular & metabolism
Infectious Diseases
Vaccines
New Molecular Entities(*)
Phase 1
(Total : 14) Phase 2
(Total : 15) Phase 3
(Total : 6) Registration
(Total : 2) SAR439794 TLR4 agonist Peanut Allergy
SAR442168(3)
BTK inhibitor
Multiple Sclerosis
SAR440340(**)
Anti-IL33 mAb
Asthma
SAR425899 GLP-1/GCG dual agonist Obesity/Overweight in T2D
isatuximab Anti-CD38 mAb
3L Relapsing Refractory MM (ICARIA)
cemiplimab(10)(**)
PD-1 inhibitor mAb Advanced CSCC (EU)
SAR408701 Maytansin-loaded anti-CEACAM5
mAb Solid Tumors
SAR438335 GLP-1/GIP dual agonist
Type 2 Diabetes
SAR156597 IL4/IL13 bi-specific mAb
Systemic Scleroderma
mavacamten(7)(**)
Myosin inhibitor - Obstructive
Hypertrophic Cardiomyopathy
avalglucosidase alfa Neo GAA
Pompe Disease
sotagliflozin(**)
Oral SGLT-1&2 inhibitor
Type 1 Diabetes (U.S./EU)
SAR439459 anti-TGFb mAb
Advanced Solid Tumors
SAR440181(4)(**)
Myosin activation
Dilated Cardiomyopathy
GZ389988 TRKA antagonist
Osteoarthritis
SAR407899 rho kinase
Microvascular Angina
fitusiran(9)
siRNA targeting Anti-Thrombin
Hemophilia A and B
REGN3767(1)
Anti LAG-3 mAb Advanced Cancers
SAR247799 S1P1 agonist
Cardiovascular indication
SAR566658 Maytansin-loaded anti-CA6 mAb
Triple Negative Breast Cancer
Combination ferroquine / OZ439
(**)
Antimalarial
BIVV009 Anti Complement C1s mAb
Cold Agglutinin Disease
SAR439859 SERD
Metastatic Breast Cancer
Herpes Simplex Virus Type 2 HSV-2 vaccine
olipudase alfa rhASM
Acid Sphingomyelinase Deficiency(5)
Tuberculosis Recombinant subunit vaccine
SAR341402 Rapid acting insulin
Type 1/2 Diabetes
BIVV001 rFVIIIFc – vWF – XTEN
(2)
Hemophilia A
Respiratory syncytial virus Infants
Vaccines
SAR339375(6)
miRNA-21
Alport Syndrome
HIV Viral vector prime & rgp120 boost
vaccine
efpeglenatide(**)
Long-acting GLP-1 agonist
Type 2 Diabetes
UshStat®
Myosin 7A gene therapy Usher Syndrome 1B
venglustat
Oral GCS inhibitor Gaucher related Parkinson’s Disease
SP0232(8)
mAb(**)
Respiratory syncytial virus
Monoclonal Antibody
SAR228810 Anti-protofibrillar AB mAb
Alzheimer’s Disease
SAR422459 ABCA4 gene therapy
Stargardt Disease
(1) Regeneron product for which Sanofi has opt-in right (2) Recombinant Coagulation Factor VIII Fc – von Willebrand Factor – XTEN Fusion protein (3) Also known as PRN2246 (4) Also known as MYK491 (5) Also known as Niemann Pick type B (6) Regulus product for which Sanofi has opt-in right (7) Also known as SAR439152 and MYK461
(8) Also known as MEDI8897 (9) Following the Alnylam/Sanofi strategic restructuring of the RNAi therapeutics rare disease alliance announced in January 2018,
Sanofi now has global rights on fitusiran (10) Also known as SAR439684 and REGN2810 (*) Data related to all studies published on clinicaltrials.gov (**) Partnered and/or in collaboration – Sanofi may have limited or shared rights on some of these products
R O
R
O
18
Additional Indications(*)
Phase 1
(Total : 5) Phase 2
(Total : 12) Phase 3
(Total : 16) Registration
(Total : 4)
SAR439459 + cemiplimab(1)(**)
Anti-TGFb mAb + PD-1 inhibitor mAb
Advanced Solid Tumors
dupilumab(**)
Anti-IL4Rα mAb
Eosinophilic Esophagitis
sotagliflozin(**)
SGLT 1 & 2 inhibitor
Worsening Heart Failure in Diabetes
dupilumab(**)
Anti-IL4Rα mAb
Asthma 6 - 11 years old
isatuximab Anti-CD38 mAb
1-3L Relapsing Refractory MM (IKEMA)
dupilumab(**)
Anti-IL4Rα mAb
Asthma 12y+ (U.S./EU)
isatuximab Anti-CD38 mAb + CyBord
(2)
Newly Diagnosed MM
sarilumab(**)
Anti-IL6R mAb
Polyarticular Juvenile Idiopathic Arthritis
Rabies VRVg Purified vero rabies vaccine
dupilumab(**)
Anti-IL4Rα mAb Nasal Polyposis
sotagliflozin(**)
Oral SGLT-1&2 inhibitor
Type 2 Diabetes
VaxiGrip® QIV IM
Quadrivalent inactivated Influenza vaccine 6 - 35 months
cemiplimab(1)(**)
+ REGN3767(3)
PD-1 inhibitor mAb + anti LAG-3 mAb
Advanced Cancers
sarilumab(**)
Anti-IL6R mAb
Systemic Juvenile Arthritis
Adacel+ Tdap booster
Dupixent®(**)
Anti-IL4Rα mAb
Atopic Dermatitis 12 – 17 years old
Aubagio®
teriflunomide Relapsing Multiple Sclerosis –
Pediatric
PR5i DTP-HepB-Polio-Hib
Pediatric hexavalent vaccines (U.S.)
SAR439859 SERD + Palbociclib
Metastatic Breast Cancer
cemiplimab(1)(**)
PD-1 inhibitor mAb
Advanced Basal Cell Carcinoma
Shan 6 DTP-HepB-Polio-Hib
Pediatric hexavalent vaccine
Dupixent®(**)
Anti-IL4Rα mAb
Atopic Dermatitis 6 – 11 years old
Lemtrada®
alemtuzumab Relapsing Remitting Multiple
Sclerosis - Pediatric
Fluzone® 0,5 mL QIV
Quadrivalent inactivated Influenza vaccine 6 months+
BIVV009 Anti Complement C1s mAb
Immune Thrombocytopenia
isatuximab + cemiplimab(1)(**)
Anti-CD38 mAb + PD-1
inhibitor mAb Relapsing Refractory MM
Dupixent®(**)
Anti-IL4Rα mAb
Atopic Dermatitis 6 months - 5 years old
Praluent®(**)
Anti-PCSK9 mAb CV events reduction
isatuximab + cemiplimab(1)(**)
Anti-CD38 mAb + PD-1
inhibitor mAb Advanced Malignancies
cemiplimab
(1)(**)
PD-1 inhibitor mAb 1L NSCLC
Fluzone® QIV HD
Quadrivalent inactivated Influenza vaccine - High dose
venglustat
Oral GCS inhibitor Gaucher Disease Type 3
cemiplimab
(1)(**)
PD-1 inhibitor mAb 2L Cervical Cancer
Men Quad TT Advanced generation
meningococcal ACYW conjugate vaccine
venglustat
Oral GCS inhibitor Fabry Disease
isatuximab
Anti-CD38 mAb 1L Newly Diagnosed MM (IMROZ)
Pediatric pentavalent vaccine DTP-Polio-Hib
Japan
(1) Also known as SAR439684 and REGN2810
(2) Cyclophosmamide + bortezomib (Velcade) + dexamethasone
(3) Regeneron product for which Sanofi has opt-in right (*) Data related to all studies published on clinicaltrials.gov (**) Partnered and/or in collaboration - Sanofi may have limited or shared rights on some of these products
R
R
O

19
Expected Submission Timeline(1)
New Molecular Entities Additional Indications
2018 isatuximab
anti-CD38 mAb 3L RRMM (ICARIA) – U.S.
cemiplimab(2)(**)
PD-1 inhibitor mAb
Advanced CSCC – U.S./EU
dupilumab(3)(**)
Anti-IL4Ra mAb
Asthma adults & adolesc. – EU
Dupixent®(3)(**)
Anti-IL4Ra mAb
AD 12 – 17 years old – U.S./EU
sotagliflozin
(**)
Oral SGLT-1&2 inhibitor Type 1 Diabetes – U.S./EU
Praluent
®(*)
Anti-PCSK9 mAb CV events reduction – U.S./EU
2019
SAR341402 Rapid acting insulin
Type 1/2 Diabetes – EU(4)
Dupixent®(**)
Anti-IL4Ra mAb
AD 6 - 11 years old – U.S./EU
dupilumab(3)(**)
Anti-IL4Ra mAb
Nasal Polyposis Adult – U.S./EU
cemiplimab
(2)(**)
PD-1 inhibitor mAb Advanced BCC – U.S./EU
cemiplimab(2)(**)
PD-1 inhibitor mAb
1L NSCLC – U.S./EU
sotagliflozin
(**)
Oral SGLT-1&2 inhibitor Type 2 Diabetes – EU
(5)
Men Quad TT
Adv. generation meningococcal U.S. & EU – 10 Yrs +
Fluzone
® QIV HD
Quadrivalent inactivated Influenza vaccine - High dose
2020
olipudase alfa rhASM
ASD(6)
– U.S./EU
Fitusiran(7)
siRNA inhibitor
Hemophilia A/B – U.S./EU
sarilumab(**)
Anti-IL6R mAb
Polyarticular Juvenile Idiopathic Arthritis – U.S./EU
isatuximab Anti-CD38 mAb
1-3L RRMM (IKEMA) – U.S./EU
avalglucosidase alfa
NeoGAA Pompe Disease – U.S./EU
cemiplimab(2)(**)
PD-1 inhibitor mAb
2L Cervical Cancer – U.S./EU
Aubagio®
teriflunomide Relapsing MS – Pediatrics – U.S./EU
BIVV009(8)
Anti Complement C1s mAb
Cold Agglutinin Disease – U.S./EU
Shan 6
DTP-HepB-Polio-Hib Pediatric hexavalent vaccine
Pediatric pentavalent vaccine DTP-Polio-Hib (Japan)

20
New Molecular Entities Additional Indications
2021
efpeglenatide(**)
Long acting GLP1-R agonist Type 2 Diabetes – U.S./EU
dupilumab
(3)(**)
Anti-IL4Rα mAb Asthma 6 - 11 years old – U.S./EU
sotagliflozin(**)
SGLT 1/2 inhibitor
Worsening Heart Failure in Diabetes – U.S./EU
isatuximab Anti-CD38 mAb
1L Newly Diagnosed MM (IMROZ) – U.S./EU
2022
and beyond
GZ389988
TRKA antagonist Osteoarthritis – U.S./EU
SAR156597 IL4/IL13 bi-specific mAb
Systemic Scleroderma – U.S./EU
Dupixent®(**)
Anti-IL4Rα mAb
AD 6 months - 5 years old – U.S./EU
sarilumab(**)
Anti-IL6R mAb
Systemic Juvenile Arthritis – U.S./EU
SAR440340(**)
Anti-IL33 mAb
Asthma – U.S./EU
SAR566658 Maytansin-loaded anti-CA6 mAb
Triple Negative Breast Cancer
dupilumab(3)(**)
Anti-IL4Ra mAb
Eosinophilic Esophagitis – U.S./EU
venglustat Oral GCS inhibitor
Fabry Disease – U.S./EU
SAR422459 ABCA4 gene therapy
Stargardt Disease – U.S./EU
venglustat Oral GCS inhibitor GrPD
(9) – U.S./EU
venglustat Oral GCS inhibitor
Gaucher Disease Type 3 – U.S./EU
Adacel+ Tdap booster
SAR425899 GLP-1/GCG dual agonist
Obesity/Overweight in T2D – U.S./EU
SAR407899 rho kinase
Microvascular Angina – U.S./EU
Rabies VRVg Purified vero rabies vaccine
Combination ferroquine / OZ439
(**)
Antimalarial – U.S./EU
SP0232 mAbs(**)(10)
Respiratory syncytial virus
U.S.
HIV
Viral vector prime & rgp120 boost vaccine Tuberculosis
Recombinant subunit vaccine
(1) Excluding Phase 1 - Data related to all studies published on clinicaltrials.gov (2) Also known as SAR439684 and REGN2810 (3) Also known as SAR231893 (4) Submission strategy for the U.S. under evaluation (5) Submission for the U.S. expected in 2020 (6) Acid Sphingomyelinase Deficiency (7) Following the Alnylam/Sanofi strategic restructuring of the RNAi therapeutics rare disease alliance announced in January 2018, Sanofi now has global rights on fitusiran (8) Currently operating as separate entities. Reported dates are based on prior Bioverativ disclosure of study completion date (9) Gaucher Related Parkinson’s Disease (10) Also known as MEDI8897 (**) Partnered and/or in collaboration – Sanofi may have limited or shared rights on some of these products

21
Pipeline Movements Since Q4 2017
Additions to the pipeline Removals from the pipeline
Phase 1 BIVV001 rFVIIIFc – vWF – XTEN
(1)
Hemophilia A
lumasiran(3)
Investigational RNAi therapeutic Primary Hyperoxaluria Type 1 (PH1)
BIVV009
Anti Complement C1s mAb Immune Thrombocytopenia
Phase 2
SAR440340(**)
Anti-IL33 mAb
Asthma
isatuximab + cemiplimab(2)(**)
Anti-CD38 mAb + PD-1 inhibitor mAb
Relapsing Refractory Multiple Myeloma
isatuximab + cemiplimab(2)(**)
Anti-CD38 mAb + PD-1 inhibitor mAb
Advanced Malignancies
Phase 3
BIVV009 Anti Complement C1s mAb
Cold Agglutinin Disease
Registration cemiplimab
(2)(**)
PD-1 inhibitor mAb Advanced CSCC (EU)
Fluzone® 0,5 mL QIV
Quadrivalent inactivated Influenza vaccine 6 months+
sotagliflozin(**)
Oral SGLT-1&2 inhibitor Type 1 Diabetes (U.S./EU)
(1) Recombinant Coagulation Factor VIII Fc – von Willebrand Factor – XTEN Fusion protein (2) Also known as SAR439684 and REGN2810 (3) In March 2018 Sanofi Genzyme declined its opt-in for the development and commercialization of lumasiran (ALN-GO1) (**) Partnered and/or in collaboration – Sanofi may have limited or shared rights on some of these products

22
Appendix 7: Expected R&D milestones
Products Expected milestones Timing
Praluent® U.S. sBLA Filing to include ODYSSEY OUTCOMES results Q2 2018
cemiplimab (anti-PD1 mAb) U.S. BLA Filing in advanced cutaneous squamous cell carcinoma Q2 2018
mavacamten Start of Phase 3 in Obstructive Hypertrophic Cardiomyopathy Q2 2018
fitusiran Start of Phase 3 in Hemophilia A & B as prophylactic treatment Q2 2018
efpeglenatide Start of Phase 3 CVOT study Q2 2018
isatuximab (anti-CD38 mAb) Start of Phase 3 in 1st line Multiple Myeloma in SCT eligible patients (GMMG) Q3 2018
venglustat Start of Pivotal study in Autosomal Dominant Polycystic Kidney Disease Q3 2018
sotagliflozin Start of Phase 3 in Worsening Heart Failure in Diabetes patients Q3 2018
dupilumab U.S. regulatory decision in Asthma in Adult/Adolescent patients Q4 2018
dupilumab Start of Phase 3 trial in Eosinophilic Esophagitis Q4 2018
dupilumab Start of Phase 3 trial in Chronic Obstructive Pulmonary Disease Q4 2018
isatuximab (anti-CD38 mAb) Phase 3 results in Multiple Myeloma in combination with PomDex (ICARIA) Q4 2018
isatuximab (anti-CD38 mAb) U.S. regulatory submission in Multiple Myeloma in combination with PomDex Q4 2018
dupilumab Phase 3 read-out in Atopic Dermatitis patients aged 12-17 year old Q4 2018
dupilumab Phase 3 read-out in Nasal Polyps Q4 2018
alemtuzumab Start of Phase 3 in Primary Progressive Multiple Sclerosis H2 2018
efpeglenatide Start of Phase 3 in Type 2 Diabetes as add-on to basal insulins Q1 2019
efpeglenatide Start of Phase 3 in Type 2 Diabetes as add-on to metformin vs dulaglutide Q1 2019
sotagliflozin EU CHMP decision expected in Type 1 Diabetes Q1 2019
cemiplimab (anti-PD1 mAb) EU CHMP decision expected in Advanced Cutaneous Squamous Cell Carcinoma Q1 2019

23
Appendix 8: Definitions of non-GAAP financial indicators Company
“Company” corresponds to Sanofi and its subsidiaries Company sales at constant exchange rates (CER)
When we refer to changes in our net sales “at constant exchange rates” (CER), this means that we exclude the effect of changes in exchange rates.
We eliminate the effect of exchange rates by recalculating net sales for the relevant period at the exchange rates used for the previous period. Reconciliation of net sales to Company sales at constant exchange rates for the first quarter 2018
€ million Q1 2018
Net sales 7,898
Effect of exchange rates (719)
Company sales at constant exchange rates 8,617
Business net income Sanofi publishes a key non-GAAP indicator. Business net income is defined as net income attributable to equity holders of Sanofi excluding:
amortization of intangible assets,
impairment of intangible assets,
fair value remeasurement of contingent consideration related to business combinations or to disposals,
other impacts associated with acquisitions (including impacts of acquisitions on associates and joint ventures),
restructuring costs and similar items(1)
,
other gains and losses (including gains and losses on disposals of non-current assets(1)
),
costs or provisions associated with litigation(1)
,
tax effects related to the items listed above as well as effects of major tax disputes,
net income attributable to non-controlling interests related to the items listed above,
(1) Reported in the line items Restructuring costs and similar items and Gains and losses on disposals, and litigation, which are defined in Note B.20. to our
consolidated financial statements.