Embed Size (px)
Citation preview
JANUARY 4, 2018
FIRST QUARTER 2018 FINANCIAL RESULTS
Certain statements contained in this presentation are “forward-looking statements,” such as statements concerning the company’s anticipated financial results, current and future product performance, regulatory approvals, business and financial plans and other non-historical facts, as well as the pending transaction with Bayer Aktiengesellschaft (“Bayer”). These statements are based on current expectations and currently available information. However, since these statements are based on factors that involve risks and uncertainties, the company’s actual performance and results may differ materially from those described or implied by such forward-looking statements. Factors that could cause or contribute to such differences include, among others: risks related to the pending transaction between the company and Bayer, including the risk that the regulatory approvals required for the transaction may not be obtained on the anticipated terms or time frame or at all, the risk that the other conditions to the completion of the transaction may not be satisfied, the risk that disruptions or uncertainties related to the pending transaction could adversely affect the company’s business, financial performance and/or relationships with third parties, and the risk that certain contractual restrictions during the pendency of the transaction could adversely affect the company’s ability to pursue business opportunities or strategic transactions; continued competition in seeds, traits and agricultural chemicals; the company’s exposure to various contingencies, including those related to intellectual property protection, regulatory compliance and the speed with which approvals are received, and public understanding and acceptance of our biotechnology and other agricultural products; the success of the company’s research and development activities; the outcomes of major lawsuits, including potential litigation related to the pending transaction with Bayer; developments related to foreign currencies and economies; fluctuations in commodity prices; compliance with regulations affecting our manufacturing; the accuracy of the company’s estimates related to distribution inventory levels; the levels of indebtedness, continued availability of capital and financing and rating agency actions; the company’s ability to fund its short-term financing needs and to obtain payment for the products that it sells; the effect of weather conditions, natural disasters, accidents, and security breaches, including cybersecurity incidents, on the agriculture business or the company’s facilities; and other risks and factors detailed in the company’s most recent periodic report to the SEC. Undue reliance should not be placed on these forward-looking statements, which are current only as of the date of this presentation. The company disclaims any current intention or obligation to update any forward-looking statements or any of the factors that may affect actual results.
ForwardLookingStatements
© 2018 Monsanto Company 2
Fiscal Year References to year, or to fiscal year, are on a fiscal year basis and refer to the 12-month period ending August 31.
Trademarks Trademarks owned by Monsanto Company and its wholly-owned subsidiaries are italicized in this presentation. All other trademarks are the property of their respective owners.
The information on unregistered pesticides in this presentation is for educational purposes and is not an offer to sell or use any unregistered product mentioned in this presentation.
Non-GAAP Financial Information
3
This presentation may use the non-GAAP financial measures of “free cash flow,” earnings per share (EPS) on an ongoing basis, gross profit on an ongoing basis, operating expenses on an ongoing basis and net income (loss) attributable to Monsanto Company on an ongoing basis.
We define free cash flow as cash flows from operating activities less capital expenditures. Prior to the second quarter of fiscal year 2017, we defined free cash flows as the total of net cash provided or required by operating activities and net cash provided or required by investing activities. As this definition varies from other more common definitions of free cash flow, we determined it was appropriate to redefine free cash flow to conform to one of the more typical definitions, beginning with the second quarter of fiscal year 2017. The prior period calculations of free cash flow have been restated to conform to the new presentation.
A non-GAAP EPS financial measure, which we refer to as ongoing EPS, excludes certain after-tax items that we do not consider part of ongoing operations, which are identified in the reconciliation. Earnings (loss) is intended to mean net income (loss) attributable to Monsanto Company as presented in the Statements of Consolidated Operations under GAAP. Ongoing gross profit and ongoing operating expenses exclude certain pretax items that we do not consider part of ongoing operations, which are identified in the reconciliations. Ongoing net income (loss) attributable to Monsanto Company is defined as net income (loss) attributable to Monsanto Company excluding the cumulative after-tax impact of certain items we do not consider part of ongoing operations.
Our presentation of non-GAAP financial measures is intended to supplement investors’ understanding of our operating performance, not replace gross profit, operating expenses, other expenses, net, net income (loss) attributable to Monsanto Company, diluted EPS, cash flows, financial position, or comprehensive income (loss), as determined in accordance with GAAP. Furthermore, these non-GAAP financial measures may not be comparable to similar measures used by other companies. The non-GAAP financial measures used in this presentation are reconciled to the most directly comparable financial measures calculated and presented in accordance with GAAP.
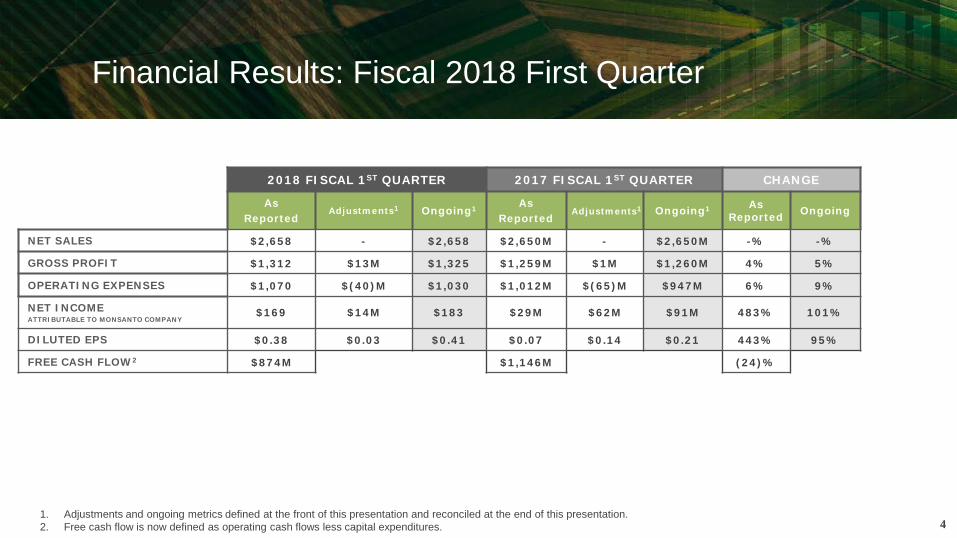
1. Adjustments and ongoing metrics defined at the front of this presentation and reconciled at the end of this presentation.2. Free cash flow is now defined as operating cash flows less capital expenditures.
Financial Results: Fiscal 2018 First Quarter
4
2018 FISCAL 1ST QUARTER 2017 FISCAL 1ST QUARTER CHANGE
AsReported
Adjustments1 Ongoing1 AsReported
Adjustments1 Ongoing1 As Reported Ongoing
NET SALES $2,658 - $2,658 $2,650M - $2,650M -% -%
GROSS PROFIT $1,312 $13M $1,325 $1,259M $1M $1,260M 4% 5%
OPERATING EXPENSES $1,070 $(40)M $1,030 $1,012M $(65)M $947M 6% 9%
NET INCOMEATTRIBUTABLE TO MONSANTO COMPANY
$169 $14M $183 $29M $62M $91M 483% 101%
DILUTED EPS $0.38 $0.03 $0.41 $0.07 $0.14 $0.21 443% 95%
FREE CASH FLOW2 $874M $1,146M (24)%
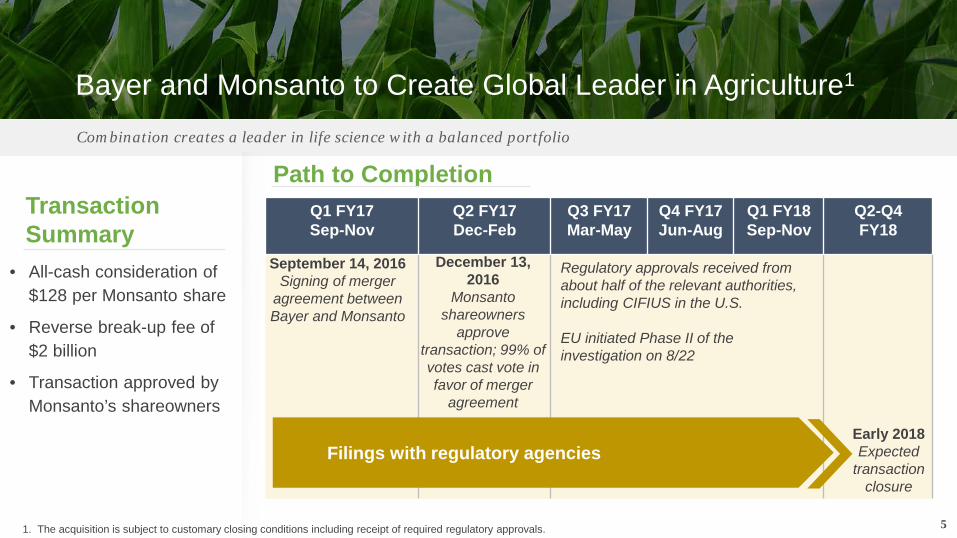
Bayer and Monsanto to Create Global Leader in Agriculture1
Combination creates a leader in life science with a balanced portfolio
Path to Completion
5
Q1 FY17Sep-Nov
Q2 FY17Dec-Feb
Q3 FY17Mar-May
Q4 FY17Jun-Aug
Q1 FY18Sep-Nov
Q2-Q4 FY18
Regulatory approvals received from about half of the relevant authorities, including CIFIUS in the U.S.
EU initiated Phase II of the investigation on 8/22
Early 2018Expected
transaction closure
Filings with regulatory agencies
December 13, 2016
Monsanto shareowners
approve transaction; 99% of votes cast vote in favor of merger
agreement
September 14, 2016Signing of merger
agreement between Bayer and Monsanto
TransactionSummary
• All-cash consideration of $128 per Monsanto share
• Reverse break-up fee of $2 billion
• Transaction approved by Monsanto’s shareowners
1. The acquisition is subject to customary closing conditions including receipt of required regulatory approvals.
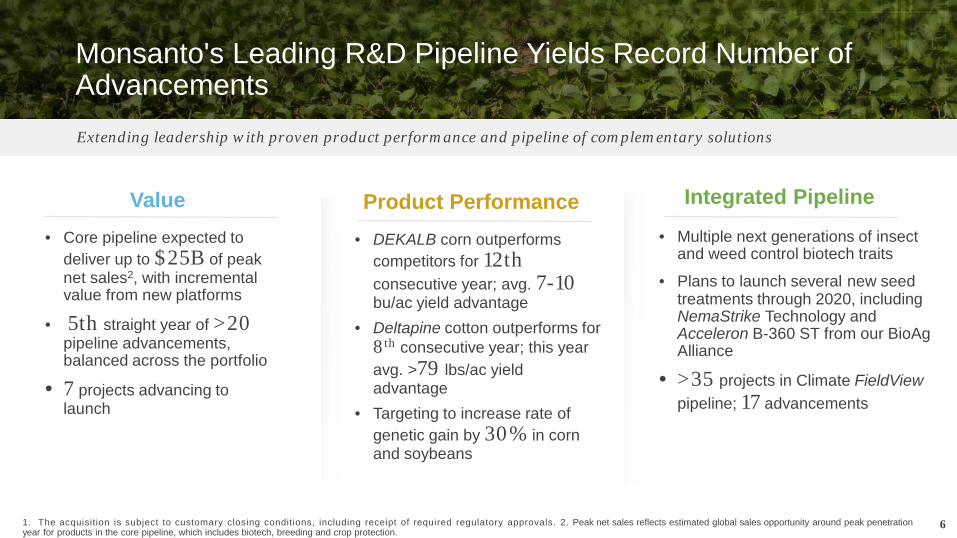
Monsanto's Leading R&D Pipeline Yields Record Number of Advancements
Value • Core pipeline expected to
deliver up to $25B of peak net sales2, with incremental value from new platforms
• 5th straight year of >20 pipeline advancements, balanced across the portfolio
• 7 projects advancing to launch
Product Performance• DEKALB corn outperforms
competitors for 12thconsecutive year; avg. 7-10 bu/ac yield advantage
• Deltapine cotton outperforms for 8th consecutive year; this year avg. >79 lbs/ac yield advantage
• Targeting to increase rate of genetic gain by 30% in corn and soybeans
Extending leadership with proven product performance and pipeline of complementary solutions
6
Integrated Pipeline
• Multiple next generations of insect and weed control biotech traits
• Plans to launch several new seed treatments through 2020, including NemaStrike Technology and Acceleron B-360 ST from our BioAgAlliance
• >35 projects in Climate FieldViewpipeline; 17 advancements
1. The acquisition is subject to customary closing conditions, including receipt of required regulatory approvals. 2. Peak net sales reflects estimated global sales opportunity around peak penetration year for products in the core pipeline, which includes biotech, breeding and crop protection.

0
2
4
6
8
10
12
14
16
18
20
2004 2006 2008 2010 2012 2014 2016 2018 2020 2022 2024 2026Trendline Actual
20
25
30
35
40
45
50
55
60
2004 2006 2008 2010 2012 2014 2016 2018 2020 2022 2024 2026
Trendline Actual
Global Population and Income Growth Fuel Long-Term Demand Trends in Corn and Soybeans
7
Meeting trendline demand requires >2-fold increase in corn yield rate of gain and >4-fold increase in soybean yield rate of gain by 2050
Bill
ions
of B
ushe
ls
CAGR=3.5%
CAGR=2.8%
Corn Long-Term Demand Trends1
CAGR=4.1%
CAGR=3.6%
Soybeans Long-Term Demand Trends1
Bill
ions
of B
ushe
ls1. USDA historical data for actual and trendline – WASDE December 2017. Trendline based on avg. growth from 2011-2016, per USDA.
~1.1B BU incremental demand in ‘17/’18 would require >12M acres at constant global yields
~ 550M BU incremental demand in ‘17/’18 would require >13M acres at constant global yields
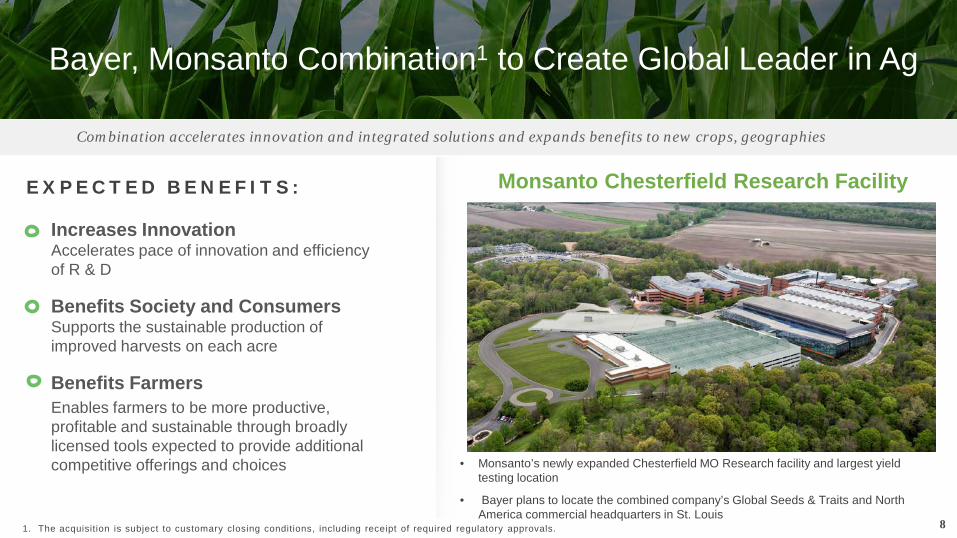
Bayer, Monsanto Combination1 to Create Global Leader in Ag
Combination accelerates innovation and integrated solutions and expands benefits to new crops, geographies
Increases InnovationAccelerates pace of innovation and efficiency of R & D
Benefits Society and ConsumersSupports the sustainable production of improved harvests on each acre
Benefits FarmersEnables farmers to be more productive, profitable and sustainable through broadly licensed tools expected to provide additional competitive offerings and choices
81. The acquisition is subject to customary closing conditions, including receipt of required regulatory approvals.
EXPECTED BENEFITS: Monsanto Chesterfield Research Facility
• Monsanto’s newly expanded Chesterfield MO Research facility and largest yield testing location
• Bayer plans to locate the combined company’s Global Seeds & Traits and North America commercial headquarters in St. Louis
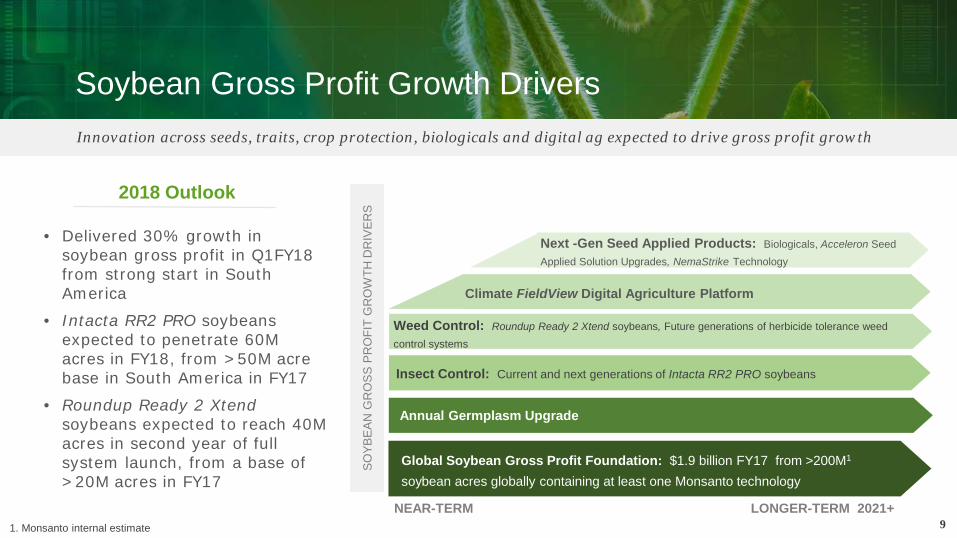
Soybean Gross Profit Growth Drivers
SO
YBE
AN
GR
OS
S P
RO
FIT
GR
OW
TH D
RIV
ER
S
Global Soybean Gross Profit Foundation: $1.9 billion FY17 from >200M1
soybean acres globally containing at least one Monsanto technology
Annual Germplasm Upgrade
Weed Control: Roundup Ready 2 Xtend soybeans, Future generations of herbicide tolerance weed control systems
Insect Control: Current and next generations of Intacta RR2 PRO soybeans
1. Monsanto internal estimate 9NEAR-TERM LONGER-TERM 2021+
Innovation across seeds, traits, crop protection, biologicals and digital ag expected to drive gross profit growth
2018 Outlook
Climate FieldView Digital Agriculture Platform
Next -Gen Seed Applied Products: Biologicals, Acceleron Seed Applied Solution Upgrades, NemaStrike Technology
• Delivered 30% growth in soybean gross profit in Q1FY18 from strong start in South America
• Intacta RR2 PRO soybeans expected to penetrate 60M acres in FY18, from >50M acre base in South America in FY17
• Roundup Ready 2 Xtendsoybeans expected to reach 40M acres in second year of full system launch, from a base of >20M acres in FY17
FY14 FY15 FY16 FY17 FY18F FY19F ACRE OPPORTUNITY
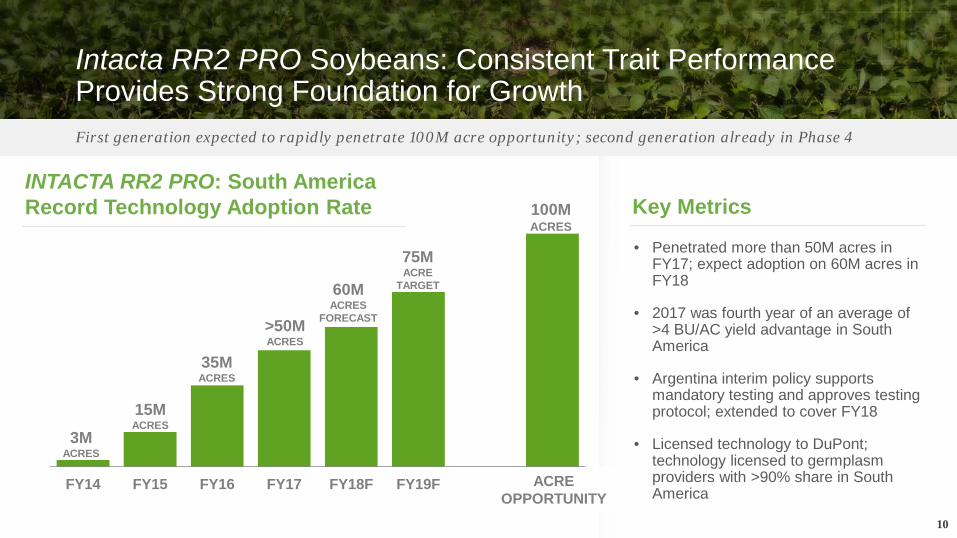
First generation expected to rapidly penetrate 100M acre opportunity; second generation already in Phase 4
10
INTACTA RR2 PRO: South AmericaRecord Technology Adoption Rate Key Metrics
• Penetrated more than 50M acres in FY17; expect adoption on 60M acres in FY18
• 2017 was fourth year of an average of >4 BU/AC yield advantage in South America
• Argentina interim policy supports mandatory testing and approves testing protocol; extended to cover FY18
• Licensed technology to DuPont; technology licensed to germplasm providers with >90% share in South America
100MACRES
75M ACRE
TARGET
3M ACRES
15M ACRES
35MACRES
>50MACRES
Intacta RR2 PRO Soybeans: Consistent Trait Performance Provides Strong Foundation for Growth
60MACRES
FORECAST
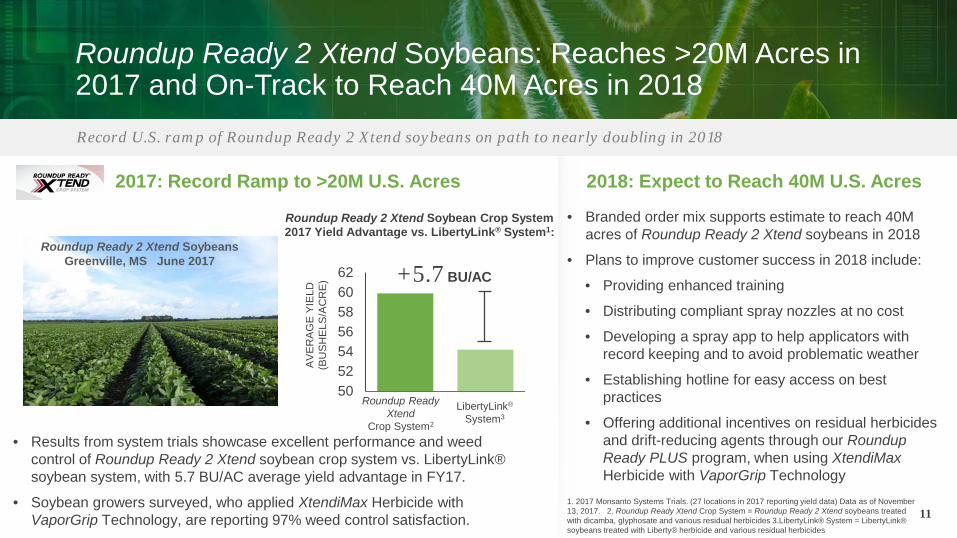
Roundup Ready 2 Xtend Soybeans: Reaches >20M Acres in 2017 and On-Track to Reach 40M Acres in 2018
11
Record U.S. ramp of Roundup Ready 2 Xtend soybeans on path to nearly doubling in 2018
• Branded order mix supports estimate to reach 40M acres of Roundup Ready 2 Xtend soybeans in 2018
• Plans to improve customer success in 2018 include:
• Providing enhanced training
• Distributing compliant spray nozzles at no cost
• Developing a spray app to help applicators with record keeping and to avoid problematic weather
• Establishing hotline for easy access on best practices
• Offering additional incentives on residual herbicides and drift-reducing agents through our Roundup Ready PLUS program, when using XtendiMaxHerbicide with VaporGrip Technology
• Results from system trials showcase excellent performance and weed control of Roundup Ready 2 Xtend soybean crop system vs. LibertyLink® soybean system, with 5.7 BU/AC average yield advantage in FY17.
• Soybean growers surveyed, who applied XtendiMax Herbicide with VaporGrip Technology, are reporting 97% weed control satisfaction.
2018: Expect to Reach 40M U.S. Acres2017: Record Ramp to >20M U.S. Acres
Roundup Ready 2 Xtend Soybeans Greenville, MS June 2017
Roundup Ready 2 Xtend Soybean Crop System 2017 Yield Advantage vs. LibertyLink® System1:
50525456586062
AV
ER
AG
E Y
IELD
(B
US
HE
LS/A
CR
E)
Roundup Ready Xtend
Crop System2
LibertyLink®
System3
1. 2017 Monsanto Systems Trials. (27 locations in 2017 reporting yield data) Data as of November 13, 2017. 2. Roundup Ready Xtend Crop System = Roundup Ready 2 Xtend soybeans treated with dicamba, glyphosate and various residual herbicides 3.LibertyLink® System = LibertyLink® soybeans treated with Liberty® herbicide and various residual herbicides
+5.7 BU/AC
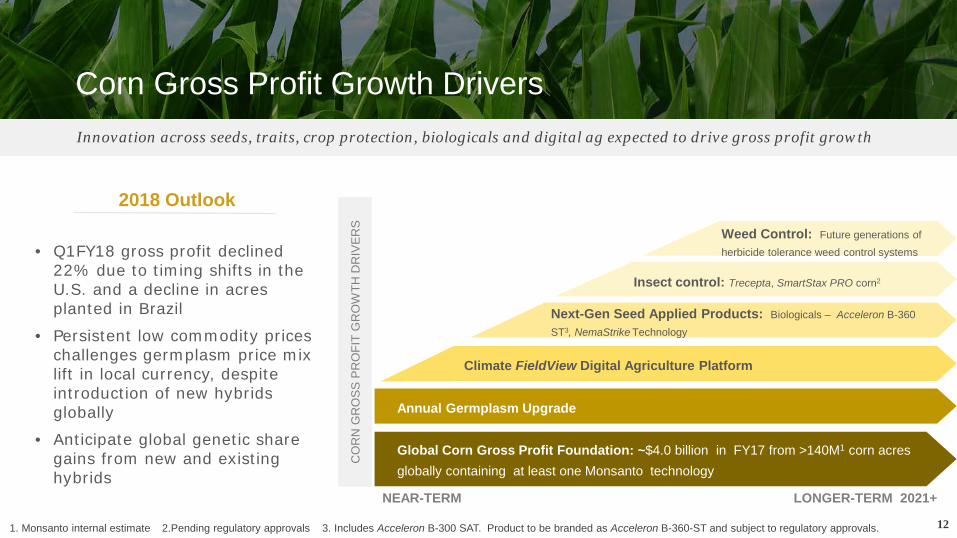
Corn Gross Profit Growth DriversInnovation across seeds, traits, crop protection, biologicals and digital ag expected to drive gross profit growth
Global Corn Gross Profit Foundation: ~$4.0 billion in FY17 from >140M1 corn acres globally containing at least one Monsanto technology
Annual Germplasm Upgrade
Insect control: Trecepta, SmartStax PRO corn2
Next-Gen Seed Applied Products: Biologicals – Acceleron B-360 ST3, NemaStrike Technology
Climate FieldView Digital Agriculture Platform
NEAR-TERM LONGER-TERM 2021+
CO
RN
GR
OS
S P
RO
FIT
GR
OW
TH D
RIV
ER
S
12
Weed Control: Future generations of herbicide tolerance weed control systems
2018 Outlook
1. Monsanto internal estimate 2.Pending regulatory approvals 3. Includes Acceleron B-300 SAT. Product to be branded as Acceleron B-360-ST and subject to regulatory approvals.
• Q1FY18 gross profit declined 22% due to timing shifts in the U.S. and a decline in acres planted in Brazil
• Persistent low commodity prices challenges germplasm price mix lift in local currency, despite introduction of new hybrids globally
• Anticipate global genetic share gains from new and existing hybrids
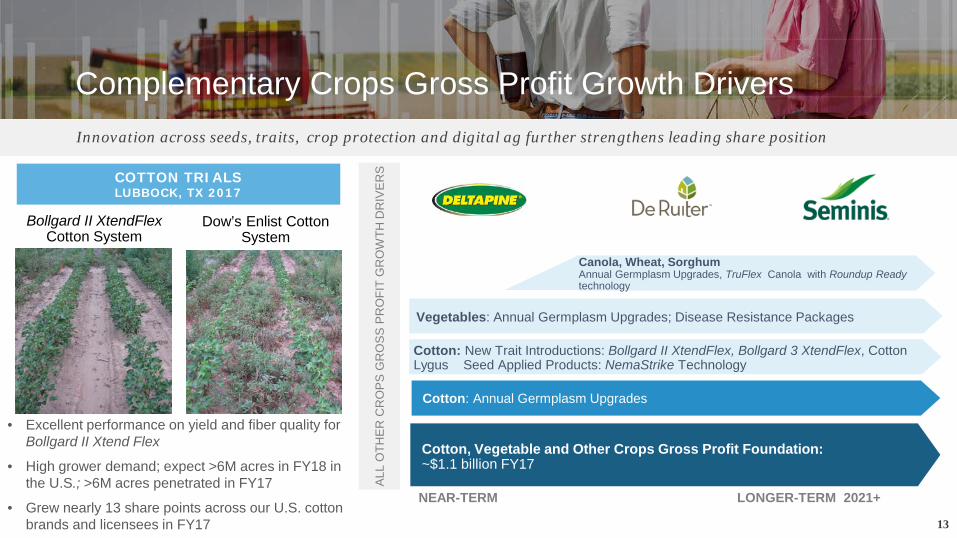
Complementary Crops Gross Profit Growth DriversInnovation across seeds, traits, crop protection and digital ag further strengthens leading share position
ALL
OTH
ER
CR
OP
S G
RO
SS
PR
OFI
T G
RO
WTH
DR
IVE
RS
Cotton, Vegetable and Other Crops Gross Profit Foundation:~$1.1 billion FY17
Cotton: Annual Germplasm Upgrades
Canola, Wheat, Sorghum Annual Germplasm Upgrades, TruFlex Canola with Roundup Ready technology
Vegetables: Annual Germplasm Upgrades; Disease Resistance Packages
Mid-Single Digits Gross Profit CAGR
FY17F to FY21F1
13
NEAR-TERM LONGER-TERM 2021+
Cotton: New Trait Introductions: Bollgard II XtendFlex, Bollgard 3 XtendFlex, Cotton Lygus Seed Applied Products: NemaStrike Technology
COTTON TRIALSLUBBOCK, TX 2017
• Excellent performance on yield and fiber quality for Bollgard II Xtend Flex
• High grower demand; expect >6M acres in FY18 in the U.S.; >6M acres penetrated in FY17
• Grew nearly 13 share points across our U.S. cotton brands and licensees in FY17
Bollgard II XtendFlexCotton System
Dow’s Enlist Cotton System
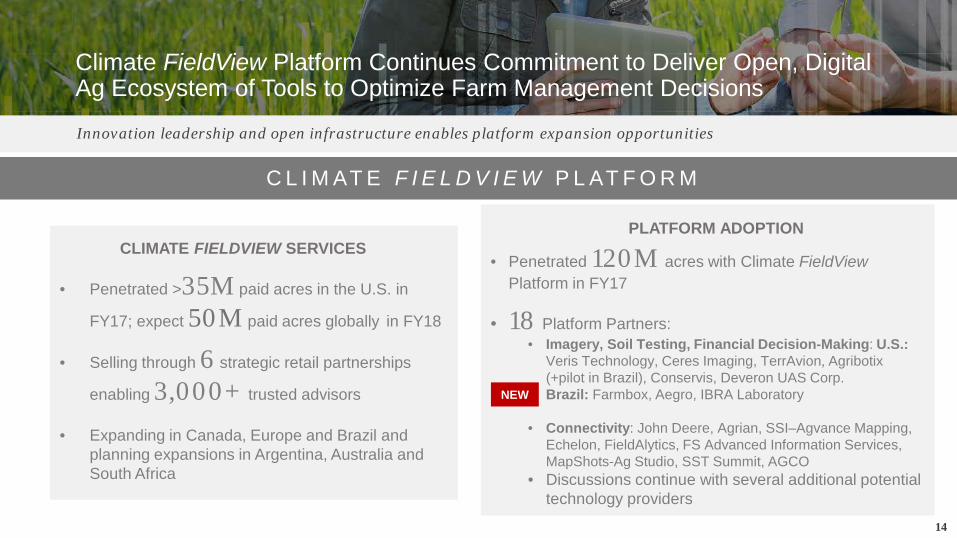
• Penetrated 120M acres with Climate FieldViewPlatform in FY17
• 18 Platform Partners: • Imagery, Soil Testing, Financial Decision-Making: U.S.:
Veris Technology, Ceres Imaging, TerrAvion, Agribotix(+pilot in Brazil), Conservis, Deveron UAS Corp. Brazil: Farmbox, Aegro, IBRA Laboratory
• Connectivity: John Deere, Agrian, SSI–Agvance Mapping, Echelon, FieldAlytics, FS Advanced Information Services, MapShots-Ag Studio, SST Summit, AGCO
• Discussions continue with several additional potential technology providers
Climate FieldView Platform Continues Commitment to Deliver Open, Digital Ag Ecosystem of Tools to Optimize Farm Management Decisions
14
Innovation leadership and open infrastructure enables platform expansion opportunities
C L I M AT E F I E L D V I E W P L AT F O R M
PLATFORM ADOPTION
• Penetrated >35M paid acres in the U.S. in
FY17; expect 50M paid acres globally in FY18
• Selling through 6 strategic retail partnerships
enabling 3,000+ trusted advisors
• Expanding in Canada, Europe and Brazil and planning expansions in Argentina, Australia and South Africa
CLIMATE FIELDVIEW SERVICES
NEW
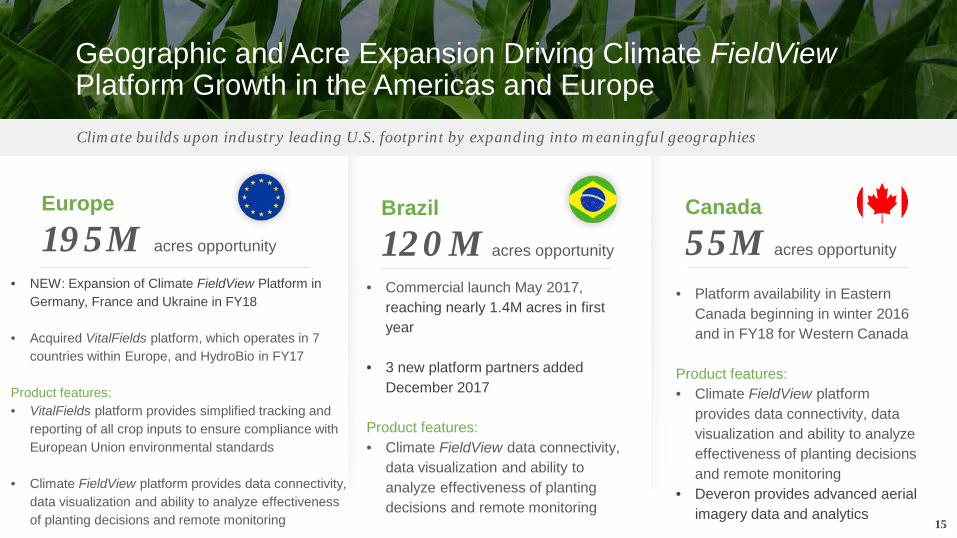
Geographic and Acre Expansion Driving Climate FieldViewPlatform Growth in the Americas and EuropeClimate builds upon industry leading U.S. footprint by expanding into meaningful geographies
• Commercial launch May 2017, reaching nearly 1.4M acres in first year
• 3 new platform partners added December 2017
Product features: • Climate FieldView data connectivity,
data visualization and ability to analyze effectiveness of planting decisions and remote monitoring
Brazil
120M acres opportunity
Europe
195M acres opportunity
• NEW: Expansion of Climate FieldView Platform in Germany, France and Ukraine in FY18
• Acquired VitalFields platform, which operates in 7 countries within Europe, and HydroBio in FY17
Product features: • VitalFields platform provides simplified tracking and
reporting of all crop inputs to ensure compliance with European Union environmental standards
• Climate FieldView platform provides data connectivity, data visualization and ability to analyze effectiveness of planting decisions and remote monitoring
Canada
55M acres opportunity
• Platform availability in Eastern Canada beginning in winter 2016 and in FY18 for Western Canada
Product features: • Climate FieldView platform
provides data connectivity, data visualization and ability to analyze effectiveness of planting decisions and remote monitoring
• Deveron provides advanced aerial imagery data and analytics
15
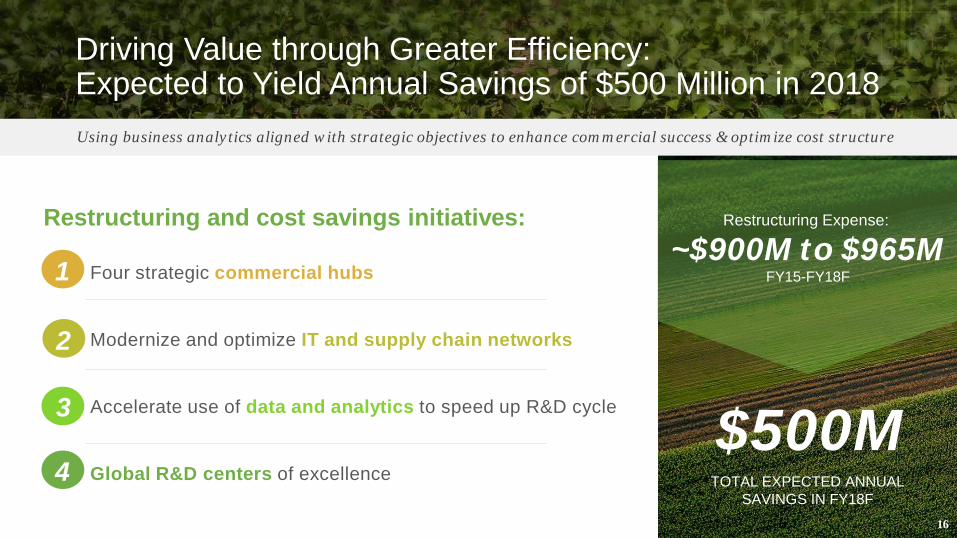
Driving Value through Greater Efficiency: Expected to Yield Annual Savings of $500 Million in 2018
16
Using business analytics aligned with strategic objectives to enhance commercial success & optimize cost structure
Restructuring and cost savings initiatives:
$500M TOTAL EXPECTED ANNUAL
SAVINGS IN FY18F
Restructuring Expense:
~$900M to $965MFY15-FY18FFour strategic commercial hubs
Modernize and optimize IT and supply chain networks
Accelerate use of data and analytics to speed up R&D cycle
Global R&D centers of excellence
1
2
3
4
NON-GAAPF I N A N C I A L I N F O R M A T I O N

Reconciliation of Non-GAAP Financial Measures
18
Q1 FY2018 Q1 FY2017$ Millions
Net Cash Provided by Operating Activities $1,292 $1,463
Capital Expenditures $(418) $(317)
Free Cash Flow $874 $1,146
RECONCILIATION OF FREE CASH FLOW1
1. Free Cash Flow now defined as the total of net cash provided or required by operating activities, less capital expenditures.
$ Millions Q1 FY2018 Q1 FY 2017
Net Cash Provided by Operating Activities $1,292 $1,463
Net Cash Required by Investing Activities $(210) $(327)
Net Cash Provided (Required) by Financing Activities $178 $(655)
Effect of Exchange Rate Changes on Cash and Cash Equivalents $(14) $(28)
Net Increase in Cash and Cash Equivalents $1,246 $453
Reconciliation of Non-GAAP Financial Measures
19
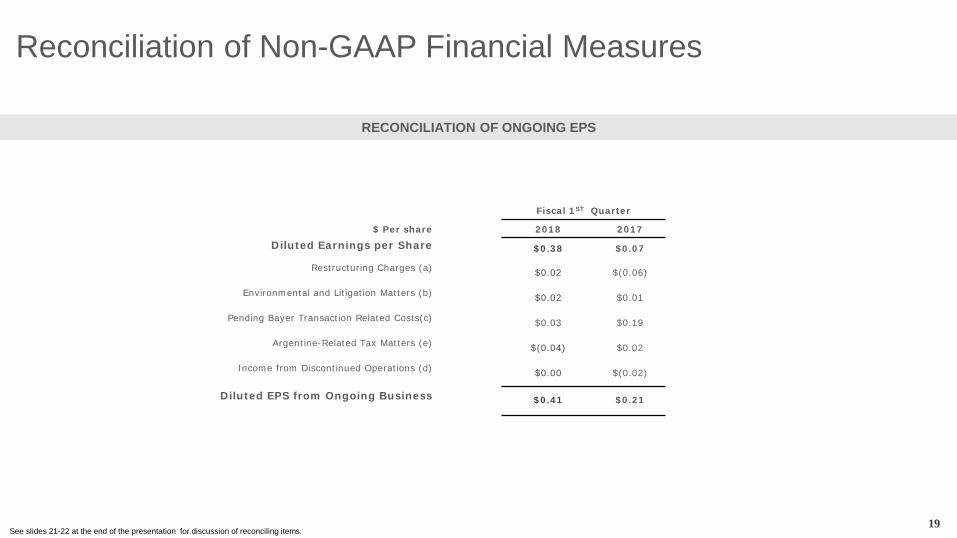
RECONCILIATION OF ONGOING EPS
Fiscal 1ST Quarter
$ Per share 2018 2017
Diluted Earnings per Share $0.38 $0.07
Restructuring Charges (a) $0.02 $(0.06)
Environmental and Litigation Matters (b) $0.02 $0.01
Pending Bayer Transaction Related Costs(c) $0.03 $0.19
Argentine-Related Tax Matters (e) $(0.04) $0.02
Income from Discontinued Operations (d) $0.00 $(0.02)
Diluted EPS from Ongoing Business $0.41 $0.21
See slides 21-22 at the end of the presentation for discussion of reconciling items.
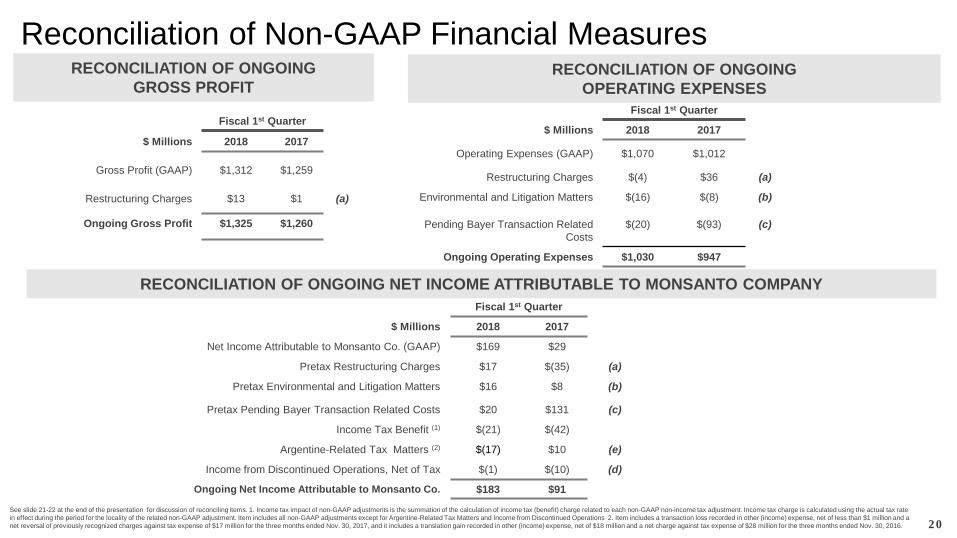
Fiscal 1st Quarter
$ Millions 2018 2017
Operating Expenses (GAAP) $1,070 $1,012
Restructuring Charges $(4) $36 (a)
Environmental and Litigation Matters $(16) $(8) (b)
Pending Bayer Transaction Related Costs
$(20) $(93) (c)
Ongoing Operating Expenses $1,030 $947
Reconciliation of Non-GAAP Financial Measures
20
Fiscal 1st Quarter
$ Millions 2018 2017
Gross Profit (GAAP) $1,312 $1,259
Restructuring Charges $13 $1 (a)
Ongoing Gross Profit $1,325 $1,260
See slide 21-22 at the end of the presentation for discussion of reconciling items. 1. Income tax impact of non-GAAP adjustments is the summation of the calculation of income tax (benefit) charge related to each non-GAAP non-income tax adjustment. Income tax charge is calculated using the actual tax rate in effect during the period for the locality of the related non-GAAP adjustment. Item includes all non-GAAP adjustments except for Argentine-Related Tax Matters and Income from Discontinued Operations 2. Item includes a transaction loss recorded in other (income) expense, net of less than $1 million and a net reversal of previously recognized charges against tax expense of $17 million for the three months ended Nov. 30, 2017, and it includes a translation gain recorded in other (income) expense, net of $18 million and a net charge against tax expense of $28 million for the three months ended Nov. 30, 2016.
Fiscal 1st Quarter
$ Millions 2018 2017
Net Income Attributable to Monsanto Co. (GAAP) $169 $29
Pretax Restructuring Charges $17 $(35) (a)
Pretax Environmental and Litigation Matters $16 $8 (b)
Pretax Pending Bayer Transaction Related Costs $20 $131 (c)
Income Tax Benefit (1) $(21) $(42)
Argentine-Related Tax Matters (2) $(17) $10 (e)
Income from Discontinued Operations, Net of Tax $(1) $(10) (d)
Ongoing Net Income Attributable to Monsanto Co. $183 $91
RECONCILIATION OF ONGOING OPERATING EXPENSES
RECONCILIATION OF ONGOING GROSS PROFIT
RECONCILIATION OF ONGOING NET INCOME ATTRIBUTABLE TO MONSANTO COMPANY
Reconciliation of Non-GAAP Financial Measures
21
DEFINITION OF ONGOING ADJUSTMENTS
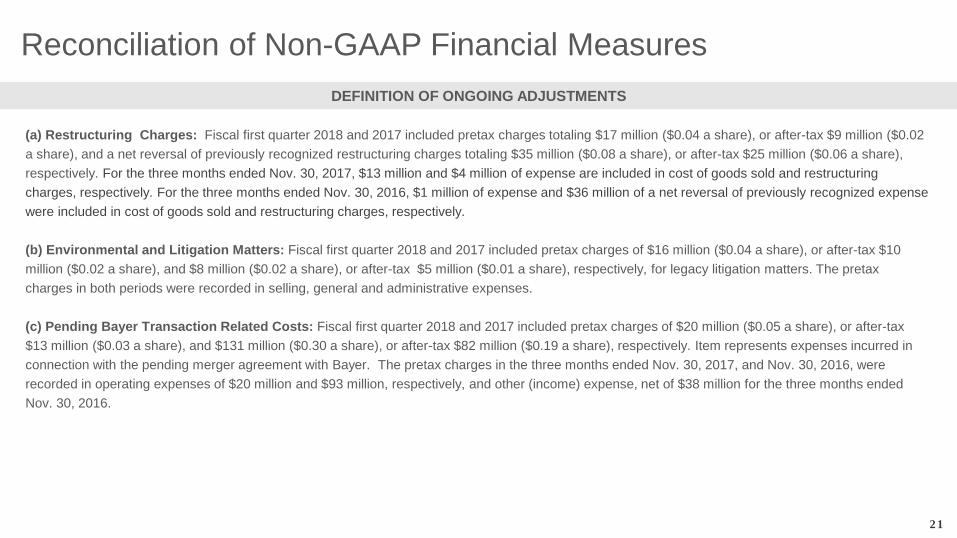
(a) Restructuring Charges: Fiscal first quarter 2018 and 2017 included pretax charges totaling $17 million ($0.04 a share), or after-tax $9 million ($0.02 a share), and a net reversal of previously recognized restructuring charges totaling $35 million ($0.08 a share), or after-tax $25 million ($0.06 a share), respectively. For the three months ended Nov. 30, 2017, $13 million and $4 million of expense are included in cost of goods sold and restructuring charges, respectively. For the three months ended Nov. 30, 2016, $1 million of expense and $36 million of a net reversal of previously recognized expense were included in cost of goods sold and restructuring charges, respectively.
(b) Environmental and Litigation Matters: Fiscal first quarter 2018 and 2017 included pretax charges of $16 million ($0.04 a share), or after-tax $10 million ($0.02 a share), and $8 million ($0.02 a share), or after-tax $5 million ($0.01 a share), respectively, for legacy litigation matters. The pretax charges in both periods were recorded in selling, general and administrative expenses.
(c) Pending Bayer Transaction Related Costs: Fiscal first quarter 2018 and 2017 included pretax charges of $20 million ($0.05 a share), or after-tax $13 million ($0.03 a share), and $131 million ($0.30 a share), or after-tax $82 million ($0.19 a share), respectively. Item represents expenses incurred in connection with the pending merger agreement with Bayer. The pretax charges in the three months ended Nov. 30, 2017, and Nov. 30, 2016, were recorded in operating expenses of $20 million and $93 million, respectively, and other (income) expense, net of $38 million for the three months ended Nov. 30, 2016.
Reconciliation of Non-GAAP Financial Measures
22
DEFINITION OF ONGOING ADJUSTMENTS
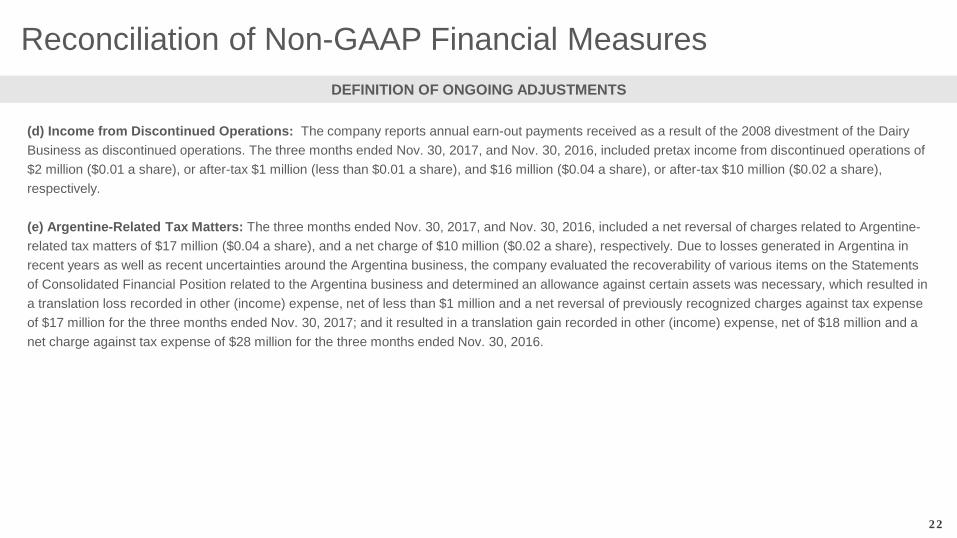
(d) Income from Discontinued Operations: The company reports annual earn-out payments received as a result of the 2008 divestment of the Dairy Business as discontinued operations. The three months ended Nov. 30, 2017, and Nov. 30, 2016, included pretax income from discontinued operations of $2 million ($0.01 a share), or after-tax $1 million (less than $0.01 a share), and $16 million ($0.04 a share), or after-tax $10 million ($0.02 a share), respectively.
(e) Argentine-Related Tax Matters: The three months ended Nov. 30, 2017, and Nov. 30, 2016, included a net reversal of charges related to Argentine-related tax matters of $17 million ($0.04 a share), and a net charge of $10 million ($0.02 a share), respectively. Due to losses generated in Argentina in recent years as well as recent uncertainties around the Argentina business, the company evaluated the recoverability of various items on the Statements of Consolidated Financial Position related to the Argentina business and determined an allowance against certain assets was necessary, which resulted in a translation loss recorded in other (income) expense, net of less than $1 million and a net reversal of previously recognized charges against tax expense of $17 million for the three months ended Nov. 30, 2017; and it resulted in a translation gain recorded in other (income) expense, net of $18 million and a net charge against tax expense of $28 million for the three months ended Nov. 30, 2016.