Embed Size (px)
Citation preview
First Quarter 2018 Report to Shareholders
BMO Financial Group Reports Net Income of $973 million for First Quarter of 2018
Financial Results Highlights:
First Quarter 2018 Compared with First Quarter 2017:
• Net income of $973 million, down 35% reflecting a revaluation of the U.S. net deferred tax asset of $425 million related to U.S. tax reform and a net gain in the prior year
• Adjusted net income1 of $1,422 million, down 7% reflecting the net gain in the prior year
• EPS2 of $1.43, down 36%; adjusted EPS1,2 of $2.12, down 7%
• Good operating performance in retail businesses
• Provisions for credit losses (PCL) of $141 million, including a $33 million recovery of credit losses on performing loans3, compared with $167 million in the prior year
• Common Equity Tier 1 Ratio of 11.1% Toronto, February 27, 2018 – For the first quarter ended January 31, 2018, BMO Financial Group recorded net income of $973 million or $1.43 per
share on a reported basis, and net income of $1,422 million or $2.12 per share on an adjusted basis. “BMO had a good start to the year, with adjusted net income of $1.4 billion and adjusted earnings per share of $2.12. These results reflect strong
operating revenue growth in Personal and Commercial Banking in Canada and the U.S., driven by good loan and deposit growth and the benefit of
higher interest rates, as well as strong credit performance which is reflective of our consistent approach to effective risk management and building
deep, long-term customer relationships,” said Darryl White, Chief Executive Officer, BMO Financial Group.
“The constructive economic environment, particularly in the U.S., plays to the strengths of our business mix, with another quarter of increased
contribution from our U.S. segment, which grew at a higher rate than the bank overall. We have made progress against our strategic areas of focus,
including making the bank more efficient and continuing to invest in our digital agenda, our people and our communities. Looking ahead, we see
attractive opportunities to deliver organic growth and achieve our financial objectives,” concluded Mr. White.
Reported net income in the quarter included a $425 million (US$339 million) charge due to the revaluation of our U.S. net deferred tax asset as a
result of the enactment of the U.S. Tax Cuts and Jobs Act 4, which had a negative impact of approximately 29% on reported net income growth, and
$0.65 to earnings per share. As previously disclosed, this is a one-time non-cash charge resulting from the reduction in the U.S. federal tax rate. Going
forward, there is expected to be a benefit from the lower tax rate on BMO’s future U.S. earnings. Net income in the prior year included a net gain of $133 million, attributed to a $168 million gain on the sale of Moneris US and a $35 million loss on
the sale of a portion of the U.S. indirect auto loan portfolio. The net gain had a negative impact of approximately 9% on reported and adjusted net
income growth.
Return on equity (ROE) was 9.4% compared with 14.9% in the prior year, and adjusted ROE was 13.9% compared with 15.3%. Return on tangible
common equity (ROTCE) was 11.5% compared with 18.5% in the prior year, and adjusted ROTCE was 16.7% compared with 18.6%. (1) Results and measures in this document are presented on a GAAP basis. They are also presented on an adjusted basis that excludes the impact of certain items. Adjusted results and measures are non-GAAP and
are detailed for all reported periods in the Non-GAAP Measures section, where such non-GAAP measures and their closest GAAP counterparts are disclosed.
(2) All Earnings per Share (EPS) measures in this document refer to diluted EPS unless specified otherwise. EPS is calculated using net income after deductions for net income attributable to non-controlling interest in subsidiaries and preferred share dividends.
(3) Effective in the first quarter of 2018, the bank prospectively adopted IFRS 9, Financial Instruments (IFRS 9). Under IFRS 9, we refer to the provision for credit losses on impaired loans and the provision for credit losses on performing loans. Prior periods have not been restated. Refer to the Changes in Accounting Policies section on page 22 for further details.
(4) See the Critical Accounting Estimates – Income Taxes and Deferred Tax Assets section on page 114 of BMO’s 2017 Annual Report. For further information see the Other Regulatory Developments section on
page 24. Note: All ratios and percentage changes in this document are based on unrounded numbers.
BMO Financial Group First Quarter Report 2018 1
Concurrent with the release of results, BMO announced a second quarter 2018 dividend of $0.93 per common share, unchanged from the preceding
quarter and up $0.05 per share or 6% from a year ago. The quarterly dividend of $0.93 per common share is equivalent to an annual dividend of $3.72
per common share.
Our complete First Quarter 2018 Report to Shareholders, including our unaudited interim consolidated financial statements for the period ended
January 31, 2018, is available online at www.bmo.com/investorrelations and at www.sedar.com.
Operating Segment Overview Canadian P&C Reported net income of $647 million decreased $97 million or 13% and adjusted net income of $647 million decreased $98 million or 13% from the
prior year. Adjusted net income excludes the amortization of acquisition-related intangible assets. A gain on the sale of Moneris US in the prior year
had a negative impact of approximately 25% on net income growth. Good operating revenue growth and a gain related to the restructuring of Interac
Corporation was partially offset by higher expenses, including a legal reserve, in the current quarter.
During the quarter, we continued to enhance our digital capabilities, introducing BMO for Amazon Alexa, which allows customers with Alexa-
enabled devices to access information such as nearby BMO automated teller machine locations, up-to-date foreign exchange rates and information on
BMO products.
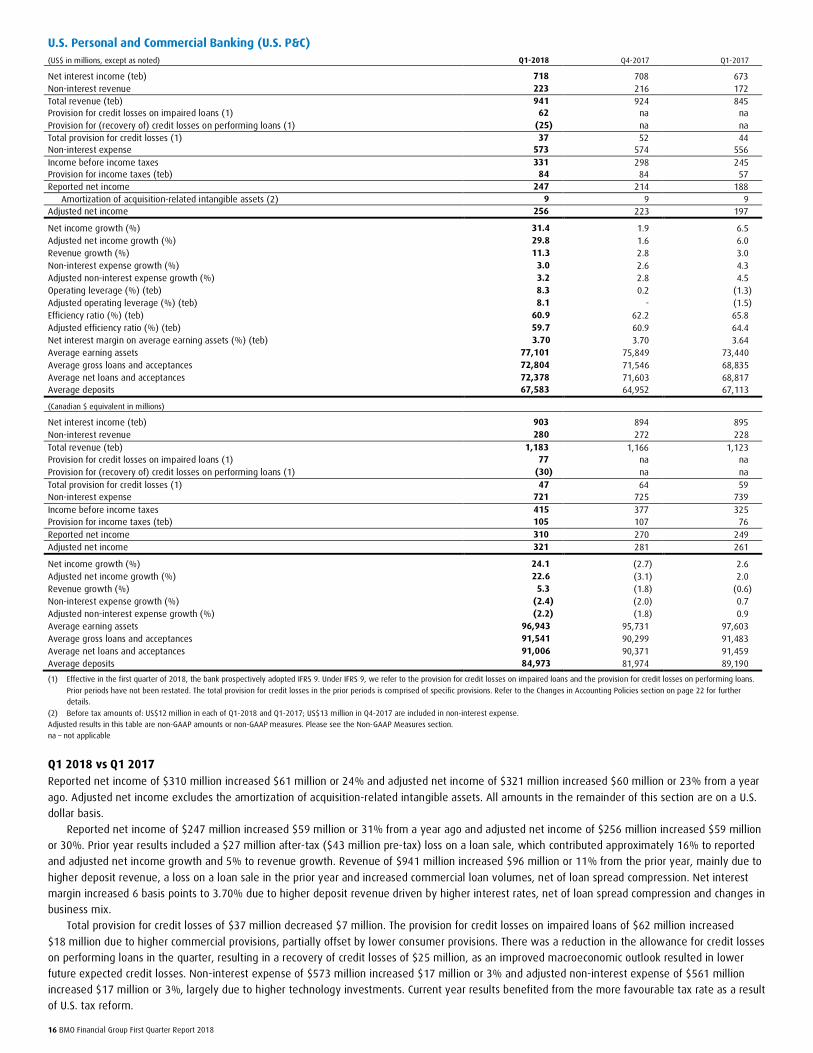
U.S. P&C Reported net income of $310 million increased $61 million or 24% and adjusted net income of $321 million increased $60 million or 23% from a year
ago. Adjusted net income excludes the amortization of acquisition-related intangible assets.
Reported net income of US$247 million increased US$59 million or 31% from a year ago and adjusted net income of US$256 million increased
US$59 million or 30%, mainly due to higher revenue, including the impact of a prior year US$27 million after-tax loss on a loan sale, the more
favourable tax rate as a result of U.S. tax reform and a lower provision for credit losses, partially offset by higher expenses. The prior year loss on the
loan sale contributed approximately 16% to reported and adjusted net income growth.
BMO Harris Bank earned an Outstanding rating for the Community Reinvestment Act performance from the Office of the Comptroller of the
Currency, recognizing the bank’s commitment to help support low- and moderate- income communities.
BMO Wealth Management Reported net income was $266 million compared to $269 million a year ago, and adjusted net income was $276 million compared to $284 million a
year ago. Adjusted net income excludes the amortization of acquisition-related intangible assets. Traditional wealth reported net income of
$184 million increased $20 million or 12% from a year ago and adjusted net income of $194 million increased $15 million or 8%, primarily due to
business growth and improved equity markets, partially offset by higher expenses. Insurance net income was $82 million compared to $105 million
last year primarily due to more favourable market movements in the prior year, partially offset by underlying business growth.
The strength of BMO Asset Management’s Exchange Traded Funds (ETF) business was recognized at the 2017 Thomson Reuters Lipper Fund
Awards, with seven BMO ETFs claiming top honours, recognizing top risk-adjusted performing funds relative to peers.
BMO Capital Markets Reported and adjusted net income were $271 million compared to $367 million in the prior year, primarily due to lower revenue from our Trading
Products business following record revenue performance in the prior year. Adjusted net income excludes the amortization of acquisition-related
intangible assets.
BMO Capital Markets was named Best Bank for the Canadian Dollar for the seventh consecutive year by FX Week. We also partnered with the World
Bank as joint lead manager on its inaugural Sustainable Development Bond to raise awareness for women and girls’ empowerment, raising $1 billion.
Corporate Services Corporate Services net loss for the quarter was $521 million compared with a net loss of $141 million a year ago. Corporate Services adjusted net loss
for the quarter was $93 million compared with an adjusted net loss of $127 million a year ago. Adjusted results exclude the one-time non-cash charge
due to the revaluation of our U.S. net deferred tax asset of $425 million in the current quarter and acquisition integration costs in both periods.
Adjusted results increased mainly due to above-trend taxes in the prior year, as well as higher revenue excluding the taxable equivalent basis (teb)
adjustment and lower expenses in the current quarter. Reported results decreased due to the U.S. net deferred tax asset revaluation charge in the
current quarter, partially offset by the drivers noted above.
Adjusted results in this Operating Segment Overview section are non-GAAP amounts or non-GAAP measures. Please see the Non-GAAP Measures
section.
2 BMO Financial Group First Quarter Report 2018
Capital BMO’s Common Equity Tier 1 (CET1) Ratio was 11.1% at January 31, 2018.
The CET1 Ratio decreased from 11.4% at the end of the fourth quarter as retained earnings growth was more than offset by business growth and
share repurchases during the quarter. The impact of the revaluation of our U.S. net deferred tax asset was a decrease of approximately 17 basis points
in the CET1 Ratio.
Provision for Credit Losses Effective in the first quarter of 2018, the bank prospectively adopted IFRS 9, Financial Instruments (IFRS 9). Under IFRS 9, we refer to the provision for
credit losses on impaired loans and the provision for credit losses on performing loans. The provision for credit losses on impaired loans under IFRS 9 is
consistent with the specific provision under IAS 39, Financial Instruments: Recognition and Measurement (IAS 39) in prior years. The provision for credit
losses on performing loans replaces the collective provision under IAS 39. Refer to Note 3 to the unaudited interim consolidated financial statements
for an explanation of the provision for credit losses. Prior periods have not been restated.
The total provision for credit losses was $141 million, a decrease of $26 million from the prior year. The provision for credit losses on impaired
loans of $174 million increased $7 million reflecting higher provisions in U.S. P&C and lower recoveries in BMO Capital Markets, partially offset by lower
provisions in Canadian P&C. There was a reduction in the allowance for credit losses on performing loans this quarter, resulting in a recovery of credit
losses of $33 million, primarily in U.S. P&C, as an improved macroeconomic outlook resulted in lower future expected credit losses. In Canada, the
macroeconomic outlook was relatively stable.
Caution The foregoing sections contain forward-looking statements. Please see the Caution Regarding Forward-Looking Statements.
Regulatory Filings Our continuous disclosure materials, including our interim filings, annual Management’s Discussion and Analysis and audited consolidated financial
statements, Annual Information Form and Notice of Annual Meeting of Shareholders and Proxy Circular are available on our website at
www.bmo.com/investorrelations, on the Canadian Securities Administrators’ website at www.sedar.com and on the EDGAR section of the SEC’s
website at www.sec.gov.
Bank of Montreal uses a unified branding approach that links all of the organization’s member companies. Bank of Montreal, together with
its subsidiaries, is known as BMO Financial Group. As such, in this document, the names BMO and BMO Financial Group mean Bank of
Montreal, together with its subsidiaries.

BMO Financial Group First Quarter Report 2018 3
Management’s Discussion and Analysis Management’s Discussion and Analysis (MD&A) commentary is as of February 27, 2018. The material that precedes this section comprises part of this
MD&A. The MD&A should be read in conjunction with the unaudited interim consolidated financial statements for the period ended January 31, 2018,
included in this document, as well as the audited consolidated financial statements for the year ended October 31, 2017, and the MD&A for fiscal 2017.
The 2017 Annual MD&A includes a comprehensive discussion of our businesses, strategies and objectives, and can be accessed on our website at
www.bmo.com/investorrelations. Readers are also encouraged to visit the site to view other quarterly financial information.
Table of Contents
4 Financial Highlights 22 Balance Sheet 5 Non-GAAP Measures 22 Transactions with Related Parties 6 Caution Regarding Forward-Looking Statements 22 Off-Balance Sheet Arrangements 6 Economic Review and Outlook 22 Accounting Policies and Critical Accounting Estimates 7 Foreign Exchange 22 Changes in Accounting Policies 8 Net Income 23 Future Changes in Accounting Policies 8 Revenue 23 Select Financial Instruments 9 Provision for Credit Losses 23 Disclosure for Domestic Systemically Important Banks 9 Impaired Loans 24 Other Regulatory Developments
10 Insurance Claims, Commissions and Changes in Policy Benefit Liabilities 25 Risk Management 10 Non-Interest Expense 25 Market Risk 10 Income Taxes 26 Liquidity and Funding Risk 11 Capital Management 29 Credit Rating 14 Review of Operating Groups’ Performance 30 European Exposures
14 Personal and Commercial Banking (P&C) 32 Interim Consolidated Financial Statements
15 Canadian Personal and Commercial Banking (Canadian P&C) 32 Consolidated Statement of Income
16 U.S. Personal and Commercial Banking (U.S. P&C) 33 Consolidated Statement of Comprehensive Income
18 BMO Wealth Management 34 Consolidated Balance Sheet
19 BMO Capital Markets 35 Consolidated Statement of Changes in Equity
20 Corporate Services 36 Consolidated Statement of Cash Flows 21 Summary Quarterly Earnings Trends 37 Notes to Consolidated Financial Statements
57 Other Investor and Media Information
Bank of Montreal's management, under the supervision of the CEO and CFO, has evaluated the effectiveness, as of January 31, 2018, of Bank of
Montreal's disclosure controls and procedures (as defined in the rules of the Securities and Exchange Commission and the Canadian Securities
Administrators) and has concluded that such disclosure controls and procedures are effective.
There were no changes in our internal control over financial reporting during the quarter ended January 31, 2018, which materially affected, or are
reasonably likely to materially affect, our internal control over financial reporting. The adoption of IFRS 9 did not materially affect our internal controls
over financial reporting.
Because of inherent limitations, disclosure controls and procedures and internal control over financial reporting can provide only reasonable
assurance and may not prevent or detect misstatements.
As in prior quarters, Bank of Montreal's Audit and Conduct Review Committee reviewed this document and Bank of Montreal’s Board of Directors
approved the document prior to its release.
4 BMO Financial Group First Quarter Report 2018
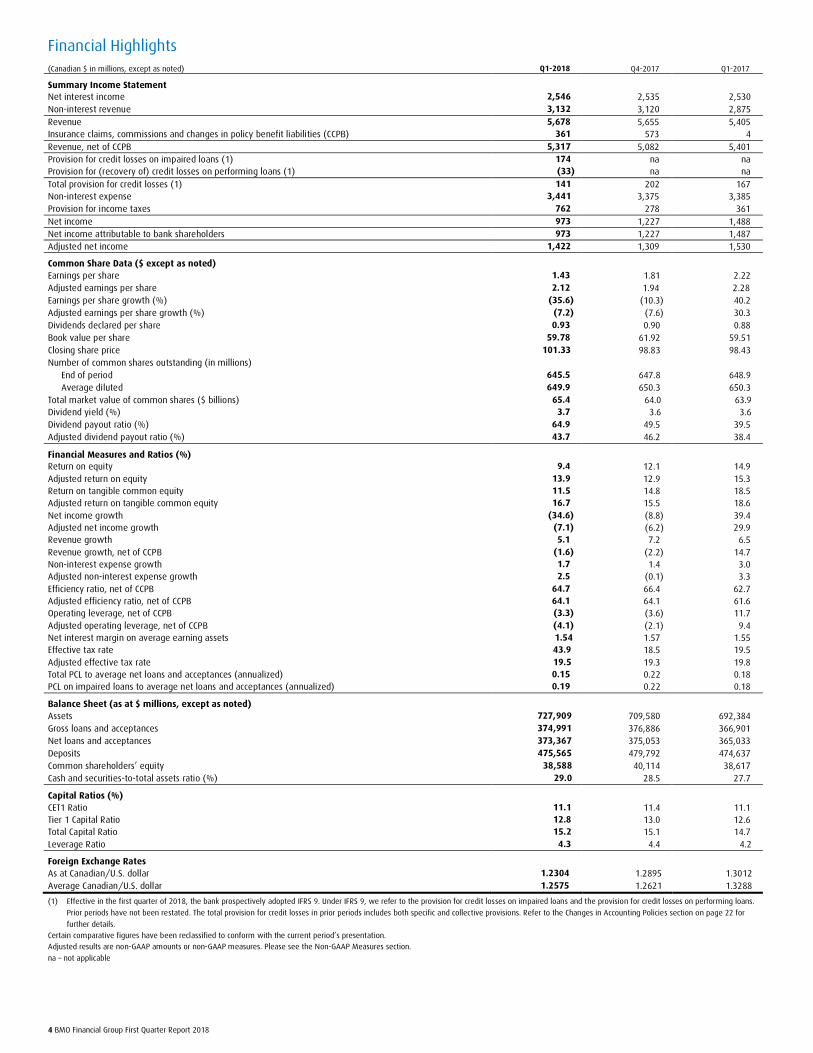
Financial Highlights (Canadian $ in millions, except as noted) Q1-2018 Q4-2017 Q1-2017
Summary Income Statement Net interest income 2,546 2,535 2,530 Non-interest revenue 3,132 3,120 2,875 Revenue 5,678 5,655 5,405 Insurance claims, commissions and changes in policy benefit liabilities (CCPB) 361 573 4 Revenue, net of CCPB 5,317 5,082 5,401 Provision for credit losses on impaired loans (1) 174 na na Provision for (recovery of) credit losses on performing loans (1) (33) na na Total provision for credit losses (1) 141 202 167 Non-interest expense 3,441 3,375 3,385 Provision for income taxes 762 278 361 Net income 973 1,227 1,488 Net income attributable to bank shareholders 973 1,227 1,487 Adjusted net income 1,422 1,309 1,530
Common Share Data ($ except as noted) Earnings per share 1.43 1.81 2.22 Adjusted earnings per share 2.12 1.94 2.28 Earnings per share growth (%) (35.6) (10.3) 40.2 Adjusted earnings per share growth (%) (7.2) (7.6) 30.3 Dividends declared per share 0.93 0.90 0.88 Book value per share 59.78 61.92 59.51 Closing share price 101.33 98.83 98.43 Number of common shares outstanding (in millions)
End of period 645.5 647.8 648.9 Average diluted 649.9 650.3 650.3
Total market value of common shares ($ billions) 65.4 64.0 63.9 Dividend yield (%) 3.7 3.6 3.6 Dividend payout ratio (%) 64.9 49.5 39.5 Adjusted dividend payout ratio (%) 43.7 46.2 38.4
Financial Measures and Ratios (%) Return on equity 9.4 12.1 14.9 Adjusted return on equity 13.9 12.9 15.3 Return on tangible common equity 11.5 14.8 18.5 Adjusted return on tangible common equity 16.7 15.5 18.6 Net income growth (34.6) (8.8) 39.4 Adjusted net income growth (7.1) (6.2) 29.9 Revenue growth 5.1 7.2 6.5 Revenue growth, net of CCPB (1.6) (2.2) 14.7 Non-interest expense growth 1.7 1.4 3.0 Adjusted non-interest expense growth 2.5 (0.1) 3.3 Efficiency ratio, net of CCPB 64.7 66.4 62.7 Adjusted efficiency ratio, net of CCPB 64.1 64.1 61.6 Operating leverage, net of CCPB (3.3) (3.6) 11.7 Adjusted operating leverage, net of CCPB (4.1) (2.1) 9.4 Net interest margin on average earning assets 1.54 1.57 1.55 Effective tax rate 43.9 18.5 19.5 Adjusted effective tax rate 19.5 19.3 19.8 Total PCL to average net loans and acceptances (annualized) 0.15 0.22 0.18 PCL on impaired loans to average net loans and acceptances (annualized) 0.19 0.22 0.18
Balance Sheet (as at $ millions, except as noted) Assets 727,909 709,580 692,384 Gross loans and acceptances 374,991 376,886 366,901 Net loans and acceptances 373,367 375,053 365,033 Deposits 475,565 479,792 474,637 Common shareholders’ equity 38,588 40,114 38,617 Cash and securities-to-total assets ratio (%) 29.0 28.5 27.7
Capital Ratios (%) CET1 Ratio 11.1 11.4 11.1 Tier 1 Capital Ratio 12.8 13.0 12.6 Total Capital Ratio 15.2 15.1 14.7 Leverage Ratio 4.3 4.4 4.2
Foreign Exchange Rates As at Canadian/U.S. dollar 1.2304 1.2895 1.3012 Average Canadian/U.S. dollar 1.2575 1.2621 1.3288
(1) Effective in the first quarter of 2018, the bank prospectively adopted IFRS 9. Under IFRS 9, we refer to the provision for credit losses on impaired loans and the provision for credit losses on performing loans.
Prior periods have not been restated. The total provision for credit losses in prior periods includes both specific and collective provisions. Refer to the Changes in Accounting Policies section on page 22 for
further details. Certain comparative figures have been reclassified to conform with the current period’s presentation. Adjusted results are non-GAAP amounts or non-GAAP measures. Please see the Non-GAAP Measures section.
na – not applicable
BMO Financial Group First Quarter Report 2018 5
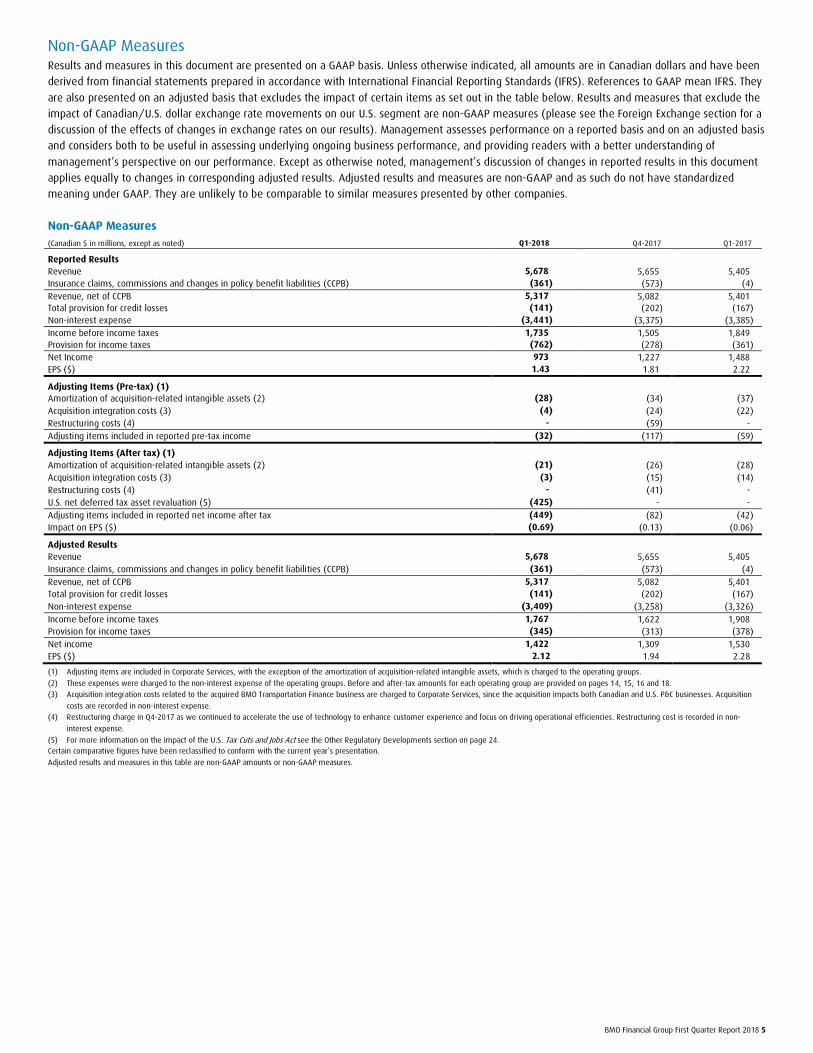
Non-GAAP Measures Results and measures in this document are presented on a GAAP basis. Unless otherwise indicated, all amounts are in Canadian dollars and have been
derived from financial statements prepared in accordance with International Financial Reporting Standards (IFRS). References to GAAP mean IFRS. They
are also presented on an adjusted basis that excludes the impact of certain items as set out in the table below. Results and measures that exclude the
impact of Canadian/U.S. dollar exchange rate movements on our U.S. segment are non-GAAP measures (please see the Foreign Exchange section for a
discussion of the effects of changes in exchange rates on our results). Management assesses performance on a reported basis and on an adjusted basis
and considers both to be useful in assessing underlying ongoing business performance, and providing readers with a better understanding of
management’s perspective on our performance. Except as otherwise noted, management’s discussion of changes in reported results in this document
applies equally to changes in corresponding adjusted results. Adjusted results and measures are non-GAAP and as such do not have standardized
meaning under GAAP. They are unlikely to be comparable to similar measures presented by other companies.
Non-GAAP Measures (Canadian $ in millions, except as noted) Q1-2018 Q4-2017 Q1-2017
Reported Results
Revenue 5,678 5,655 5,405 Insurance claims, commissions and changes in policy benefit liabilities (CCPB) (361) (573) (4) Revenue, net of CCPB 5,317 5,082 5,401 Total provision for credit losses (141) (202) (167) Non-interest expense (3,441) (3,375) (3,385) Income before income taxes 1,735 1,505 1,849 Provision for income taxes (762) (278) (361) Net Income 973 1,227 1,488 EPS ($) 1.43 1.81 2.22
Adjusting Items (Pre-tax) (1) Amortization of acquisition-related intangible assets (2) (28) (34) (37) Acquisition integration costs (3) (4) (24) (22) Restructuring costs (4) - (59) - Adjusting items included in reported pre-tax income (32) (117) (59)
Adjusting Items (After tax) (1)
Amortization of acquisition-related intangible assets (2) (21) (26) (28) Acquisition integration costs (3) (3) (15) (14) Restructuring costs (4) - (41) - U.S. net deferred tax asset revaluation (5) (425) - - Adjusting items included in reported net income after tax (449) (82) (42) Impact on EPS ($) (0.69) (0.13) (0.06)
Adjusted Results
Revenue 5,678 5,655 5,405 Insurance claims, commissions and changes in policy benefit liabilities (CCPB) (361) (573) (4) Revenue, net of CCPB 5,317 5,082 5,401 Total provision for credit losses (141) (202) (167) Non-interest expense (3,409) (3,258) (3,326) Income before income taxes 1,767 1,622 1,908 Provision for income taxes (345) (313) (378) Net income 1,422 1,309 1,530 EPS ($) 2.12 1.94 2.28
(1) Adjusting items are included in Corporate Services, with the exception of the amortization of acquisition-related intangible assets, which is charged to the operating groups.
(2) These expenses were charged to the non-interest expense of the operating groups. Before and after-tax amounts for each operating group are provided on pages 14, 15, 16 and 18. (3) Acquisition integration costs related to the acquired BMO Transportation Finance business are charged to Corporate Services, since the acquisition impacts both Canadian and U.S. P&C businesses. Acquisition
costs are recorded in non-interest expense. (4) Restructuring charge in Q4-2017 as we continued to accelerate the use of technology to enhance customer experience and focus on driving operational efficiencies. Restructuring cost is recorded in non-
interest expense.
(5) For more information on the impact of the U.S. Tax Cuts and Jobs Act see the Other Regulatory Developments section on page 24. Certain comparative figures have been reclassified to conform with the current year’s presentation.
Adjusted results and measures in this table are non-GAAP amounts or non-GAAP measures.
6 BMO Financial Group First Quarter Report 2018
Caution Regarding Forward-Looking Statements Bank of Montreal’s public communications often include written or oral forward-looking statements. Statements of this type are included in this document, and may be included in
other filings with Canadian securities regulators or the U.S. Securities and Exchange Commission, or in other communications. All such statements are made pursuant to the “safe
harbor” provisions of, and are intended to be forward-looking statements under, the United States Private Securities Litigation Reform Act of 1995 and any applicable Canadian
securities legislation. Forward-looking statements may involve, but are not limited to, comments with respect to our objectives and priorities for fiscal 2018 and beyond, our strategies
or future actions, our targets, expectations for our financial condition or share price, and the results of or outlook for our operations or for the Canadian, U.S. and international
economies. Forward-looking statements are typically identified by words such as “will”, “should”, “believe”, “expect”, “anticipate”, “intend”, “estimate”, “plan”, “goal”, “target”,
“may” and “could”.
By their nature, forward-looking statements require us to make assumptions and are subject to inherent risks and uncertainties, both general and specific in nature. There is
significant risk that predictions, forecasts, conclusions or projections will not prove to be accurate, that our assumptions may not be correct, and that actual results may differ materially from
such predictions, forecasts, conclusions or projections. We caution readers of this document not to place undue reliance on our forward-looking statements, as a number of factors – many of
which are beyond our control and the effects of which can be difficult to predict – could cause actual future results, conditions, actions or events to differ materially from the targets,
expectations, estimates or intentions expressed in the forward-looking statements.
The future outcomes that relate to forward-looking statements may be influenced by many factors, including but not limited to: general economic and market conditions in the countries
in which we operate; weak, volatile or illiquid capital and/or credit markets; interest rate and currency value fluctuations; changes in monetary, fiscal, or economic policy and tax legislation
and interpretation; the level of competition in the geographic and business areas in which we operate; changes in laws or in supervisory expectations or requirements, including capital,
interest rate and liquidity requirements and guidance, and the effect of such changes on funding costs; judicial or regulatory proceedings; the accuracy and completeness of the information
we obtain with respect to our customers and counterparties; our ability to execute our strategic plans and to complete and integrate acquisitions, including obtaining regulatory approvals;
critical accounting estimates and the effect of changes to accounting standards, rules and interpretations on these estimates; operational and infrastructure risks; changes to our credit ratings;
political conditions, including changes relating to or affecting economic or trade matters; global capital markets activities; the possible effects on our business of war or terrorist activities;
outbreaks of disease or illness that affect local, national or international economies; natural disasters and disruptions to public infrastructure, such as transportation, communications, power
or water supply; technological changes; information and cyber security, including the threat of hacking, identity theft and corporate espionage, as well as the possibility of denial of service
resulting from efforts targeted at causing system failure and service disruption; and our ability to anticipate and effectively manage risks arising from all of the foregoing factors.
We caution that the foregoing list is not exhaustive of all possible factors. Other factors and risks could adversely affect our results. For more information, please see the discussion in the
Risks That May Affect Future Results section on page 79 of BMO’s 2017 Annual MD&A, the sections related to credit and counterparty, market, insurance, liquidity and funding, operational,
model, legal and regulatory, business, strategic, environmental and social, and reputation risk, which begin on page 86 of BMO’s 2017 Annual MD&A, the discussion in the Critical Accounting
Estimates – Income Taxes and Deferred Tax Assets section on page 114 of BMO’s 2017 Annual MD&A, and the Risk Management section in this document, all of which outline certain key
factors and risks that may affect Bank of Montreal’s future results. Investors and others should carefully consider these factors and risks, as well as other uncertainties and potential events,
and the inherent uncertainty of forward-looking statements. Bank of Montreal does not undertake to update any forward-looking statements, whether written or oral, that may be made
from time to time by the organization or on its behalf, except as required by law. The forward-looking information contained in this document is presented for the purpose of assisting our
shareholders in understanding our financial position as at and for the periods ended on the dates presented, as well as our strategic priorities and objectives, and may not be appropriate for
other purposes.
Material economic assumptions underlying the forward-looking statements contained in this document are set out in the 2017 Annual MD&A under the heading “Economic
Developments and Outlook”, as updated by the Economic Review and Outlook section set forth in this document. Assumptions about the performance of the Canadian and U.S. economies, as
well as overall market conditions and their combined effect on our business, are material factors we consider when determining our strategic priorities, objectives and expectations for our
business. In determining our expectations for economic growth, both broadly and in the financial services sector, we primarily consider historical economic data provided by governments,
historical relationships between economic and financial variables, and the risks to the domestic and global economy. See the Economic Review and Outlook section of our First Quarter 2018
Report to Shareholders.
Economic Review and Outlook After outpacing the other G7 nations in 2017, Canada’s economy is expected to moderate this year in response to less supportive financial conditions. Real GDP is projected to grow 2.2% in 2018, slowing from around 3.0% in 2017. However, this pace should still reduce the unemployment rate to a four-decade low of 5.5% before year-end 2018. Consumer spending helped the economy in 2017, as disposable income increased due to enhanced child-benefit payments and the strongest job creation in 14 years. Personal consumption is expected to slow this year in response to rising interest rates and elevated household debt, resulting in industry-wide consumer credit growth moderating to 3.2%. Although detached house prices have declined in the Toronto region in the wake of the Ontario Government’s Fair Housing Plan, housing market activity remains healthy nationwide. Nonetheless, industry-wide growth in residential mortgages is anticipated to moderate to 4.7% in 2018 in response to higher borrowing costs and stricter mortgage rules. Business investment has been steady, supported by higher
commodity prices and rising capacity utilization in the industrial sector. Industry-wide business loan growth is projected to decelerate to 7.4% this year as a result of higher interest rates and uncertain North American trade relations. After struggling to gain traction in 2017, exports are expected to improve this year in response to a more synchronized global economic expansion, led by China and a strengthening European economy. The Bank of Canada has raised its policy rate by 75 basis points since July 2017, and is projected to increase it a further 50 basis points before year-end 2018. The Canadian dollar strengthened against a generally weak U.S. dollar in 2017, benefiting from the recovery in oil prices, but the currency could struggle to make further headway until the risk of trade protectionism eases. Canada`s economy faces external risks related to the fate of the North American Free Trade Agreement, as its termination would likely slow Canadian real GDP by up to a cumulative 1.0% over five years, assuming the three nations adopt tariffs permitted under the World Trade Organization’s rules.
Additional risks include potential global market turbulence stemming from tensions between the United States and North Korea. Benefiting from supportive financial conditions, the U.S. economy has gained momentum, with strength in all major expenditure areas. After growing 2.3%
in 2017, real GDP is expected to expand 2.8% in 2018 amid expansionary fiscal policies. Employment is expected to remain healthy, reducing the jobless rate to a half-century low of 3.5% in 2019. Consumer spending is projected to grow almost 3.0% this year, supported by lower personal taxes and a positive wealth effect from rising house prices. This is expected to encourage industry-wide consumer credit growth of 4.0%. Low mortgage rates and easier lending conditions are expected to support housing market activity, keeping sales and starts near recent 10-year highs. Residential mortgage growth is projected to increase 5.4% this year. Business spending is expected to remain strong, supported by lower corporate taxes and greater incentives to invest and repatriate foreign earnings.
Industry-wide business credit is anticipated to increase 6.9% in 2018. Interest rates are projected to continue to increase moderately, with the Federal Reserve expected to raise its main policy rate by a further 100 basis points this year. After depreciating to a three-year low, the trade-weighted U.S. dollar is expected to weaken further due to tightening monetary policies abroad and rising trade and budget deficits at home. The main risks to the U.S. economic outlook relate to possible protectionist trade measures and heightened geopolitical tensions.
Economic growth in the U.S. Midwest region, which includes the six contiguous states within the BMO footprint, is expected to improve from around 1.4% in 2017 to 2.0% in 2018 in response to increased manufacturing and automotive production. However, growth is projected to lag the national rate due to slower population expansion and restrained fiscal spending in Illinois due to budgetary constraints.
This Economic Review and Outlook section contains forward-looking statements. Please see the Caution Regarding Forward-Looking Statements.
BMO Financial Group First Quarter Report 2018 7
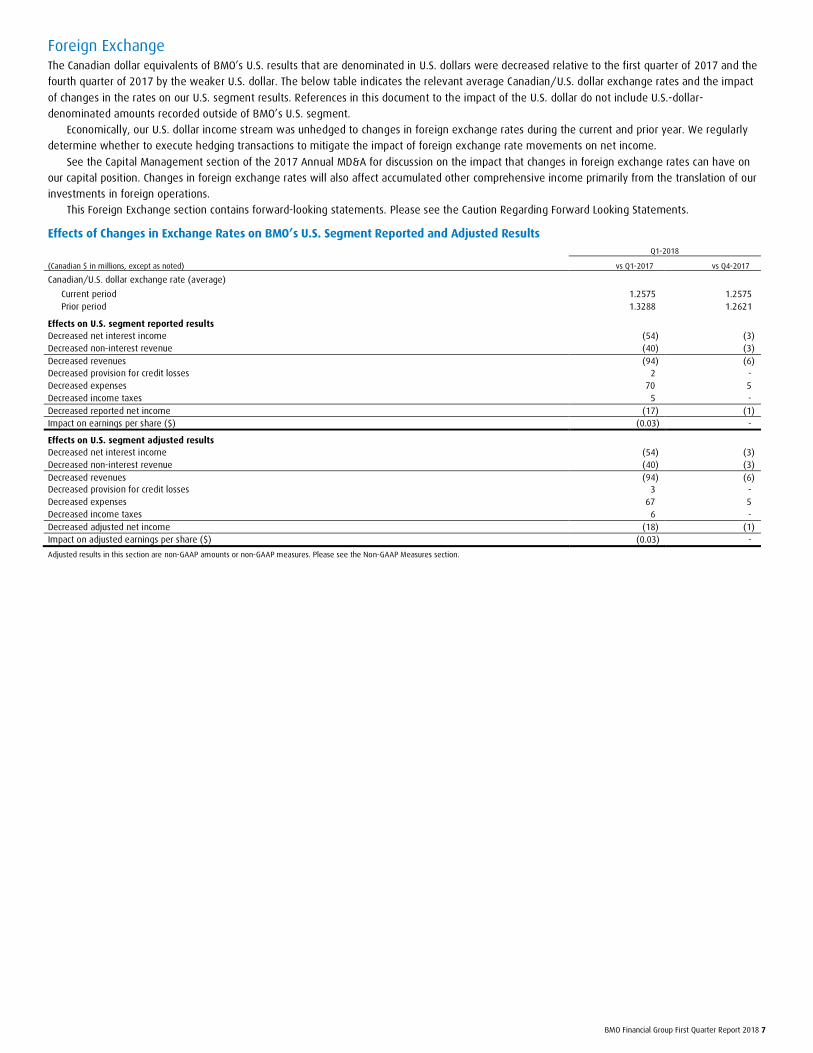
Foreign Exchange The Canadian dollar equivalents of BMO’s U.S. results that are denominated in U.S. dollars were decreased relative to the first quarter of 2017 and the
fourth quarter of 2017 by the weaker U.S. dollar. The below table indicates the relevant average Canadian/U.S. dollar exchange rates and the impact
of changes in the rates on our U.S. segment results. References in this document to the impact of the U.S. dollar do not include U.S.-dollar-
denominated amounts recorded outside of BMO’s U.S. segment.
Economically, our U.S. dollar income stream was unhedged to changes in foreign exchange rates during the current and prior year. We regularly
determine whether to execute hedging transactions to mitigate the impact of foreign exchange rate movements on net income.
See the Capital Management section of the 2017 Annual MD&A for discussion on the impact that changes in foreign exchange rates can have on
our capital position. Changes in foreign exchange rates will also affect accumulated other comprehensive income primarily from the translation of our
investments in foreign operations.
This Foreign Exchange section contains forward-looking statements. Please see the Caution Regarding Forward Looking Statements.
Effects of Changes in Exchange Rates on BMO’s U.S. Segment Reported and Adjusted Results Q1-2018
(Canadian $ in millions, except as noted) vs Q1-2017 vs Q4-2017
Canadian/U.S. dollar exchange rate (average)
Current period 1.2575 1.2575 Prior period 1.3288 1.2621
Effects on U.S. segment reported results Decreased net interest income (54) (3) Decreased non-interest revenue (40) (3) Decreased revenues (94) (6) Decreased provision for credit losses 2 - Decreased expenses 70 5 Decreased income taxes 5 - Decreased reported net income (17) (1) Impact on earnings per share ($) (0.03) -
Effects on U.S. segment adjusted results Decreased net interest income (54) (3) Decreased non-interest revenue (40) (3) Decreased revenues (94) (6) Decreased provision for credit losses 3 - Decreased expenses 67 5 Decreased income taxes 6 - Decreased adjusted net income (18) (1) Impact on adjusted earnings per share ($) (0.03) -
Adjusted results in this section are non-GAAP amounts or non-GAAP measures. Please see the Non-GAAP Measures section.
8 BMO Financial Group First Quarter Report 2018
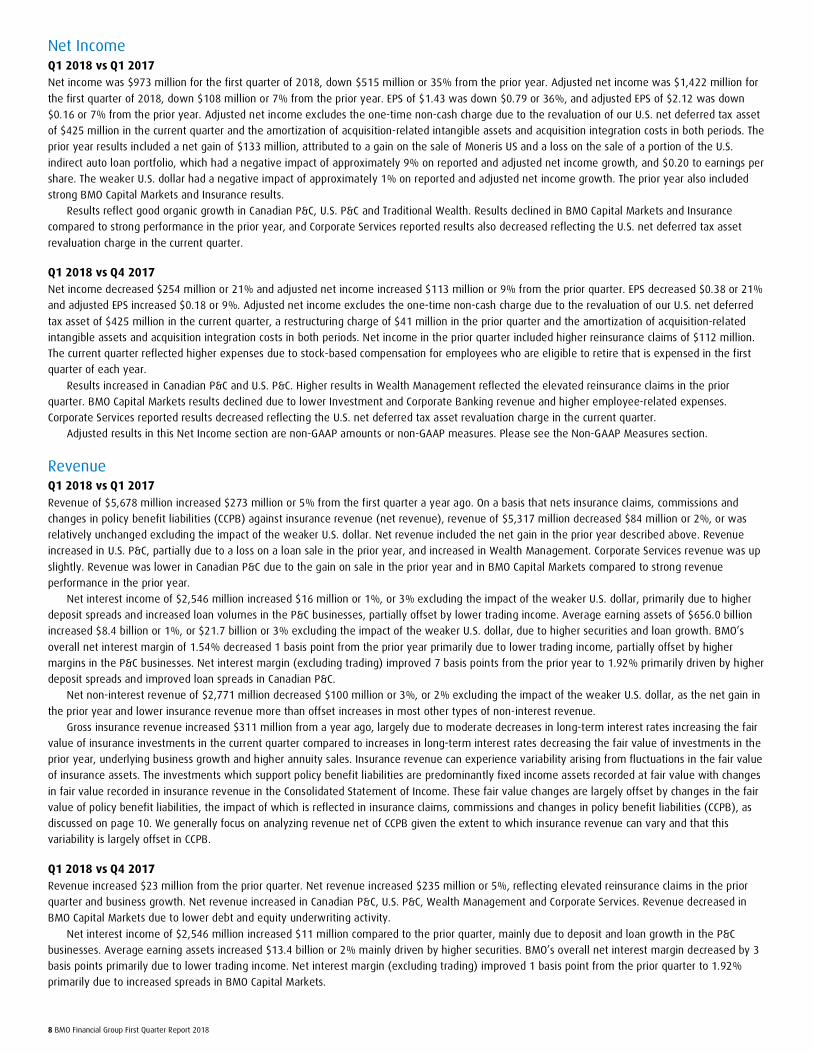
Net Income Q1 2018 vs Q1 2017 Net income was $973 million for the first quarter of 2018, down $515 million or 35% from the prior year. Adjusted net income was $1,422 million for
the first quarter of 2018, down $108 million or 7% from the prior year. EPS of $1.43 was down $0.79 or 36%, and adjusted EPS of $2.12 was down
$0.16 or 7% from the prior year. Adjusted net income excludes the one-time non-cash charge due to the revaluation of our U.S. net deferred tax asset
of $425 million in the current quarter and the amortization of acquisition-related intangible assets and acquisition integration costs in both periods. The
prior year results included a net gain of $133 million, attributed to a gain on the sale of Moneris US and a loss on the sale of a portion of the U.S.
indirect auto loan portfolio, which had a negative impact of approximately 9% on reported and adjusted net income growth, and $0.20 to earnings per
share. The weaker U.S. dollar had a negative impact of approximately 1% on reported and adjusted net income growth. The prior year also included
strong BMO Capital Markets and Insurance results.
Results reflect good organic growth in Canadian P&C, U.S. P&C and Traditional Wealth. Results declined in BMO Capital Markets and Insurance
compared to strong performance in the prior year, and Corporate Services reported results also decreased reflecting the U.S. net deferred tax asset
revaluation charge in the current quarter.
Q1 2018 vs Q4 2017 Net income decreased $254 million or 21% and adjusted net income increased $113 million or 9% from the prior quarter. EPS decreased $0.38 or 21%
and adjusted EPS increased $0.18 or 9%. Adjusted net income excludes the one-time non-cash charge due to the revaluation of our U.S. net deferred
tax asset of $425 million in the current quarter, a restructuring charge of $41 million in the prior quarter and the amortization of acquisition-related
intangible assets and acquisition integration costs in both periods. Net income in the prior quarter included higher reinsurance claims of $112 million.
The current quarter reflected higher expenses due to stock-based compensation for employees who are eligible to retire that is expensed in the first
quarter of each year.
Results increased in Canadian P&C and U.S. P&C. Higher results in Wealth Management reflected the elevated reinsurance claims in the prior
quarter. BMO Capital Markets results declined due to lower Investment and Corporate Banking revenue and higher employee-related expenses.
Corporate Services reported results decreased reflecting the U.S. net deferred tax asset revaluation charge in the current quarter.
Adjusted results in this Net Income section are non-GAAP amounts or non-GAAP measures. Please see the Non-GAAP Measures section.
Revenue Q1 2018 vs Q1 2017 Revenue of $5,678 million increased $273 million or 5% from the first quarter a year ago. On a basis that nets insurance claims, commissions and
changes in policy benefit liabilities (CCPB) against insurance revenue (net revenue), revenue of $5,317 million decreased $84 million or 2%, or was
relatively unchanged excluding the impact of the weaker U.S. dollar. Net revenue included the net gain in the prior year described above. Revenue
increased in U.S. P&C, partially due to a loss on a loan sale in the prior year, and increased in Wealth Management. Corporate Services revenue was up
slightly. Revenue was lower in Canadian P&C due to the gain on sale in the prior year and in BMO Capital Markets compared to strong revenue
performance in the prior year.
Net interest income of $2,546 million increased $16 million or 1%, or 3% excluding the impact of the weaker U.S. dollar, primarily due to higher
deposit spreads and increased loan volumes in the P&C businesses, partially offset by lower trading income. Average earning assets of $656.0 billion
increased $8.4 billion or 1%, or $21.7 billion or 3% excluding the impact of the weaker U.S. dollar, due to higher securities and loan growth. BMO’s
overall net interest margin of 1.54% decreased 1 basis point from the prior year primarily due to lower trading income, partially offset by higher
margins in the P&C businesses. Net interest margin (excluding trading) improved 7 basis points from the prior year to 1.92% primarily driven by higher
deposit spreads and improved loan spreads in Canadian P&C.
Net non-interest revenue of $2,771 million decreased $100 million or 3%, or 2% excluding the impact of the weaker U.S. dollar, as the net gain in
the prior year and lower insurance revenue more than offset increases in most other types of non-interest revenue.
Gross insurance revenue increased $311 million from a year ago, largely due to moderate decreases in long-term interest rates increasing the fair
value of insurance investments in the current quarter compared to increases in long-term interest rates decreasing the fair value of investments in the
prior year, underlying business growth and higher annuity sales. Insurance revenue can experience variability arising from fluctuations in the fair value
of insurance assets. The investments which support policy benefit liabilities are predominantly fixed income assets recorded at fair value with changes
in fair value recorded in insurance revenue in the Consolidated Statement of Income. These fair value changes are largely offset by changes in the fair
value of policy benefit liabilities, the impact of which is reflected in insurance claims, commissions and changes in policy benefit liabilities (CCPB), as
discussed on page 10. We generally focus on analyzing revenue net of CCPB given the extent to which insurance revenue can vary and that this
variability is largely offset in CCPB.
Q1 2018 vs Q4 2017 Revenue increased $23 million from the prior quarter. Net revenue increased $235 million or 5%, reflecting elevated reinsurance claims in the prior
quarter and business growth. Net revenue increased in Canadian P&C, U.S. P&C, Wealth Management and Corporate Services. Revenue decreased in
BMO Capital Markets due to lower debt and equity underwriting activity.
Net interest income of $2,546 million increased $11 million compared to the prior quarter, mainly due to deposit and loan growth in the P&C
businesses. Average earning assets increased $13.4 billion or 2% mainly driven by higher securities. BMO’s overall net interest margin decreased by 3
basis points primarily due to lower trading income. Net interest margin (excluding trading) improved 1 basis point from the prior quarter to 1.92%
primarily due to increased spreads in BMO Capital Markets.
BMO Financial Group First Quarter Report 2018 9
Net non-interest revenue increased $224 million or 9%, primarily due to higher trading revenue and the elevated reinsurance claims in the prior
quarter.
Gross insurance revenue decreased $122 million from the prior quarter, largely due to higher decreases in long-term interest rates and greater
increases in equity markets increasing the fair value of insurance investments in the prior quarter, partially offset by higher annuity sales in the current
quarter. The decrease in insurance revenue was largely offset by lower insurance claims, commissions and changes in policy benefit liabilities as
discussed on page 10.
Adjusted results in this Revenue section are non-GAAP amounts or non-GAAP measures. Please see the Non-GAAP Measures section.
Provision for Credit Losses Effective in the first quarter of 2018, the bank prospectively adopted IFRS 9. Under IFRS 9, we refer to the provision for credit losses on impaired loans
and the provision for credit losses on performing loans. The provision for credit losses on impaired loans under IFRS 9 is consistent with the specific
provision under IAS 39 in prior years. The provision for credit losses on performing loans replaces the collective provision under IAS 39. Refer to Note 3
to the unaudited interim consolidated financial statements for an explanation of the provision for credit losses. Prior periods have not been restated.
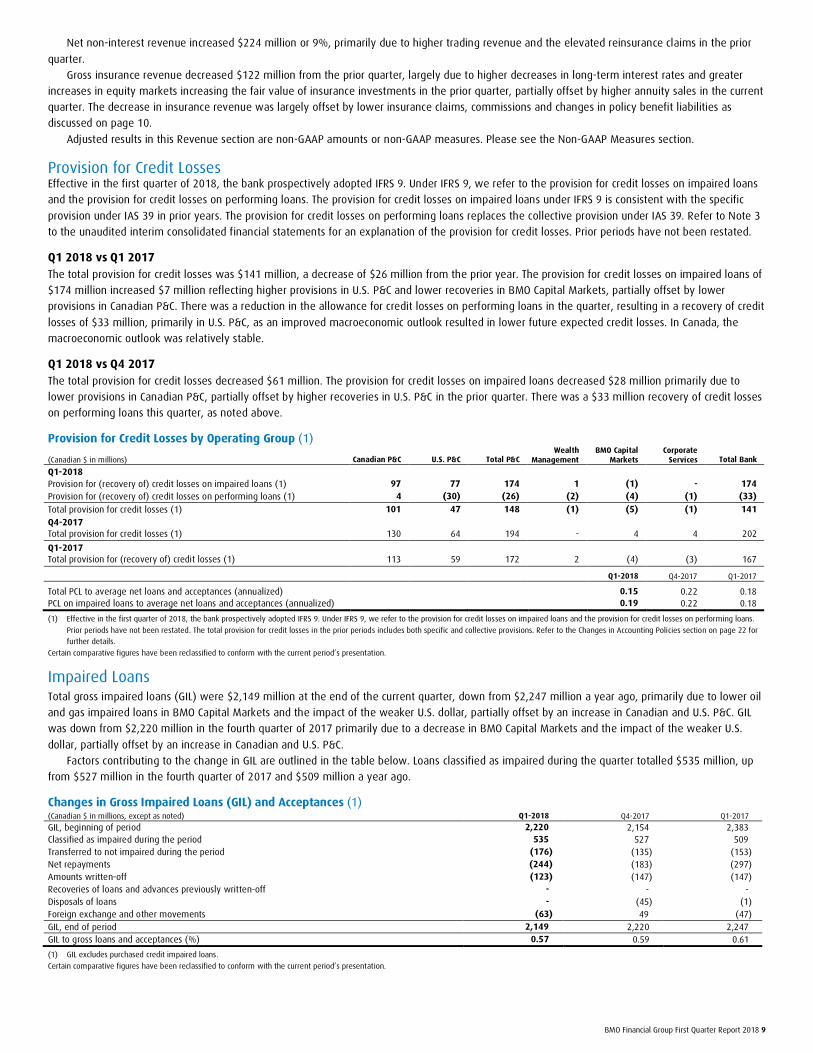
Q1 2018 vs Q1 2017 The total provision for credit losses was $141 million, a decrease of $26 million from the prior year. The provision for credit losses on impaired loans of
$174 million increased $7 million reflecting higher provisions in U.S. P&C and lower recoveries in BMO Capital Markets, partially offset by lower
provisions in Canadian P&C. There was a reduction in the allowance for credit losses on performing loans in the quarter, resulting in a recovery of credit
losses of $33 million, primarily in U.S. P&C, as an improved macroeconomic outlook resulted in lower future expected credit losses. In Canada, the
macroeconomic outlook was relatively stable.
Q1 2018 vs Q4 2017 The total provision for credit losses decreased $61 million. The provision for credit losses on impaired loans decreased $28 million primarily due to
lower provisions in Canadian P&C, partially offset by higher recoveries in U.S. P&C in the prior quarter. There was a $33 million recovery of credit losses
on performing loans this quarter, as noted above.
Provision for Credit Losses by Operating Group (1)
(Canadian $ in millions) Canadian P&C U.S. P&C Total P&C Wealth
Management BMO Capital
Markets Corporate
Services Total Bank
Q1-2018
Provision for (recovery of) credit losses on impaired loans (1) 97 77 174 1 (1) - 174 Provision for (recovery of) credit losses on performing loans (1) 4 (30) (26) (2) (4) (1) (33)
Total provision for credit losses (1) 101 47 148 (1) (5) (1) 141 Q4-2017 Total provision for credit losses (1) 130 64 194 - 4 4 202
Q1-2017 Total provision for (recovery of) credit losses (1) 113 59 172 2 (4) (3) 167
Q1-2018 Q4-2017 Q1-2017
Total PCL to average net loans and acceptances (annualized) 0.15 0.22 0.18 PCL on impaired loans to average net loans and acceptances (annualized) 0.19 0.22 0.18
(1) Effective in the first quarter of 2018, the bank prospectively adopted IFRS 9. Under IFRS 9, we refer to the provision for credit losses on impaired loans and the provision for credit losses on performing loans.
Prior periods have not been restated. The total provision for credit losses in the prior periods includes both specific and collective provisions. Refer to the Changes in Accounting Policies section on page 22 for further details.
Certain comparative figures have been reclassified to conform with the current period’s presentation.
Impaired Loans Total gross impaired loans (GIL) were $2,149 million at the end of the current quarter, down from $2,247 million a year ago, primarily due to lower oil
and gas impaired loans in BMO Capital Markets and the impact of the weaker U.S. dollar, partially offset by an increase in Canadian and U.S. P&C. GIL
was down from $2,220 million in the fourth quarter of 2017 primarily due to a decrease in BMO Capital Markets and the impact of the weaker U.S.
dollar, partially offset by an increase in Canadian and U.S. P&C.
Factors contributing to the change in GIL are outlined in the table below. Loans classified as impaired during the quarter totalled $535 million, up
from $527 million in the fourth quarter of 2017 and $509 million a year ago.
Changes in Gross Impaired Loans (GIL) and Acceptances (1) (Canadian $ in millions, except as noted) Q1-2018 Q4-2017 Q1-2017
GIL, beginning of period 2,220 2,154 2,383 Classified as impaired during the period 535 527 509 Transferred to not impaired during the period (176) (135) (153) Net repayments (244) (183) (297) Amounts written-off (123) (147) (147) Recoveries of loans and advances previously written-off - - - Disposals of loans - (45) (1) Foreign exchange and other movements (63) 49 (47) GIL, end of period 2,149 2,220 2,247 GIL to gross loans and acceptances (%) 0.57 0.59 0.61
(1) GIL excludes purchased credit impaired loans.
Certain comparative figures have been reclassified to conform with the current period’s presentation.
10 BMO Financial Group First Quarter Report 2018
Insurance Claims, Commissions and Changes in Policy Benefit Liabilities Insurance claims, commissions and changes in policy benefit liabilities (CCPB) were $361 million in the first quarter of 2018, up $357 million from
$4 million in the first quarter of 2017 due to moderate decreases in long-term interest rates increasing the fair value of policy benefit liabilities
compared to increases in long-term interest rates decreasing the fair value of policy benefit liabilities in the prior year, higher annuity sales and the
impact of underlying business growth. CCPB were down $212 million from $573 million in the fourth quarter of 2017 largely due to higher decreases in
long-term interest rates and greater increases in equity markets in the prior quarter increasing the fair value of policy benefit liabilities and elevated
reinsurance claims in the prior quarter, partially offset by higher annuity sales in the current quarter. The changes related to the fair value of policy
benefit liabilities and annuity sales were largely offset in revenue.
Non-Interest Expense Reported non-interest expense of $3,441 million increased $56 million or 2% from the first quarter a year ago. Adjusted non-interest expense of
$3,409 million increased $83 million or 2%, or 5% excluding the impact of the weaker U.S. dollar, with higher technology expenses being the single
largest contributor of growth, and increases across other expense categories. Adjusted non-interest expense excludes acquisition integration costs and
the amortization of acquisition-related intangible assets in both periods.
Reported non-interest expense increased $66 million or 2% and adjusted non-interest expense increased $151 million or 5% from the fourth
quarter of 2017 primarily due to higher employee-related expenses, including stock-based compensation for employees eligible to retire that is
expensed in the first quarter of each year, and seasonally higher employee benefits, partially offset by lower professional fees and travel and business
development expenses. Adjusted non-interest expense excludes a restructuring charge in the prior quarter, as well as the adjusting items noted above.
Reported operating leverage, on a net revenue basis, was negative 3.3% year over year. Adjusted operating leverage, on a net revenue basis, was
negative 4.1% year over year. The net gain in the prior year had a negative impact of approximately 2.5% on both reported and adjusted operating
leverage.
The reported efficiency ratio was 60.6% compared to 62.6% in the prior year, and was 64.7% on a net revenue basis compared to 62.7%. The
adjusted efficiency ratio was 60.0% compared to 61.5% in the prior year, and was 64.1% on a net revenue basis compared to 61.6%. The net gain in
the prior year contributed approximately 1.5% to the increase in the reported and adjusted net efficiency ratio compared to the prior year.
Non-interest expense is detailed in the unaudited interim consolidated financial statements.
Adjusted results in this Non-Interest Expense section are non-GAAP amounts or non-GAAP measures. Please see the Non-GAAP Measures section.
Income Taxes Reported net income in the quarter included a charge due to the revaluation of our U.S. net deferred tax asset. This one-time non-cash charge for the
reduction in the U.S. federal tax rate was recorded in income taxes. Going forward, there is expected to be a benefit from the lower tax rate on BMO’s
future U.S. earnings. For more information on the impact of the U.S. Tax Cuts and Jobs Act, see the Other Regulatory Developments section on page 24.
The provision for income taxes of $762 million increased $401 million from the first quarter of 2017 and increased $484 million from the fourth
quarter of 2017. The higher reported tax rate in the current quarter relative to both the first and fourth quarters of 2017 was due to the one-time non-
cash charge due to the revaluation of our U.S. net deferred tax asset. The effective tax rate for the quarter was 43.9%, compared with 19.5% a year
ago and 18.5% in the fourth quarter of 2017. The adjusted provision for income taxes of $345 million decreased $33 million from a year ago and
increased $32 million from the fourth quarter of 2017. The adjusted effective tax rate was 19.5% in the current quarter, compared with 19.8% a year
ago and 19.3% in the fourth quarter of 2017.
On a teb basis, the reported effective tax rate for the quarter was 47.6%, compared with 24.3% a year ago and 27.1% in the fourth quarter of
2017. On a teb basis, the adjusted effective tax rate for the quarter was 24.7%, compared with 24.4% a year ago and 27.2% in the fourth quarter of
2017.
Adjusted results in this Income Taxes section are non-GAAP amounts or non-GAAP measures. Please see the Non-GAAP Measures Section.
BMO Financial Group First Quarter Report 2018 11
Capital Management First Quarter 2018 Regulatory Capital Review BMO’s Common Equity Tier 1 (CET1) Ratio was 11.1% at January 31, 2018.
The CET1 Ratio decreased from 11.4% at the end of the fourth quarter as retained earnings growth was more than offset by business growth and
share repurchases during the quarter. The impact of the revaluation of our U.S. net deferred tax asset was a decrease of approximately 17 basis points
in the CET1 Ratio. The impact of foreign exchange movements on the CET1 Ratio was largely offset, as outlined below.
CET1 Capital at January 31, 2018 was $30.2 billion, down from $30.6 billion at October 31, 2017, mainly due to foreign exchange movement
impacts on accumulated other comprehensive income, the net capital impact of the reduced U.S. federal tax rate and share repurchases during the
quarter, partially offset by earnings.
Risk-weighted assets (RWA) were $270.6 billion at January 31, 2018, up from $269.5 billion at October 31, 2017, primarily due to business growth
which was largely offset by the impact of foreign exchange movements.
The bank’s Tier 1 and Total Capital Ratios were 12.8% and 15.2%, respectively, at January 31, 2018, compared with 13.0% and 15.1%,
respectively, at October 31, 2017. The Tier 1 Capital Ratio was lower than October 31, 2017, mainly due to lower CET1 Capital, discussed above. The
Total Capital Ratio was higher due to the issuance of subordinated notes, partially offset by lower Tier 1 Capital.
BMO’s Basel III Leverage Ratio was 4.3% at January 31, 2018, down from 4.4% at October 31, 2017 due to lower Tier 1 Capital and higher leverage
exposures due to business growth.
BMO’s investments in foreign operations are primarily denominated in U.S. dollars. The foreign exchange impact of U.S.-dollar-denominated RWA
and U.S.-dollar-denominated capital deductions may result in variability in the bank’s capital ratios. BMO may offset the impact of foreign exchange
movements on its capital ratios and did so during the first quarter. Any such activities could also impact our book value and return on equity.
IFRS 9 Financial Instruments impacted our reported capital as a result of the adjustment recorded in retained earnings on adoption of the standard,
though this impact was not significant. Note 1 to the unaudited interim consolidated financial statements provides detail on the impact of the new
standard.
Regulatory Developments In January 2018, the Office of the Superintendent of Financial Institutions (OSFI) communicated its revisions to the approach used to calculate the
capital floor. The changes, which will be effective in the second quarter of fiscal 2018, include the elimination of the Basel I floor and a shift to the
Basel II standardized approach, as well as a reduction of the floor factor to 70% in the second quarter, 72.5% in the third quarter and 75% for the
fourth quarter onward. The Basel I floor reduced our CET1 ratio by approximately 45 basis points at January 31, 2018.
In December 2017, the Basel Committee on Banking Supervision (BCBS) finalized the Basel III reforms to be implemented January 1, 2022. The
revisions include standardized approaches for credit risk and operational risk as well as the application of an RWA output floor phased in from 50% in
2022 to 72.5% in 2027. OSFI has indicated it may follow a shorter implementation period than the 10-year timeline proposed by the BCBS. In addition,
OSFI may set the initial output floor higher than the 50% proposed by the BCBS. A public consultation on domestic implementation is expected in
spring 2018.
For a more detailed discussion of regulatory developments, see the Enterprise-Wide Capital Management section on pages 69 to 75, the Liquidity
and Funding Risk section on pages 99 to 105 and the Legal and Regulatory Risk section on pages 109 to 111 of BMO’s 2017 Annual Report.
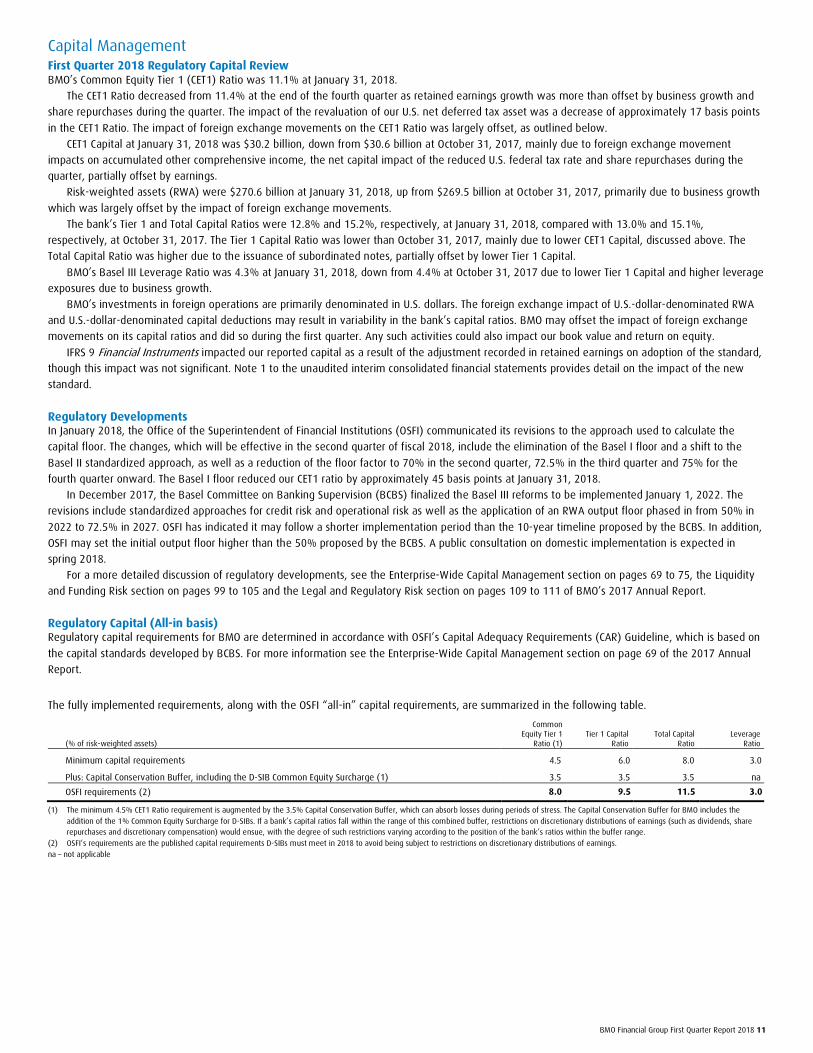
Regulatory Capital (All-in basis) Regulatory capital requirements for BMO are determined in accordance with OSFI’s Capital Adequacy Requirements (CAR) Guideline, which is based on
the capital standards developed by BCBS. For more information see the Enterprise-Wide Capital Management section on page 69 of the 2017 Annual
Report.
The fully implemented requirements, along with the OSFI “all-in” capital requirements, are summarized in the following table.
(% of risk-weighted assets)
Common Equity Tier 1
Ratio (1) Tier 1 Capital
Ratio Total Capital
Ratio Leverage
Ratio
Minimum capital requirements 4.5 6.0 8.0 3.0
Plus: Capital Conservation Buffer, including the D-SIB Common Equity Surcharge (1) 3.5 3.5 3.5 na
OSFI requirements (2) 8.0 9.5 11.5 3.0
(1) The minimum 4.5% CET1 Ratio requirement is augmented by the 3.5% Capital Conservation Buffer, which can absorb losses during periods of stress. The Capital Conservation Buffer for BMO includes the addition of the 1% Common Equity Surcharge for D-SIBs. If a bank’s capital ratios fall within the range of this combined buffer, restrictions on discretionary distributions of earnings (such as dividends, share repurchases and discretionary compensation) would ensue, with the degree of such restrictions varying according to the position of the bank’s ratios within the buffer range.
(2) OSFI’s requirements are the published capital requirements D-SIBs must meet in 2018 to avoid being subject to restrictions on discretionary distributions of earnings. na – not applicable
12 BMO Financial Group First Quarter Report 2018
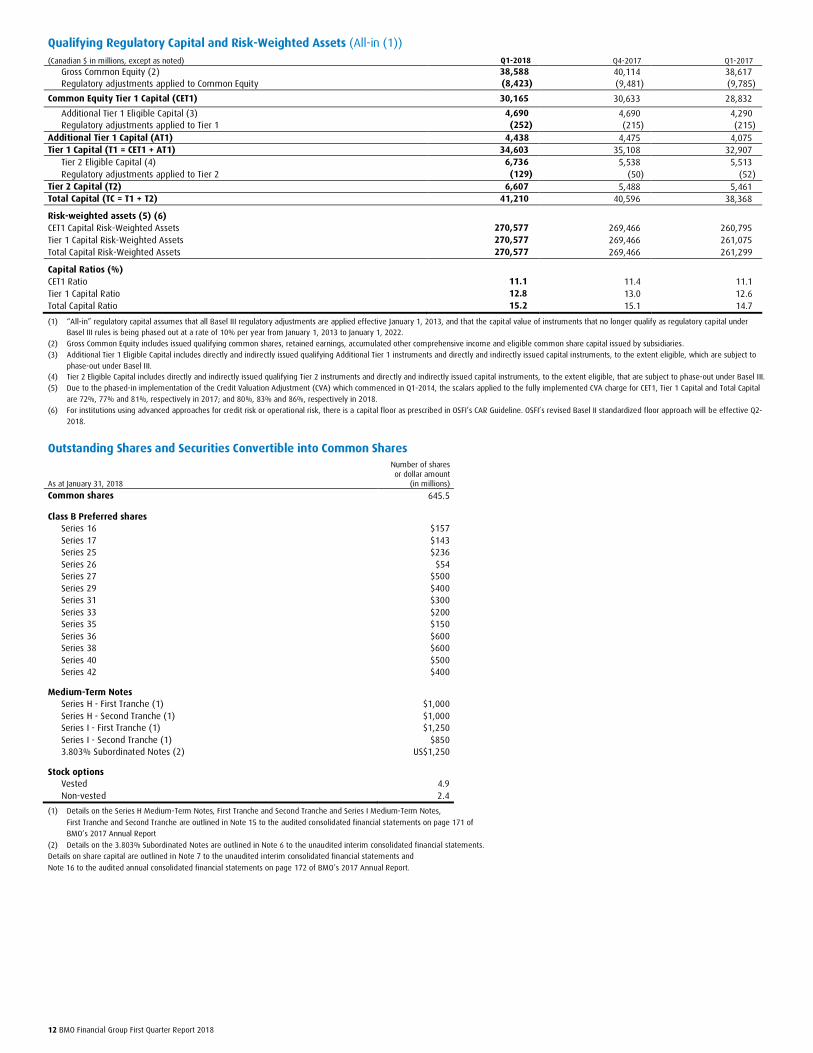
Qualifying Regulatory Capital and Risk-Weighted Assets (All-in (1)) (Canadian $ in millions, except as noted) Q1-2018 Q4-2017 Q1-2017
Gross Common Equity (2) 38,588 40,114 38,617 Regulatory adjustments applied to Common Equity (8,423) (9,481) (9,785)
Common Equity Tier 1 Capital (CET1) 30,165 30,633 28,832
Additional Tier 1 Eligible Capital (3) 4,690 4,690 4,290 Regulatory adjustments applied to Tier 1 (252) (215) (215)
Additional Tier 1 Capital (AT1) 4,438 4,475 4,075 Tier 1 Capital (T1 = CET1 + AT1) 34,603 35,108 32,907
Tier 2 Eligible Capital (4) 6,736 5,538 5,513 Regulatory adjustments applied to Tier 2 (129) (50) (52)
Tier 2 Capital (T2) 6,607 5,488 5,461 Total Capital (TC = T1 + T2) 41,210 40,596 38,368
Risk-weighted assets (5) (6) CET1 Capital Risk-Weighted Assets 270,577 269,466 260,795 Tier 1 Capital Risk-Weighted Assets 270,577 269,466 261,075 Total Capital Risk-Weighted Assets 270,577 269,466 261,299
Capital Ratios (%) CET1 Ratio 11.1 11.4 11.1 Tier 1 Capital Ratio 12.8 13.0 12.6 Total Capital Ratio 15.2 15.1 14.7
(1) “All-in” regulatory capital assumes that all Basel III regulatory adjustments are applied effective January 1, 2013, and that the capital value of instruments that no longer qualify as regulatory capital under Basel III rules is being phased out at a rate of 10% per year from January 1, 2013 to January 1, 2022.
(2) Gross Common Equity includes issued qualifying common shares, retained earnings, accumulated other comprehensive income and eligible common share capital issued by subsidiaries. (3) Additional Tier 1 Eligible Capital includes directly and indirectly issued qualifying Additional Tier 1 instruments and directly and indirectly issued capital instruments, to the extent eligible, which are subject to
phase-out under Basel III. (4) Tier 2 Eligible Capital includes directly and indirectly issued qualifying Tier 2 instruments and directly and indirectly issued capital instruments, to the extent eligible, that are subject to phase-out under Basel III. (5) Due to the phased-in implementation of the Credit Valuation Adjustment (CVA) which commenced in Q1-2014, the scalars applied to the fully implemented CVA charge for CET1, Tier 1 Capital and Total Capital
are 72%, 77% and 81%, respectively in 2017; and 80%, 83% and 86%, respectively in 2018. (6) For institutions using advanced approaches for credit risk or operational risk, there is a capital floor as prescribed in OSFI’s CAR Guideline. OSFI’s revised Basel II standardized floor approach will be effective Q2-
2018.
Outstanding Shares and Securities Convertible into Common Shares
As at January 31, 2018
Number of shares or dollar amount
(in millions)
Common shares 645.5
Class B Preferred shares Series 16 $157 Series 17 $143 Series 25 $236 Series 26 $54 Series 27 $500 Series 29 $400 Series 31 $300 Series 33 $200 Series 35 $150 Series 36 $600 Series 38 $600 Series 40 $500 Series 42 $400
Medium-Term Notes Series H - First Tranche (1) $1,000 Series H - Second Tranche (1) $1,000 Series I - First Tranche (1) $1,250 Series I - Second Tranche (1) $850 3.803% Subordinated Notes (2) US$1,250
Stock options Vested 4.9 Non-vested 2.4
(1) Details on the Series H Medium-Term Notes, First Tranche and Second Tranche and Series I Medium-Term Notes,
First Tranche and Second Tranche are outlined in Note 15 to the audited consolidated financial statements on page 171 of BMO’s 2017 Annual Report
(2) Details on the 3.803% Subordinated Notes are outlined in Note 6 to the unaudited interim consolidated financial statements. Details on share capital are outlined in Note 7 to the unaudited interim consolidated financial statements and
Note 16 to the audited annual consolidated financial statements on page 172 of BMO’s 2017 Annual Report.
BMO Financial Group First Quarter Report 2018 13
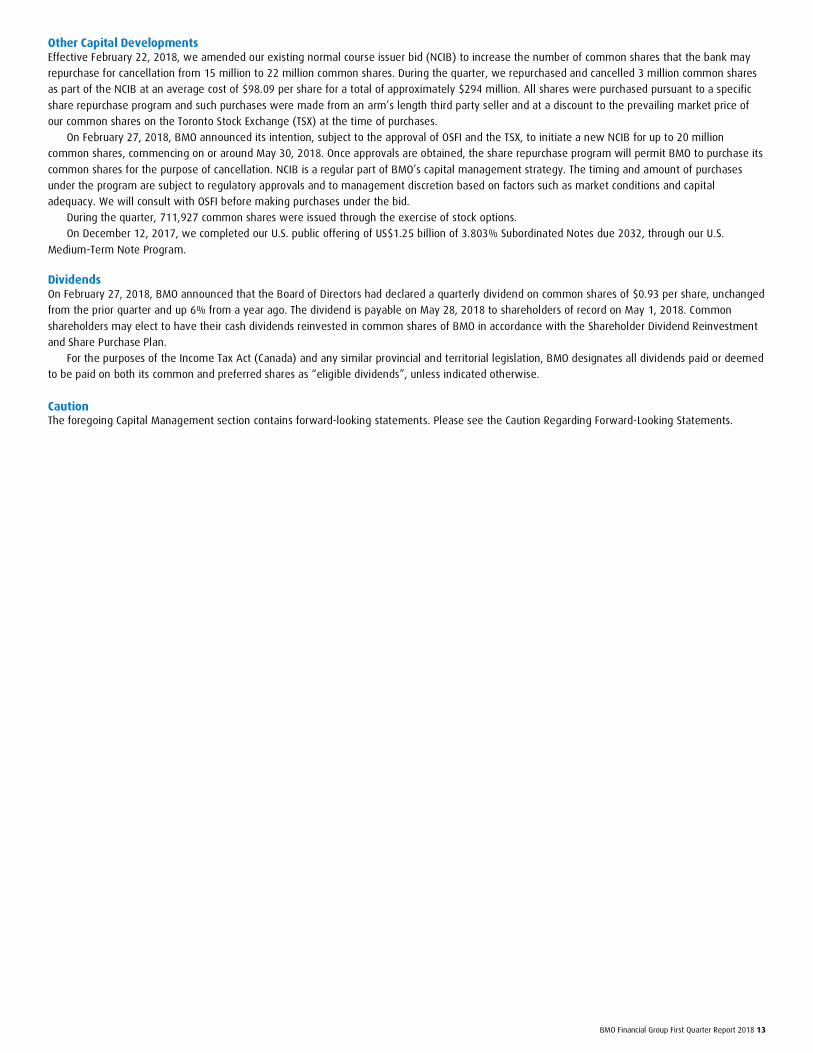
Other Capital Developments Effective February 22, 2018, we amended our existing normal course issuer bid (NCIB) to increase the number of common shares that the bank may
repurchase for cancellation from 15 million to 22 million common shares. During the quarter, we repurchased and cancelled 3 million common shares
as part of the NCIB at an average cost of $98.09 per share for a total of approximately $294 million. All shares were purchased pursuant to a specific
share repurchase program and such purchases were made from an arm’s length third party seller and at a discount to the prevailing market price of
our common shares on the Toronto Stock Exchange (TSX) at the time of purchases.
On February 27, 2018, BMO announced its intention, subject to the approval of OSFI and the TSX, to initiate a new NCIB for up to 20 million
common shares, commencing on or around May 30, 2018. Once approvals are obtained, the share repurchase program will permit BMO to purchase its
common shares for the purpose of cancellation. NCIB is a regular part of BMO’s capital management strategy. The timing and amount of purchases
under the program are subject to regulatory approvals and to management discretion based on factors such as market conditions and capital
adequacy. We will consult with OSFI before making purchases under the bid.
During the quarter, 711,927 common shares were issued through the exercise of stock options.
On December 12, 2017, we completed our U.S. public offering of US$1.25 billion of 3.803% Subordinated Notes due 2032, through our U.S.
Medium-Term Note Program.
Dividends On February 27, 2018, BMO announced that the Board of Directors had declared a quarterly dividend on common shares of $0.93 per share, unchanged
from the prior quarter and up 6% from a year ago. The dividend is payable on May 28, 2018 to shareholders of record on May 1, 2018. Common
shareholders may elect to have their cash dividends reinvested in common shares of BMO in accordance with the Shareholder Dividend Reinvestment
and Share Purchase Plan.
For the purposes of the Income Tax Act (Canada) and any similar provincial and territorial legislation, BMO designates all dividends paid or deemed
to be paid on both its common and preferred shares as “eligible dividends”, unless indicated otherwise.
Caution The foregoing Capital Management section contains forward-looking statements. Please see the Caution Regarding Forward-Looking Statements.
14 BMO Financial Group First Quarter Report 2018
Review of Operating Groups’ Performance How BMO Reports Operating Group Results The following sections review the financial results of each of our operating groups and operating segments for the first quarter of 2018.
Periodically, certain business lines and units within the business lines are transferred between client and corporate support groups to more closely
align BMO’s organizational structure with its strategic priorities. In addition, revenue, provision for credit losses and expense allocations are updated to
better align with current experience. Results for prior periods are reclassified to conform to the current presentation.
Effective the first quarter of 2018, the allocation of certain revenue items from Corporate Services to the operating groups was updated to align
with underlying business activity. Results for prior periods and related ratios have been reclassified to conform with the current presentation.
The following additional reclassifications were made effective the first quarter of 2018. Loan losses related to certain fraud costs have been
reclassified from provision for credit losses to other non-interest expenses in Canadian and U.S. P&C. Certain fees have been reclassified from deposit
and payment service charges to card fees within non-interest revenue in Canadian P&C. Also, cash collateral balances were reclassified from loans and
deposits to other assets and other liabilities in BMO Capital Markets. Results for prior periods and related ratios have been reclassified to conform with
the current period’s presentation.
BMO analyzes revenue at the consolidated level based on GAAP revenue reflected in the consolidated financial statements rather than on a
taxable equivalent basis (teb), which is consistent with our Canadian peer group. Like many banks, we analyze revenue on a teb basis at the operating
group level. Revenue and the provision for income taxes are increased on tax-exempt securities to an equivalent before-tax basis to facilitate
comparisons of income between taxable and tax-exempt sources. The offset to the group teb adjustments is reflected in Corporate Services revenue
and income tax provisions.
Effective with the adoption of IFRS 9, we allocate the provision for credit losses on performing loans and the related allowance to operating groups.
In 2017 and prior years the collective provision and allowance was held in Corporate Services.
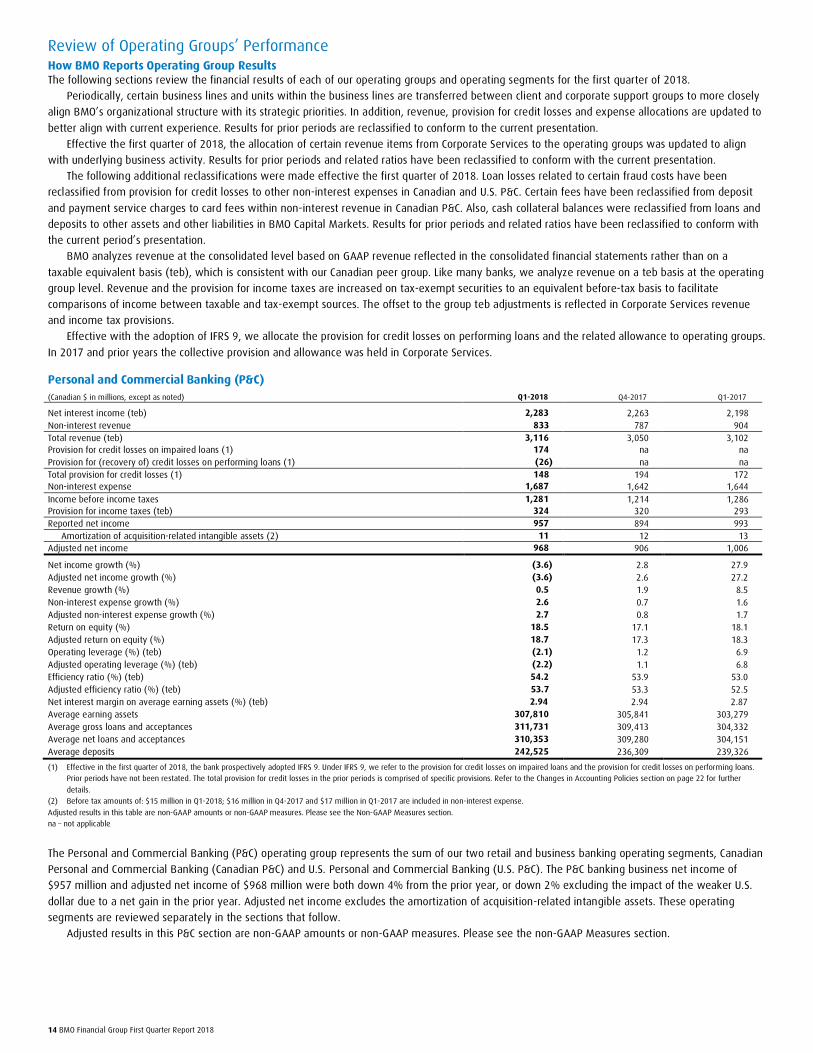
Personal and Commercial Banking (P&C)
(Canadian $ in millions, except as noted) Q1-2018 Q4-2017 Q1-2017
Net interest income (teb) 2,283 2,263 2,198 Non-interest revenue 833 787 904 Total revenue (teb) 3,116 3,050 3,102 Provision for credit losses on impaired loans (1) 174 na na Provision for (recovery of) credit losses on performing loans (1) (26) na na Total provision for credit losses (1) 148 194 172 Non-interest expense 1,687 1,642 1,644 Income before income taxes 1,281 1,214 1,286 Provision for income taxes (teb) 324 320 293 Reported net income 957 894 993
Amortization of acquisition-related intangible assets (2) 11 12 13 Adjusted net income 968 906 1,006
Net income growth (%) (3.6) 2.8 27.9 Adjusted net income growth (%) (3.6) 2.6 27.2 Revenue growth (%) 0.5 1.9 8.5 Non-interest expense growth (%) 2.6 0.7 1.6 Adjusted non-interest expense growth (%) 2.7 0.8 1.7 Return on equity (%) 18.5 17.1 18.1 Adjusted return on equity (%) 18.7 17.3 18.3 Operating leverage (%) (teb) (2.1) 1.2 6.9 Adjusted operating leverage (%) (teb) (2.2) 1.1 6.8 Efficiency ratio (%) (teb) 54.2 53.9 53.0 Adjusted efficiency ratio (%) (teb) 53.7 53.3 52.5 Net interest margin on average earning assets (%) (teb) 2.94 2.94 2.87 Average earning assets 307,810 305,841 303,279 Average gross loans and acceptances 311,731 309,413 304,332 Average net loans and acceptances 310,353 309,280 304,151 Average deposits 242,525 236,309 239,326
(1) Effective in the first quarter of 2018, the bank prospectively adopted IFRS 9. Under IFRS 9, we refer to the provision for credit losses on impaired loans and the provision for credit losses on performing loans. Prior periods have not been restated. The total provision for credit losses in the prior periods is comprised of specific provisions. Refer to the Changes in Accounting Policies section on page 22 for further
details. (2) Before tax amounts of: $15 million in Q1-2018; $16 million in Q4-2017 and $17 million in Q1-2017 are included in non-interest expense.
Adjusted results in this table are non-GAAP amounts or non-GAAP measures. Please see the Non-GAAP Measures section. na – not applicable
The Personal and Commercial Banking (P&C) operating group represents the sum of our two retail and business banking operating segments, Canadian
Personal and Commercial Banking (Canadian P&C) and U.S. Personal and Commercial Banking (U.S. P&C). The P&C banking business net income of
$957 million and adjusted net income of $968 million were both down 4% from the prior year, or down 2% excluding the impact of the weaker U.S.
dollar due to a net gain in the prior year. Adjusted net income excludes the amortization of acquisition-related intangible assets. These operating
segments are reviewed separately in the sections that follow.
Adjusted results in this P&C section are non-GAAP amounts or non-GAAP measures. Please see the non-GAAP Measures section.
BMO Financial Group First Quarter Report 2018 15
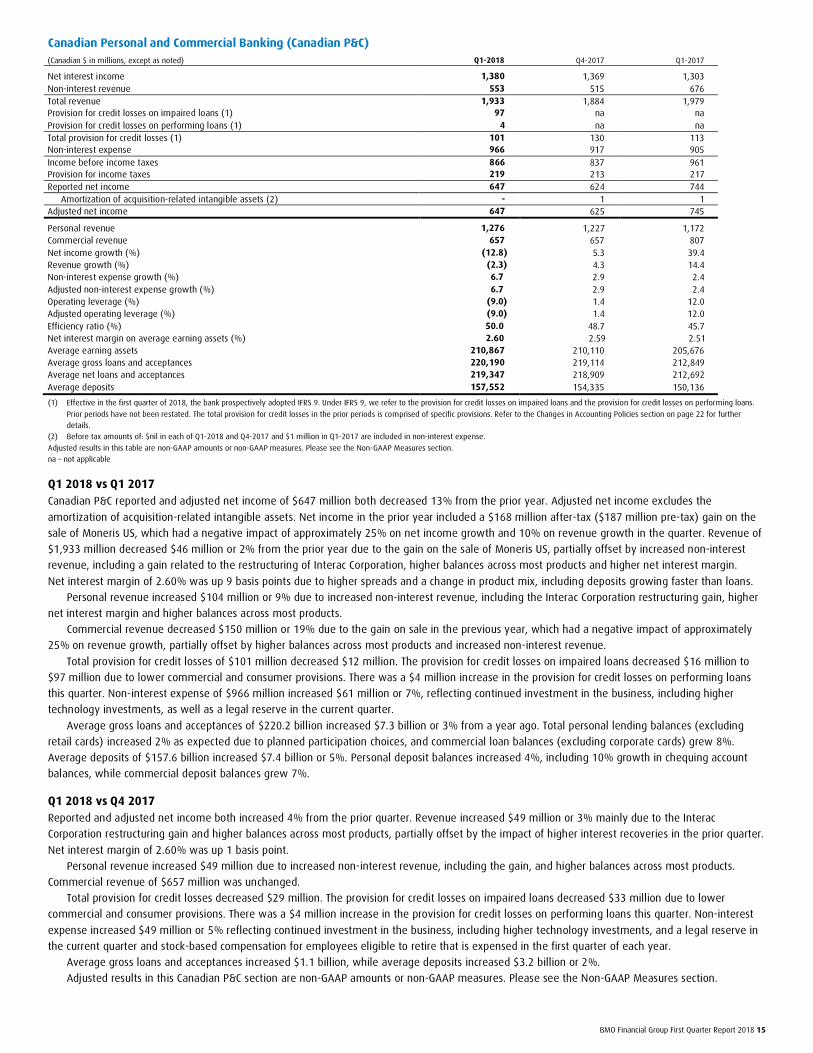
Canadian Personal and Commercial Banking (Canadian P&C)
(Canadian $ in millions, except as noted) Q1-2018 Q4-2017 Q1-2017
Net interest income 1,380 1,369 1,303 Non-interest revenue 553 515 676 Total revenue 1,933 1,884 1,979 Provision for credit losses on impaired loans (1) 97 na na Provision for credit losses on performing loans (1) 4 na na Total provision for credit losses (1) 101 130 113 Non-interest expense 966 917 905 Income before income taxes 866 837 961 Provision for income taxes 219 213 217 Reported net income 647 624 744
Amortization of acquisition-related intangible assets (2) - 1 1 Adjusted net income 647 625 745
Personal revenue 1,276 1,227 1,172 Commercial revenue 657 657 807 Net income growth (%) (12.8) 5.3 39.4 Revenue growth (%) (2.3) 4.3 14.4 Non-interest expense growth (%) 6.7 2.9 2.4 Adjusted non-interest expense growth (%) 6.7 2.9 2.4 Operating leverage (%) (9.0) 1.4 12.0 Adjusted operating leverage (%) (9.0) 1.4 12.0 Efficiency ratio (%) 50.0 48.7 45.7 Net interest margin on average earning assets (%) 2.60 2.59 2.51 Average earning assets 210,867 210,110 205,676 Average gross loans and acceptances 220,190 219,114 212,849 Average net loans and acceptances 219,347 218,909 212,692 Average deposits 157,552 154,335 150,136
(1) Effective in the first quarter of 2018, the bank prospectively adopted IFRS 9. Under IFRS 9, we refer to the provision for credit losses on impaired loans and the provision for credit losses on performing loans.
Prior periods have not been restated. The total provision for credit losses in the prior periods is comprised of specific provisions. Refer to the Changes in Accounting Policies section on page 22 for further details.
(2) Before tax amounts of: $nil in each of Q1-2018 and Q4-2017 and $1 million in Q1-2017 are included in non-interest expense.
Adjusted results in this table are non-GAAP amounts or non-GAAP measures. Please see the Non-GAAP Measures section. na – not applicable
Q1 2018 vs Q1 2017 Canadian P&C reported and adjusted net income of $647 million both decreased 13% from the prior year. Adjusted net income excludes the
amortization of acquisition-related intangible assets. Net income in the prior year included a $168 million after-tax ($187 million pre-tax) gain on the
sale of Moneris US, which had a negative impact of approximately 25% on net income growth and 10% on revenue growth in the quarter. Revenue of
$1,933 million decreased $46 million or 2% from the prior year due to the gain on the sale of Moneris US, partially offset by increased non-interest
revenue, including a gain related to the restructuring of Interac Corporation, higher balances across most products and higher net interest margin.
Net interest margin of 2.60% was up 9 basis points due to higher spreads and a change in product mix, including deposits growing faster than loans.
Personal revenue increased $104 million or 9% due to increased non-interest revenue, including the Interac Corporation restructuring gain, higher
net interest margin and higher balances across most products.
Commercial revenue decreased $150 million or 19% due to the gain on sale in the previous year, which had a negative impact of approximately
25% on revenue growth, partially offset by higher balances across most products and increased non-interest revenue.
Total provision for credit losses of $101 million decreased $12 million. The provision for credit losses on impaired loans decreased $16 million to
$97 million due to lower commercial and consumer provisions. There was a $4 million increase in the provision for credit losses on performing loans
this quarter. Non-interest expense of $966 million increased $61 million or 7%, reflecting continued investment in the business, including higher
technology investments, as well as a legal reserve in the current quarter.
Average gross loans and acceptances of $220.2 billion increased $7.3 billion or 3% from a year ago. Total personal lending balances (excluding
retail cards) increased 2% as expected due to planned participation choices, and commercial loan balances (excluding corporate cards) grew 8%.
Average deposits of $157.6 billion increased $7.4 billion or 5%. Personal deposit balances increased 4%, including 10% growth in chequing account
balances, while commercial deposit balances grew 7%.
Q1 2018 vs Q4 2017 Reported and adjusted net income both increased 4% from the prior quarter. Revenue increased $49 million or 3% mainly due to the Interac
Corporation restructuring gain and higher balances across most products, partially offset by the impact of higher interest recoveries in the prior quarter.
Net interest margin of 2.60% was up 1 basis point.
Personal revenue increased $49 million due to increased non-interest revenue, including the gain, and higher balances across most products.
Commercial revenue of $657 million was unchanged.
Total provision for credit losses decreased $29 million. The provision for credit losses on impaired loans decreased $33 million due to lower
commercial and consumer provisions. There was a $4 million increase in the provision for credit losses on performing loans this quarter. Non-interest
expense increased $49 million or 5% reflecting continued investment in the business, including higher technology investments, and a legal reserve in
the current quarter and stock-based compensation for employees eligible to retire that is expensed in the first quarter of each year.
Average gross loans and acceptances increased $1.1 billion, while average deposits increased $3.2 billion or 2%.
Adjusted results in this Canadian P&C section are non-GAAP amounts or non-GAAP measures. Please see the Non-GAAP Measures section.
16 BMO Financial Group First Quarter Report 2018
U.S. Personal and Commercial Banking (U.S. P&C)
(US$ in millions, except as noted) Q1-2018 Q4-2017 Q1-2017
Net interest income (teb) 718 708 673 Non-interest revenue 223 216 172 Total revenue (teb) 941 924 845 Provision for credit losses on impaired loans (1) 62 na na Provision for (recovery of) credit losses on performing loans (1) (25) na na Total provision for credit losses (1) 37 52 44 Non-interest expense 573 574 556 Income before income taxes 331 298 245 Provision for income taxes (teb) 84 84 57 Reported net income 247 214 188
Amortization of acquisition-related intangible assets (2) 9 9 9 Adjusted net income 256 223 197
Net income growth (%) 31.4 1.9 6.5 Adjusted net income growth (%) 29.8 1.6 6.0 Revenue growth (%) 11.3 2.8 3.0 Non-interest expense growth (%) 3.0 2.6 4.3 Adjusted non-interest expense growth (%) 3.2 2.8 4.5 Operating leverage (%) (teb) 8.3 0.2 (1.3) Adjusted operating leverage (%) (teb) 8.1 - (1.5) Efficiency ratio (%) (teb) 60.9 62.2 65.8 Adjusted efficiency ratio (%) (teb) 59.7 60.9 64.4 Net interest margin on average earning assets (%) (teb) 3.70 3.70 3.64 Average earning assets 77,101 75,849 73,440 Average gross loans and acceptances 72,804 71,546 68,835 Average net loans and acceptances 72,378 71,603 68,817 Average deposits 67,583 64,952 67,113
(Canadian $ equivalent in millions) Net interest income (teb) 903 894 895 Non-interest revenue 280 272 228 Total revenue (teb) 1,183 1,166 1,123 Provision for credit losses on impaired loans (1) 77 na na Provision for (recovery of) credit losses on performing loans (1) (30) na na Total provision for credit losses (1) 47 64 59 Non-interest expense 721 725 739 Income before income taxes 415 377 325 Provision for income taxes (teb) 105 107 76 Reported net income 310 270 249 Adjusted net income 321 281 261
Net income growth (%) 24.1 (2.7) 2.6 Adjusted net income growth (%) 22.6 (3.1) 2.0 Revenue growth (%) 5.3 (1.8) (0.6) Non-interest expense growth (%) (2.4) (2.0) 0.7 Adjusted non-interest expense growth (%) (2.2) (1.8) 0.9 Average earning assets 96,943 95,731 97,603 Average gross loans and acceptances 91,541 90,299 91,483 Average net loans and acceptances 91,006 90,371 91,459 Average deposits 84,973 81,974 89,190
(1) Effective in the first quarter of 2018, the bank prospectively adopted IFRS 9. Under IFRS 9, we refer to the provision for credit losses on impaired loans and the provision for credit losses on performing loans.
Prior periods have not been restated. The total provision for credit losses in the prior periods is comprised of specific provisions. Refer to the Changes in Accounting Policies section on page 22 for further details.
(2) Before tax amounts of: US$12 million in each of Q1-2018 and Q1-2017; US$13 million in Q4-2017 are included in non-interest expense. Adjusted results in this table are non-GAAP amounts or non-GAAP measures. Please see the Non-GAAP Measures section. na – not applicable
Q1 2018 vs Q1 2017 Reported net income of $310 million increased $61 million or 24% and adjusted net income of $321 million increased $60 million or 23% from a year
ago. Adjusted net income excludes the amortization of acquisition-related intangible assets. All amounts in the remainder of this section are on a U.S.
dollar basis.
Reported net income of $247 million increased $59 million or 31% from a year ago and adjusted net income of $256 million increased $59 million
or 30%. Prior year results included a $27 million after-tax ($43 million pre-tax) loss on a loan sale, which contributed approximately 16% to reported
and adjusted net income growth and 5% to revenue growth. Revenue of $941 million increased $96 million or 11% from the prior year, mainly due to
higher deposit revenue, a loss on a loan sale in the prior year and increased commercial loan volumes, net of loan spread compression. Net interest
margin increased 6 basis points to 3.70% due to higher deposit revenue driven by higher interest rates, net of loan spread compression and changes in
business mix.
Total provision for credit losses of $37 million decreased $7 million. The provision for credit losses on impaired loans of $62 million increased
$18 million due to higher commercial provisions, partially offset by lower consumer provisions. There was a reduction in the allowance for credit losses
on performing loans in the quarter, resulting in a recovery of credit losses of $25 million, as an improved macroeconomic outlook resulted in lower
future expected credit losses. Non-interest expense of $573 million increased $17 million or 3% and adjusted non-interest expense of $561 million
increased $17 million or 3%, largely due to higher technology investments. Current year results benefited from the more favourable tax rate as a result
of U.S. tax reform.

BMO Financial Group First Quarter Report 2018 17
Average gross loans and acceptances increased $4.0 billion or 6% from the prior year to $72.8 billion, driven by commercial loan growth of 7%
and increased personal loan volumes, due to the purchase of a $2.1 billion mortgage portfolio in the current quarter. Average deposits increased $0.5 billion or 1% from the prior year due to growth in personal volumes across all products, partially offset by an
expected decline in commercial volumes given higher interest rates.
Q1 2018 vs Q4 2017 Reported net income and adjusted net income both increased $40 million or 14% from the prior quarter. All amounts in the remainder of this section
are on a U.S. dollar basis.
Reported net income and adjusted net income both increased $33 million or 15%. Revenue increased $17 million or 2% mainly due to higher
deposit revenue and commercial lending fees, net of loan spread compression. Net interest margin remained unchanged as improved deposit revenue
driven by higher interest rates was offset by a change in business mix and continued loan spread compression.
Total provision for credit losses decreased $15 million. The provision for credit losses on impaired loans increased $10 million due to higher
consumer recoveries in the prior quarter. There was a $25 million recovery of credit losses on performing loans this quarter largely as a result of an
improved economic outlook. Non-interest expense and adjusted non-interest expense were both relatively flat compared to the prior quarter. Current
year results benefited from the more favourable tax rate as a result of U.S. tax reform.
Average gross loans and acceptances increased $1.3 billion or 2% largely due to the purchase of a mortgage portfolio. Average deposits increased
$2.6 billion or 4% due to growth in both personal and commercial volumes.
Adjusted results in this U.S. P&C section are non-GAAP amounts or non-GAAP measures. Please see the Non-GAAP Measures section.
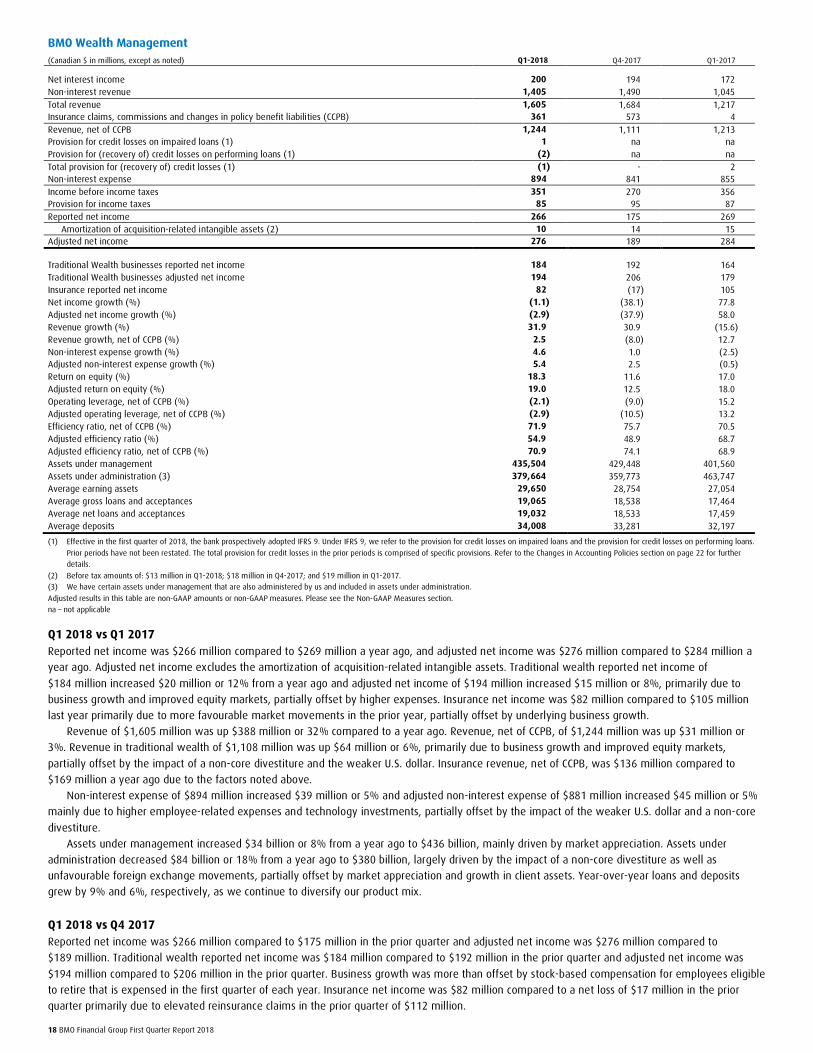
18 BMO Financial Group First Quarter Report 2018
BMO Wealth Management (Canadian $ in millions, except as noted) Q1-2018 Q4-2017 Q1-2017
Net interest income 200 194 172 Non-interest revenue 1,405 1,490 1,045 Total revenue 1,605 1,684 1,217 Insurance claims, commissions and changes in policy benefit liabilities (CCPB) 361 573 4 Revenue, net of CCPB 1,244 1,111 1,213 Provision for credit losses on impaired loans (1) 1 na na Provision for (recovery of) credit losses on performing loans (1) (2) na na Total provision for (recovery of) credit losses (1) (1) - 2 Non-interest expense 894 841 855 Income before income taxes 351 270 356 Provision for income taxes 85 95 87 Reported net income 266 175 269
Amortization of acquisition-related intangible assets (2) 10 14 15 Adjusted net income 276 189 284
Traditional Wealth businesses reported net income 184 192 164 Traditional Wealth businesses adjusted net income 194 206 179 Insurance reported net income 82 (17) 105 Net income growth (%) (1.1) (38.1) 77.8 Adjusted net income growth (%) (2.9) (37.9) 58.0 Revenue growth (%) 31.9 30.9 (15.6) Revenue growth, net of CCPB (%) 2.5 (8.0) 12.7 Non-interest expense growth (%) 4.6 1.0 (2.5) Adjusted non-interest expense growth (%) 5.4 2.5 (0.5) Return on equity (%) 18.3 11.6 17.0 Adjusted return on equity (%) 19.0 12.5 18.0 Operating leverage, net of CCPB (%) (2.1) (9.0) 15.2 Adjusted operating leverage, net of CCPB (%) (2.9) (10.5) 13.2 Efficiency ratio, net of CCPB (%) 71.9 75.7 70.5 Adjusted efficiency ratio (%) 54.9 48.9 68.7 Adjusted efficiency ratio, net of CCPB (%) 70.9 74.1 68.9 Assets under management 435,504 429,448 401,560 Assets under administration (3) 379,664 359,773 463,747 Average earning assets 29,650 28,754 27,054 Average gross loans and acceptances 19,065 18,538 17,464 Average net loans and acceptances 19,032 18,533 17,459 Average deposits 34,008 33,281 32,197
(1) Effective in the first quarter of 2018, the bank prospectively adopted IFRS 9. Under IFRS 9, we refer to the provision for credit losses on impaired loans and the provision for credit losses on performing loans.
Prior periods have not been restated. The total provision for credit losses in the prior periods is comprised of specific provisions. Refer to the Changes in Accounting Policies section on page 22 for further details.
(2) Before tax amounts of: $13 million in Q1-2018; $18 million in Q4-2017; and $19 million in Q1-2017. (3) We have certain assets under management that are also administered by us and included in assets under administration.
Adjusted results in this table are non-GAAP amounts or non-GAAP measures. Please see the Non-GAAP Measures section. na – not applicable
Q1 2018 vs Q1 2017 Reported net income was $266 million compared to $269 million a year ago, and adjusted net income was $276 million compared to $284 million a
year ago. Adjusted net income excludes the amortization of acquisition-related intangible assets. Traditional wealth reported net income of
$184 million increased $20 million or 12% from a year ago and adjusted net income of $194 million increased $15 million or 8%, primarily due to
business growth and improved equity markets, partially offset by higher expenses. Insurance net income was $82 million compared to $105 million
last year primarily due to more favourable market movements in the prior year, partially offset by underlying business growth.
Revenue of $1,605 million was up $388 million or 32% compared to a year ago. Revenue, net of CCPB, of $1,244 million was up $31 million or
3%. Revenue in traditional wealth of $1,108 million was up $64 million or 6%, primarily due to business growth and improved equity markets,
partially offset by the impact of a non-core divestiture and the weaker U.S. dollar. Insurance revenue, net of CCPB, was $136 million compared to
$169 million a year ago due to the factors noted above.
Non-interest expense of $894 million increased $39 million or 5% and adjusted non-interest expense of $881 million increased $45 million or 5%
mainly due to higher employee-related expenses and technology investments, partially offset by the impact of the weaker U.S. dollar and a non-core
divestiture.
Assets under management increased $34 billion or 8% from a year ago to $436 billion, mainly driven by market appreciation. Assets under
administration decreased $84 billion or 18% from a year ago to $380 billion, largely driven by the impact of a non-core divestiture as well as
unfavourable foreign exchange movements, partially offset by market appreciation and growth in client assets. Year-over-year loans and deposits
grew by 9% and 6%, respectively, as we continue to diversify our product mix.
Q1 2018 vs Q4 2017 Reported net income was $266 million compared to $175 million in the prior quarter and adjusted net income was $276 million compared to
$189 million. Traditional wealth reported net income was $184 million compared to $192 million in the prior quarter and adjusted net income was
$194 million compared to $206 million in the prior quarter. Business growth was more than offset by stock-based compensation for employees eligible
to retire that is expensed in the first quarter of each year. Insurance net income was $82 million compared to a net loss of $17 million in the prior
quarter primarily due to elevated reinsurance claims in the prior quarter of $112 million.
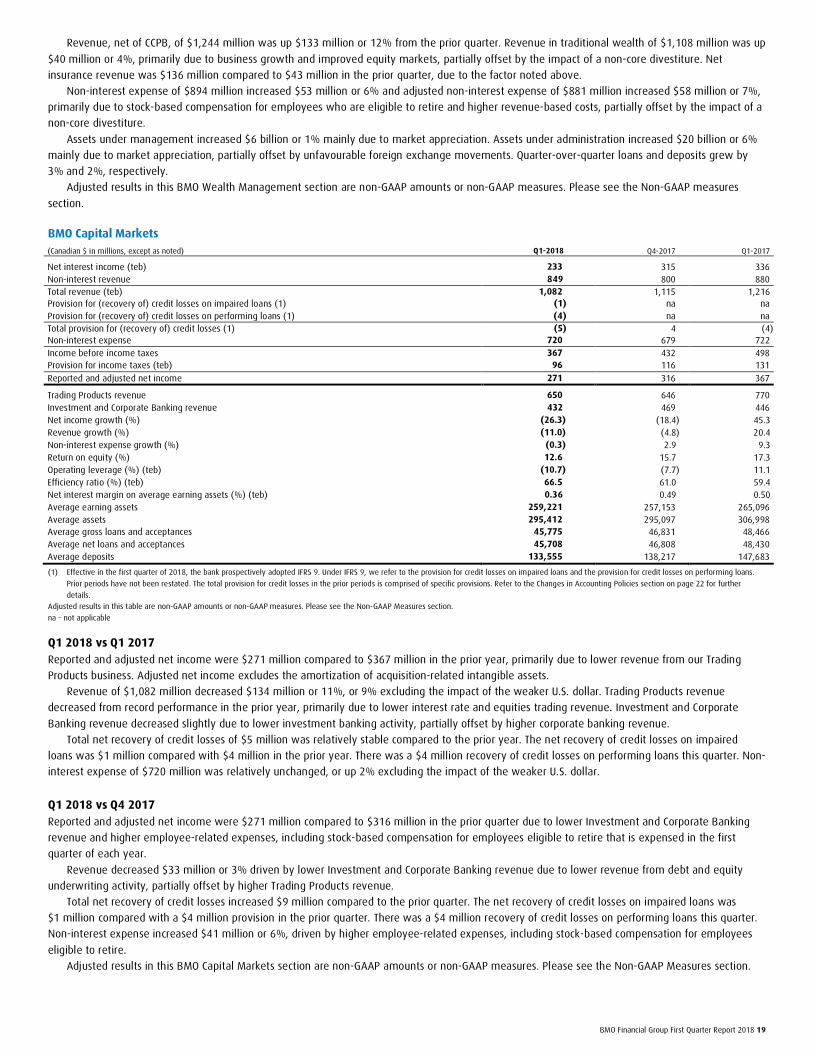
BMO Financial Group First Quarter Report 2018 19
Revenue, net of CCPB, of $1,244 million was up $133 million or 12% from the prior quarter. Revenue in traditional wealth of $1,108 million was up
$40 million or 4%, primarily due to business growth and improved equity markets, partially offset by the impact of a non-core divestiture. Net
insurance revenue was $136 million compared to $43 million in the prior quarter, due to the factor noted above.
Non-interest expense of $894 million increased $53 million or 6% and adjusted non-interest expense of $881 million increased $58 million or 7%,
primarily due to stock-based compensation for employees who are eligible to retire and higher revenue-based costs, partially offset by the impact of a
non-core divestiture.
Assets under management increased $6 billion or 1% mainly due to market appreciation. Assets under administration increased $20 billion or 6%
mainly due to market appreciation, partially offset by unfavourable foreign exchange movements. Quarter-over-quarter loans and deposits grew by
3% and 2%, respectively.
Adjusted results in this BMO Wealth Management section are non-GAAP amounts or non-GAAP measures. Please see the Non-GAAP measures
section.
BMO Capital Markets
(Canadian $ in millions, except as noted) Q1-2018 Q4-2017 Q1-2017
Net interest income (teb) 233 315 336 Non-interest revenue 849 800 880 Total revenue (teb) 1,082 1,115 1,216 Provision for (recovery of) credit losses on impaired loans (1) (1) na na Provision for (recovery of) credit losses on performing loans (1) (4) na na Total provision for (recovery of) credit losses (1) (5) 4 (4) Non-interest expense 720 679 722 Income before income taxes 367 432 498 Provision for income taxes (teb) 96 116 131
Reported and adjusted net income 271 316 367
Trading Products revenue 650 646 770 Investment and Corporate Banking revenue 432 469 446 Net income growth (%) (26.3) (18.4) 45.3 Revenue growth (%) (11.0) (4.8) 20.4 Non-interest expense growth (%) (0.3) 2.9 9.3 Return on equity (%) 12.6 15.7 17.3 Operating leverage (%) (teb) (10.7) (7.7) 11.1 Efficiency ratio (%) (teb) 66.5 61.0 59.4 Net interest margin on average earning assets (%) (teb) 0.36 0.49 0.50 Average earning assets 259,221 257,153 265,096 Average assets 295,412 295,097 306,998 Average gross loans and acceptances 45,775 46,831 48,466 Average net loans and acceptances 45,708 46,808 48,430 Average deposits 133,555 138,217 147,683
(1) Effective in the first quarter of 2018, the bank prospectively adopted IFRS 9. Under IFRS 9, we refer to the provision for credit losses on impaired loans and the provision for credit losses on performing loans.
Prior periods have not been restated. The total provision for credit losses in the prior periods is comprised of specific provisions. Refer to the Changes in Accounting Policies section on page 22 for further
details. Adjusted results in this table are non-GAAP amounts or non-GAAP measures. Please see the Non-GAAP Measures section.
na – not applicable
Q1 2018 vs Q1 2017 Reported and adjusted net income were $271 million compared to $367 million in the prior year, primarily due to lower revenue from our Trading
Products business. Adjusted net income excludes the amortization of acquisition-related intangible assets.
Revenue of $1,082 million decreased $134 million or 11%, or 9% excluding the impact of the weaker U.S. dollar. Trading Products revenue
decreased from record performance in the prior year, primarily due to lower interest rate and equities trading revenue. Investment and Corporate
Banking revenue decreased slightly due to lower investment banking activity, partially offset by higher corporate banking revenue.
Total net recovery of credit losses of $5 million was relatively stable compared to the prior year. The net recovery of credit losses on impaired
loans was $1 million compared with $4 million in the prior year. There was a $4 million recovery of credit losses on performing loans this quarter. Non-
interest expense of $720 million was relatively unchanged, or up 2% excluding the impact of the weaker U.S. dollar.
Q1 2018 vs Q4 2017 Reported and adjusted net income were $271 million compared to $316 million in the prior quarter due to lower Investment and Corporate Banking
revenue and higher employee-related expenses, including stock-based compensation for employees eligible to retire that is expensed in the first
quarter of each year.
Revenue decreased $33 million or 3% driven by lower Investment and Corporate Banking revenue due to lower revenue from debt and equity
underwriting activity, partially offset by higher Trading Products revenue.
Total net recovery of credit losses increased $9 million compared to the prior quarter. The net recovery of credit losses on impaired loans was
$1 million compared with a $4 million provision in the prior quarter. There was a $4 million recovery of credit losses on performing loans this quarter.
Non-interest expense increased $41 million or 6%, driven by higher employee-related expenses, including stock-based compensation for employees
eligible to retire.
Adjusted results in this BMO Capital Markets section are non-GAAP amounts or non-GAAP measures. Please see the Non-GAAP Measures section.
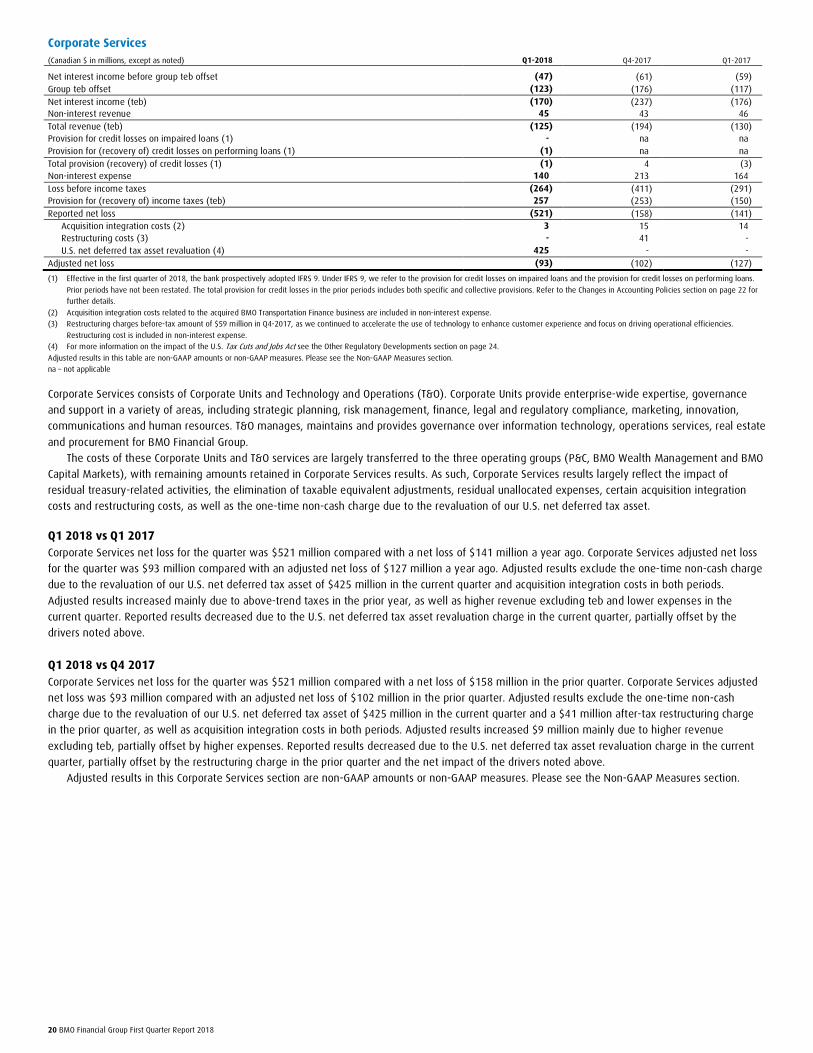
20 BMO Financial Group First Quarter Report 2018
Corporate Services
(Canadian $ in millions, except as noted) Q1-2018 Q4-2017 Q1-2017
Net interest income before group teb offset (47) (61) (59) Group teb offset (123) (176) (117) Net interest income (teb) (170) (237) (176) Non-interest revenue 45 43 46 Total revenue (teb) (125) (194) (130) Provision for credit losses on impaired loans (1) - na na Provision for (recovery of) credit losses on performing loans (1) (1) na na Total provision (recovery) of credit losses (1) (1) 4 (3) Non-interest expense 140 213 164 Loss before income taxes (264) (411) (291) Provision for (recovery of) income taxes (teb) 257 (253) (150) Reported net loss (521) (158) (141)
Acquisition integration costs (2) 3 15 14 Restructuring costs (3) - 41 - U.S. net deferred tax asset revaluation (4) 425 - -
Adjusted net loss (93) (102) (127)
(1) Effective in the first quarter of 2018, the bank prospectively adopted IFRS 9. Under IFRS 9, we refer to the provision for credit losses on impaired loans and the provision for credit losses on performing loans.
Prior periods have not been restated. The total provision for credit losses in the prior periods includes both specific and collective provisions. Refer to the Changes in Accounting Policies section on page 22 for further details.
(2) Acquisition integration costs related to the acquired BMO Transportation Finance business are included in non-interest expense. (3) Restructuring charges before-tax amount of $59 million in Q4-2017, as we continued to accelerate the use of technology to enhance customer experience and focus on driving operational efficiencies.
Restructuring cost is included in non-interest expense. (4) For more information on the impact of the U.S. Tax Cuts and Jobs Act see the Other Regulatory Developments section on page 24.
Adjusted results in this table are non-GAAP amounts or non-GAAP measures. Please see the Non-GAAP Measures section. na – not applicable
Corporate Services consists of Corporate Units and Technology and Operations (T&O). Corporate Units provide enterprise-wide expertise, governance
and support in a variety of areas, including strategic planning, risk management, finance, legal and regulatory compliance, marketing, innovation,
communications and human resources. T&O manages, maintains and provides governance over information technology, operations services, real estate
and procurement for BMO Financial Group.
The costs of these Corporate Units and T&O services are largely transferred to the three operating groups (P&C, BMO Wealth Management and BMO
Capital Markets), with remaining amounts retained in Corporate Services results. As such, Corporate Services results largely reflect the impact of
residual treasury-related activities, the elimination of taxable equivalent adjustments, residual unallocated expenses, certain acquisition integration
costs and restructuring costs, as well as the one-time non-cash charge due to the revaluation of our U.S. net deferred tax asset.
Q1 2018 vs Q1 2017 Corporate Services net loss for the quarter was $521 million compared with a net loss of $141 million a year ago. Corporate Services adjusted net loss
for the quarter was $93 million compared with an adjusted net loss of $127 million a year ago. Adjusted results exclude the one-time non-cash charge
due to the revaluation of our U.S. net deferred tax asset of $425 million in the current quarter and acquisition integration costs in both periods.
Adjusted results increased mainly due to above-trend taxes in the prior year, as well as higher revenue excluding teb and lower expenses in the
current quarter. Reported results decreased due to the U.S. net deferred tax asset revaluation charge in the current quarter, partially offset by the
drivers noted above.
Q1 2018 vs Q4 2017 Corporate Services net loss for the quarter was $521 million compared with a net loss of $158 million in the prior quarter. Corporate Services adjusted
net loss was $93 million compared with an adjusted net loss of $102 million in the prior quarter. Adjusted results exclude the one-time non-cash
charge due to the revaluation of our U.S. net deferred tax asset of $425 million in the current quarter and a $41 million after-tax restructuring charge
in the prior quarter, as well as acquisition integration costs in both periods. Adjusted results increased $9 million mainly due to higher revenue
excluding teb, partially offset by higher expenses. Reported results decreased due to the U.S. net deferred tax asset revaluation charge in the current
quarter, partially offset by the restructuring charge in the prior quarter and the net impact of the drivers noted above.
Adjusted results in this Corporate Services section are non-GAAP amounts or non-GAAP measures. Please see the Non-GAAP Measures section.
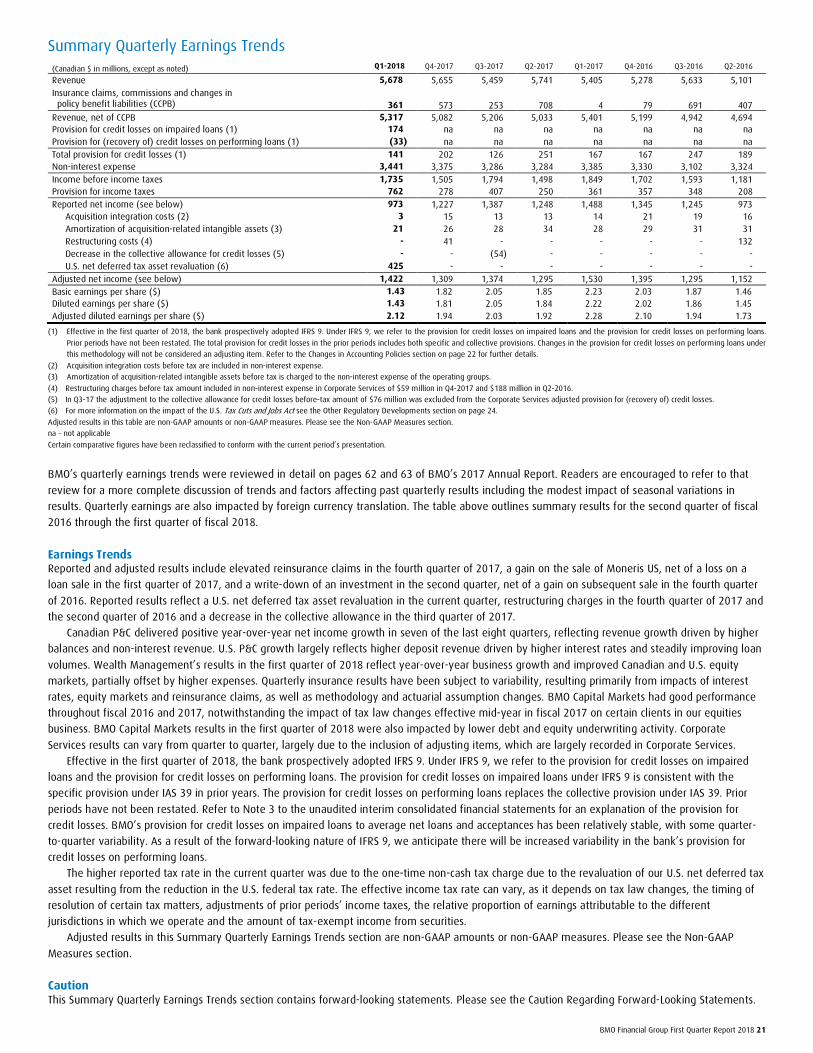
BMO Financial Group First Quarter Report 2018 21
Summary Quarterly Earnings Trends (Canadian $ in millions, except as noted) Q1-2018 Q4-2017 Q3-2017 Q2-2017 Q1-2017 Q4-2016 Q3-2016 Q2-2016
Revenue 5,678 5,655 5,459 5,741 5,405 5,278 5,633 5,101 Insurance claims, commissions and changes in policy benefit liabilities (CCPB) 361 573 253 708 4 79 691 407 Revenue, net of CCPB 5,317 5,082 5,206 5,033 5,401 5,199 4,942 4,694 Provision for credit losses on impaired loans (1) 174 na na na na na na na Provision for (recovery of) credit losses on performing loans (1) (33) na na na na na na na Total provision for credit losses (1) 141 202 126 251 167 167 247 189 Non-interest expense 3,441 3,375 3,286 3,284 3,385 3,330 3,102 3,324 Income before income taxes 1,735 1,505 1,794 1,498 1,849 1,702 1,593 1,181 Provision for income taxes 762 278 407 250 361 357 348 208 Reported net income (see below) 973 1,227 1,387 1,248 1,488 1,345 1,245 973
Acquisition integration costs (2) 3 15 13 13 14 21 19 16 Amortization of acquisition-related intangible assets (3) 21 26 28 34 28 29 31 31 Restructuring costs (4) - 41 - - - - - 132 Decrease in the collective allowance for credit losses (5) - - (54) - - - - - U.S. net deferred tax asset revaluation (6) 425 - - - - - - -
Adjusted net income (see below) 1,422 1,309 1,374 1,295 1,530 1,395 1,295 1,152 Basic earnings per share ($) 1.43 1.82 2.05 1.85 2.23 2.03 1.87 1.46 Diluted earnings per share ($) 1.43 1.81 2.05 1.84 2.22 2.02 1.86 1.45 Adjusted diluted earnings per share ($) 2.12 1.94 2.03 1.92 2.28 2.10 1.94 1.73
(1) Effective in the first quarter of 2018, the bank prospectively adopted IFRS 9. Under IFRS 9, we refer to the provision for credit losses on impaired loans and the provision for credit losses on performing loans.
Prior periods have not been restated. The total provision for credit losses in the prior periods includes both specific and collective provisions. Changes in the provision for credit losses on performing loans under this methodology will not be considered an adjusting item. Refer to the Changes in Accounting Policies section on page 22 for further details.
(2) Acquisition integration costs before tax are included in non-interest expense. (3) Amortization of acquisition-related intangible assets before tax is charged to the non-interest expense of the operating groups.
(4) Restructuring charges before tax amount included in non-interest expense in Corporate Services of $59 million in Q4-2017 and $188 million in Q2-2016. (5) In Q3-17 the adjustment to the collective allowance for credit losses before-tax amount of $76 million was excluded from the Corporate Services adjusted provision for (recovery of) credit losses. (6) For more information on the impact of the U.S. Tax Cuts and Jobs Act see the Other Regulatory Developments section on page 24.
Adjusted results in this table are non-GAAP amounts or non-GAAP measures. Please see the Non-GAAP Measures section. na – not applicable
Certain comparative figures have been reclassified to conform with the current period’s presentation.
BMO’s quarterly earnings trends were reviewed in detail on pages 62 and 63 of BMO’s 2017 Annual Report. Readers are encouraged to refer to that
review for a more complete discussion of trends and factors affecting past quarterly results including the modest impact of seasonal variations in
results. Quarterly earnings are also impacted by foreign currency translation. The table above outlines summary results for the second quarter of fiscal
2016 through the first quarter of fiscal 2018.
Earnings Trends Reported and adjusted results include elevated reinsurance claims in the fourth quarter of 2017, a gain on the sale of Moneris US, net of a loss on a
loan sale in the first quarter of 2017, and a write-down of an investment in the second quarter, net of a gain on subsequent sale in the fourth quarter
of 2016. Reported results reflect a U.S. net deferred tax asset revaluation in the current quarter, restructuring charges in the fourth quarter of 2017 and
the second quarter of 2016 and a decrease in the collective allowance in the third quarter of 2017.
Canadian P&C delivered positive year-over-year net income growth in seven of the last eight quarters, reflecting revenue growth driven by higher
balances and non-interest revenue. U.S. P&C growth largely reflects higher deposit revenue driven by higher interest rates and steadily improving loan
volumes. Wealth Management’s results in the first quarter of 2018 reflect year-over-year business growth and improved Canadian and U.S. equity
markets, partially offset by higher expenses. Quarterly insurance results have been subject to variability, resulting primarily from impacts of interest
rates, equity markets and reinsurance claims, as well as methodology and actuarial assumption changes. BMO Capital Markets had good performance
throughout fiscal 2016 and 2017, notwithstanding the impact of tax law changes effective mid-year in fiscal 2017 on certain clients in our equities
business. BMO Capital Markets results in the first quarter of 2018 were also impacted by lower debt and equity underwriting activity. Corporate
Services results can vary from quarter to quarter, largely due to the inclusion of adjusting items, which are largely recorded in Corporate Services.
Effective in the first quarter of 2018, the bank prospectively adopted IFRS 9. Under IFRS 9, we refer to the provision for credit losses on impaired
loans and the provision for credit losses on performing loans. The provision for credit losses on impaired loans under IFRS 9 is consistent with the
specific provision under IAS 39 in prior years. The provision for credit losses on performing loans replaces the collective provision under IAS 39. Prior
periods have not been restated. Refer to Note 3 to the unaudited interim consolidated financial statements for an explanation of the provision for
credit losses. BMO’s provision for credit losses on impaired loans to average net loans and acceptances has been relatively stable, with some quarter-
to-quarter variability. As a result of the forward-looking nature of IFRS 9, we anticipate there will be increased variability in the bank’s provision for
credit losses on performing loans.
The higher reported tax rate in the current quarter was due to the one-time non-cash tax charge due to the revaluation of our U.S. net deferred tax
asset resulting from the reduction in the U.S. federal tax rate. The effective income tax rate can vary, as it depends on tax law changes, the timing of
resolution of certain tax matters, adjustments of prior periods’ income taxes, the relative proportion of earnings attributable to the different
jurisdictions in which we operate and the amount of tax-exempt income from securities.
Adjusted results in this Summary Quarterly Earnings Trends section are non-GAAP amounts or non-GAAP measures. Please see the Non-GAAP
Measures section.
Caution This Summary Quarterly Earnings Trends section contains forward-looking statements. Please see the Caution Regarding Forward-Looking Statements.
22 BMO Financial Group First Quarter Report 2018
Balance Sheet Total assets of $727.9 billion as at January 31, 2018, increased $18.3 billion from October 31, 2017. The weaker U.S. dollar reduced assets by
$14.1 billion, excluding the impact on derivative financial assets.
The following discussion excludes the impact of changes in the U.S. dollar. Cash and cash equivalents and interest bearing deposits with banks
increased $10.5 billion primarily due to higher balances held with central banks. Securities borrowed or purchased under resale agreements increased
$10.0 billion, driven by higher client activity in BMO Capital Markets and Treasury activities. Net loans increased $4.3 billion, driven largely by a
$2.3 billion increase in residential mortgages due to the purchase of a mortgage portfolio in U.S. P&C, and a $2.0 billion increase in business and
government loans mainly due to Canadian commercial loan growth. Securities increased $4.0 billion, reflecting higher balances in both BMO Capital
Markets trading businesses and Treasury activities. All other assets, excluding derivative financial assets, increased $0.9 billion.
Liabilities increased $19.9 billion from October 31, 2017. The weaker U.S. dollar reduced liabilities by $13.5 billion, excluding the impact on
derivative financial liabilities.
The following discussion excludes the impact of changes in the U.S. dollar. Securities lent or sold under repurchase agreements increased
$18.7 billion due to higher client activity in BMO Capital Markets. Deposits increased $6.7 billion across all operating groups, reflecting higher levels of
customer and wholesale deposits, with a $3.4 billion increase in business and government deposits, a $1.9 billion increase in deposits by individuals
and a $1.3 billion increase in deposits with banks. Securities sold but not yet purchased increased $1.6 billion. Subordinated debt increased
$1.4 billion due to a new issuance in the quarter. All other liabilities, excluding derivative financial liabilities, increased $1.8 billion.
Derivative financial assets increased $2.8 billion and derivative financial liabilities increased $3.3 billion, including the impact of changes in the U.S.
dollar. Growth was driven by an increase in the fair value of foreign exchange and commodity contracts, partially offset by a decrease in the fair value
of interest rate contracts.
Total equity decreased $1.5 billion from October 31, 2017, due to a $1.7 billion decrease in accumulated other comprehensive income, partially
offset by a $0.2 billion increase in retained earnings. Accumulated other comprehensive income on translation of net foreign operations decreased
$1.0 billion primarily due to the impact of the weaker U.S. dollar, net of hedging impacts. Accumulated other comprehensive income on cash flow
hedges decreased $0.6 billion primarily due to the impact of higher interest rates in the quarter.
Contractual obligations by year of maturity are outlined in Note 14 to the unaudited interim consolidated financial statements.
Transactions with Related Parties In the ordinary course of business, we provide banking services to our key management personnel on the same terms that we offer to our preferred
customers for those services. Key management personnel are defined as those persons having authority and responsibility for planning, directing
and/or controlling the activities of an entity, being the directors and most senior executives of the bank. We provide banking services to our joint
ventures and equity-accounted investees on the same terms offered to our customers for these services.
The bank’s policies and procedures for related party transactions did not materially change from October 31, 2017, as described in Note 28 to the
audited consolidated financial statements on page 198 of BMO’s 2017 Annual Report.
Off-Balance Sheet Arrangements BMO enters into a number of off-balance sheet arrangements in the normal course of operations. The most significant of these are Credit Instruments,
Structured Entities and Guarantees, which are described on page 77 of BMO’s 2017 Annual Report. We consolidate all of our Structured Entities, except
for our Canadian customer securitization vehicles, structured finance vehicles, certain capital and funding vehicles and various BMO managed and non-
managed investment funds. There have been no changes of substance during the quarter ended January 31, 2018.
Accounting Policies and Critical Accounting Estimates Significant accounting policies are described in our 2017 annual MD&A and in the notes to our audited consolidated financial statements for the year
ended October 31, 2017 and in Note 1 to the unaudited interim consolidated financial statements, together with a discussion of certain accounting
estimates that are considered particularly important as they require management to make significant judgments, some of which relate to matters that
are inherently uncertain. Readers are encouraged to review that discussion on pages 113 to 115 and 144 to 147 in BMO’s 2017 Annual Report.
Changes in Accounting Policies Effective November 1, 2017, we prospectively adopted IFRS 9 Financial Instruments (IFRS 9), which addressed impairment, classification and
measurement, and hedge accounting.
Impairment IFRS 9 introduces a new single expected credit loss (ECL) impairment model for all financial assets and certain off-balance sheet loan commitments and
guarantees. The ECL model will result in an allowance for credit losses being recorded on financial assets regardless of whether there has been an
actual loss event. This differs from our previous approach where the allowance recorded on performing loans is designed to capture only losses that
have been incurred whether or not they have been specifically identified.
BMO Financial Group First Quarter Report 2018 23
Classification and Measurement IFRS 9 requires that we classify debt instruments based on our business model for managing the assets and the contractual cash flow characteristics of
the asset. Equity instruments are measured at fair value through profit and loss unless we elect to measure at fair value through other comprehensive
income.
Hedge Accounting IFRS 9 introduces a new hedge accounting model that expands the scope of hedged items and risks eligible for hedge accounting and aligns hedge
accounting more closely with risk management. The new model no longer specifies quantitative measures for effectiveness testing and does not
permit hedge de-designation. Consistent with a policy choice allowed in IFRS 9 we have elected to continue to apply the existing hedge accounting
rules.
Notes 1 and 15 to the unaudited interim consolidated financial statements provide detail on the impact of the new standard.
Future Changes in Accounting Policies BMO monitors the potential changes proposed by the International Accounting Standards Board (IASB), and analyzes the effect that changes in the
standards may have on BMO’s financial reporting and accounting policies. New standards and amendments to existing standards, which are effective
for the bank in the future, can be found on pages 116 to 117 and in Note 1 to the audited annual consolidated financial statements on pages 147 to
148 of BMO’s 2017 Annual Report, and in Note 1 to the unaudited interim consolidated financial statements.
Select Financial Instruments The Financial Stability Board (FSB) issued a report in 2012 encouraging enhanced disclosure related to financial instruments that market participants
had come to regard as carrying higher risk. An index of where the disclosures recommended by the Enhanced Disclosure Task Force (EDTF) of the FSB
are located is provided on our website at www.bmo.com/investorrelations.
We follow a practice of reporting on significant changes in select financial instruments since year end, if any, in our interim MD&A. There have
been no changes of substance in the disclosure on pages 76 to 77 in our 2017 Annual Report.
Disclosure for Domestic Systemically Important Banks (D-SIBs) In March 2013, OSFI issued guidance designating the six largest Canadian banks, including BMO, as domestic systemically important banks.
As a D-SIB, OSFI requires that we disclose on an annual basis the 12 indicators utilized in the G-SIBs assessment methodology. These indicators
measure the impact a bank’s failure would have on the global financial system and wider economy. The indicators reflect the size of banks, their
interconnectedness, the lack of alternative infrastructure for services banks provide, their global activity and complexity. The methodology is outlined
in the July 2013 paper, Global systemically important banks: updated assessment methodology and the higher loss absorbency requirement, issued by
the BCBS. As required under the methodology, the indicators are calculated based on specific instructions issued by the BCBS; and as a result, the
measures used may not be based on the most recent version of Basel III. Therefore values may not be consistent with other measures used in this
report.
Indicator values have been reported based on regulatory requirements for consolidation and therefore insurance and other non-banking
information is only included insofar as it is included in the regulatory consolidation of the group. This level of consolidation differs from that used in the
consolidated financial statements. Therefore, results may not be comparable to other disclosures in this report.
Payments activity decreased due to lower levels of activity. Other year-over-year movements reflect normal changes in business activity.
Disclosure for Domestic Systemically Important Banks (D-SIBs) (Canadian $ in millions)
As at October 31
Section Indicators 2017 2016
A. Cross-jurisdictional activity 1. Cross-jurisdictional claims 307,717 291,485
2. Cross-jurisdictional liabilities 249,228 262,884
B. Size 3. Total exposures as defined for use in the Basel III leverage ratio 794,985 762,779
C. Interconnectedness 4. Intra-financial system assets 134,581 120,153
5. Intra-financial system liabilities 68,066 64,217
6. Securities outstanding 238,318 210,910
D. Substitutability / financial institution infrastructure 7. Payments activity (1) 23,722,831 28,158,089
8. Assets under custody 178,020 184,887
9. Underwritten transactions in debt and equity markets 68,690 49,176
E. Complexity 10. Notional amount of over-the-counter (OTC) derivatives 4,536,610 4,259,557
11. Trading and available-for-sale securities (2) 46,283 29,775
12. Level 3 assets 1,778 1,872
(1) Includes intercompany transactions that are cleared through a correspondent bank.
(2) Prior period has been restated to exclude insurance balances.

24 BMO Financial Group First Quarter Report 2018
Other Regulatory Developments On December 22, 2017, the U.S. Tax Cuts and Jobs Act (the Act) was signed into law in the United States. Consequently, effective January 1, 2018, the
U.S. federal corporate tax rate was reduced from 35% to 21%. The tax rate change resulted in a one-time non-cash charge to our net income due to
the revaluation of our U.S. net deferred tax asset to the lower tax rate. The charge included estimates for certain income tax effects and may be
updated in the future. Going forward, there is expected to be a benefit from the lower tax rate on BMO’s future U.S. earnings. We will continue to
monitor further guidance related to the Act, including the base broadening measures and possible state tax proposals, for their possible impact on
BMO.
We continue to monitor and prepare for regulatory developments, including those referenced elsewhere in this Report to Shareholders.
For a comprehensive discussion of regulatory developments, see the Enterprise-Wide Capital Management section starting on page 69, the Risks
that May Affect Future Results section starting on page 79, the Liquidity and Funding Risk section starting on page 99, and the Legal and Regulatory
Risk section starting on page 109 of BMO’s 2017 Annual Report.
This Other Regulatory Developments section contains forward-looking statements. Please see the Caution Regarding Forward-Looking Statements.
BMO Financial Group First Quarter Report 2018 25
Risk Management Our risk management policies and processes to measure, monitor and control credit and counterparty, market, insurance, liquidity and funding,
operational, model, legal and regulatory, business, strategic, environmental and social and reputation risk have not changed significantly from those
outlined in the Enterprise-Wide Risk Management section on pages 78 to 112 of BMO’s 2017 annual MD&A.
Market Risk BMO’s market risk management practices and key measures are outlined on pages 94 to 98 of BMO’s 2017 Annual Report.
Linkages between Balance Sheet Items and Market Risk Disclosures The table below presents items reported in our Consolidated Balance Sheet that are subject to market risk, comprised of balances that are subject to
either traded risk or non-traded risk measurement techniques.
Linkages Between Balance Sheet Items and Market Risk Disclosures As at January 31, 2018 As at October 31, 2017
Consolidated
Balance Sheet
Subject to market risk Not subject
to market risk
Consolidated
Balance Sheet
Subject to market risk Not subject
to market risk
Main risk factors for non-traded risk balances (Canadian $ in millions)
Traded risk (1)
Non-traded risk (2)
Traded risk (1)
Non-traded risk (2)
Assets Subject to Market Risk Cash and cash equivalents 41,159 - 41,159 - 32,599 - 32,599 - Interest rate Interest bearing deposits with banks 6,740 226 6,514 - 6,490 346 6,144 - Interest rate Securities 163,551 93,237 70,314 - 163,198 90,449 72,749 - Interest rate, credit spread, equity
Securities borrowed or purchased under resale agreements 83,194 - 83,194 - 75,047 - 75,047 - Interest rate
Loans (net of allowance for credit losses) 356,662 - 356,662 - 358,507 - 358,507 - Interest rate, foreign exchange Derivative instruments 31,756 28,715 3,041 - 28,951 27,359 1,592 - Interest rate, foreign exchange
Customer's liabilities under acceptances 16,705 - 16,705 - 16,546 - 16,546 - Interest rate Other assets 28,142 - 12,965 15,177 28,242 - 12,927 15,315 Interest rate
Total Assets 727,909 122,178 590,554 15,177 709,580 118,154 576,111 15,315
Liabilities Subject to Market Risk Deposits 475,565 13,076 462,489 - 479,792 13,674 466,118 - Interest rate, foreign exchange Derivative instruments 31,079 29,239 1,840 - 27,804 26,122 1,682 - Interest rate, foreign exchange Acceptances 16,705 - 16,705 - 16,546 - 16,546 - Interest rate
Securities sold but not yet purchased 26,367 26,367 - - 25,163 25,163 - -
Securities lent or sold under repurchase agreements 72,260 - 72,260 - 55,119 - 55,119 - Interest rate Other liabilities 56,642 - 56,384 258 55,773 - 55,415 358 Interest rate Subordinated debt 6,463 - 6,463 - 5,029 - 5,029 - Interest rate
Total Liabilities 685,081 68,682 616,141 258 665,226 64,959 599,909 358
(1) Primarily comprised of balance sheet items that are subject to the trading and underwriting risk management framework and fair valued through profit or loss.
(2) Primarily comprised of balance sheet items that are subject to the structural balance sheet and insurance risk management framework. Certain comparative figures have been reclassified to conform with the current period’s presentation.
Trading and Underwriting Market Risk The Average Total Trading Value at Risk (VaR) and Average Trading Stressed VaR were marginally higher from the prior quarter due to increases in
equity and foreign exchange exposures, which were partially offset by a reduction in credit exposures. The decrease year over year in Average Total
Trading VaR stemmed from reduced interest rate exposure and market volatility, while the Average Total Trading Stressed VaR rose marginally as a
result of a methodology change in 2017 relating to market risk associated with the valuation of uncollateralized derivatives.
Total Trading Value at Risk (VaR) and Trading Stressed Value at Risk (SVaR) Summary (1)(2)
For the quarter ended January 31, 2018 October 31, 2017 January 31, 2017
(Pre-tax Canadian $ equivalent in millions) Quarter-end Average High Low Average Average
Commodity VaR 0.3 0.5 1.1 0.3 0.7 1.1 Equity VaR 3.5 3.6 5.0 3.0 2.9 3.5 Foreign exchange VaR 0.4 0.8 2.2 0.1 0.4 1.2 Interest rate VaR 6.0 5.2 7.4 3.6 5.3 8.9 Credit VaR 1.7 1.8 2.3 1.5 2.4 2.2 Diversification (5.5) (6.1) nm nm (6.2) (8.6)
Total Trading VaR 6.4 5.8 7.5 4.7 5.5 8.3
Total Trading SVaR 22.9 23.0 24.3 20.0 21.4 22.1
(1) One-day measure using a 99% confidence interval. Benefits are presented in brackets and losses are presented as positive numbers. (2) Stressed VaR is produced weekly and at month end.
nm - not meaningful
26 BMO Financial Group First Quarter Report 2018
Structural (Non-Trading) Market Risk Structural economic value exposure to rising interest rates increased relative to October 31, 2017 primarily owing to modelled deposit pricing being
more rate-sensitive at higher interest rate levels following the increase in market rates in the first quarter of 2018. Structural economic value benefit
to falling interest rates increased relative to October 31, 2017 due to the greater extent to which customer deposit rates can now fall. Structural
earnings benefit to rising interest rates decreased relative to October 31, 2017 primarily owing to a lower modelled benefit to subsequent interest rate
increases over the next 12 months following the increase in market rates in the quarter. Structural earnings exposure to falling interest rates decreased
relative to October 31, 2017 primarily owing to the increased extent to which certain deposits can reprice lower following the increase in market rates
in the quarter.
Structural Balance Sheet Earnings and Value Sensitivity to Changes in Interest Rates (1) (2)
Economic value sensitivity (Pre-tax) Earnings sensitivity over the next 12 months (Pre-tax)
(Canadian $ equivalent in millions) January 31, 2018 October 31, 2017 January 31, 2017 January 31, 2018 October 31, 2017 January 31, 2017
100 basis point increase (1,111.7) (957.8) (959.8) 73.1 136.9 162.6 100 basis point decrease 467.4 78.6 280.4 (315.3) (433.4) (292.2)
(1) Losses are in brackets and benefits are presented as positive numbers.
(2) For BMO’s Insurance businesses, a 100 basis point increase in interest rates at January 31, 2018, results in an increase in earnings before tax of $53 million and an increase in economic value before tax of $425 million ($52 million and $417 million, respectively, at October 31, 2017; $77 million and $503 million, respectively, at January 31, 2017). A 100 basis point decrease in interest rates at January 31, 2018,
results in a decrease in earnings before tax of $51 million and a decrease in economic value before tax of $516 million ($50 million and $507 million, respectively, at October 31, 2017; $76 million and $601 million, respectively, at January 31, 2017). Insurance earnings are also affected by changes in equity markets. These impacts are not reflected in the table above.
Liquidity and Funding Risk Liquidity and funding risk is managed under a robust risk management framework. There were no material changes in the framework during the
quarter.
BMO’s liquid assets are primarily held in our trading businesses, as well as in supplemental liquidity pools that are maintained for contingent
liquidity risk management purposes. Liquid assets include unencumbered, high-quality assets that are marketable, can be pledged as security for
borrowings, and can be converted to cash in a time frame that meets our liquidity and funding requirements. BMO’s liquid assets are summarized in
the table below.
In the ordinary course of business, BMO may encumber a portion of cash and securities holdings as collateral in support of trading activities and our
participation in clearing and payment systems in Canada and abroad. In addition, BMO may receive liquid assets as collateral and may re-pledge these
assets in exchange for cash or as collateral in support of trading activities. Net unencumbered liquid assets, defined as on-balance sheet assets such as
BMO-owned cash and securities and securities borrowed or purchased under resale agreements, plus other off-balance sheet eligible collateral
received, less collateral encumbered, totalled $213.5 billion at January 31, 2018, compared with $213.8 billion at October 31, 2017. The unencumbered
liquid assets in the first quarter of 2018 are relatively unchanged compared to the fourth quarter of 2017. Net unencumbered liquid assets are
primarily held at the parent bank level, at BMO Harris Bank, our U.S. bank entity, and in our broker/dealer operations. In addition to liquid assets, BMO
has access to the Bank of Canada’s lending assistance programs, the Federal Reserve Bank discount window in the United States and European Central
Bank standby liquidity facilities. We do not rely on central bank facilities as a source of available liquidity when assessing the strength of BMO’s
liquidity position.
In addition to cash and securities holdings, BMO may also pledge other assets, including mortgages and loans, to raise long-term secured funding.
The Asset Encumbrance table on page 27 provides a summary of total encumbered and unencumbered assets.
Liquid Assets
As at January 31, 2018 As at October 31, 2017
(Canadian $ in millions)
Carrying value/on balance sheet
assets (1)
Other cash & securities received
Total gross assets (2)
Encumbered assets
Net unencumbered
assets (3)
Net unencumbered
assets (3)
Cash and cash equivalents 41,159 - 41,159 1,430 39,729 31,164 Deposits with other banks 6,740 - 6,740 - 6,740 6,490 Securities and securities borrowed or purchased under resale agreements
Sovereigns / Central banks / Multilateral development banks 138,045 24,303 162,348 107,406 54,942 59,414 Mortgage-backed securities and collateralized mortgage obligations 21,362 399 21,761 4,989 16,772 18,765 Corporate debt 19,165 7,951 27,116 4,475 22,641 22,368 Corporate equity 68,173 19,826 87,999 40,294 47,705 52,616
Total securities and securities borrowed or purchased under resale agreements 246,745 52,479 299,224 157,164 142,060 153,163 NHA mortgage-backed securities (reported as loans at amortized cost) (4) 27,692 - 27,692 2,738 24,954 22,940
Total liquid assets 322,336 52,479 374,815 161,332 213,483 213,757 Other eligible assets at central banks (not included above) (5) 65,127 - 65,127 427 64,700 64,776 Undrawn credit lines granted by central banks - - - - - - Total liquid assets and other sources 387,463 52,479 439,942 161,759 278,183 278,533
(1) The carrying values outlined in this table are consistent with the carrying values reported in BMO’s balance sheet as at January 31, 2018.
(2) Gross assets include on-balance sheet and off-balance sheet assets. (3) Net unencumbered liquid assets are defined as on-balance sheet assets, such as BMO-owned cash and securities and securities borrowed or purchased under resale agreements, plus other off-balance sheet
eligible collateral received, less encumbered assets. (4) Under IFRS, NHA mortgage-backed securities that include mortgages owned by BMO as the underlying collateral are classified as loans. Unencumbered NHA mortgage-backed securities have liquidity value and
are included as liquid assets under BMO’s Liquidity and Funding Management Framework. This amount is shown as a separate line item, NHA mortgage-backed securities.
(5) Represents loans currently lodged at central banks that could potentially be used to access central bank funding. Loans available for pledging as collateral do not include other sources of additional liquidity that may be realized from the loan portfolio, including incremental securitization, covered bond issuances and Federal Home Loan Bank (FHLB) advances.
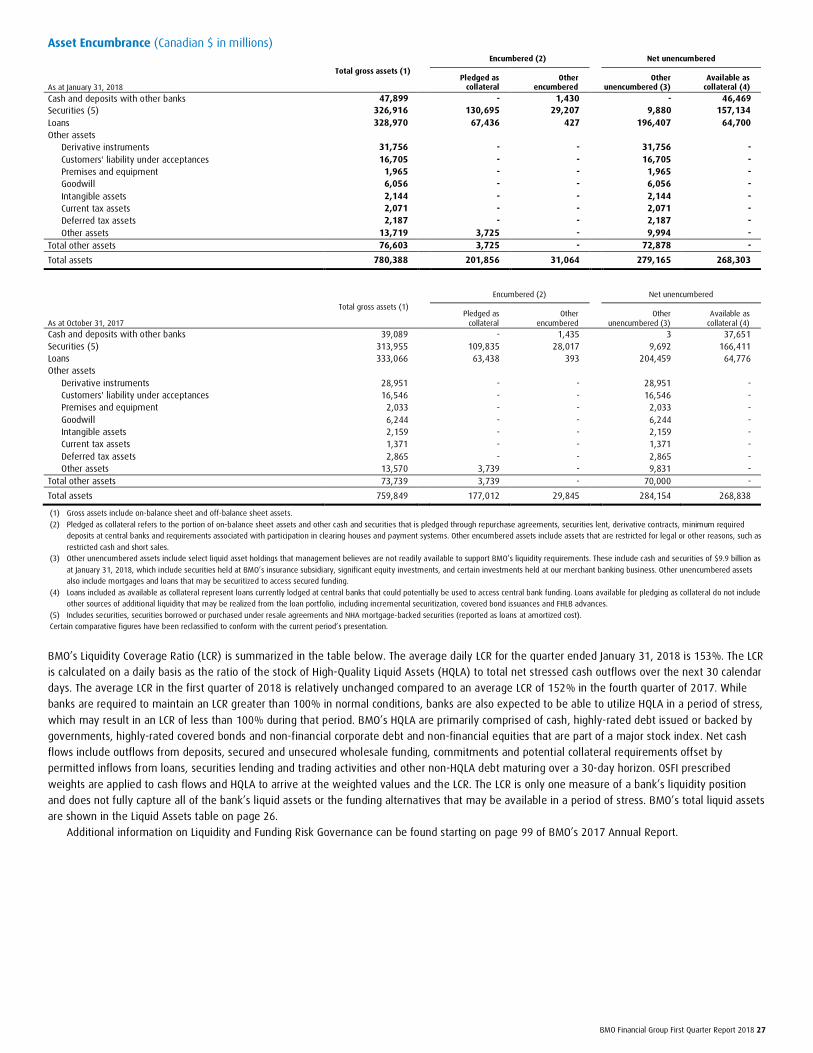
BMO Financial Group First Quarter Report 2018 27
Asset Encumbrance (Canadian $ in millions)
Total gross assets (1)
Encumbered (2) Net unencumbered
As at January 31, 2018 Pledged as
collateral Other
encumbered Other
unencumbered (3) Available as
collateral (4)
Cash and deposits with other banks 47,899 - 1,430 - 46,469 Securities (5) 326,916 130,695 29,207 9,880 157,134 Loans 328,970 67,436 427 196,407 64,700 Other assets
Derivative instruments 31,756 - - 31,756 - Customers' liability under acceptances 16,705 - - 16,705 - Premises and equipment 1,965 - - 1,965 - Goodwill 6,056 - - 6,056 - Intangible assets 2,144 - - 2,144 - Current tax assets 2,071 - - 2,071 - Deferred tax assets 2,187 - - 2,187 - Other assets 13,719 3,725 - 9,994 -
Total other assets 76,603 3,725 - 72,878 -
Total assets 780,388 201,856 31,064 279,165 268,303
Total gross assets (1)
Encumbered (2) Net unencumbered
As at October 31, 2017 Pledged as
collateral Other
encumbered Other
unencumbered (3) Available as
collateral (4)
Cash and deposits with other banks 39,089 - 1,435 3 37,651 Securities (5) 313,955 109,835 28,017 9,692 166,411 Loans 333,066 63,438 393 204,459 64,776 Other assets
Derivative instruments 28,951 - - 28,951 - Customers' liability under acceptances 16,546 - - 16,546 - Premises and equipment 2,033 - - 2,033 - Goodwill 6,244 - - 6,244 - Intangible assets 2,159 - - 2,159 - Current tax assets 1,371 - - 1,371 - Deferred tax assets 2,865 - - 2,865 - Other assets 13,570 3,739 - 9,831 -
Total other assets 73,739 3,739 - 70,000 -
Total assets 759,849 177,012 29,845 284,154 268,838
(1) Gross assets include on-balance sheet and off-balance sheet assets.
(2) Pledged as collateral refers to the portion of on-balance sheet assets and other cash and securities that is pledged through repurchase agreements, securities lent, derivative contracts, minimum required deposits at central banks and requirements associated with participation in clearing houses and payment systems. Other encumbered assets include assets that are restricted for legal or other reasons, such as
restricted cash and short sales. (3) Other unencumbered assets include select liquid asset holdings that management believes are not readily available to support BMO’s liquidity requirements. These include cash and securities of $9.9 billion as
at January 31, 2018, which include securities held at BMO’s insurance subsidiary, significant equity investments, and certain investments held at our merchant banking business. Other unencumbered assets also include mortgages and loans that may be securitized to access secured funding.
(4) Loans included as available as collateral represent loans currently lodged at central banks that could potentially be used to access central bank funding. Loans available for pledging as collateral do not include other sources of additional liquidity that may be realized from the loan portfolio, including incremental securitization, covered bond issuances and FHLB advances.
(5) Includes securities, securities borrowed or purchased under resale agreements and NHA mortgage-backed securities (reported as loans at amortized cost). Certain comparative figures have been reclassified to conform with the current period’s presentation.
BMO’s Liquidity Coverage Ratio (LCR) is summarized in the table below. The average daily LCR for the quarter ended January 31, 2018 is 153%. The LCR
is calculated on a daily basis as the ratio of the stock of High-Quality Liquid Assets (HQLA) to total net stressed cash outflows over the next 30 calendar
days. The average LCR in the first quarter of 2018 is relatively unchanged compared to an average LCR of 152% in the fourth quarter of 2017. While
banks are required to maintain an LCR greater than 100% in normal conditions, banks are also expected to be able to utilize HQLA in a period of stress,
which may result in an LCR of less than 100% during that period. BMO’s HQLA are primarily comprised of cash, highly-rated debt issued or backed by
governments, highly-rated covered bonds and non-financial corporate debt and non-financial equities that are part of a major stock index. Net cash
flows include outflows from deposits, secured and unsecured wholesale funding, commitments and potential collateral requirements offset by
permitted inflows from loans, securities lending and trading activities and other non-HQLA debt maturing over a 30-day horizon. OSFI prescribed
weights are applied to cash flows and HQLA to arrive at the weighted values and the LCR. The LCR is only one measure of a bank’s liquidity position
and does not fully capture all of the bank’s liquid assets or the funding alternatives that may be available in a period of stress. BMO’s total liquid assets
are shown in the Liquid Assets table on page 26.
Additional information on Liquidity and Funding Risk Governance can be found starting on page 99 of BMO’s 2017 Annual Report.
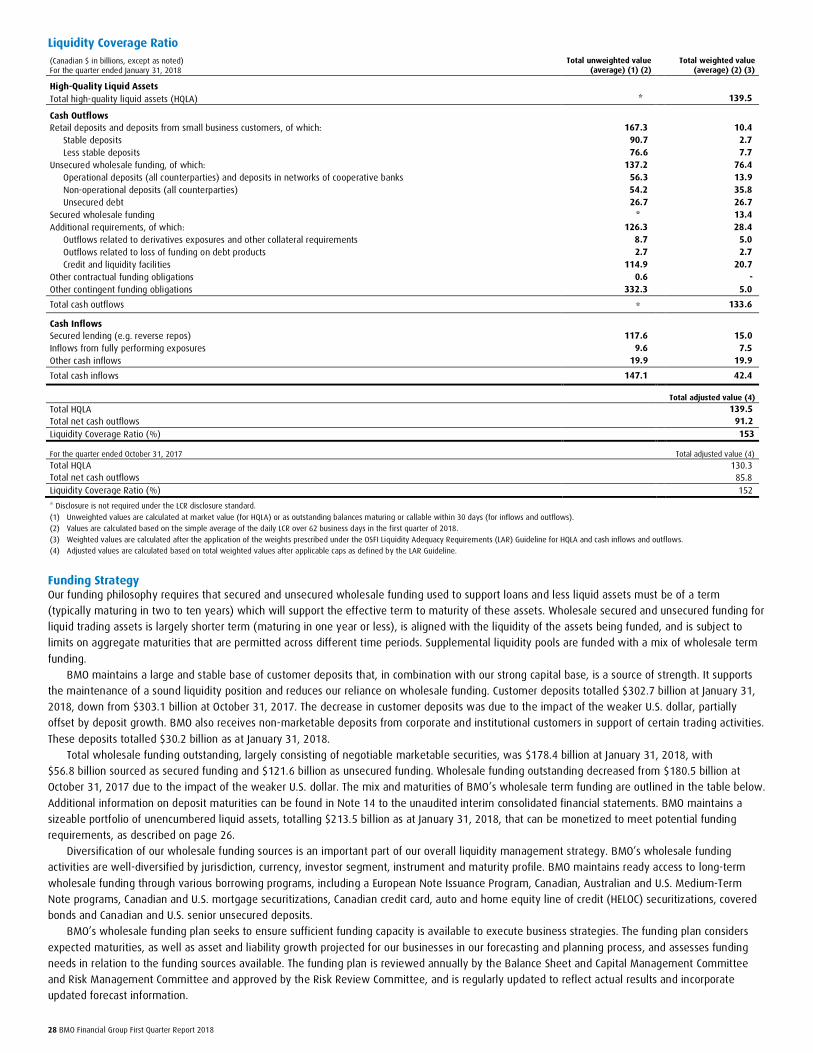
28 BMO Financial Group First Quarter Report 2018
Liquidity Coverage Ratio (Canadian $ in billions, except as noted) For the quarter ended January 31, 2018
Total unweighted value (average) (1) (2)
Total weighted value (average) (2) (3)
High-Quality Liquid Assets Total high-quality liquid assets (HQLA) * 139.5
Cash Outflows Retail deposits and deposits from small business customers, of which: 167.3 10.4
Stable deposits 90.7 2.7 Less stable deposits 76.6 7.7
Unsecured wholesale funding, of which: 137.2 76.4 Operational deposits (all counterparties) and deposits in networks of cooperative banks 56.3 13.9 Non-operational deposits (all counterparties) 54.2 35.8 Unsecured debt 26.7 26.7
Secured wholesale funding * 13.4 Additional requirements, of which: 126.3 28.4
Outflows related to derivatives exposures and other collateral requirements 8.7 5.0 Outflows related to loss of funding on debt products 2.7 2.7 Credit and liquidity facilities 114.9 20.7
Other contractual funding obligations 0.6 - Other contingent funding obligations 332.3 5.0
Total cash outflows * 133.6
Cash Inflows Secured lending (e.g. reverse repos) 117.6 15.0 Inflows from fully performing exposures 9.6 7.5 Other cash inflows 19.9 19.9
Total cash inflows 147.1 42.4
Total adjusted value (4)
Total HQLA 139.5 Total net cash outflows 91.2 Liquidity Coverage Ratio (%) 153
For the quarter ended October 31, 2017 Total adjusted value (4)
Total HQLA 130.3 Total net cash outflows 85.8 Liquidity Coverage Ratio (%) 152
* Disclosure is not required under the LCR disclosure standard.
(1) Unweighted values are calculated at market value (for HQLA) or as outstanding balances maturing or callable within 30 days (for inflows and outflows). (2) Values are calculated based on the simple average of the daily LCR over 62 business days in the first quarter of 2018. (3) Weighted values are calculated after the application of the weights prescribed under the OSFI Liquidity Adequacy Requirements (LAR) Guideline for HQLA and cash inflows and outflows. (4) Adjusted values are calculated based on total weighted values after applicable caps as defined by the LAR Guideline.
Funding Strategy Our funding philosophy requires that secured and unsecured wholesale funding used to support loans and less liquid assets must be of a term
(typically maturing in two to ten years) which will support the effective term to maturity of these assets. Wholesale secured and unsecured funding for
liquid trading assets is largely shorter term (maturing in one year or less), is aligned with the liquidity of the assets being funded, and is subject to
limits on aggregate maturities that are permitted across different time periods. Supplemental liquidity pools are funded with a mix of wholesale term
funding.
BMO maintains a large and stable base of customer deposits that, in combination with our strong capital base, is a source of strength. It supports
the maintenance of a sound liquidity position and reduces our reliance on wholesale funding. Customer deposits totalled $302.7 billion at January 31,
2018, down from $303.1 billion at October 31, 2017. The decrease in customer deposits was due to the impact of the weaker U.S. dollar, partially
offset by deposit growth. BMO also receives non-marketable deposits from corporate and institutional customers in support of certain trading activities.
These deposits totalled $30.2 billion as at January 31, 2018.
Total wholesale funding outstanding, largely consisting of negotiable marketable securities, was $178.4 billion at January 31, 2018, with
$56.8 billion sourced as secured funding and $121.6 billion as unsecured funding. Wholesale funding outstanding decreased from $180.5 billion at
October 31, 2017 due to the impact of the weaker U.S. dollar. The mix and maturities of BMO’s wholesale term funding are outlined in the table below.
Additional information on deposit maturities can be found in Note 14 to the unaudited interim consolidated financial statements. BMO maintains a
sizeable portfolio of unencumbered liquid assets, totalling $213.5 billion as at January 31, 2018, that can be monetized to meet potential funding
requirements, as described on page 26.
Diversification of our wholesale funding sources is an important part of our overall liquidity management strategy. BMO’s wholesale funding
activities are well-diversified by jurisdiction, currency, investor segment, instrument and maturity profile. BMO maintains ready access to long-term
wholesale funding through various borrowing programs, including a European Note Issuance Program, Canadian, Australian and U.S. Medium-Term
Note programs, Canadian and U.S. mortgage securitizations, Canadian credit card, auto and home equity line of credit (HELOC) securitizations, covered
bonds and Canadian and U.S. senior unsecured deposits.
BMO’s wholesale funding plan seeks to ensure sufficient funding capacity is available to execute business strategies. The funding plan considers
expected maturities, as well as asset and liability growth projected for our businesses in our forecasting and planning process, and assesses funding
needs in relation to the funding sources available. The funding plan is reviewed annually by the Balance Sheet and Capital Management Committee
and Risk Management Committee and approved by the Risk Review Committee, and is regularly updated to reflect actual results and incorporate
updated forecast information.
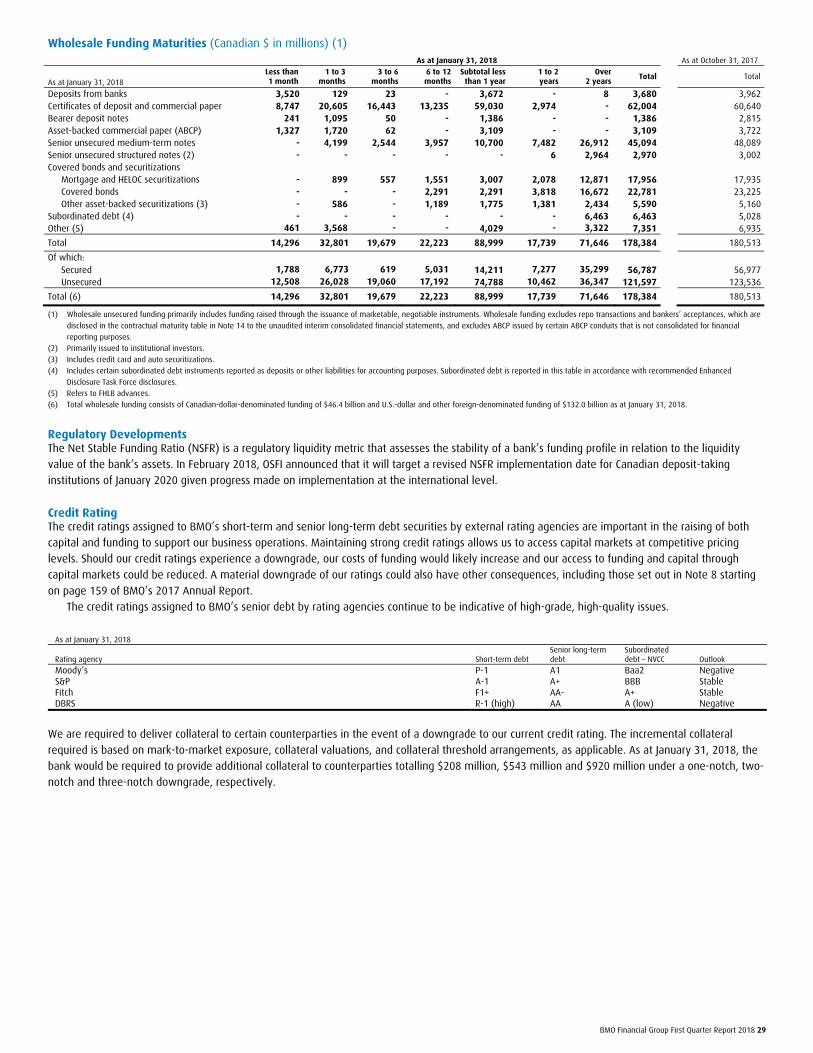
BMO Financial Group First Quarter Report 2018 29
Wholesale Funding Maturities (Canadian $ in millions) (1) As at January 31, 2018 As at October 31, 2017
As at January 31, 2018 Less than 1 month
1 to 3 months
3 to 6 months
6 to 12 months
Subtotal less than 1 year
1 to 2 years
Over 2 years
Total Total
Deposits from banks 3,520 129 23 - 3,672 - 8 3,680 3,962Certificates of deposit and commercial paper 8,747 20,605 16,443 13,235 59,030 2,974 - 62,004 60,640Bearer deposit notes 241 1,095 50 - 1,386 - - 1,386 2,815Asset-backed commercial paper (ABCP) 1,327 1,720 62 - 3,109 - - 3,109 3,722Senior unsecured medium-term notes - 4,199 2,544 3,957 10,700 7,482 26,912 45,094 48,089Senior unsecured structured notes (2) - - - - - 6 2,964 2,970 3,002Covered bonds and securitizations
Mortgage and HELOC securitizations - 899 557 1,551 3,007 2,078 12,871 17,956 17,935Covered bonds - - - 2,291 2,291 3,818 16,672 22,781 23,225Other asset-backed securitizations (3) - 586 - 1,189 1,775 1,381 2,434 5,590 5,160
Subordinated debt (4) - - - - - - 6,463 6,463 5,028Other (5) 461 3,568 - - 4,029 - 3,322 7,351 6,935
Total 14,296 32,801 19,679 22,223 88,999 17,739 71,646 178,384 180,513
Of which: Secured 1,788 6,773 619 5,031 14,211 7,277 35,299 56,787 56,977Unsecured 12,508 26,028 19,060 17,192 74,788 10,462 36,347 121,597 123,536
Total (6) 14,296 32,801 19,679 22,223 88,999 17,739 71,646 178,384 180,513
(1) Wholesale unsecured funding primarily includes funding raised through the issuance of marketable, negotiable instruments. Wholesale funding excludes repo transactions and bankers’ acceptances, which are
disclosed in the contractual maturity table in Note 14 to the unaudited interim consolidated financial statements, and excludes ABCP issued by certain ABCP conduits that is not consolidated for financial
reporting purposes.
(2) Primarily issued to institutional investors.
(3) Includes credit card and auto securitizations.
(4) Includes certain subordinated debt instruments reported as deposits or other liabilities for accounting purposes. Subordinated debt is reported in this table in accordance with recommended Enhanced
Disclosure Task Force disclosures.
(5) Refers to FHLB advances.
(6) Total wholesale funding consists of Canadian-dollar-denominated funding of $46.4 billion and U.S.-dollar and other foreign-denominated funding of $132.0 billion as at January 31, 2018.
Regulatory Developments The Net Stable Funding Ratio (NSFR) is a regulatory liquidity metric that assesses the stability of a bank’s funding profile in relation to the liquidity
value of the bank’s assets. In February 2018, OSFI announced that it will target a revised NSFR implementation date for Canadian deposit-taking
institutions of January 2020 given progress made on implementation at the international level.
Credit Rating The credit ratings assigned to BMO’s short-term and senior long-term debt securities by external rating agencies are important in the raising of both
capital and funding to support our business operations. Maintaining strong credit ratings allows us to access capital markets at competitive pricing
levels. Should our credit ratings experience a downgrade, our costs of funding would likely increase and our access to funding and capital through
capital markets could be reduced. A material downgrade of our ratings could also have other consequences, including those set out in Note 8 starting
on page 159 of BMO’s 2017 Annual Report.
The credit ratings assigned to BMO’s senior debt by rating agencies continue to be indicative of high-grade, high-quality issues.
As at January 31, 2018
Rating agency Short-term debt Senior long-term debt
Subordinated debt – NVCC Outlook
Moody’s P-1 A1 Baa2 Negative S&P A-1 A+ BBB Stable Fitch F1+ AA- A+ Stable DBRS R-1 (high) AA A (low) Negative
We are required to deliver collateral to certain counterparties in the event of a downgrade to our current credit rating. The incremental collateral
required is based on mark-to-market exposure, collateral valuations, and collateral threshold arrangements, as applicable. As at January 31, 2018, the
bank would be required to provide additional collateral to counterparties totalling $208 million, $543 million and $920 million under a one-notch, two-
notch and three-notch downgrade, respectively.
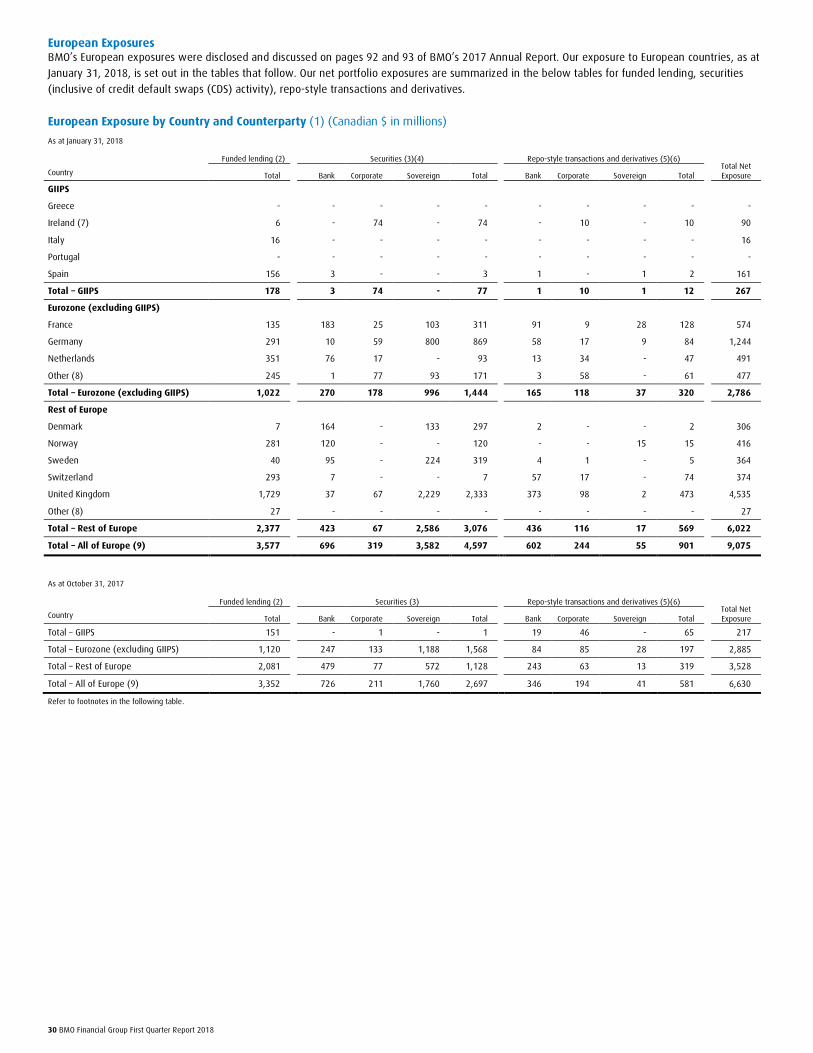
30 BMO Financial Group First Quarter Report 2018
European Exposures BMO’s European exposures were disclosed and discussed on pages 92 and 93 of BMO’s 2017 Annual Report. Our exposure to European countries, as at
January 31, 2018, is set out in the tables that follow. Our net portfolio exposures are summarized in the below tables for funded lending, securities
(inclusive of credit default swaps (CDS) activity), repo-style transactions and derivatives.
European Exposure by Country and Counterparty (1) (Canadian $ in millions)
As at January 31, 2018
Funded lending (2) Securities (3)(4) Repo-style transactions and derivatives (5)(6) Total Net Exposure Country Total Bank Corporate Sovereign Total Bank Corporate Sovereign Total
GIIPS
Greece - - - - - - - - - -
Ireland (7) 6 - 74 - 74 - 10 - 10 90
Italy 16 - - - - - - - - 16
Portugal - - - - - - - - - -
Spain 156 3 - - 3 1 - 1 2 161
Total – GIIPS 178 3 74 - 77 1 10 1 12 267
Eurozone (excluding GIIPS)
France 135 183 25 103 311 91 9 28 128 574
Germany 291 10 59 800 869 58 17 9 84 1,244
Netherlands 351 76 17 - 93 13 34 - 47 491
Other (8) 245 1 77 93 171 3 58 - 61 477
Total – Eurozone (excluding GIIPS) 1,022 270 178 996 1,444 165 118 37 320 2,786
Rest of Europe
Denmark 7 164 - 133 297 2 - - 2 306
Norway 281 120 - - 120 - - 15 15 416
Sweden 40 95 - 224 319 4 1 - 5 364
Switzerland 293 7 - - 7 57 17 - 74 374
United Kingdom 1,729 37 67 2,229 2,333 373 98 2 473 4,535
Other (8) 27 - - - - - - - - 27
Total – Rest of Europe 2,377 423 67 2,586 3,076 436 116 17 569 6,022
Total – All of Europe (9) 3,577 696 319 3,582 4,597 602 244 55 901 9,075
As at October 31, 2017
Funded lending (2) Securities (3) Repo-style transactions and derivatives (5)(6) Total Net Exposure Country Total Bank Corporate Sovereign Total Bank Corporate Sovereign Total
Total – GIIPS 151 - 1 - 1 19 46 - 65 217
Total – Eurozone (excluding GIIPS) 1,120 247 133 1,188 1,568 84 85 28 197 2,885
Total – Rest of Europe 2,081 479 77 572 1,128 243 63 13 319 3,528
Total – All of Europe (9) 3,352 726 211 1,760 2,697 346 194 41 581 6,630
Refer to footnotes in the following table.
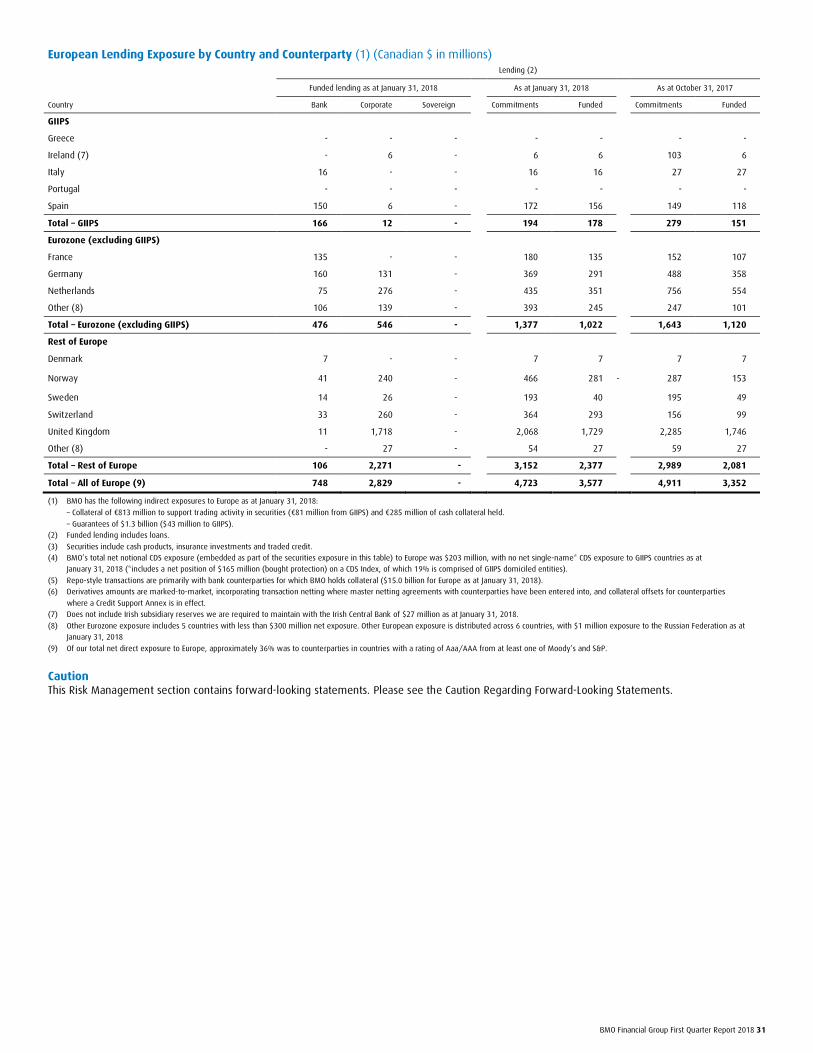
BMO Financial Group First Quarter Report 2018 31
European Lending Exposure by Country and Counterparty (1) (Canadian $ in millions) Lending (2)
Funded lending as at January 31, 2018 As at January 31, 2018 As at October 31, 2017
Country Bank Corporate Sovereign Commitments Funded Commitments Funded
GIIPS
Greece - - - - - - -
Ireland (7) - 6 - 6 6 103 6
Italy 16 - - 16 16 27 27
Portugal - - - - - - -
Spain 150 6 - 172 156 149 118
Total – GIIPS 166 12 - 194 178 279 151
Eurozone (excluding GIIPS)
France 135 - - 180 135 152 107
Germany 160 131 - 369 291 488 358
Netherlands 75 276 - 435 351 756 554
Other (8) 106 139 - 393 245 247 101
Total – Eurozone (excluding GIIPS) 476 546 - 1,377 1,022 1,643 1,120
Rest of Europe
Denmark 7 - - 7 7 7 7
Norway 41 240 - 466 281 - 287 153
Sweden 14 26 - 193 40 195 49
Switzerland 33 260 - 364 293 156 99
United Kingdom 11 1,718 - 2,068 1,729 2,285 1,746
Other (8) - 27 - 54 27 59 27
Total – Rest of Europe 106 2,271 - 3,152 2,377 2,989 2,081
Total – All of Europe (9) 748 2,829 - 4,723 3,577 4,911 3,352
(1) BMO has the following indirect exposures to Europe as at January 31, 2018:
– Collateral of €813 million to support trading activity in securities (€81 million from GIIPS) and €285 million of cash collateral held.
– Guarantees of $1.3 billion ($43 million to GIIPS). (2) Funded lending includes loans.
(3) Securities include cash products, insurance investments and traded credit. (4) BMO’s total net notional CDS exposure (embedded as part of the securities exposure in this table) to Europe was $203 million, with no net single-name* CDS exposure to GIIPS countries as at
January 31, 2018 (*includes a net position of $165 million (bought protection) on a CDS Index, of which 19% is comprised of GIIPS domiciled entities).
(5) Repo-style transactions are primarily with bank counterparties for which BMO holds collateral ($15.0 billion for Europe as at January 31, 2018). (6) Derivatives amounts are marked-to-market, incorporating transaction netting where master netting agreements with counterparties have been entered into, and collateral offsets for counterparties
where a Credit Support Annex is in effect. (7) Does not include Irish subsidiary reserves we are required to maintain with the Irish Central Bank of $27 million as at January 31, 2018.
(8) Other Eurozone exposure includes 5 countries with less than $300 million net exposure. Other European exposure is distributed across 6 countries, with $1 million exposure to the Russian Federation as at January 31, 2018
(9) Of our total net direct exposure to Europe, approximately 36% was to counterparties in countries with a rating of Aaa/AAA from at least one of Moody’s and S&P.
Caution This Risk Management section contains forward-looking statements. Please see the Caution Regarding Forward-Looking Statements.
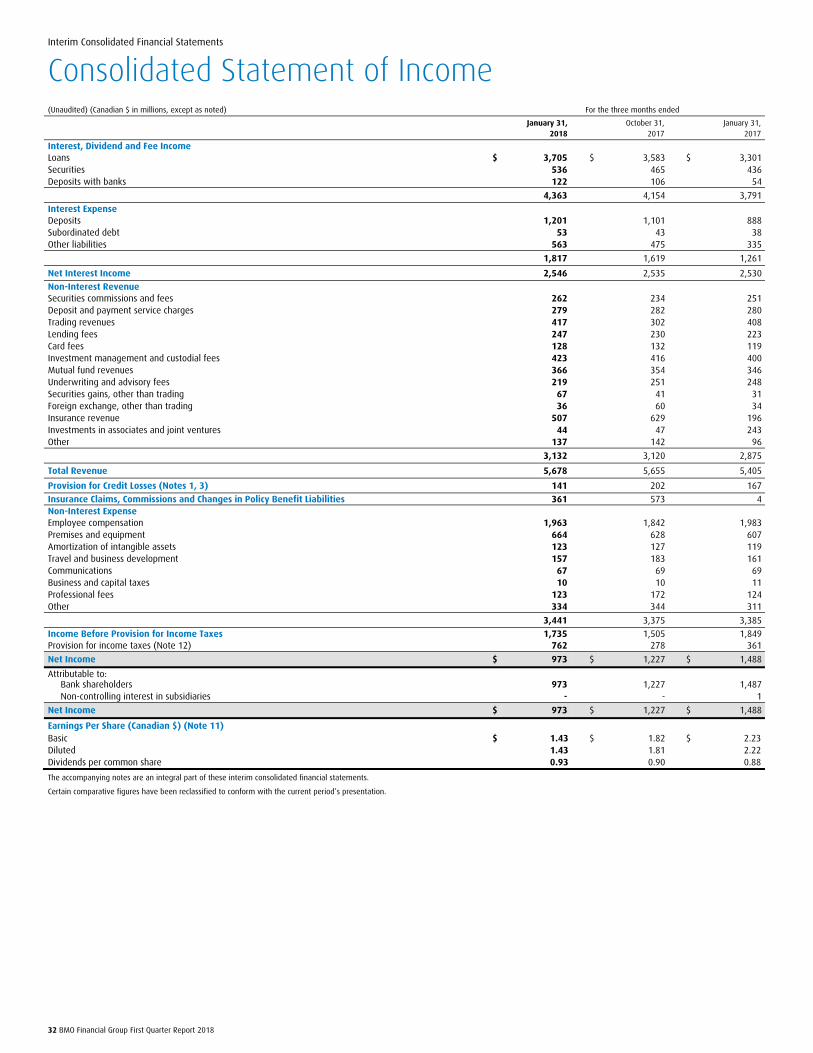
32 BMO Financial Group First Quarter Report 2018
Interim Consolidated Financial Statements
Consolidated Statement of Income (Unaudited) (Canadian $ in millions, except as noted) For the three months ended
January 31, October 31, January 31, 2018 2017 2017
Interest, Dividend and Fee Income Loans $ 3,705 $ 3,583 $ 3,301 Securities 536 465 436 Deposits with banks 122 106 54
4,363 4,154 3,791
Interest Expense Deposits 1,201 1,101 888 Subordinated debt 53 43 38 Other liabilities 563 475 335
1,817 1,619 1,261
Net Interest Income 2,546 2,535 2,530
Non-Interest Revenue Securities commissions and fees 262 234 251 Deposit and payment service charges 279 282 280 Trading revenues 417 302 408 Lending fees 247 230 223 Card fees 128 132 119 Investment management and custodial fees 423 416 400 Mutual fund revenues 366 354 346 Underwriting and advisory fees 219 251 248 Securities gains, other than trading 67 41 31 Foreign exchange, other than trading 36 60 34 Insurance revenue 507 629 196 Investments in associates and joint ventures 44 47 243 Other 137 142 96
3,132 3,120 2,875
Total Revenue 5,678 5,655 5,405
Provision for Credit Losses (Notes 1, 3) 141 202 167
Insurance Claims, Commissions and Changes in Policy Benefit Liabilities 361 573 4 Non-Interest Expense Employee compensation 1,963 1,842 1,983 Premises and equipment 664 628 607 Amortization of intangible assets 123 127 119 Travel and business development 157 183 161 Communications 67 69 69 Business and capital taxes 10 10 11 Professional fees 123 172 124 Other 334 344 311
3,441 3,375 3,385
Income Before Provision for Income Taxes 1,735 1,505 1,849 Provision for income taxes (Note 12) 762 278 361
Net Income $ 973 $ 1,227 $ 1,488
Attributable to: Bank shareholders 973 1,227 1,487 Non-controlling interest in subsidiaries - - 1
Net Income $ 973 $ 1,227 $ 1,488
Earnings Per Share (Canadian $) (Note 11) Basic $ 1.43 $ 1.82 $ 2.23 Diluted 1.43 1.81 2.22 Dividends per common share 0.93 0.90 0.88
The accompanying notes are an integral part of these interim consolidated financial statements.
Certain comparative figures have been reclassified to conform with the current period’s presentation.
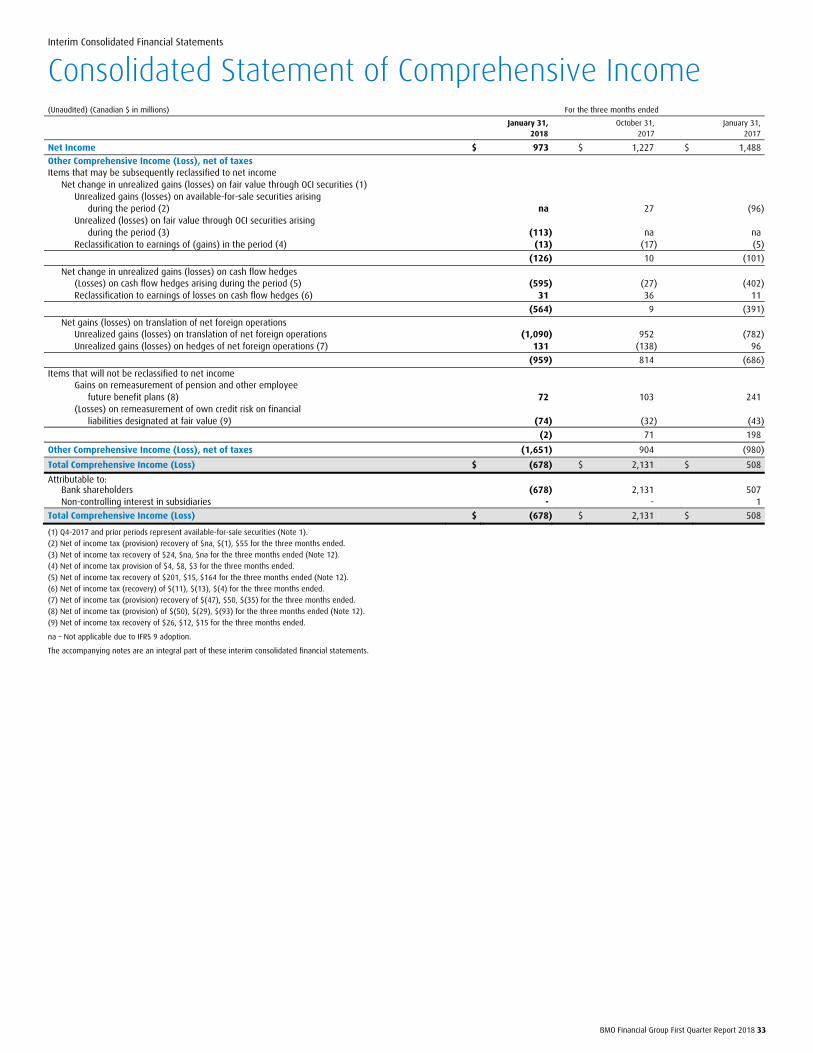
BMO Financial Group First Quarter Report 2018 33
Interim Consolidated Financial Statements
Consolidated Statement of Comprehensive Income (Unaudited) (Canadian $ in millions) For the three months ended
January 31, October 31, January 31, 2018 2017 2017
Net Income $ 973 $ 1,227 $ 1,488
Other Comprehensive Income (Loss), net of taxes Items that may be subsequently reclassified to net income
Net change in unrealized gains (losses) on fair value through OCI securities (1) Unrealized gains (losses) on available-for-sale securities arising
during the period (2) na 27 (96) Unrealized (losses) on fair value through OCI securities arising
during the period (3) (113) na na Reclassification to earnings of (gains) in the period (4) (13) (17) (5)
(126) 10 (101)
Net change in unrealized gains (losses) on cash flow hedges (Losses) on cash flow hedges arising during the period (5) (595) (27) (402) Reclassification to earnings of losses on cash flow hedges (6) 31 36 11
(564) 9 (391)
Net gains (losses) on translation of net foreign operations Unrealized gains (losses) on translation of net foreign operations (1,090) 952 (782) Unrealized gains (losses) on hedges of net foreign operations (7) 131 (138) 96
(959) 814 (686)
Items that will not be reclassified to net income Gains on remeasurement of pension and other employee
future benefit plans (8) 72 103 241 (Losses) on remeasurement of own credit risk on financial
liabilities designated at fair value (9) (74) (32) (43)
(2) 71 198
Other Comprehensive Income (Loss), net of taxes (1,651) 904 (980)
Total Comprehensive Income (Loss) $ (678) $ 2,131 $ 508
Attributable to: Bank shareholders (678) 2,131 507 Non-controlling interest in subsidiaries - - 1
Total Comprehensive Income (Loss) $ (678) $ 2,131 $ 508
(1) Q4-2017 and prior periods represent available-for-sale securities (Note 1).
(2) Net of income tax (provision) recovery of $na, $(1), $55 for the three months ended.
(3) Net of income tax recovery of $24, $na, $na for the three months ended (Note 12).
(4) Net of income tax provision of $4, $8, $3 for the three months ended.
(5) Net of income tax recovery of $201, $15, $164 for the three months ended (Note 12).
(6) Net of income tax (recovery) of $(11), $(13), $(4) for the three months ended.
(7) Net of income tax (provision) recovery of $(47), $50, $(35) for the three months ended.
(8) Net of income tax (provision) of $(50), $(29), $(93) for the three months ended (Note 12).
(9) Net of income tax recovery of $26, $12, $15 for the three months ended.
na – Not applicable due to IFRS 9 adoption.
The accompanying notes are an integral part of these interim consolidated financial statements.
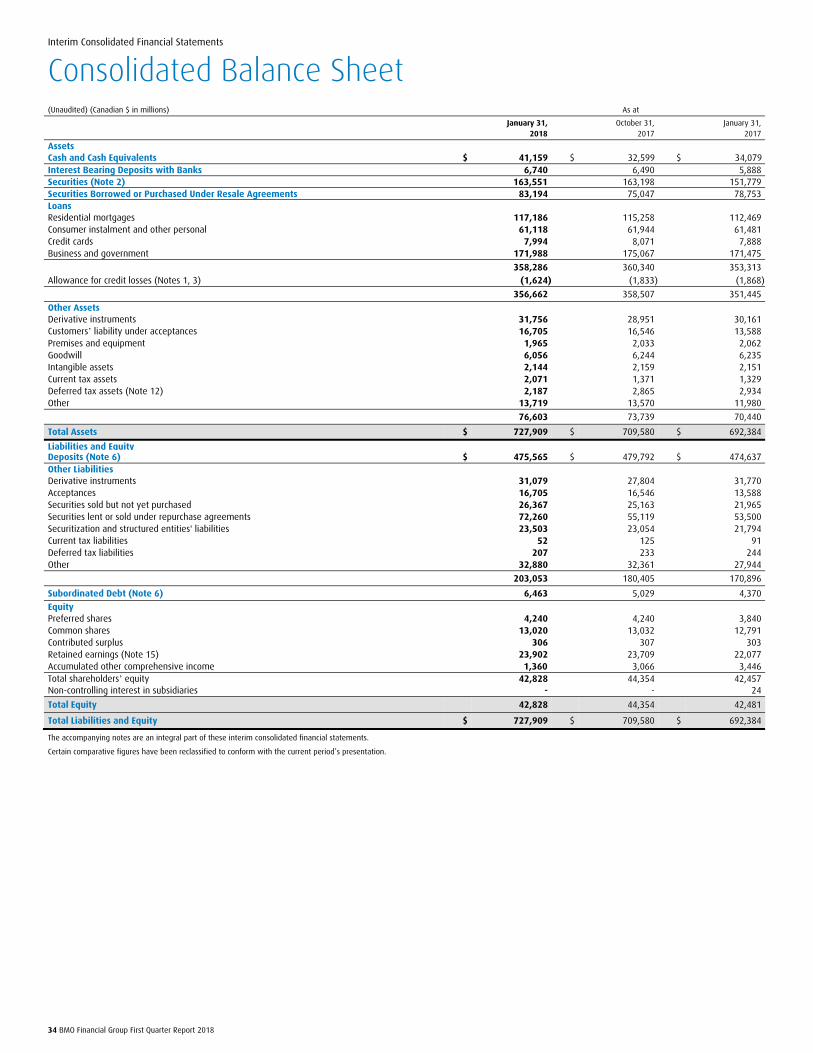
34 BMO Financial Group First Quarter Report 2018
Interim Consolidated Financial Statements
Consolidated Balance Sheet (Unaudited) (Canadian $ in millions) As at
January 31, October 31, January 31, 2018 2017 2017
Assets Cash and Cash Equivalents $ 41,159 $ 32,599 $ 34,079 Interest Bearing Deposits with Banks 6,740 6,490 5,888 Securities (Note 2) 163,551 163,198 151,779 Securities Borrowed or Purchased Under Resale Agreements 83,194 75,047 78,753 Loans Residential mortgages 117,186 115,258 112,469 Consumer instalment and other personal 61,118 61,944 61,481 Credit cards 7,994 8,071 7,888 Business and government 171,988 175,067 171,475
358,286 360,340 353,313
Allowance for credit losses (Notes 1, 3) (1,624) (1,833) (1,868)
356,662 358,507 351,445
Other Assets Derivative instruments 31,756 28,951 30,161 Customersʼ liability under acceptances 16,705 16,546 13,588 Premises and equipment 1,965 2,033 2,062 Goodwill 6,056 6,244 6,235 Intangible assets 2,144 2,159 2,151 Current tax assets 2,071 1,371 1,329 Deferred tax assets (Note 12) 2,187 2,865 2,934 Other 13,719 13,570 11,980
76,603 73,739 70,440
Total Assets $ 727,909 $ 709,580 $ 692,384
Liabilities and Equity Deposits (Note 6) $ 475,565 $ 479,792 $ 474,637 Other Liabilities Derivative instruments 31,079 27,804 31,770 Acceptances 16,705 16,546 13,588 Securities sold but not yet purchased 26,367 25,163 21,965 Securities lent or sold under repurchase agreements 72,260 55,119 53,500 Securitization and structured entities' liabilities 23,503 23,054 21,794 Current tax liabilities 52 125 91 Deferred tax liabilities 207 233 244 Other 32,880 32,361 27,944
203,053 180,405 170,896
Subordinated Debt (Note 6) 6,463 5,029 4,370
Equity Preferred shares 4,240 4,240 3,840 Common shares 13,020 13,032 12,791 Contributed surplus 306 307 303 Retained earnings (Note 15) 23,902 23,709 22,077 Accumulated other comprehensive income 1,360 3,066 3,446 Total shareholdersʼ equity 42,828 44,354 42,457 Non-controlling interest in subsidiaries - - 24
Total Equity 42,828 44,354 42,481
Total Liabilities and Equity $ 727,909 $ 709,580 $ 692,384
The accompanying notes are an integral part of these interim consolidated financial statements.
Certain comparative figures have been reclassified to conform with the current period’s presentation.
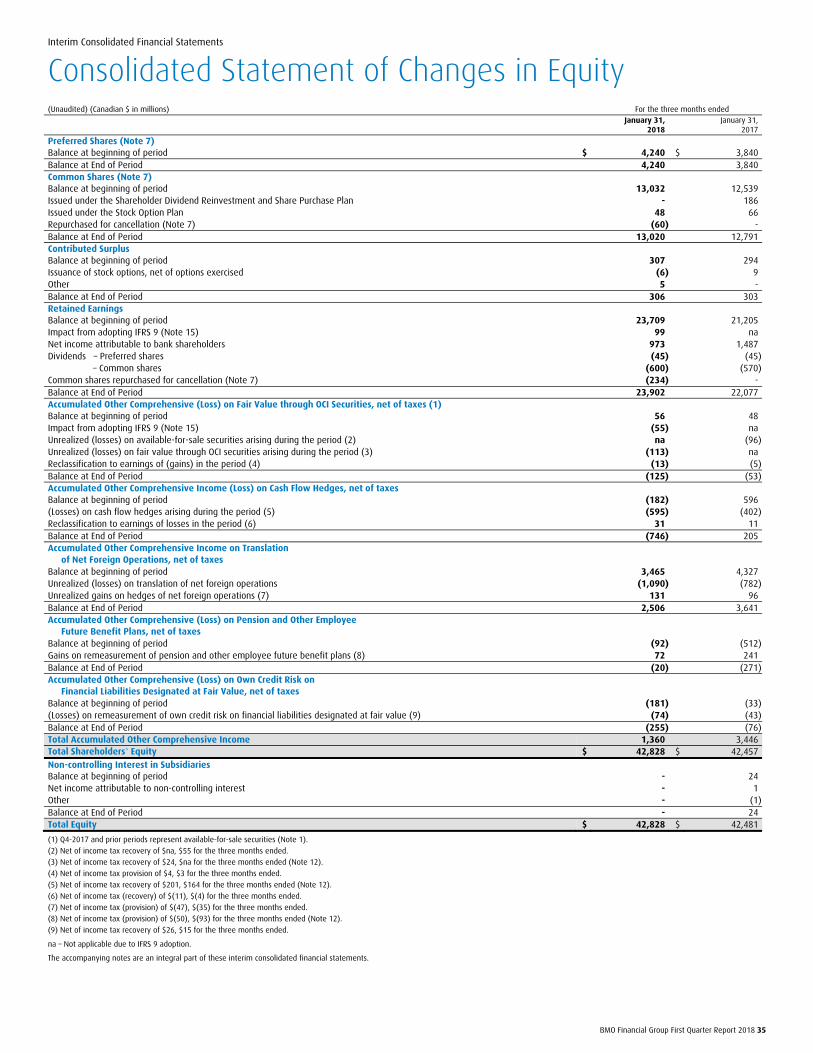
BMO Financial Group First Quarter Report 2018 35
Interim Consolidated Financial Statements
Consolidated Statement of Changes in Equity (Unaudited) (Canadian $ in millions) For the three months ended
January 31, January 31, 2018 2017
Preferred Shares (Note 7) Balance at beginning of period $ 4,240 $ 3,840 Balance at End of Period 4,240 3,840 Common Shares (Note 7) Balance at beginning of period 13,032 12,539 Issued under the Shareholder Dividend Reinvestment and Share Purchase Plan - 186 Issued under the Stock Option Plan 48 66 Repurchased for cancellation (Note 7) (60) - Balance at End of Period 13,020 12,791 Contributed Surplus Balance at beginning of period 307 294 Issuance of stock options, net of options exercised (6) 9 Other 5 - Balance at End of Period 306 303 Retained Earnings Balance at beginning of period 23,709 21,205 Impact from adopting IFRS 9 (Note 15) 99 na Net income attributable to bank shareholders 973 1,487 Dividends – Preferred shares (45) (45)
– Common shares (600) (570) Common shares repurchased for cancellation (Note 7) (234) - Balance at End of Period 23,902 22,077 Accumulated Other Comprehensive (Loss) on Fair Value through OCI Securities, net of taxes (1) Balance at beginning of period 56 48 Impact from adopting IFRS 9 (Note 15) (55) na Unrealized (losses) on available-for-sale securities arising during the period (2) na (96) Unrealized (losses) on fair value through OCI securities arising during the period (3) (113) na Reclassification to earnings of (gains) in the period (4) (13) (5) Balance at End of Period (125) (53) Accumulated Other Comprehensive Income (Loss) on Cash Flow Hedges, net of taxes Balance at beginning of period (182) 596 (Losses) on cash flow hedges arising during the period (5) (595) (402) Reclassification to earnings of losses in the period (6) 31 11 Balance at End of Period (746) 205 Accumulated Other Comprehensive Income on Translation
of Net Foreign Operations, net of taxes Balance at beginning of period 3,465 4,327 Unrealized (losses) on translation of net foreign operations (1,090) (782) Unrealized gains on hedges of net foreign operations (7) 131 96 Balance at End of Period 2,506 3,641 Accumulated Other Comprehensive (Loss) on Pension and Other Employee
Future Benefit Plans, net of taxes Balance at beginning of period (92) (512) Gains on remeasurement of pension and other employee future benefit plans (8) 72 241 Balance at End of Period (20) (271) Accumulated Other Comprehensive (Loss) on Own Credit Risk on
Financial Liabilities Designated at Fair Value, net of taxes Balance at beginning of period (181) (33) (Losses) on remeasurement of own credit risk on financial liabilities designated at fair value (9) (74) (43) Balance at End of Period (255) (76) Total Accumulated Other Comprehensive Income 1,360 3,446 Total Shareholdersʼ Equity $ 42,828 $ 42,457
Non-controlling Interest in Subsidiaries Balance at beginning of period - 24 Net income attributable to non-controlling interest - 1 Other - (1) Balance at End of Period - 24 Total Equity $ 42,828 $ 42,481
(1) Q4-2017 and prior periods represent available-for-sale securities (Note 1).
(2) Net of income tax recovery of $na, $55 for the three months ended.
(3) Net of income tax recovery of $24, $na for the three months ended (Note 12).
(4) Net of income tax provision of $4, $3 for the three months ended.
(5) Net of income tax recovery of $201, $164 for the three months ended (Note 12).
(6) Net of income tax (recovery) of $(11), $(4) for the three months ended.
(7) Net of income tax (provision) of $(47), $(35) for the three months ended.
(8) Net of income tax (provision) of $(50), $(93) for the three months ended (Note 12).
(9) Net of income tax recovery of $26, $15 for the three months ended.
na – Not applicable due to IFRS 9 adoption.
The accompanying notes are an integral part of these interim consolidated financial statements.
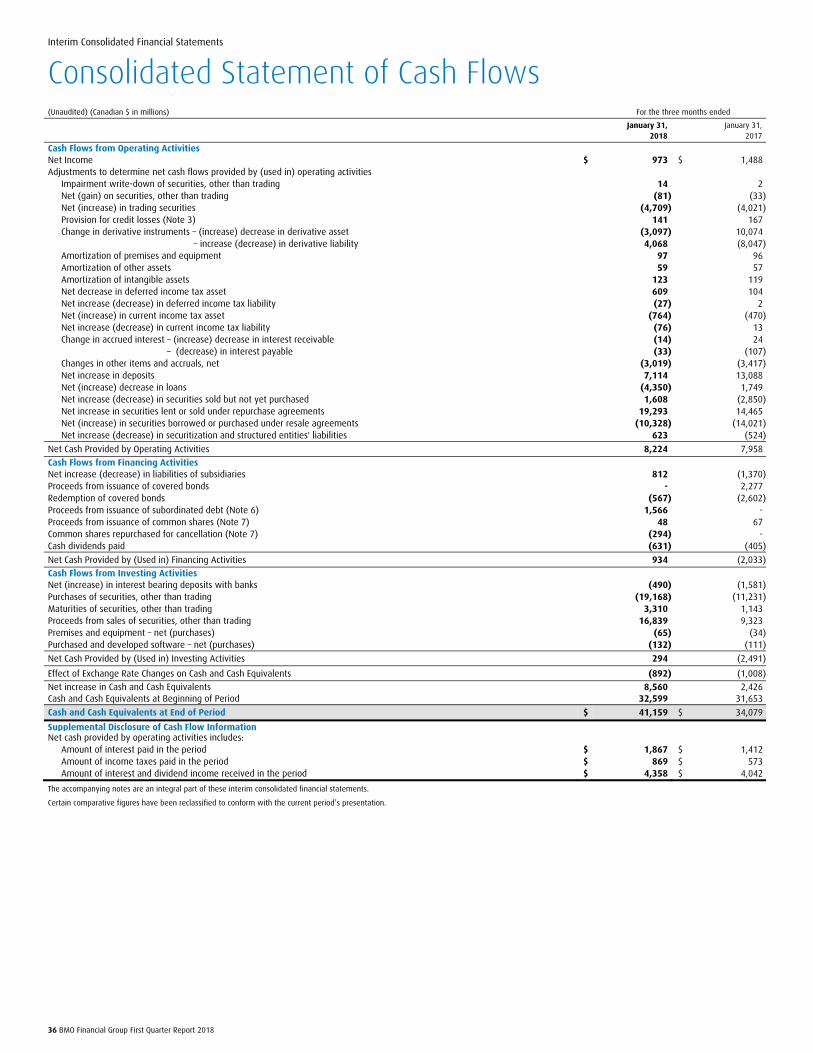
36 BMO Financial Group First Quarter Report 2018
Interim Consolidated Financial Statements
Consolidated Statement of Cash Flows (Unaudited) (Canadian $ in millions) For the three months ended
January 31, January 31, 2018 2017
Cash Flows from Operating Activities Net Income $ 973 $ 1,488 Adjustments to determine net cash flows provided by (used in) operating activities
Impairment write-down of securities, other than trading 14 2 Net (gain) on securities, other than trading (81) (33)Net (increase) in trading securities (4,709) (4,021)Provision for credit losses (Note 3) 141 167 Change in derivative instruments – (increase) decrease in derivative asset (3,097) 10,074
– increase (decrease) in derivative liability 4,068 (8,047)Amortization of premises and equipment 97 96 Amortization of other assets 59 57 Amortization of intangible assets 123 119 Net decrease in deferred income tax asset 609 104 Net increase (decrease) in deferred income tax liability (27) 2 Net (increase) in current income tax asset (764) (470)Net increase (decrease) in current income tax liability (76) 13 Change in accrued interest – (increase) decrease in interest receivable (14) 24
– (decrease) in interest payable (33) (107)Changes in other items and accruals, net (3,019) (3,417)Net increase in deposits 7,114 13,088 Net (increase) decrease in loans (4,350) 1,749 Net increase (decrease) in securities sold but not yet purchased 1,608 (2,850)Net increase in securities lent or sold under repurchase agreements 19,293 14,465 Net (increase) in securities borrowed or purchased under resale agreements (10,328) (14,021)Net increase (decrease) in securitization and structured entities' liabilities 623 (524)
Net Cash Provided by Operating Activities 8,224 7,958
Cash Flows from Financing Activities Net increase (decrease) in liabilities of subsidiaries 812 (1,370)Proceeds from issuance of covered bonds - 2,277 Redemption of covered bonds (567) (2,602)Proceeds from issuance of subordinated debt (Note 6) 1,566 - Proceeds from issuance of common shares (Note 7) 48 67 Common shares repurchased for cancellation (Note 7) (294) - Cash dividends paid (631) (405)
Net Cash Provided by (Used in) Financing Activities 934 (2,033)
Cash Flows from Investing Activities Net (increase) in interest bearing deposits with banks (490) (1,581)Purchases of securities, other than trading (19,168) (11,231)Maturities of securities, other than trading 3,310 1,143 Proceeds from sales of securities, other than trading 16,839 9,323 Premises and equipment – net (purchases) (65) (34)Purchased and developed software – net (purchases) (132) (111)
Net Cash Provided by (Used in) Investing Activities 294 (2,491)
Effect of Exchange Rate Changes on Cash and Cash Equivalents (892) (1,008)
Net increase in Cash and Cash Equivalents 8,560 2,426 Cash and Cash Equivalents at Beginning of Period 32,599 31,653
Cash and Cash Equivalents at End of Period $ 41,159 $ 34,079
Supplemental Disclosure of Cash Flow Information Net cash provided by operating activities includes:
Amount of interest paid in the period $ 1,867 $ 1,412 Amount of income taxes paid in the period $ 869 $ 573 Amount of interest and dividend income received in the period $ 4,358 $ 4,042
The accompanying notes are an integral part of these interim consolidated financial statements.
Certain comparative figures have been reclassified to conform with the current period’s presentation.
BMO Financial Group First Quarter Report 2018 37
Notes to Consolidated Financial Statements January 31, 2018 (Unaudited)
Note 1: Basis of Presentation Bank of Montreal (“the bank”) is a chartered bank under the Bank Act (Canada) and is a public company incorporated in Canada. We are a highly
diversified financial services company, providing a broad range of personal and commercial banking, wealth management and investment banking
products and services. The bank’s head office is 129 rue Saint Jacques, Montreal, Quebec. Its executive offices are 100 King Street West, 1 First
Canadian Place, Toronto, Ontario. Our common shares are listed on the Toronto Stock Exchange (“TSX”) and the New York Stock Exchange.
These condensed interim consolidated financial statements have been prepared in accordance with International Accounting Standard 34, Interim Financial Reporting as issued by the International Accounting Standards Board (“IASB”) using the same accounting policies as disclosed in our annual
consolidated financial statements for the year ended October 31, 2017, with the exception of the adoption of IFRS 9 Financial Instruments discussed
below. These condensed interim consolidated financial statements should be read in conjunction with the notes to our annual consolidated financial
statements for the year ended October 31, 2017 as set out on pages 144 to 201 of our 2017 Annual Report. We also comply with interpretations of
International Financial Reporting Standards (“IFRS”) by our regulator, the Office of the Superintendent of Financial Institutions of Canada (“OSFI”). These
interim consolidated financial statements were authorized for issue by the Board of Directors on February 27, 2018.
Changes in Accounting Policy
Financial Instruments Effective November 1, 2017 we adopted IFRS 9 Financial Instruments (“IFRS 9”), which replaces IAS 39 Financial Instruments: Recognition and Measurement (“IAS 39”). IFRS 9 addresses impairment, classification and measurement, and hedge accounting. The impact to shareholders’ equity at
November 1, 2017 is an increase of $70 million ($44 million after-tax) related to the impairment requirements of the standard. Prior periods have not
been restated. Refer to Note 15, Transition to IFRS 9, for impact to the opening balance sheet at November 1, 2017.
Impairment
IFRS 9 introduces a new single expected credit loss (“ECL”) impairment model for all financial assets and certain off-balance sheet loan commitments
and guarantees. The ECL model will result in an allowance for credit losses being recorded on financial assets regardless of whether there has been an
actual loss event. This differs from our previous approach where the allowance recorded on performing loans was designed to capture only incurred
losses whether or not they have been specifically identified.
The ECL model requires the recognition of credit losses based on 12 months of expected losses for performing loans (Stage 1) and the recognition
of lifetime expected losses on performing loans that have experienced a significant increase in credit risk since origination (Stage 2).
The determination of a significant increase in credit risk takes into account many different factors and will vary by product and risk segment. The
main factors considered in making this determination are relative changes in probability-weighted probability of default since origination and certain
other criteria such as 30-day past due and watchlist status. The allowance for assets in Stage 2 will be higher than for those in Stage 1 as a result of
the longer time horizon associated with this stage. Stage 3 requires lifetime losses for all credit impaired assets.
IFRS 9 requires consideration of past events, current market conditions and reasonable supportable information about future economic conditions,
in determining whether there has been a significant increase in credit risk, and in calculating the amount of expected losses. The standard also requires
future economic conditions be based on an unbiased, probability-weighted assessment of possible future outcomes.
In considering the lifetime of an instrument, IFRS 9 generally requires the use of the contractual period including pre-payment, extension and other
options. For revolving instruments, such as credit cards, that may not have a defined contractual period, lifetime is based on the historical behaviour.
Classification and Measurement
Debt instruments, including loans, are classified based on both our business model for managing the assets and the contractual cash flow
characteristics of the asset. Debt instruments will be measured at fair value through profit or loss (“FVTPL”) unless certain conditions are met that
permit either fair value through other comprehensive income (“FVOCI”) or amortized cost.
FVOCI is permitted where debt instruments are held with the objective of collecting contractual cash flows and selling the assets and those cash
flows represent solely payments of principal and interest. These securities may be sold in response to or in anticipation of changes in interest rates and
resulting prepayment risk, changes in credit risk, changes in foreign currency risk, changes in funding sources or terms, or to meet liquidity needs.
Changes in fair value are recorded in other comprehensive income; gains or losses on disposal and impairment losses are recorded in the Consolidated
Statement of Income.
Amortized cost is permitted where debt instruments are held with the objective of collecting contractual cash flows and those cash flows represent
solely payments of principal and interest. Gains or losses on disposal and impairment losses are recorded in the Consolidated Statement of Income.
For both FVOCI and amortized cost instruments, premiums, discounts and transaction costs are amortized over the term of the instrument on an
effective yield basis as an adjustment to interest income.
Equity instruments are measured at fair value through profit or loss unless we elect to measure at FVOCI, in which case gains and losses are never
recognized in income.
As permitted by IFRS 9, in fiscal 2015, the bank early adopted the provisions relating to the recognition of changes in own credit risk for financial
liabilities designated at fair value through profit or loss. Additional information regarding changes in own credit risk is included in Note 8.
38 BMO Financial Group First Quarter Report 2018
Hedge accounting
IFRS 9 introduced a new hedge accounting model that expands the scope of hedged items and risks eligible for hedge accounting and aligns hedge
accounting more closely with risk management. The new model no longer specifies quantitative measures for effectiveness testing and does not
permit hedge de-designation. IFRS 9 includes a policy choice that allows us to continue to apply the existing hedge accounting rules which we have
elected.
Use of Estimates and Judgments
Classification of debt instruments Debt instruments, including loans, are classified based on the business model for managing assets and the contractual cash flow characteristics of the
asset. We exercise judgment in determining both the business model for managing the assets and whether cash flows comprise solely principal and
interest.
Allowance for credit losses The expected credit loss model requires the recognition of credit losses based on 12 months of expected losses for performing loans and recognition of
lifetime losses on performing loans that have experienced a significant increase in credit risk since origination.
The determination of a significant increase in credit risk takes into account many different factors and varies by product and risk segment. The
main factors considered in making this determination are relative changes in probability of default since origination, and certain other criteria such as
30-day past due and watchlist status. The assessment of significant increase in credit risk requires experienced credit judgment.
In determining whether there has been a significant increase in credit risk and in calculating the amount of expected credit losses, we must rely on
estimates and exercise judgment regarding matters for which the ultimate outcome is unknown. These judgments include changes in circumstances
that may cause future assessments of credit risk to be materially different from current assessments, which could require an increase or decrease in
the allowance for credit losses.
The calculation of expected credit losses includes the explicit incorporation of forecasts of future economic conditions. We have developed models
incorporating specific macroeconomic variables that are relevant to each specific portfolio. Key economic variables for our retail portfolios include
unemployment rate, housing price index and interest rates and for our wholesale portfolios include GDP, interest rates and volatility index, for our
primary operating markets of Canada, the United States and regional markets where considered significant. The forecast is developed internally by our
Economics group, considering external data and our view of future economic conditions. We exercise experienced credit judgment to incorporate
multiple economic forecasts which are probability-weighted in the determination of the final expected credit loss. The allowance is sensitive to
changes in both economic forecast and the probability-weight assigned to each forecast scenario.
Additional information regarding the allowance for credit loss is included in Note 3 and Note 15.
Note 2: Securities Securities are divided into six types, each with a different business purpose or accounting treatment as follows:
Trading securities are securities purchased for resale over a short period of time. Trading securities are recorded at fair value through profit or loss.
Transaction costs and changes in fair value are recorded in our Consolidated Statement of Income in trading revenues.
Fair value through profit or loss securities are measured at fair value with changes in fair value and related transaction costs recorded in our
Consolidated Statement of Income in securities gains and losses, other than trading, except as noted below. This category includes the following:
Securities designated at FVTPL In order to qualify for this designation the security must have reliably measurable fair values and the designation eliminates or significantly reduces
the inconsistent treatment that would otherwise arise from measuring the gains and losses on a different basis. Securities must be designated on
initial recognition, and the designation is irrevocable. If these securities were not designated at FVTPL, they would be accounted for as either FVOCI or
amortized cost. Changes in fair value and transactions costs on securities held by our insurance subsidiary are recorded in non-interest revenue,
insurance revenue.
Other securities mandatorily measured at FVTPL Securities managed on a fair value basis, but not held for trading, or debt securities whose cash flows do not represent solely payments of principal
and interest and equity securities not held for trading.
Debt securities measured at amortized cost are debt securities purchased with the objective of collecting contractual cash flows and those cash flows
represent solely payments of principal and interest. These securities are initially recorded at fair value plus transaction costs and subsequently
measured at amortized cost using the effective interest method. Impairment losses are recorded in our Consolidated Statement of Income. Interest
income earned and amortization of premiums, discounts and transaction costs are recorded in our Consolidated Statement of Income in interest,
dividend and fee income, securities.
Debt securities measured at FVOCI are debt securities purchased with the objective of collecting contractual cash flows and selling the assets and the
security’s cash flows represent solely payments of principal and interest. These securities may be sold in response to or in anticipation of changes in
interest rates and resulting prepayment risk, changes in credit risk, changes in foreign currency risk, changes in funding sources or terms, or to meet
liquidity needs.
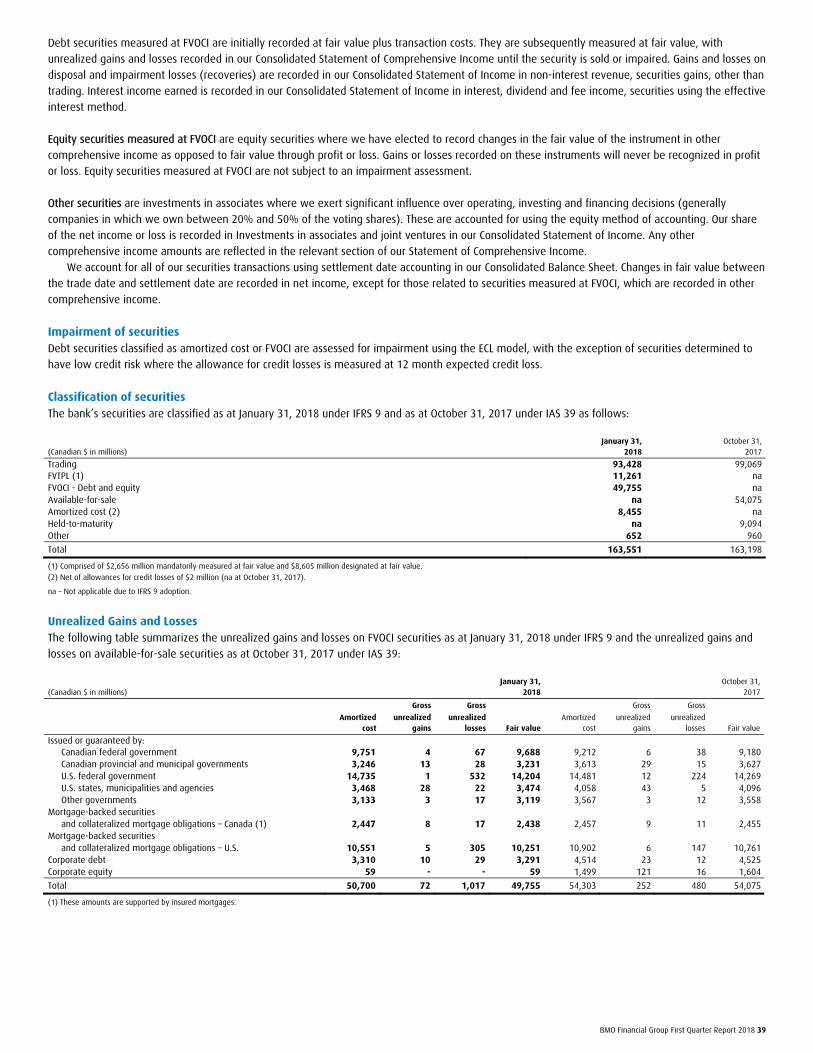
BMO Financial Group First Quarter Report 2018 39
Debt securities measured at FVOCI are initially recorded at fair value plus transaction costs. They are subsequently measured at fair value, with
unrealized gains and losses recorded in our Consolidated Statement of Comprehensive Income until the security is sold or impaired. Gains and losses on
disposal and impairment losses (recoveries) are recorded in our Consolidated Statement of Income in non-interest revenue, securities gains, other than
trading. Interest income earned is recorded in our Consolidated Statement of Income in interest, dividend and fee income, securities using the effective
interest method.
Equity securities measured at FVOCI are equity securities where we have elected to record changes in the fair value of the instrument in other
comprehensive income as opposed to fair value through profit or loss. Gains or losses recorded on these instruments will never be recognized in profit
or loss. Equity securities measured at FVOCI are not subject to an impairment assessment.
Other securities are investments in associates where we exert significant influence over operating, investing and financing decisions (generally
companies in which we own between 20% and 50% of the voting shares). These are accounted for using the equity method of accounting. Our share
of the net income or loss is recorded in Investments in associates and joint ventures in our Consolidated Statement of Income. Any other
comprehensive income amounts are reflected in the relevant section of our Statement of Comprehensive Income.
We account for all of our securities transactions using settlement date accounting in our Consolidated Balance Sheet. Changes in fair value between
the trade date and settlement date are recorded in net income, except for those related to securities measured at FVOCI, which are recorded in other
comprehensive income.
Impairment of securities Debt securities classified as amortized cost or FVOCI are assessed for impairment using the ECL model, with the exception of securities determined to
have low credit risk where the allowance for credit losses is measured at 12 month expected credit loss.
Classification of securities
The bank’s securities are classified as at January 31, 2018 under IFRS 9 and as at October 31, 2017 under IAS 39 as follows:
January 31, October 31, (Canadian $ in millions) 2018 2017
Trading 93,428 99,069 FVTPL (1) 11,261 na FVOCI - Debt and equity 49,755 na Available-for-sale na 54,075 Amortized cost (2) 8,455 na Held-to-maturity na 9,094 Other 652 960
Total 163,551 163,198
(1) Comprised of $2,656 million mandatorily measured at fair value and $8,605 million designated at fair value.
(2) Net of allowances for credit losses of $2 million (na at October 31, 2017).
na – Not applicable due to IFRS 9 adoption.
Unrealized Gains and Losses
The following table summarizes the unrealized gains and losses on FVOCI securities as at January 31, 2018 under IFRS 9 and the unrealized gains and
losses on available-for-sale securities as at October 31, 2017 under IAS 39:
January 31, October 31, (Canadian $ in millions) 2018 2017
Gross Gross Gross Gross Amortized unrealized unrealized Amortized unrealized unrealized cost gains losses Fair value cost gains losses Fair value
Issued or guaranteed by: Canadian federal government 9,751 4 67 9,688 9,212 6 38 9,180 Canadian provincial and municipal governments 3,246 13 28 3,231 3,613 29 15 3,627 U.S. federal government 14,735 1 532 14,204 14,481 12 224 14,269 U.S. states, municipalities and agencies 3,468 28 22 3,474 4,058 43 5 4,096 Other governments 3,133 3 17 3,119 3,567 3 12 3,558
Mortgage-backed securities and collateralized mortgage obligations – Canada (1) 2,447 8 17 2,438 2,457 9 11 2,455
Mortgage-backed securities and collateralized mortgage obligations – U.S. 10,551 5 305 10,251 10,902 6 147 10,761
Corporate debt 3,310 10 29 3,291 4,514 23 12 4,525 Corporate equity 59 - - 59 1,499 121 16 1,604
Total 50,700 72 1,017 49,755 54,303 252 480 54,075
(1) These amounts are supported by insured mortgages.

40 BMO Financial Group First Quarter Report 2018
Note 3: Loans and Allowance for Credit Losses Allowance for Credit Losses (“ACL”)
The allowance for credit losses recorded in our Consolidated Balance Sheet is maintained at a level that we consider adequate to absorb credit-related
losses on our loans and other credit instruments. The allowance for credit losses amounted to $1,848 million at January 31, 2018 of which $1,624
million was recorded in loans and $224 million recorded in other liabilities in our Consolidated Balance Sheet.
Allowance on Performing Loans We maintain an allowance in order to cover impairment in the existing portfolio for loans that have not yet been individually identified as impaired.
Our approach to establishing and maintaining the allowance for performing loans is based on the requirements of IFRS, considering guidelines issued
by OSFI.
Under the IFRS 9 expected credit loss ECL methodology, an allowance is recorded for expected credit losses on financial assets regardless of
whether there has been an actual loss event. We recognize a loss allowance at an amount equal to 12 month expected credit losses, if the credit risk
at the reporting date has not increased significantly since initial recognition (Stage 1). We will record expected credit losses over the remaining life of
performing financial assets which are considered to have experienced a significant increase in credit risk (Stage 2).
The determination of a significant increase in credit risk takes into account many different factors and varies by product and risk segment. The
main factors considered in making this determination are relative changes in probability-weighted probability of default since origination and certain
other criteria such as 30-day past due and watchlist status.
ECL is a function of the probability of default (“PD”), exposure at default (“EAD”) and loss given default (“LGD”), with the timing of the loss also
considered, and is estimated by incorporating forward-looking economic information and through the use of experienced credit judgment to reflect
factors not captured in ECL models.
The PD represents the likelihood that a loan will not be repaid and will go into default in either a 12 month horizon for Stage 1 or lifetime horizon
for Stage 2. The PD for each individual instrument is modelled based on historic data and is estimated based on current market conditions and
reasonable and supportable information about future economic conditions.
EAD is modelled on historic data and represents an estimate of the outstanding amount of credit exposure at the time a default may occur. For off-
balance sheet and undrawn amounts, EAD includes an estimate of any further amounts to be drawn at the time of default.
LGD is the amount that may not be recovered in the event of default and is modelled based on historic data and reasonable and supportable
information about future economic conditions, where appropriate. LGD takes into consideration the amount and quality of any collateral held.
We consider past events, current market conditions and reasonable forward-looking supportable information about future economic conditions in
calculating the amount of expected losses. In assessing information about possible future economic conditions, we utilized multiple economic scenarios
including our base case, which represents the most probable outcome and is consistent with our strategic plan, as well as benign and adverse
forecasts, all of which are developed by our Economics group. Key economic variables used in the determination of the allowance for credit losses
reflect the geographic diversity of our portfolios, where appropriate.
In considering the lifetime of a loan, the contractual period of the loan, including prepayment, extension and other options is generally used. For
revolving instruments, such as credit cards, which may not have a defined contractual period, the lifetime is based on historical behaviour.
Our ECL methodology also requires the use of experienced credit judgment to incorporate the estimated impact of factors that are not captured in
the modelled ECL results.
Allowance on Impaired Loans We maintain an allowance for impaired loans (Stage 3) to reduce their carrying value to the expected recoverable amount of $1,761 million ($1,827
million as at October 31, 2017). These allowances are recorded for individually identified impaired loans to reduce their carrying value to the expected
recoverable amount. We review our loans on an ongoing basis to assess whether any loans should be classified as impaired and whether an allowance
or write-off should be recorded (excluding credit card loans, which are classified as impaired and written off when principal or interest payments are
180 days past due). The review of individually significant problem loans is conducted at least quarterly by the account managers, each of whom
assesses the ultimate collectability and estimated recoveries for a specific loan based on all events and conditions that are relevant to the loan. This
assessment is then reviewed and approved by an independent credit officer.
Individually Significant Impaired Loans
To determine the amount we expect to recover from an individually significant impaired loan, we use the value of the estimated future cash flows
discounted at the loan’s original effective interest rate. The determination of estimated future cash flows of a collateralized impaired loan reflects the
expected realization of the underlying security, net of expected costs and any amounts legally required to be paid to the borrower. Security can vary
by type of loan and may include cash, securities, real properties, accounts receivable, guarantees, inventory or other capital assets.
Individually Insignificant Impaired Loans
Residential mortgages, consumer instalment and other personal loans are individually insignificant and may be individually assessed or collectively
assessed for losses at the time of impairment, taking into account historical loss experience and expectations of future economic conditions.
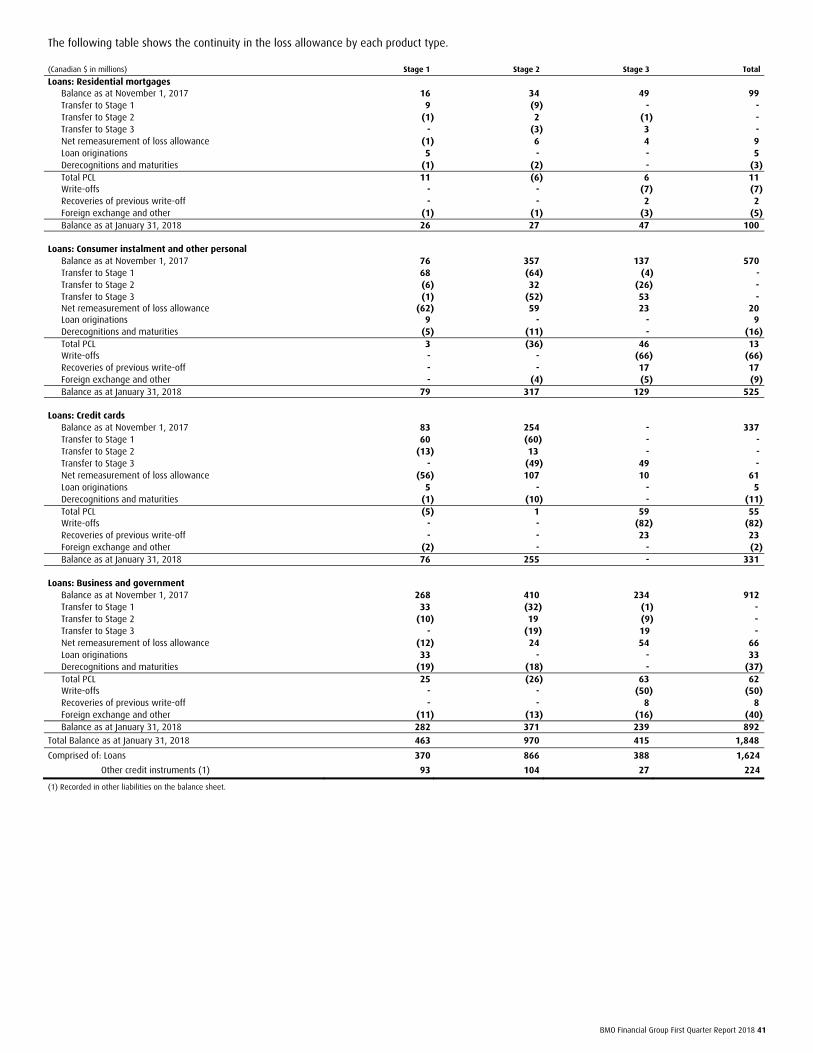
BMO Financial Group First Quarter Report 2018 41
The following table shows the continuity in the loss allowance by each product type.
(Canadian $ in millions) Stage 1 Stage 2 Stage 3 Total
Loans: Residential mortgages Balance as at November 1, 2017 16 34 49 99 Transfer to Stage 1 9 (9) - - Transfer to Stage 2 (1) 2 (1) - Transfer to Stage 3 - (3) 3 - Net remeasurement of loss allowance (1) 6 4 9 Loan originations 5 - - 5 Derecognitions and maturities (1) (2) - (3) Total PCL 11 (6) 6 11 Write-offs - - (7) (7) Recoveries of previous write-off - - 2 2 Foreign exchange and other (1) (1) (3) (5) Balance as at January 31, 2018 26 27 47 100
Loans: Consumer instalment and other personal Balance as at November 1, 2017 76 357 137 570 Transfer to Stage 1 68 (64) (4) - Transfer to Stage 2 (6) 32 (26) - Transfer to Stage 3 (1) (52) 53 - Net remeasurement of loss allowance (62) 59 23 20 Loan originations 9 - - 9 Derecognitions and maturities (5) (11) - (16) Total PCL 3 (36) 46 13 Write-offs - - (66) (66) Recoveries of previous write-off - - 17 17 Foreign exchange and other - (4) (5) (9) Balance as at January 31, 2018 79 317 129 525
Loans: Credit cards Balance as at November 1, 2017 83 254 - 337 Transfer to Stage 1 60 (60) - - Transfer to Stage 2 (13) 13 - - Transfer to Stage 3 - (49) 49 - Net remeasurement of loss allowance (56) 107 10 61 Loan originations 5 - - 5 Derecognitions and maturities (1) (10) - (11) Total PCL (5) 1 59 55 Write-offs - - (82) (82) Recoveries of previous write-off - - 23 23 Foreign exchange and other (2) - - (2) Balance as at January 31, 2018 76 255 - 331
Loans: Business and government Balance as at November 1, 2017 268 410 234 912 Transfer to Stage 1 33 (32) (1) - Transfer to Stage 2 (10) 19 (9) - Transfer to Stage 3 - (19) 19 - Net remeasurement of loss allowance (12) 24 54 66 Loan originations 33 - - 33 Derecognitions and maturities (19) (18) - (37) Total PCL 25 (26) 63 62 Write-offs - - (50) (50) Recoveries of previous write-off - - 8 8 Foreign exchange and other (11) (13) (16) (40) Balance as at January 31, 2018 282 371 239 892
Total Balance as at January 31, 2018 463 970 415 1,848
Comprised of: Loans 370 866 388 1,624
Other credit instruments (1) 93 104 27 224
(1) Recorded in other liabilities on the balance sheet.
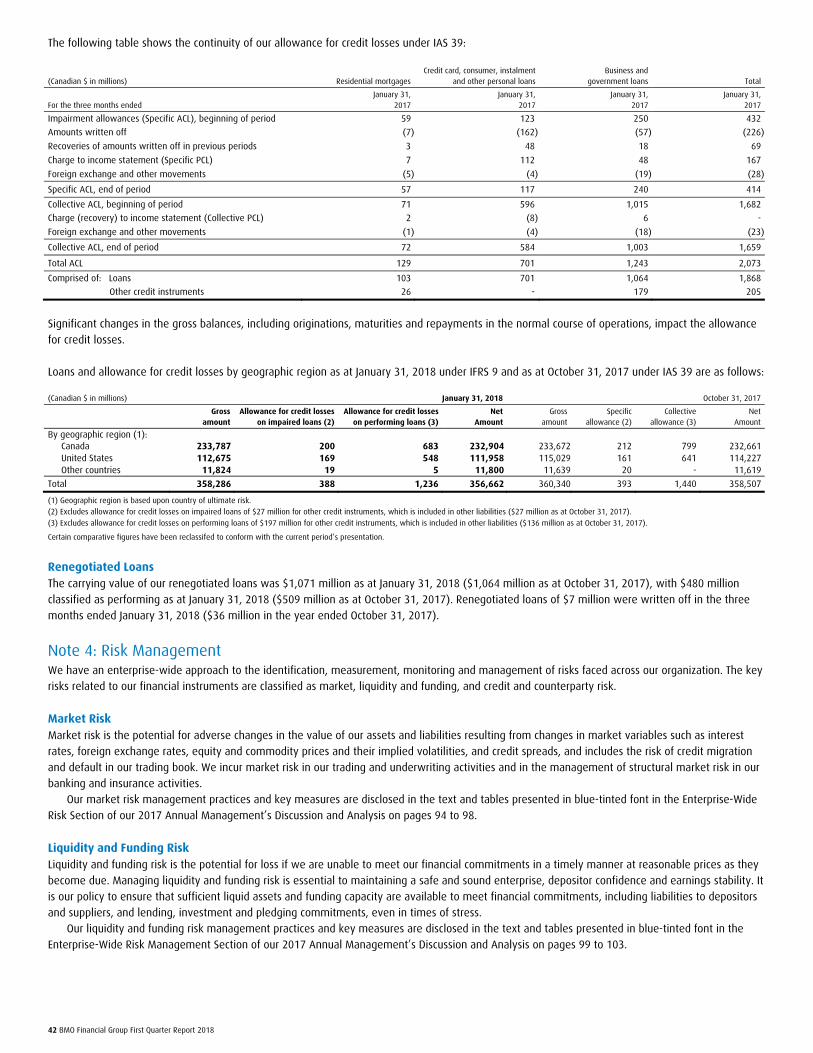
42 BMO Financial Group First Quarter Report 2018
The following table shows the continuity of our allowance for credit losses under IAS 39:
Credit card, consumer, instalment Business and (Canadian $ in millions) Residential mortgages and other personal loans government loans Total
January 31, January 31, January 31, January 31, For the three months ended 2017 2017 2017 2017
Impairment allowances (Specific ACL), beginning of period 59 123 250 432
Amounts written off (7) (162) (57) (226)
Recoveries of amounts written off in previous periods 3 48 18 69
Charge to income statement (Specific PCL) 7 112 48 167
Foreign exchange and other movements (5) (4) (19) (28)
Specific ACL, end of period 57 117 240 414
Collective ACL, beginning of period 71 596 1,015 1,682
Charge (recovery) to income statement (Collective PCL) 2 (8) 6 -
Foreign exchange and other movements (1) (4) (18) (23)
Collective ACL, end of period 72 584 1,003 1,659
Total ACL 129 701 1,243 2,073
Comprised of: Loans 103 701 1,064 1,868
Other credit instruments 26 - 179 205
Significant changes in the gross balances, including originations, maturities and repayments in the normal course of operations, impact the allowance
for credit losses.
Loans and allowance for credit losses by geographic region as at January 31, 2018 under IFRS 9 and as at October 31, 2017 under IAS 39 are as follows:
(Canadian $ in millions) January 31, 2018 October 31, 2017
Gross Allowance for credit losses Allowance for credit losses Net Gross Specific Collective Net amount on impaired loans (2) on performing loans (3) Amount amount allowance (2) allowance (3) Amount
By geographic region (1): Canada 233,787 200 683 232,904 233,672 212 799 232,661 United States 112,675 169 548 111,958 115,029 161 641 114,227 Other countries 11,824 19 5 11,800 11,639 20 - 11,619
Total 358,286 388 1,236 356,662 360,340 393 1,440 358,507
(1) Geographic region is based upon country of ultimate risk.
(2) Excludes allowance for credit losses on impaired loans of $27 million for other credit instruments, which is included in other liabilities ($27 million as at October 31, 2017).
(3) Excludes allowance for credit losses on performing loans of $197 million for other credit instruments, which is included in other liabilities ($136 million as at October 31, 2017).
Certain comparative figures have been reclassifed to conform with the current period’s presentation.
Renegotiated Loans
The carrying value of our renegotiated loans was $1,071 million as at January 31, 2018 ($1,064 million as at October 31, 2017), with $480 million
classified as performing as at January 31, 2018 ($509 million as at October 31, 2017). Renegotiated loans of $7 million were written off in the three
months ended January 31, 2018 ($36 million in the year ended October 31, 2017).
Note 4: Risk Management We have an enterprise-wide approach to the identification, measurement, monitoring and management of risks faced across our organization. The key
risks related to our financial instruments are classified as market, liquidity and funding, and credit and counterparty risk.
Market Risk
Market risk is the potential for adverse changes in the value of our assets and liabilities resulting from changes in market variables such as interest
rates, foreign exchange rates, equity and commodity prices and their implied volatilities, and credit spreads, and includes the risk of credit migration
and default in our trading book. We incur market risk in our trading and underwriting activities and in the management of structural market risk in our
banking and insurance activities.
Our market risk management practices and key measures are disclosed in the text and tables presented in blue-tinted font in the Enterprise-Wide
Risk Section of our 2017 Annual Management’s Discussion and Analysis on pages 94 to 98.
Liquidity and Funding Risk
Liquidity and funding risk is the potential for loss if we are unable to meet our financial commitments in a timely manner at reasonable prices as they
become due. Managing liquidity and funding risk is essential to maintaining a safe and sound enterprise, depositor confidence and earnings stability. It
is our policy to ensure that sufficient liquid assets and funding capacity are available to meet financial commitments, including liabilities to depositors
and suppliers, and lending, investment and pledging commitments, even in times of stress.
Our liquidity and funding risk management practices and key measures are disclosed in the text and tables presented in blue-tinted font in the
Enterprise-Wide Risk Management Section of our 2017 Annual Management’s Discussion and Analysis on pages 99 to 103.
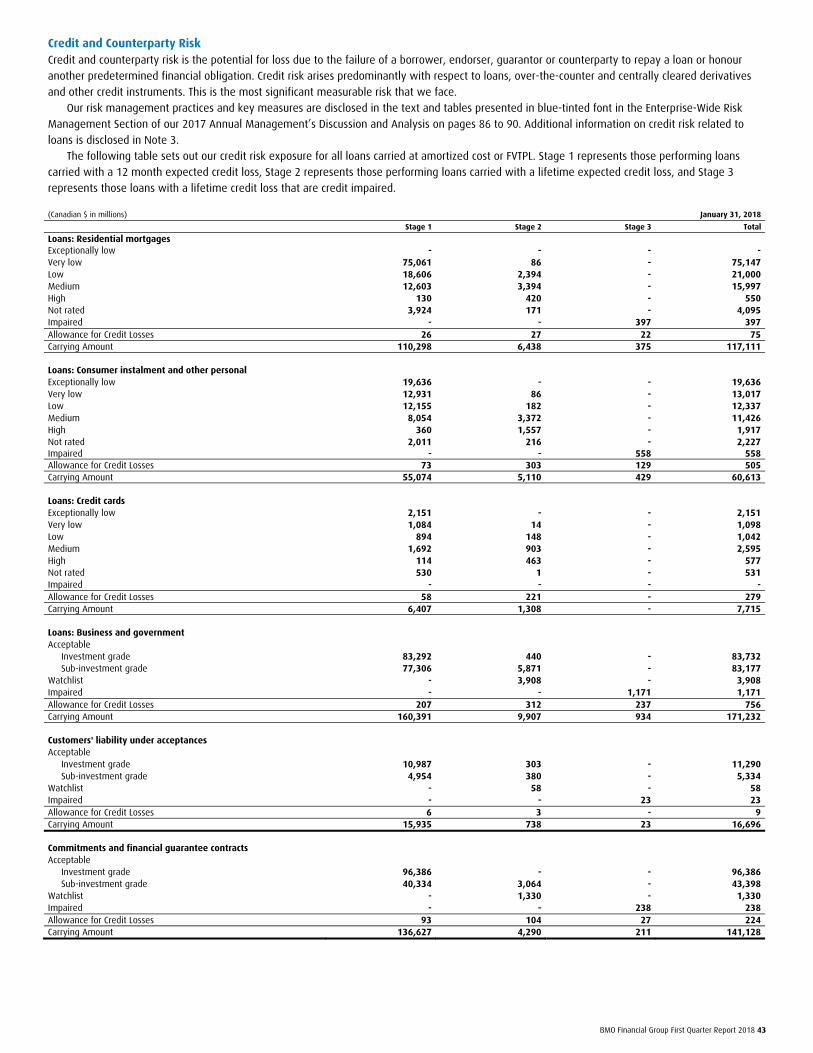
BMO Financial Group First Quarter Report 2018 43
Credit and Counterparty Risk
Credit and counterparty risk is the potential for loss due to the failure of a borrower, endorser, guarantor or counterparty to repay a loan or honour
another predetermined financial obligation. Credit risk arises predominantly with respect to loans, over-the-counter and centrally cleared derivatives
and other credit instruments. This is the most significant measurable risk that we face.
Our risk management practices and key measures are disclosed in the text and tables presented in blue-tinted font in the Enterprise-Wide Risk
Management Section of our 2017 Annual Management’s Discussion and Analysis on pages 86 to 90. Additional information on credit risk related to
loans is disclosed in Note 3.
The following table sets out our credit risk exposure for all loans carried at amortized cost or FVTPL. Stage 1 represents those performing loans
carried with a 12 month expected credit loss, Stage 2 represents those performing loans carried with a lifetime expected credit loss, and Stage 3
represents those loans with a lifetime credit loss that are credit impaired.
(Canadian $ in millions) January 31, 2018
Stage 1 Stage 2 Stage 3 Total
Loans: Residential mortgages Exceptionally low - - - - Very low 75,061 86 - 75,147 Low 18,606 2,394 - 21,000 Medium 12,603 3,394 - 15,997 High 130 420 - 550 Not rated 3,924 171 - 4,095 Impaired - - 397 397 Allowance for Credit Losses 26 27 22 75 Carrying Amount 110,298 6,438 375 117,111
Loans: Consumer instalment and other personal Exceptionally low 19,636 - - 19,636 Very low 12,931 86 - 13,017 Low 12,155 182 - 12,337 Medium 8,054 3,372 - 11,426 High 360 1,557 - 1,917 Not rated 2,011 216 - 2,227 Impaired - - 558 558 Allowance for Credit Losses 73 303 129 505 Carrying Amount 55,074 5,110 429 60,613
Loans: Credit cards Exceptionally low 2,151 - - 2,151 Very low 1,084 14 - 1,098 Low 894 148 - 1,042 Medium 1,692 903 - 2,595 High 114 463 - 577 Not rated 530 1 - 531 Impaired - - - - Allowance for Credit Losses 58 221 - 279 Carrying Amount 6,407 1,308 - 7,715
Loans: Business and government Acceptable
Investment grade 83,292 440 - 83,732 Sub-investment grade 77,306 5,871 - 83,177
Watchlist - 3,908 - 3,908 Impaired - - 1,171 1,171 Allowance for Credit Losses 207 312 237 756 Carrying Amount 160,391 9,907 934 171,232
Customers' liability under acceptances Acceptable
Investment grade 10,987 303 - 11,290 Sub-investment grade 4,954 380 - 5,334
Watchlist - 58 - 58 Impaired - - 23 23 Allowance for Credit Losses 6 3 - 9 Carrying Amount 15,935 738 23 16,696
Commitments and financial guarantee contracts Acceptable
Investment grade 96,386 - - 96,386 Sub-investment grade 40,334 3,064 - 43,398
Watchlist - 1,330 - 1,330 Impaired - - 238 238 Allowance for Credit Losses 93 104 27 224 Carrying Amount 136,627 4,290 211 141,128
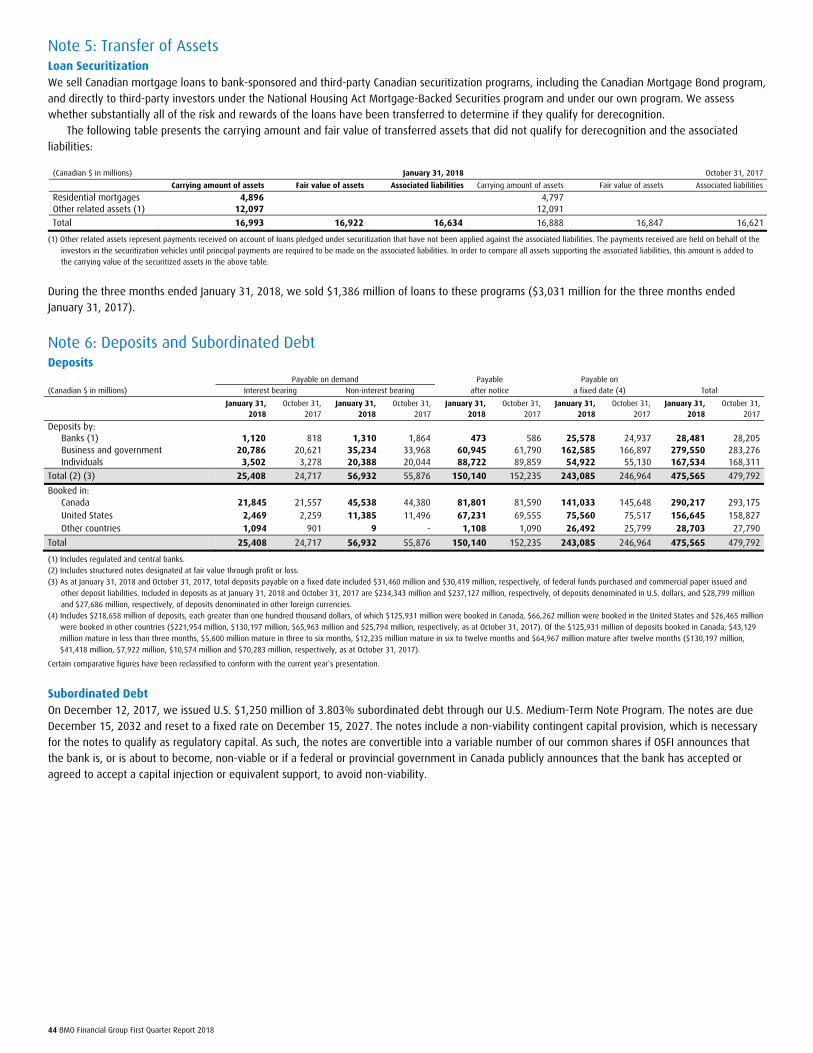
44 BMO Financial Group First Quarter Report 2018
Note 5: Transfer of Assets Loan Securitization
We sell Canadian mortgage loans to bank-sponsored and third-party Canadian securitization programs, including the Canadian Mortgage Bond program,
and directly to third-party investors under the National Housing Act Mortgage-Backed Securities program and under our own program. We assess
whether substantially all of the risk and rewards of the loans have been transferred to determine if they qualify for derecognition.
The following table presents the carrying amount and fair value of transferred assets that did not qualify for derecognition and the associated
liabilities:
(Canadian $ in millions) January 31, 2018 October 31, 2017
Carrying amount of assets Fair value of assets Associated liabilities Carrying amount of assets Fair value of assets Associated liabilities
Residential mortgages 4,896 4,797 Other related assets (1) 12,097 12,091
Total 16,993 16,922 16,634 16,888 16,847 16,621
(1) Other related assets represent payments received on account of loans pledged under securitization that have not been applied against the associated liabilities. The payments received are held on behalf of the
investors in the securitization vehicles until principal payments are required to be made on the associated liabilities. In order to compare all assets supporting the associated liabilities, this amount is added to
the carrying value of the securitized assets in the above table.
During the three months ended January 31, 2018, we sold $1,386 million of loans to these programs ($3,031 million for the three months ended
January 31, 2017).
Note 6: Deposits and Subordinated Debt Deposits Payable on demand Payable Payable on
(Canadian $ in millions) Interest bearing Non-interest bearing after notice a fixed date (4) Total
January 31, October 31, January 31, October 31, January 31, October 31, January 31, October 31, January 31, October 31, 2018 2017 2018 2017 2018 2017 2018 2017 2018 2017
Deposits by: Banks (1) 1,120 818 1,310 1,864 473 586 25,578 24,937 28,481 28,205 Business and government 20,786 20,621 35,234 33,968 60,945 61,790 162,585 166,897 279,550 283,276 Individuals 3,502 3,278 20,388 20,044 88,722 89,859 54,922 55,130 167,534 168,311
Total (2) (3) 25,408 24,717 56,932 55,876 150,140 152,235 243,085 246,964 475,565 479,792
Booked in: Canada 21,845 21,557 45,538 44,380 81,801 81,590 141,033 145,648 290,217 293,175
United States 2,469 2,259 11,385 11,496 67,231 69,555 75,560 75,517 156,645 158,827
Other countries 1,094 901 9 - 1,108 1,090 26,492 25,799 28,703 27,790
Total 25,408 24,717 56,932 55,876 150,140 152,235 243,085 246,964 475,565 479,792
(1) Includes regulated and central banks.
(2) Includes structured notes designated at fair value through profit or loss.
(3) As at January 31, 2018 and October 31, 2017, total deposits payable on a fixed date included $31,460 million and $30,419 million, respectively, of federal funds purchased and commercial paper issued and
other deposit liabilities. Included in deposits as at January 31, 2018 and October 31, 2017 are $234,343 million and $237,127 million, respectively, of deposits denominated in U.S. dollars, and $28,799 million
and $27,686 million, respectively, of deposits denominated in other foreign currencies.
(4) Includes $218,658 million of deposits, each greater than one hundred thousand dollars, of which $125,931 million were booked in Canada, $66,262 million were booked in the United States and $26,465 million
were booked in other countries ($221,954 million, $130,197 million, $65,963 million and $25,794 million, respectively, as at October 31, 2017). Of the $125,931 million of deposits booked in Canada, $43,129
million mature in less than three months, $5,600 million mature in three to six months, $12,235 million mature in six to twelve months and $64,967 million mature after twelve months ($130,197 million,
$41,418 million, $7,922 million, $10,574 million and $70,283 million, respectively, as at October 31, 2017).
Certain comparative figures have been reclassified to conform with the current year’s presentation.
Subordinated Debt
On December 12, 2017, we issued U.S. $1,250 million of 3.803% subordinated debt through our U.S. Medium-Term Note Program. The notes are due
December 15, 2032 and reset to a fixed rate on December 15, 2027. The notes include a non-viability contingent capital provision, which is necessary
for the notes to qualify as regulatory capital. As such, the notes are convertible into a variable number of our common shares if OSFI announces that
the bank is, or is about to become, non-viable or if a federal or provincial government in Canada publicly announces that the bank has accepted or
agreed to accept a capital injection or equivalent support, to avoid non-viability.
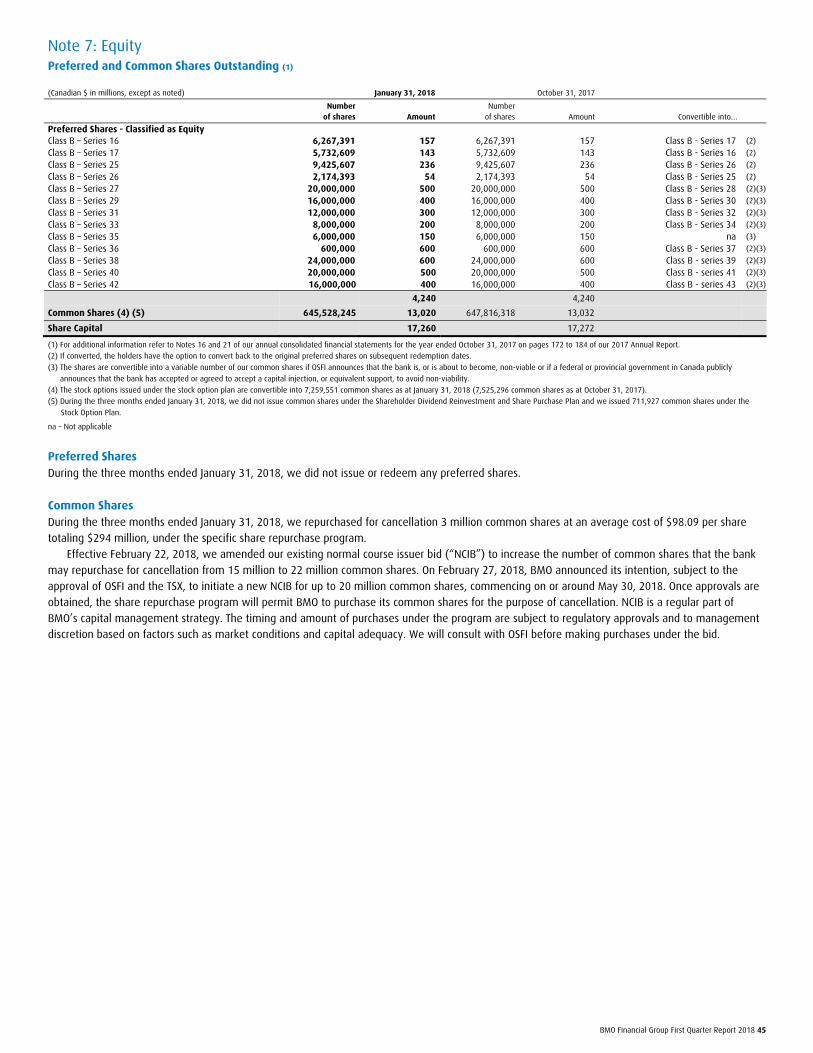
BMO Financial Group First Quarter Report 2018 45
Note 7: Equity Preferred and Common Shares Outstanding (1)
(Canadian $ in millions, except as noted) January 31, 2018 October 31, 2017
Number Number
of shares Amount of shares Amount Convertible into…
Preferred Shares - Classified as Equity Class B – Series 16 6,267,391 157 6,267,391 157 Class B - Series 17 (2)
Class B – Series 17 5,732,609 143 5,732,609 143 Class B - Series 16 (2)
Class B – Series 25 9,425,607 236 9,425,607 236 Class B - Series 26 (2)
Class B – Series 26 2,174,393 54 2,174,393 54 Class B - Series 25 (2)
Class B – Series 27 20,000,000 500 20,000,000 500 Class B - Series 28 (2)(3)
Class B – Series 29 16,000,000 400 16,000,000 400 Class B - Series 30 (2)(3)
Class B – Series 31 12,000,000 300 12,000,000 300 Class B - Series 32 (2)(3)
Class B – Series 33 8,000,000 200 8,000,000 200 Class B - Series 34 (2)(3)
Class B – Series 35 6,000,000 150 6,000,000 150 na (3)
Class B – Series 36 600,000 600 600,000 600 Class B - Series 37 (2)(3)
Class B – Series 38 24,000,000 600 24,000,000 600 Class B - series 39 (2)(3)
Class B – Series 40 20,000,000 500 20,000,000 500 Class B - series 41 (2)(3)
Class B – Series 42 16,000,000 400 16,000,000 400 Class B - series 43 (2)(3)
4,240 4,240
Common Shares (4) (5) 645,528,245 13,020 647,816,318 13,032
Share Capital 17,260 17,272
(1) For additional information refer to Notes 16 and 21 of our annual consolidated financial statements for the year ended October 31, 2017 on pages 172 to 184 of our 2017 Annual Report.
(2) If converted, the holders have the option to convert back to the original preferred shares on subsequent redemption dates.
(3) The shares are convertible into a variable number of our common shares if OSFI announces that the bank is, or is about to become, non-viable or if a federal or provincial government in Canada publicly
announces that the bank has accepted or agreed to accept a capital injection, or equivalent support, to avoid non-viability.
(4) The stock options issued under the stock option plan are convertible into 7,259,551 common shares as at January 31, 2018 (7,525,296 common shares as at October 31, 2017).
(5) During the three months ended January 31, 2018, we did not issue common shares under the Shareholder Dividend Reinvestment and Share Purchase Plan and we issued 711,927 common shares under the
Stock Option Plan.
na – Not applicable
Preferred Shares
During the three months ended January 31, 2018, we did not issue or redeem any preferred shares.
Common Shares
During the three months ended January 31, 2018, we repurchased for cancellation 3 million common shares at an average cost of $98.09 per share
totaling $294 million, under the specific share repurchase program.
Effective February 22, 2018, we amended our existing normal course issuer bid (“NCIB”) to increase the number of common shares that the bank
may repurchase for cancellation from 15 million to 22 million common shares. On February 27, 2018, BMO announced its intention, subject to the
approval of OSFI and the TSX, to initiate a new NCIB for up to 20 million common shares, commencing on or around May 30, 2018. Once approvals are
obtained, the share repurchase program will permit BMO to purchase its common shares for the purpose of cancellation. NCIB is a regular part of
BMO’s capital management strategy. The timing and amount of purchases under the program are subject to regulatory approvals and to management
discretion based on factors such as market conditions and capital adequacy. We will consult with OSFI before making purchases under the bid.
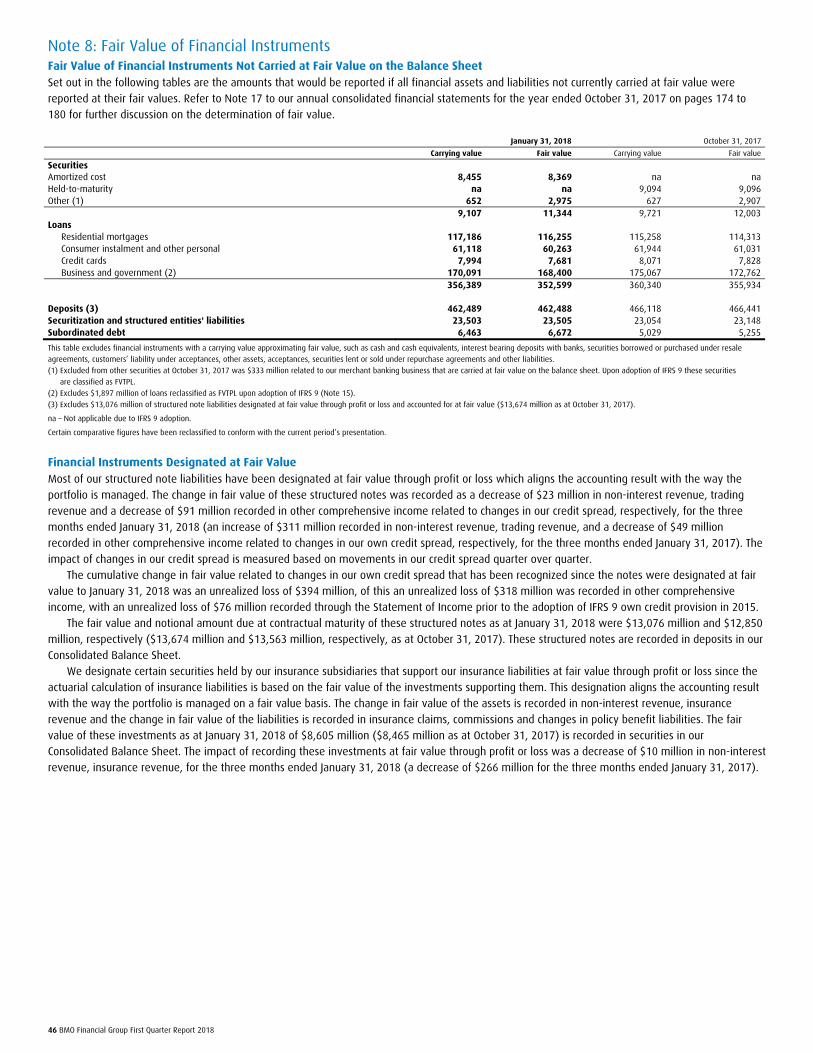
46 BMO Financial Group First Quarter Report 2018
Note 8: Fair Value of Financial Instruments Fair Value of Financial Instruments Not Carried at Fair Value on the Balance Sheet
Set out in the following tables are the amounts that would be reported if all financial assets and liabilities not currently carried at fair value were
reported at their fair values. Refer to Note 17 to our annual consolidated financial statements for the year ended October 31, 2017 on pages 174 to
180 for further discussion on the determination of fair value.
January 31, 2018 October 31, 2017
Carrying value Fair value Carrying value Fair value
Securities Amortized cost 8,455 8,369 na na Held-to-maturity na na 9,094 9,096 Other (1) 652 2,975 627 2,907 9,107 11,344 9,721 12,003 Loans
Residential mortgages 117,186 116,255 115,258 114,313 Consumer instalment and other personal 61,118 60,263 61,944 61,031 Credit cards 7,994 7,681 8,071 7,828 Business and government (2) 170,091 168,400 175,067 172,762
356,389 352,599 360,340 355,934 Deposits (3) 462,489 462,488 466,118 466,441 Securitization and structured entities' liabilities 23,503 23,505 23,054 23,148 Subordinated debt 6,463 6,672 5,029 5,255
This table excludes financial instruments with a carrying value approximating fair value, such as cash and cash equivalents, interest bearing deposits with banks, securities borrowed or purchased under resale
agreements, customers’ liability under acceptances, other assets, acceptances, securities lent or sold under repurchase agreements and other liabilities.
(1) Excluded from other securities at October 31, 2017 was $333 million related to our merchant banking business that are carried at fair value on the balance sheet. Upon adoption of IFRS 9 these securities
are classified as FVTPL.
(2) Excludes $1,897 million of loans reclassified as FVTPL upon adoption of IFRS 9 (Note 15).
(3) Excludes $13,076 million of structured note liabilities designated at fair value through profit or loss and accounted for at fair value ($13,674 million as at October 31, 2017).
na – Not applicable due to IFRS 9 adoption.
Certain comparative figures have been reclassified to conform with the current period’s presentation.
Financial Instruments Designated at Fair Value
Most of our structured note liabilities have been designated at fair value through profit or loss which aligns the accounting result with the way the
portfolio is managed. The change in fair value of these structured notes was recorded as a decrease of $23 million in non-interest revenue, trading
revenue and a decrease of $91 million recorded in other comprehensive income related to changes in our credit spread, respectively, for the three
months ended January 31, 2018 (an increase of $311 million recorded in non-interest revenue, trading revenue, and a decrease of $49 million
recorded in other comprehensive income related to changes in our own credit spread, respectively, for the three months ended January 31, 2017). The
impact of changes in our credit spread is measured based on movements in our credit spread quarter over quarter.
The cumulative change in fair value related to changes in our own credit spread that has been recognized since the notes were designated at fair
value to January 31, 2018 was an unrealized loss of $394 million, of this an unrealized loss of $318 million was recorded in other comprehensive
income, with an unrealized loss of $76 million recorded through the Statement of Income prior to the adoption of IFRS 9 own credit provision in 2015.
The fair value and notional amount due at contractual maturity of these structured notes as at January 31, 2018 were $13,076 million and $12,850
million, respectively ($13,674 million and $13,563 million, respectively, as at October 31, 2017). These structured notes are recorded in deposits in our
Consolidated Balance Sheet.
We designate certain securities held by our insurance subsidiaries that support our insurance liabilities at fair value through profit or loss since the
actuarial calculation of insurance liabilities is based on the fair value of the investments supporting them. This designation aligns the accounting result
with the way the portfolio is managed on a fair value basis. The change in fair value of the assets is recorded in non-interest revenue, insurance
revenue and the change in fair value of the liabilities is recorded in insurance claims, commissions and changes in policy benefit liabilities. The fair
value of these investments as at January 31, 2018 of $8,605 million ($8,465 million as at October 31, 2017) is recorded in securities in our
Consolidated Balance Sheet. The impact of recording these investments at fair value through profit or loss was a decrease of $10 million in non-interest
revenue, insurance revenue, for the three months ended January 31, 2018 (a decrease of $266 million for the three months ended January 31, 2017).

BMO Financial Group First Quarter Report 2018 47
We designate the obligation related to certain investment contracts in our insurance business at fair value through profit or loss, which eliminates
a measurement inconsistency that would otherwise arise from measuring the investment contract liabilities and offsetting changes in the fair value of
the investments supporting them on a different basis. The fair value of these investment contract liabilities as at January 31, 2018 of $765 million
($749 million as at October 31, 2017) is recorded in other liabilities in our Consolidated Balance Sheet. The change in fair value of these investment
contract liabilities resulted in a decrease of $14 million in insurance claims, commissions, and changes in policy benefit liabilities for the three months
ended January 31, 2018 (a decrease of $38 million for the three months ended January 31, 2017). For the three months ended January 31, 2018, a
decrease of $9 million was recorded in other comprehensive income related to changes in our own credit spread (a decrease of $9 million for the
three months ended January 31, 2017). Changes in the fair value of investments backing these investment contract liabilities are recorded in non-
interest revenue, insurance revenue. The impact of changes in our credit spread is measured based on movements in our credit spread quarter over
quarter.
Fair Value Hierarchy
We use a fair value hierarchy to categorize financial instruments according to the inputs we use in valuation techniques to measure fair value.
Valuation Techniques and Significant Inputs
We determine the fair value of publicly traded fixed maturity and equity securities using quoted prices in active markets (Level 1) when these are
available. When quoted prices in active markets are not available, we determine the fair value of financial instruments using models such as
discounted cash flows with observable market data for inputs such as yield and prepayment rates or broker quotes and other third-party vendor quotes
(Level 2). Fair value may also be determined using models where significant market inputs are not observable due to inactive markets or minimal
market activity (Level 3). We maximize the use of market inputs to the extent possible.
Our Level 2 trading and FVTPL securities are primarily valued using discounted cash flow models with observable spreads or broker quotes. The fair
value of Level 2 FVOCI securities, previously available-for-sale securities, is determined using discounted cash flow models with observable spreads or
third-party vendor quotes. Level 2 structured note liabilities are valued using models with observable market information. Level 2 derivative assets and
liabilities are valued using industry standard models and observable market information.
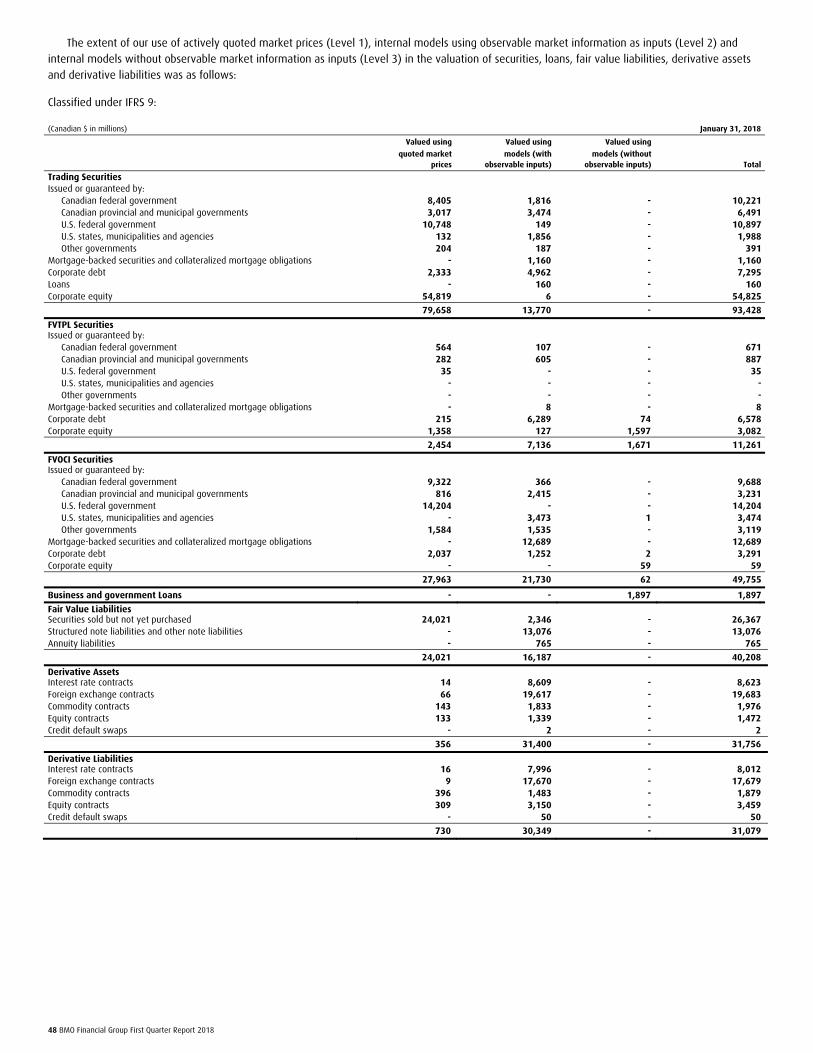
48 BMO Financial Group First Quarter Report 2018
The extent of our use of actively quoted market prices (Level 1), internal models using observable market information as inputs (Level 2) and
internal models without observable market information as inputs (Level 3) in the valuation of securities, loans, fair value liabilities, derivative assets
and derivative liabilities was as follows:
Classified under IFRS 9:
(Canadian $ in millions) January 31, 2018
Valued using Valued using Valued using quoted market models (with models (without
prices observable inputs) observable inputs) Total
Trading Securities Issued or guaranteed by:
Canadian federal government 8,405 1,816 - 10,221 Canadian provincial and municipal governments 3,017 3,474 - 6,491 U.S. federal government 10,748 149 - 10,897 U.S. states, municipalities and agencies 132 1,856 - 1,988 Other governments 204 187 - 391
Mortgage-backed securities and collateralized mortgage obligations - 1,160 - 1,160 Corporate debt 2,333 4,962 - 7,295 Loans - 160 - 160 Corporate equity 54,819 6 - 54,825
79,658 13,770 - 93,428
FVTPL Securities Issued or guaranteed by:
Canadian federal government 564 107 - 671 Canadian provincial and municipal governments 282 605 - 887 U.S. federal government 35 - - 35 U.S. states, municipalities and agencies - - - - Other governments - - - -
Mortgage-backed securities and collateralized mortgage obligations - 8 - 8 Corporate debt 215 6,289 74 6,578 Corporate equity 1,358 127 1,597 3,082
2,454 7,136 1,671 11,261
FVOCI Securities Issued or guaranteed by:
Canadian federal government 9,322 366 - 9,688 Canadian provincial and municipal governments 816 2,415 - 3,231 U.S. federal government 14,204 - - 14,204 U.S. states, municipalities and agencies - 3,473 1 3,474 Other governments 1,584 1,535 - 3,119
Mortgage-backed securities and collateralized mortgage obligations - 12,689 - 12,689 Corporate debt 2,037 1,252 2 3,291 Corporate equity - - 59 59
27,963 21,730 62 49,755
Business and government Loans - - 1,897 1,897
Fair Value Liabilities Securities sold but not yet purchased 24,021 2,346 - 26,367 Structured note liabilities and other note liabilities - 13,076 - 13,076 Annuity liabilities - 765 - 765
24,021 16,187 - 40,208
Derivative Assets Interest rate contracts 14 8,609 - 8,623 Foreign exchange contracts 66 19,617 - 19,683 Commodity contracts 143 1,833 - 1,976 Equity contracts 133 1,339 - 1,472 Credit default swaps - 2 - 2
356 31,400 - 31,756
Derivative Liabilities Interest rate contracts 16 7,996 - 8,012 Foreign exchange contracts 9 17,670 - 17,679 Commodity contracts 396 1,483 - 1,879 Equity contracts 309 3,150 - 3,459 Credit default swaps - 50 - 50
730 30,349 - 31,079
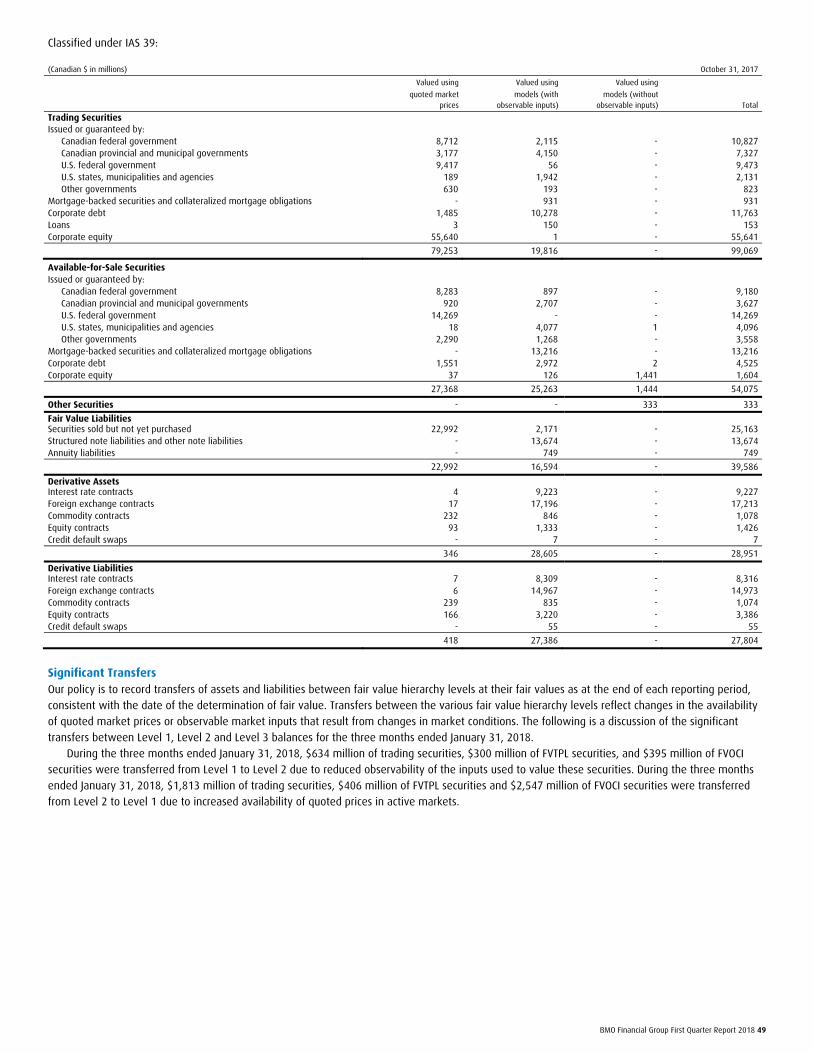
BMO Financial Group First Quarter Report 2018 49
Classified under IAS 39:
(Canadian $ in millions) October 31, 2017
Valued using Valued using Valued using quoted market models (with models (without
prices observable inputs) observable inputs) Total
Trading Securities Issued or guaranteed by:
Canadian federal government 8,712 2,115 - 10,827 Canadian provincial and municipal governments 3,177 4,150 - 7,327 U.S. federal government 9,417 56 - 9,473 U.S. states, municipalities and agencies 189 1,942 - 2,131 Other governments 630 193 - 823
Mortgage-backed securities and collateralized mortgage obligations - 931 - 931 Corporate debt 1,485 10,278 - 11,763 Loans 3 150 - 153 Corporate equity 55,640 1 - 55,641
79,253 19,816 - 99,069
Available-for-Sale Securities Issued or guaranteed by:
Canadian federal government 8,283 897 - 9,180 Canadian provincial and municipal governments 920 2,707 - 3,627 U.S. federal government 14,269 - - 14,269 U.S. states, municipalities and agencies 18 4,077 1 4,096 Other governments 2,290 1,268 - 3,558
Mortgage-backed securities and collateralized mortgage obligations - 13,216 - 13,216 Corporate debt 1,551 2,972 2 4,525 Corporate equity 37 126 1,441 1,604
27,368 25,263 1,444 54,075
Other Securities - - 333 333
Fair Value Liabilities Securities sold but not yet purchased 22,992 2,171 - 25,163 Structured note liabilities and other note liabilities - 13,674 - 13,674 Annuity liabilities - 749 - 749
22,992 16,594 - 39,586
Derivative Assets Interest rate contracts 4 9,223 - 9,227 Foreign exchange contracts 17 17,196 - 17,213 Commodity contracts 232 846 - 1,078 Equity contracts 93 1,333 - 1,426 Credit default swaps - 7 - 7
346 28,605 - 28,951
Derivative Liabilities Interest rate contracts 7 8,309 - 8,316 Foreign exchange contracts 6 14,967 - 14,973 Commodity contracts 239 835 - 1,074 Equity contracts 166 3,220 - 3,386 Credit default swaps - 55 - 55
418 27,386 - 27,804
Significant Transfers
Our policy is to record transfers of assets and liabilities between fair value hierarchy levels at their fair values as at the end of each reporting period,
consistent with the date of the determination of fair value. Transfers between the various fair value hierarchy levels reflect changes in the availability
of quoted market prices or observable market inputs that result from changes in market conditions. The following is a discussion of the significant
transfers between Level 1, Level 2 and Level 3 balances for the three months ended January 31, 2018.
During the three months ended January 31, 2018, $634 million of trading securities, $300 million of FVTPL securities, and $395 million of FVOCI
securities were transferred from Level 1 to Level 2 due to reduced observability of the inputs used to value these securities. During the three months
ended January 31, 2018, $1,813 million of trading securities, $406 million of FVTPL securities and $2,547 million of FVOCI securities were transferred
from Level 2 to Level 1 due to increased availability of quoted prices in active markets.
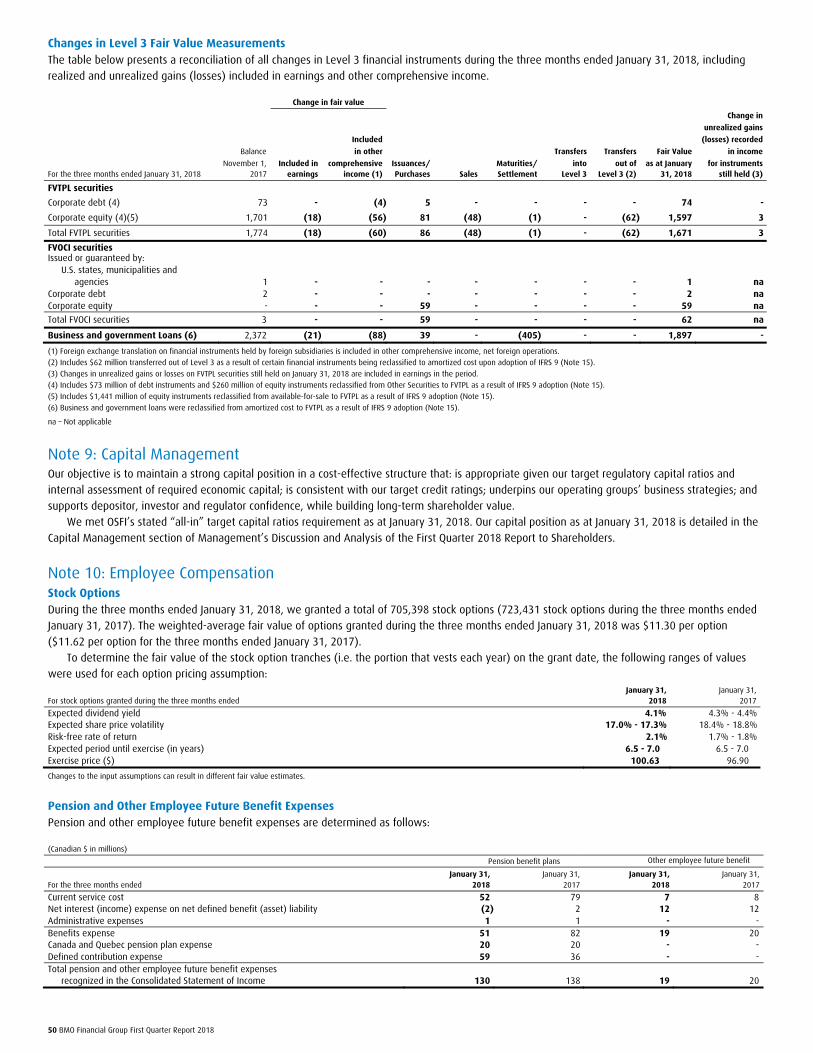
50 BMO Financial Group First Quarter Report 2018
Changes in Level 3 Fair Value Measurements
The table below presents a reconciliation of all changes in Level 3 financial instruments during the three months ended January 31, 2018, including
realized and unrealized gains (losses) included in earnings and other comprehensive income.
Change in fair value Change in
unrealized gains
Included (losses) recorded
Balance in other Transfers Transfers Fair Value in income
November 1, Included in comprehensive Issuances/ Maturities/ into out of as at January for instruments For the three months ended January 31, 2018 2017 earnings income (1) Purchases Sales Settlement Level 3 Level 3 (2) 31, 2018 still held (3)
FVTPL securities
Corporate debt (4) 73 - (4) 5 - - - - 74 -
Corporate equity (4)(5) 1,701 (18) (56) 81 (48) (1) - (62) 1,597 3
Total FVTPL securities 1,774 (18) (60) 86 (48) (1) - (62) 1,671 3
FVOCI securities Issued or guaranteed by:
U.S. states, municipalities and agencies 1 - - - - - - - 1 na
Corporate debt 2 - - - - - - - 2 na Corporate equity - - - 59 - - - - 59 na
Total FVOCI securities 3 - - 59 - - - - 62 na
Business and government Loans (6) 2,372 (21) (88) 39 - (405) - - 1,897 -
(1) Foreign exchange translation on financial instruments held by foreign subsidiaries is included in other comprehensive income, net foreign operations.
(2) Includes $62 million transferred out of Level 3 as a result of certain financial instruments being reclassified to amortized cost upon adoption of IFRS 9 (Note 15).
(3) Changes in unrealized gains or losses on FVTPL securities still held on January 31, 2018 are included in earnings in the period.
(4) Includes $73 million of debt instruments and $260 million of equity instruments reclassified from Other Securities to FVTPL as a result of IFRS 9 adoption (Note 15).
(5) Includes $1,441 million of equity instruments reclassified from available-for-sale to FVTPL as a result of IFRS 9 adoption (Note 15).
(6) Business and government loans were reclassified from amortized cost to FVTPL as a result of IFRS 9 adoption (Note 15).
na – Not applicable
Note 9: Capital Management Our objective is to maintain a strong capital position in a cost-effective structure that: is appropriate given our target regulatory capital ratios and
internal assessment of required economic capital; is consistent with our target credit ratings; underpins our operating groups’ business strategies; and
supports depositor, investor and regulator confidence, while building long-term shareholder value.
We met OSFI’s stated “all-in” target capital ratios requirement as at January 31, 2018. Our capital position as at January 31, 2018 is detailed in the
Capital Management section of Management’s Discussion and Analysis of the First Quarter 2018 Report to Shareholders.
Note 10: Employee Compensation Stock Options
During the three months ended January 31, 2018, we granted a total of 705,398 stock options (723,431 stock options during the three months ended
January 31, 2017). The weighted-average fair value of options granted during the three months ended January 31, 2018 was $11.30 per option
($11.62 per option for the three months ended January 31, 2017).
To determine the fair value of the stock option tranches (i.e. the portion that vests each year) on the grant date, the following ranges of values
were used for each option pricing assumption: January 31, January 31, For stock options granted during the three months ended 2018 2017
Expected dividend yield 4.1% 4.3% - 4.4% Expected share price volatility 17.0% - 17.3% 18.4% - 18.8% Risk-free rate of return 2.1% 1.7% - 1.8% Expected period until exercise (in years) 6.5 - 7.0 6.5 - 7.0 Exercise price ($) 100.63 96.90
Changes to the input assumptions can result in different fair value estimates.
Pension and Other Employee Future Benefit Expenses
Pension and other employee future benefit expenses are determined as follows:
(Canadian $ in millions)
Pension benefit plans Other employee future benefit l January 31, January 31, January 31, January 31,
For the three months ended 2018 2017 2018 2017
Current service cost 52 79 7 8 Net interest (income) expense on net defined benefit (asset) liability (2) 2 12 12 Administrative expenses 1 1 - - Benefits expense 51 82 19 20 Canada and Quebec pension plan expense 20 20 - - Defined contribution expense 59 36 - - Total pension and other employee future benefit expenses
recognized in the Consolidated Statement of Income 130 138 19 20
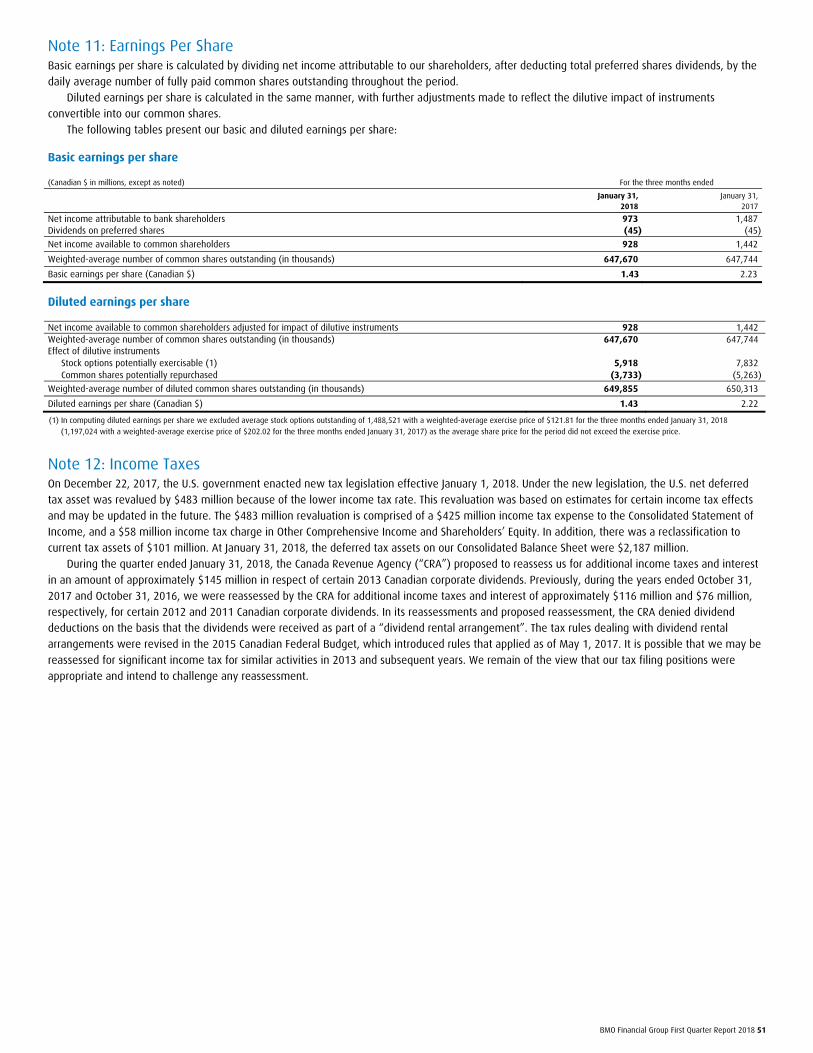
BMO Financial Group First Quarter Report 2018 51
Note 11: Earnings Per Share Basic earnings per share is calculated by dividing net income attributable to our shareholders, after deducting total preferred shares dividends, by the
daily average number of fully paid common shares outstanding throughout the period.
Diluted earnings per share is calculated in the same manner, with further adjustments made to reflect the dilutive impact of instruments
convertible into our common shares.
The following tables present our basic and diluted earnings per share:
Basic earnings per share (Canadian $ in millions, except as noted) For the three months ended
January 31, January 31, 2018 2017
Net income attributable to bank shareholders 973 1,487 Dividends on preferred shares (45) (45)
Net income available to common shareholders 928 1,442
Weighted-average number of common shares outstanding (in thousands) 647,670 647,744
Basic earnings per share (Canadian $) 1.43 2.23
Diluted earnings per share
Net income available to common shareholders adjusted for impact of dilutive instruments 928 1,442 Weighted-average number of common shares outstanding (in thousands) 647,670 647,744 Effect of dilutive instruments
Stock options potentially exercisable (1) 5,918 7,832 Common shares potentially repurchased (3,733) (5,263)
Weighted-average number of diluted common shares outstanding (in thousands) 649,855 650,313
Diluted earnings per share (Canadian $) 1.43 2.22
(1) In computing diluted earnings per share we excluded average stock options outstanding of 1,488,521 with a weighted-average exercise price of $121.81 for the three months ended January 31, 2018
(1,197,024 with a weighted-average exercise price of $202.02 for the three months ended January 31, 2017) as the average share price for the period did not exceed the exercise price.
Note 12: Income Taxes On December 22, 2017, the U.S. government enacted new tax legislation effective January 1, 2018. Under the new legislation, the U.S. net deferred
tax asset was revalued by $483 million because of the lower income tax rate. This revaluation was based on estimates for certain income tax effects
and may be updated in the future. The $483 million revaluation is comprised of a $425 million income tax expense to the Consolidated Statement of
Income, and a $58 million income tax charge in Other Comprehensive Income and Shareholders’ Equity. In addition, there was a reclassification to
current tax assets of $101 million. At January 31, 2018, the deferred tax assets on our Consolidated Balance Sheet were $2,187 million.
During the quarter ended January 31, 2018, the Canada Revenue Agency (“CRA”) proposed to reassess us for additional income taxes and interest
in an amount of approximately $145 million in respect of certain 2013 Canadian corporate dividends. Previously, during the years ended October 31,
2017 and October 31, 2016, we were reassessed by the CRA for additional income taxes and interest of approximately $116 million and $76 million,
respectively, for certain 2012 and 2011 Canadian corporate dividends. In its reassessments and proposed reassessment, the CRA denied dividend
deductions on the basis that the dividends were received as part of a “dividend rental arrangement”. The tax rules dealing with dividend rental
arrangements were revised in the 2015 Canadian Federal Budget, which introduced rules that applied as of May 1, 2017. It is possible that we may be
reassessed for significant income tax for similar activities in 2013 and subsequent years. We remain of the view that our tax filing positions were
appropriate and intend to challenge any reassessment.
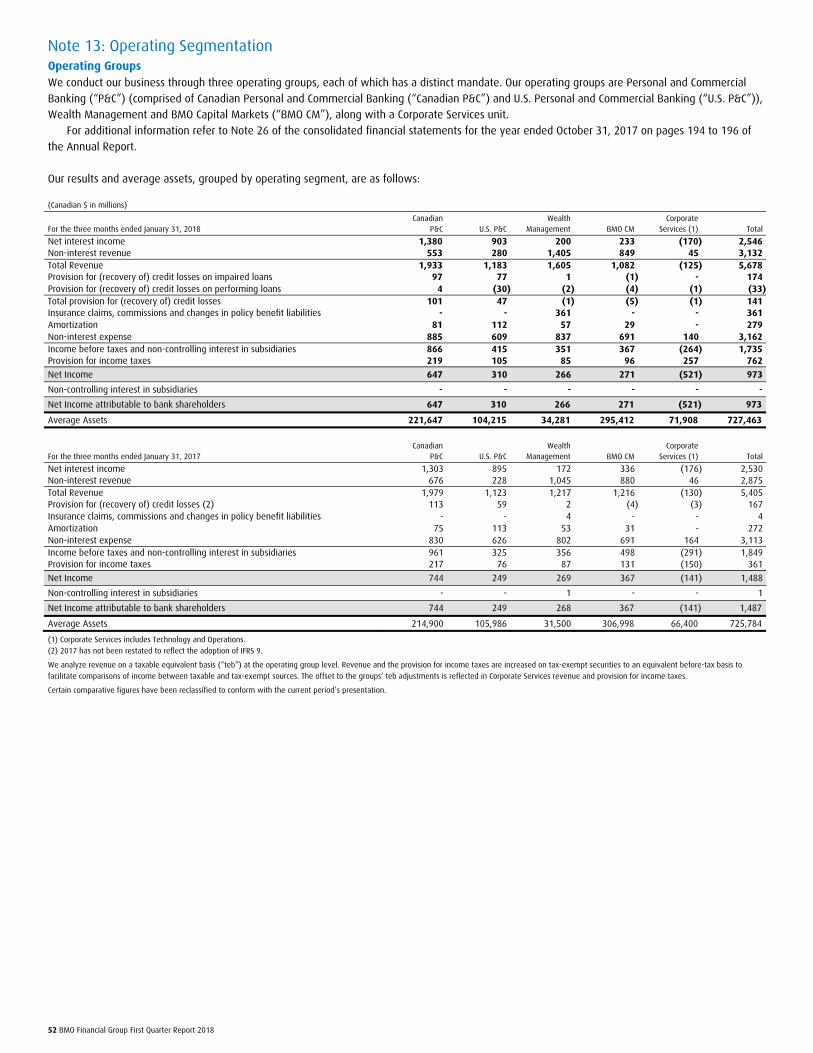
52 BMO Financial Group First Quarter Report 2018
Note 13: Operating Segmentation Operating Groups
We conduct our business through three operating groups, each of which has a distinct mandate. Our operating groups are Personal and Commercial
Banking (“P&C”) (comprised of Canadian Personal and Commercial Banking (“Canadian P&C”) and U.S. Personal and Commercial Banking (“U.S. P&C”)),
Wealth Management and BMO Capital Markets (“BMO CM”), along with a Corporate Services unit.
For additional information refer to Note 26 of the consolidated financial statements for the year ended October 31, 2017 on pages 194 to 196 of
the Annual Report.
Our results and average assets, grouped by operating segment, are as follows:
(Canadian $ in millions)
Canadian Wealth Corporate For the three months ended January 31, 2018 P&C U.S. P&C Management BMO CM Services (1) Total
Net interest income 1,380 903 200 233 (170) 2,546 Non-interest revenue 553 280 1,405 849 45 3,132 Total Revenue 1,933 1,183 1,605 1,082 (125) 5,678 Provision for (recovery of) credit losses on impaired loans 97 77 1 (1) - 174 Provision for (recovery of) credit losses on performing loans 4 (30) (2) (4) (1) (33)Total provision for (recovery of) credit losses 101 47 (1) (5) (1) 141 Insurance claims, commissions and changes in policy benefit liabilities - - 361 - - 361 Amortization 81 112 57 29 - 279 Non-interest expense 885 609 837 691 140 3,162 Income before taxes and non-controlling interest in subsidiaries 866 415 351 367 (264) 1,735 Provision for income taxes 219 105 85 96 257 762
Net Income 647 310 266 271 (521) 973
Non-controlling interest in subsidiaries - - - - - -
Net Income attributable to bank shareholders 647 310 266 271 (521) 973
Average Assets 221,647 104,215 34,281 295,412 71,908 727,463
Canadian Wealth Corporate For the three months ended January 31, 2017 P&C U.S. P&C Management BMO CM Services (1) Total
Net interest income 1,303 895 172 336 (176) 2,530 Non-interest revenue 676 228 1,045 880 46 2,875 Total Revenue 1,979 1,123 1,217 1,216 (130) 5,405 Provision for (recovery of) credit losses (2) 113 59 2 (4) (3) 167 Insurance claims, commissions and changes in policy benefit liabilities - - 4 - - 4 Amortization 75 113 53 31 - 272 Non-interest expense 830 626 802 691 164 3,113 Income before taxes and non-controlling interest in subsidiaries 961 325 356 498 (291) 1,849 Provision for income taxes 217 76 87 131 (150) 361
Net Income 744 249 269 367 (141) 1,488
Non-controlling interest in subsidiaries - - 1 - - 1
Net Income attributable to bank shareholders 744 249 268 367 (141) 1,487
Average Assets 214,900 105,986 31,500 306,998 66,400 725,784
(1) Corporate Services includes Technology and Operations.
(2) 2017 has not been restated to reflect the adoption of IFRS 9.
We analyze revenue on a taxable equivalent basis (“teb”) at the operating group level. Revenue and the provision for income taxes are increased on tax-exempt securities to an equivalent before-tax basis to
facilitate comparisons of income between taxable and tax-exempt sources. The offset to the groups’ teb adjustments is reflected in Corporate Services revenue and provision for income taxes.
Certain comparative figures have been reclassified to conform with the current period’s presentation.
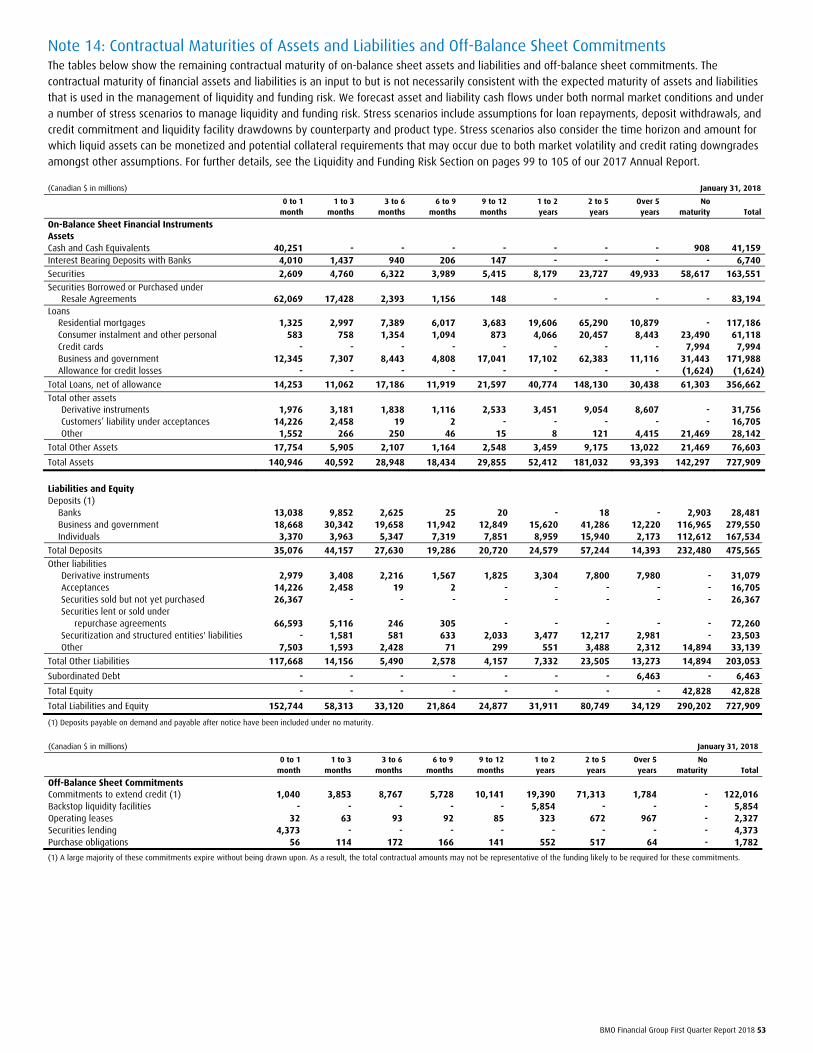
BMO Financial Group First Quarter Report 2018 53
Note 14: Contractual Maturities of Assets and Liabilities and Off-Balance Sheet Commitments The tables below show the remaining contractual maturity of on-balance sheet assets and liabilities and off-balance sheet commitments. The
contractual maturity of financial assets and liabilities is an input to but is not necessarily consistent with the expected maturity of assets and liabilities
that is used in the management of liquidity and funding risk. We forecast asset and liability cash flows under both normal market conditions and under
a number of stress scenarios to manage liquidity and funding risk. Stress scenarios include assumptions for loan repayments, deposit withdrawals, and
credit commitment and liquidity facility drawdowns by counterparty and product type. Stress scenarios also consider the time horizon and amount for
which liquid assets can be monetized and potential collateral requirements that may occur due to both market volatility and credit rating downgrades
amongst other assumptions. For further details, see the Liquidity and Funding Risk Section on pages 99 to 105 of our 2017 Annual Report.
(Canadian $ in millions) January 31, 2018
0 to 1 1 to 3 3 to 6 6 to 9 9 to 12 1 to 2 2 to 5 Over 5 No month months months months months years years years maturity Total
On-Balance Sheet Financial Instruments Assets Cash and Cash Equivalents 40,251 - - - - - - - 908 41,159 Interest Bearing Deposits with Banks 4,010 1,437 940 206 147 - - - - 6,740
Securities 2,609 4,760 6,322 3,989 5,415 8,179 23,727 49,933 58,617 163,551
Securities Borrowed or Purchased under Resale Agreements 62,069 17,428 2,393 1,156 148 - - - - 83,194
Loans Residential mortgages 1,325 2,997 7,389 6,017 3,683 19,606 65,290 10,879 - 117,186 Consumer instalment and other personal 583 758 1,354 1,094 873 4,066 20,457 8,443 23,490 61,118 Credit cards - - - - - - - - 7,994 7,994 Business and government 12,345 7,307 8,443 4,808 17,041 17,102 62,383 11,116 31,443 171,988 Allowance for credit losses - - - - - - - - (1,624) (1,624)
Total Loans, net of allowance 14,253 11,062 17,186 11,919 21,597 40,774 148,130 30,438 61,303 356,662
Total other assets Derivative instruments 1,976 3,181 1,838 1,116 2,533 3,451 9,054 8,607 - 31,756 Customers’ liability under acceptances 14,226 2,458 19 2 - - - - - 16,705 Other 1,552 266 250 46 15 8 121 4,415 21,469 28,142
Total Other Assets 17,754 5,905 2,107 1,164 2,548 3,459 9,175 13,022 21,469 76,603
Total Assets 140,946 40,592 28,948 18,434 29,855 52,412 181,032 93,393 142,297 727,909
Liabilities and Equity Deposits (1) Banks 13,038 9,852 2,625 25 20 - 18 - 2,903 28,481 Business and government 18,668 30,342 19,658 11,942 12,849 15,620 41,286 12,220 116,965 279,550 Individuals 3,370 3,963 5,347 7,319 7,851 8,959 15,940 2,173 112,612 167,534
Total Deposits 35,076 44,157 27,630 19,286 20,720 24,579 57,244 14,393 232,480 475,565
Other liabilities Derivative instruments 2,979 3,408 2,216 1,567 1,825 3,304 7,800 7,980 - 31,079 Acceptances 14,226 2,458 19 2 - - - - - 16,705 Securities sold but not yet purchased 26,367 - - - - - - - - 26,367 Securities lent or sold under
repurchase agreements 66,593 5,116 246 305 - - - - - 72,260 Securitization and structured entities' liabilities - 1,581 581 633 2,033 3,477 12,217 2,981 - 23,503 Other 7,503 1,593 2,428 71 299 551 3,488 2,312 14,894 33,139
Total Other Liabilities 117,668 14,156 5,490 2,578 4,157 7,332 23,505 13,273 14,894 203,053
Subordinated Debt - - - - - - - 6,463 - 6,463
Total Equity - - - - - - - - 42,828 42,828
Total Liabilities and Equity 152,744 58,313 33,120 21,864 24,877 31,911 80,749 34,129 290,202 727,909
(1) Deposits payable on demand and payable after notice have been included under no maturity.
(Canadian $ in millions) January 31, 2018
0 to 1 1 to 3 3 to 6 6 to 9 9 to 12 1 to 2 2 to 5 Over 5 No month months months months months years years years maturity Total
Off-Balance Sheet Commitments Commitments to extend credit (1) 1,040 3,853 8,767 5,728 10,141 19,390 71,313 1,784 - 122,016 Backstop liquidity facilities - - - - - 5,854 - - - 5,854 Operating leases 32 63 93 92 85 323 672 967 - 2,327 Securities lending 4,373 - - - - - - - - 4,373 Purchase obligations 56 114 172 166 141 552 517 64 - 1,782
(1) A large majority of these commitments expire without being drawn upon. As a result, the total contractual amounts may not be representative of the funding likely to be required for these commitments.
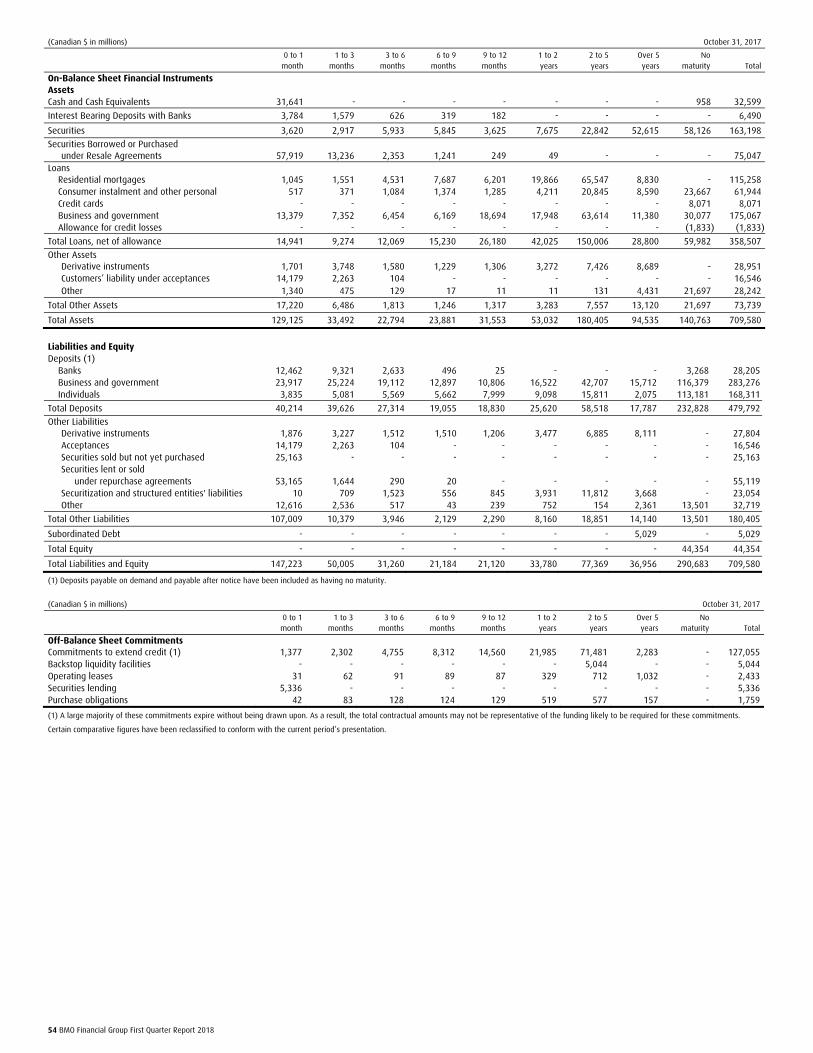
54 BMO Financial Group First Quarter Report 2018
(Canadian $ in millions) October 31, 2017
0 to 1 1 to 3 3 to 6 6 to 9 9 to 12 1 to 2 2 to 5 Over 5 No month months months months months years years years maturity Total
On-Balance Sheet Financial Instruments Assets Cash and Cash Equivalents 31,641 - - - - - - - 958 32,599
Interest Bearing Deposits with Banks 3,784 1,579 626 319 182 - - - - 6,490
Securities 3,620 2,917 5,933 5,845 3,625 7,675 22,842 52,615 58,126 163,198
Securities Borrowed or Purchased under Resale Agreements 57,919 13,236 2,353 1,241 249 49 - - - 75,047
Loans Residential mortgages 1,045 1,551 4,531 7,687 6,201 19,866 65,547 8,830 - 115,258 Consumer instalment and other personal 517 371 1,084 1,374 1,285 4,211 20,845 8,590 23,667 61,944 Credit cards - - - - - - - - 8,071 8,071 Business and government 13,379 7,352 6,454 6,169 18,694 17,948 63,614 11,380 30,077 175,067 Allowance for credit losses - - - - - - - - (1,833) (1,833)
Total Loans, net of allowance 14,941 9,274 12,069 15,230 26,180 42,025 150,006 28,800 59,982 358,507
Other Assets Derivative instruments 1,701 3,748 1,580 1,229 1,306 3,272 7,426 8,689 - 28,951 Customers’ liability under acceptances 14,179 2,263 104 - - - - - - 16,546 Other 1,340 475 129 17 11 11 131 4,431 21,697 28,242
Total Other Assets 17,220 6,486 1,813 1,246 1,317 3,283 7,557 13,120 21,697 73,739
Total Assets 129,125 33,492 22,794 23,881 31,553 53,032 180,405 94,535 140,763 709,580
Liabilities and Equity Deposits (1) Banks 12,462 9,321 2,633 496 25 - - - 3,268 28,205 Business and government 23,917 25,224 19,112 12,897 10,806 16,522 42,707 15,712 116,379 283,276 Individuals 3,835 5,081 5,569 5,662 7,999 9,098 15,811 2,075 113,181 168,311
Total Deposits 40,214 39,626 27,314 19,055 18,830 25,620 58,518 17,787 232,828 479,792
Other Liabilities Derivative instruments 1,876 3,227 1,512 1,510 1,206 3,477 6,885 8,111 - 27,804 Acceptances 14,179 2,263 104 - - - - - - 16,546 Securities sold but not yet purchased 25,163 - - - - - - - - 25,163 Securities lent or sold
under repurchase agreements 53,165 1,644 290 20 - - - - - 55,119 Securitization and structured entities' liabilities 10 709 1,523 556 845 3,931 11,812 3,668 - 23,054 Other 12,616 2,536 517 43 239 752 154 2,361 13,501 32,719
Total Other Liabilities 107,009 10,379 3,946 2,129 2,290 8,160 18,851 14,140 13,501 180,405
Subordinated Debt - - - - - - - 5,029 - 5,029
Total Equity - - - - - - - - 44,354 44,354
Total Liabilities and Equity 147,223 50,005 31,260 21,184 21,120 33,780 77,369 36,956 290,683 709,580
(1) Deposits payable on demand and payable after notice have been included as having no maturity.
(Canadian $ in millions) October 31, 2017
0 to 1 1 to 3 3 to 6 6 to 9 9 to 12 1 to 2 2 to 5 Over 5 No month months months months months years years years maturity Total
Off-Balance Sheet Commitments Commitments to extend credit (1) 1,377 2,302 4,755 8,312 14,560 21,985 71,481 2,283 - 127,055 Backstop liquidity facilities - - - - - - 5,044 - - 5,044 Operating leases 31 62 91 89 87 329 712 1,032 - 2,433 Securities lending 5,336 - - - - - - - - 5,336 Purchase obligations 42 83 128 124 129 519 577 157 - 1,759
(1) A large majority of these commitments expire without being drawn upon. As a result, the total contractual amounts may not be representative of the funding likely to be required for these commitments.
Certain comparative figures have been reclassified to conform with the current period’s presentation.
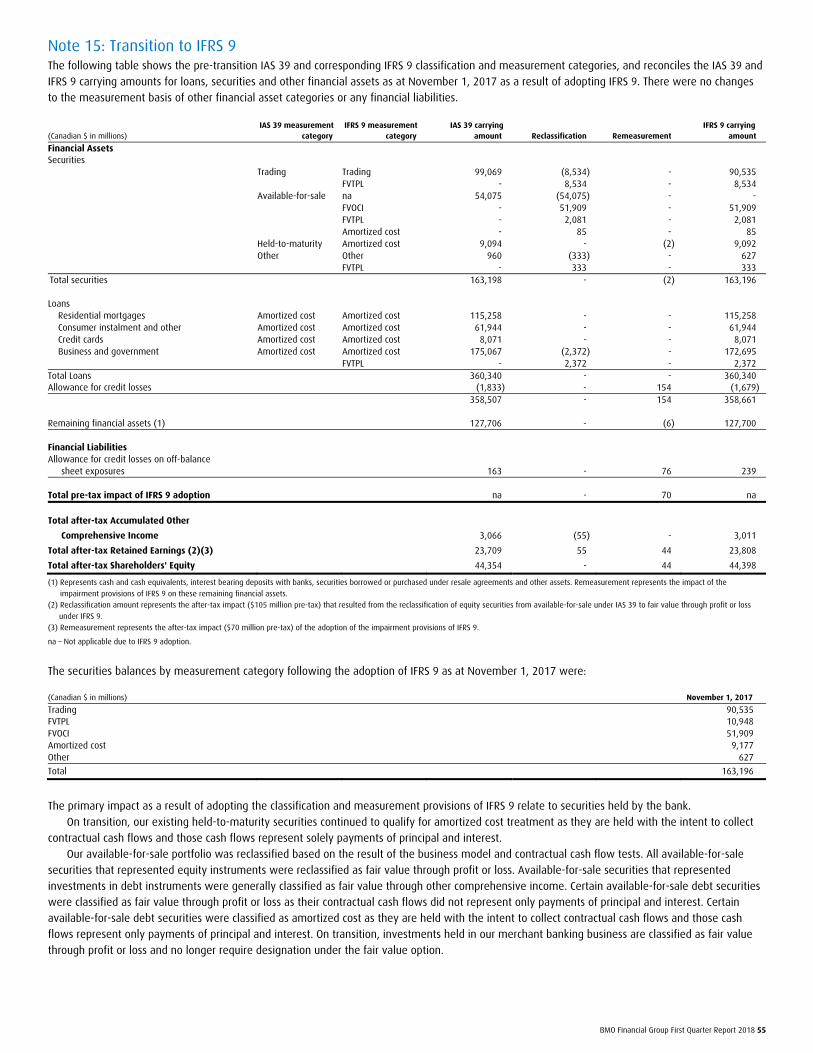
BMO Financial Group First Quarter Report 2018 55
Note 15: Transition to IFRS 9 The following table shows the pre-transition IAS 39 and corresponding IFRS 9 classification and measurement categories, and reconciles the IAS 39 and
IFRS 9 carrying amounts for loans, securities and other financial assets as at November 1, 2017 as a result of adopting IFRS 9. There were no changes
to the measurement basis of other financial asset categories or any financial liabilities.
IAS 39 measurement IFRS 9 measurement IAS 39 carrying IFRS 9 carrying (Canadian $ in millions) category category amount Reclassification Remeasurement amount
Financial Assets
Securities Trading Trading 99,069 (8,534) - 90,535 FVTPL - 8,534 - 8,534 Available-for-sale na 54,075 (54,075) - - FVOCI - 51,909 - 51,909 FVTPL - 2,081 - 2,081 Amortized cost - 85 - 85 Held-to-maturity Amortized cost 9,094 - (2) 9,092 Other Other 960 (333) - 627
FVTPL - 333 - 333 Total securities 163,198 - (2) 163,196
Loans Residential mortgages Amortized cost Amortized cost 115,258 - - 115,258 Consumer instalment and other Amortized cost Amortized cost 61,944 - - 61,944 Credit cards Amortized cost Amortized cost 8,071 - - 8,071 Business and government Amortized cost Amortized cost 175,067 (2,372) - 172,695 FVTPL - 2,372 - 2,372 Total Loans 360,340 - - 360,340 Allowance for credit losses (1,833) - 154 (1,679) 358,507 - 154 358,661 Remaining financial assets (1) 127,706 - (6) 127,700 Financial Liabilities Allowance for credit losses on off-balance
sheet exposures 163 - 76 239 Total pre-tax impact of IFRS 9 adoption na - 70 na
Total after-tax Accumulated Other
Comprehensive Income 3,066 (55) - 3,011
Total after-tax Retained Earnings (2)(3) 23,709 55 44 23,808
Total after-tax Shareholders' Equity 44,354 - 44 44,398
(1) Represents cash and cash equivalents, interest bearing deposits with banks, securities borrowed or purchased under resale agreements and other assets. Remeasurement represents the impact of the
impairment provisions of IFRS 9 on these remaining financial assets.
(2) Reclassification amount represents the after-tax impact ($105 million pre-tax) that resulted from the reclassification of equity securities from available-for-sale under IAS 39 to fair value through profit or loss
under IFRS 9.
(3) Remeasurement represents the after-tax impact ($70 million pre-tax) of the adoption of the impairment provisions of IFRS 9.
na – Not applicable due to IFRS 9 adoption.
The securities balances by measurement category following the adoption of IFRS 9 as at November 1, 2017 were:
(Canadian $ in millions) November 1, 2017
Trading 90,535 FVTPL 10,948 FVOCI 51,909 Amortized cost 9,177 Other 627
Total 163,196
The primary impact as a result of adopting the classification and measurement provisions of IFRS 9 relate to securities held by the bank. On transition, our existing held-to-maturity securities continued to qualify for amortized cost treatment as they are held with the intent to collect
contractual cash flows and those cash flows represent solely payments of principal and interest.
Our available-for-sale portfolio was reclassified based on the result of the business model and contractual cash flow tests. All available-for-sale
securities that represented equity instruments were reclassified as fair value through profit or loss. Available-for-sale securities that represented
investments in debt instruments were generally classified as fair value through other comprehensive income. Certain available-for-sale debt securities
were classified as fair value through profit or loss as their contractual cash flows did not represent only payments of principal and interest. Certain
available-for-sale debt securities were classified as amortized cost as they are held with the intent to collect contractual cash flows and those cash
flows represent only payments of principal and interest. On transition, investments held in our merchant banking business are classified as fair value
through profit or loss and no longer require designation under the fair value option.
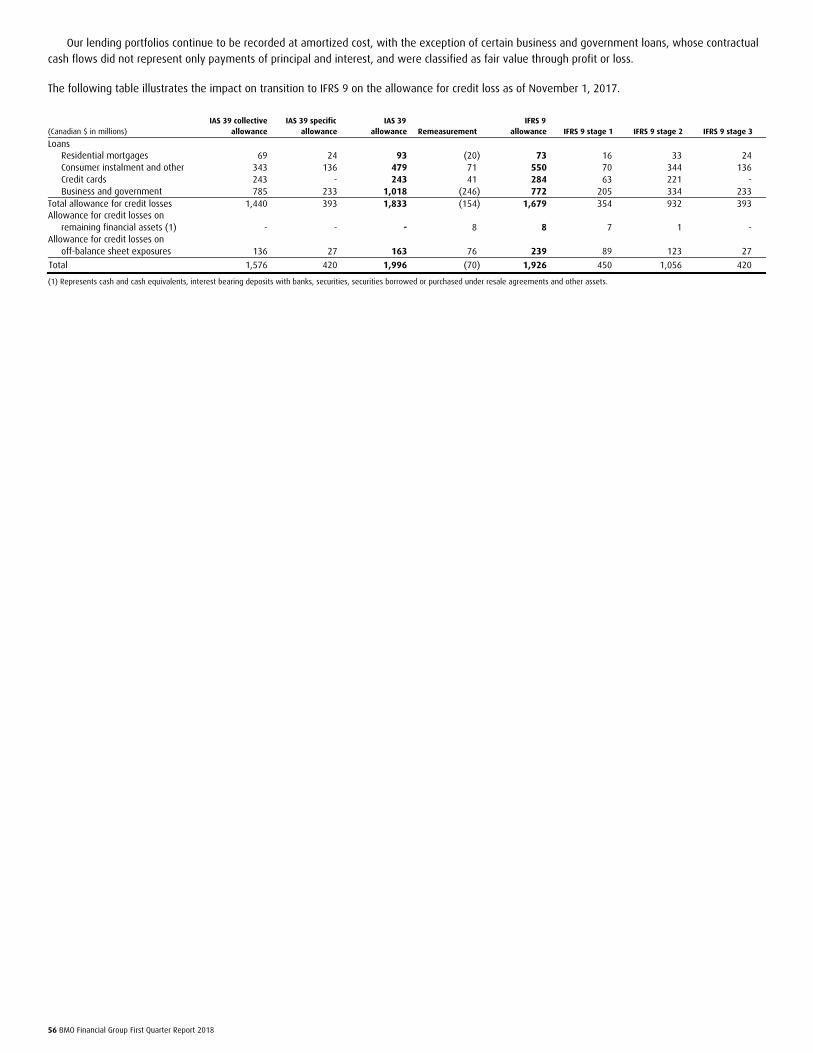
56 BMO Financial Group First Quarter Report 2018
Our lending portfolios continue to be recorded at amortized cost, with the exception of certain business and government loans, whose contractual
cash flows did not represent only payments of principal and interest, and were classified as fair value through profit or loss.
The following table illustrates the impact on transition to IFRS 9 on the allowance for credit loss as of November 1, 2017.
IAS 39 collective IAS 39 specific IAS 39 IFRS 9
(Canadian $ in millions) allowance allowance allowance Remeasurement allowance IFRS 9 stage 1 IFRS 9 stage 2 IFRS 9 stage 3
Loans Residential mortgages 69 24 93 (20) 73 16 33 24 Consumer instalment and other 343 136 479 71 550 70 344 136 Credit cards 243 - 243 41 284 63 221 - Business and government 785 233 1,018 (246) 772 205 334 233
Total allowance for credit losses 1,440 393 1,833 (154) 1,679 354 932 393 Allowance for credit losses on
remaining financial assets (1) - - - 8 8 7 1 - Allowance for credit losses on
off-balance sheet exposures 136 27 163 76 239 89 123 27
Total 1,576 420 1,996 (70) 1,926 450 1,056 420
(1) Represents cash and cash equivalents, interest bearing deposits with banks, securities, securities borrowed or purchased under resale agreements and other assets.

57 BMO Financial Group First Quarter Report 2018
INVESTOR AND MEDIA PRESENTATION Investor Presentation Materials Interested parties are invited to visit our website at www.bmo.com/investorrelations to review our 2017 annual MD&A and audited annual
consolidated financial statements, quarterly presentation materials and supplementary financial information package.
Quarterly Conference Call and Webcast Presentations Interested parties are also invited to listen to our quarterly conference call on Tuesday, February 27, 2018, at 2:00 p.m. (EST). At that time, senior BMO
executives will comment on results for the quarter and respond to questions from the investor community. The call may be accessed by telephone at
416-641-2144 (from within Toronto) or 1-888-789-9572 (toll-free outside Toronto) Passcode: 5126346. A replay of the conference call can be accessed
until Tuesday, May 29, 2018, by calling 905-694-9451 (from within Toronto) or 1-800-408-3053 (toll-free outside Toronto) and entering Passcode:
5740558.
A live webcast of the call can be accessed on our website at www.bmo.com/investorrelations. A replay can also be accessed on the site.
Media Relations Contacts Paul Gammal, Toronto, [email protected], 416-867-3996
Francois Morin, Montreal, [email protected], 514-877-1873
Investor Relations Contacts Jill Homenuk, Head, Investor Relations, [email protected], 416-867-4770
Christine Viau, Director, Investor Relations, [email protected], 416-867-6956
Shareholder Dividend Reinvestment and Share Purchase Plan (the Plan) Average market price as defined under the Plan November 2017: $99.35 December 2017: $100.21 January 2018: $103.06 For dividend information, change in shareholder address or to advise of duplicate mailings, please contact Computershare Trust Company of Canada 100 University Avenue, 9th Floor Toronto, Ontario M5J 2Y1 Telephone: 1-800-340-5021 (Canada and the United States) Telephone: (514) 982-7800 (international) Fax: 1-888-453-0330 (Canada and the United States) Fax: (416) 263-9394 (international) E-mail: [email protected]
For other shareholder information, including the notice for our normal course issuer bid, please contact Bank of Montreal Shareholder Services Corporate Secretary’s Department One First Canadian Place, 21st Floor Toronto, Ontario M5X 1A1 Telephone: (416) 867-6786 Fax: (416) 867-6793 E-mail: [email protected] For further information on this document, please contact Bank of Montreal Investor Relations Department P.O. Box 1, One First Canadian Place, 10th Floor Toronto, Ontario M5X 1A1 To review financial results and regulatory filings and disclosures online, please visit our website at www.bmo.com/investorrelations.
Our 2017 Annual MD&A, audited annual consolidated financial statements and annual report on Form 40-F (filed with the U.S. Securities and Exchange
Commission) are available online at www.bmo.com/investorrelations and at www.sedar.com. Printed copies of the bank’s complete 2017 audited
financial statements are available free of charge upon request at 416-867-6785 or [email protected].
® Registered trademark of Bank of Montreal
Annual Meeting 2018
The next Annual Meeting of Shareholders will be held on Thursday, April 5, 2018, in Toronto, Ontario.


![FY17 2nd Quarter Financial Results [IFRS] · 2. FY17 2nd Quarter Financial Results [IFRS] 1. FY17 Q1-Q2 (Highlights) 4. Reference. 3. FY17 Outlook . 2.Status of Progress on the Mid-Term](https://img.pdfslide.net/doc/110x75/5f1e629b38af5e5e6a417bd6/fy17-2nd-quarter-financial-results-ifrs-2-fy17-2nd-quarter-financial-results.jpg)

![FY16 3rd Quarter Financial Results [IFRS] · FY16 3rd Quarter Financial Results [IFRS] Hitachi High-Technologies Corporation January 27, 2017 ... FY15/Q1 FY15/Q2 FY15/Q3 FY15/Q4 FY16/Q1](https://img.pdfslide.net/doc/110x75/5ec630f9034f80098f725dcb/fy16-3rd-quarter-financial-results-ifrs-fy16-3rd-quarter-financial-results-ifrs.jpg)