Embed Size (px)
Citation preview

First Quarter 2020
Earnings Call
Jim ZalliePresident and CEO
James GrayExecutive Vice President
and CFO
Forward-looking Statements2
This presentation contains or may contain forward-looking statements within the meaning of Section 27A of the Securities Act of 1933, as amended, and Section 21E of the SecuritiesExchange Act of 1934, as amended. The Company intends these forward-looking statements to be covered by the safe harbor provisions for such statements.
Forward-looking statements include, among others, any statements concerning the Company's expectations regarding its effective tax rates and committed capital investments for 2020and any assumptions, expectations or beliefs underlying the foregoing. These statements can sometimes be identified by the use of forward looking words such as "may," "will," "should,""anticipate," "assume," "believe," "plan," "project," "estimate," "expect," "intend," "continue," "pro forma," "forecast," "outlook," "propels," "opportunities," "potential," "provisional," orother similar expressions or the negative thereof. All statements other than statements of historical facts in this presentation or referred to in this presentation are "forward-lookingstatements."
These statements are based on current circumstances or expectations, but are subject to certain inherent risks and uncertainties, many of which are difficult to predict and are beyondour control. Although we believe our expectations reflected in these forward-looking statements are based on reasonable assumptions, investors are cautioned that no assurance can begiven that our expectations will prove correct.
Actual results and developments may differ materially from the expectations expressed in or implied by our forward looking statements as a result of the following risksand uncertainties, among others: changing consumption preferences and perceptions, including those relating to high fructose corn syrup; the effects of global economic conditions andthe general political, economic, business, and market conditions that affect customers and consumers in the various geographic regions and countries in which we buy our raw materialsor manufacture or sell our products, including, particularly, economic, currency and political conditions in South America and economic and political conditions in Europe, and theimpact these factors may have on our sales volumes, the pricing of our products, our access to credit markets and our ability to collect our receivables from customers; adversechanges in investment returns earned on our pension assets; future financial performance of major industries which we serve and from which we derive a significant portion of our sales,including the food, beverage, animal nutrition, and brewing industries; the uncertainty of acceptance of products developed through genetic modification and biotechnology; our ability todevelop or acquire new products and services at rates or of qualities sufficient to meet expectations; changes in U.S. and foreign government policy, laws or regulations and costs of legalcompliance; increased competitive and/or customer pressure in the corn-refining industry and related industries, including with respect to the markets and prices for our primaryproducts and our co-products, particularly corn oil; the availability of raw materials, including potato starch, tapioca, gum Arabic and the specific varieties of corn upon which some ofour products are based, and our ability to pass on potential increases in the cost of corn or other raw materials to customers; raw material and energy costs and availability; our abilityto contain costs, achieve budgets and to realize expected synergies, including with respect to our ability to complete planned maintenance and investment projects on time and onbudget, and to achieve expected savings under our Cost Smart program as well as with respect to freight and shipping costs; the impact of financial and capital markets on ourborrowing costs, including as a result of foreign currency fluctuations, fluctuations in interest and exchange rates and market volatility and the associated risks of hedging against suchfluctuations; the potential effects of climate change; our ability to successfully identify and complete acquisitions or strategic alliances on favorable terms as well as our ability tosuccessfully integrate acquired businesses or implement and maintain strategic alliances and achieve anticipated synergies with respect to all of the foregoing; operating difficulties at ourmanufacturing plants or with respect to boiler reliability; risks related to product safety and quality and compliance with environmental, health and safety, and food safety laws andregulations; economic, political and other risks inherent in operating in foreign countries with foreign currencies and shipping products between countries, including with respect totariffs, quotas and duties; interruptions, security breaches or failures that might affect our information technology systems, processes and sites; our ability to maintain satisfactory laborrelations; the impact that weather, natural disasters, war or similar acts of hostility, acts and threats of terrorism, the outbreak or continuation of pandemics such as COVID 19 andother significant events could have on our business; the potential recognition of impairment charges on goodwill or long lived assets; changes in our tax rates or exposure to additionalincome tax liabilities; and our ability to raise funds at reasonable rates to grow and expand our operations.
Our forward-looking statements speak only as of the date on which they are made and we do not undertake any obligation to update any forward-looking statement to reflect events orcircumstances after the date of the statement as a result of new information or future events or developments. If we do update or correct one or more of these statements, investorsand others should not conclude that we will make additional updates or corrections. For a further description of these and other risks, see "Risk Factors" included in our Annual Reporton Form 10-K for the year ended December 31, 2019 and our subsequent reports on Form 10-Q and Form 8-K.

• Our priorities during COVID-19 pandemic
• First quarter performance and our outlook
• Building for the future
• Questions and answers
3
Agenda

Pause for a moment and reflect….
Heartfelt appreciation and thank you to…
• Healthcare Workers
• First Responders
• All Frontline Employees working in "essential" services
• Ingredion's Global Employees

5
Our COVID-19 Priorities Remain Clear
Maintaining the Health and Safety of our Employees1
2
3
Proudly Supporting our Communities
Business Continuity to Serve our Customers
6
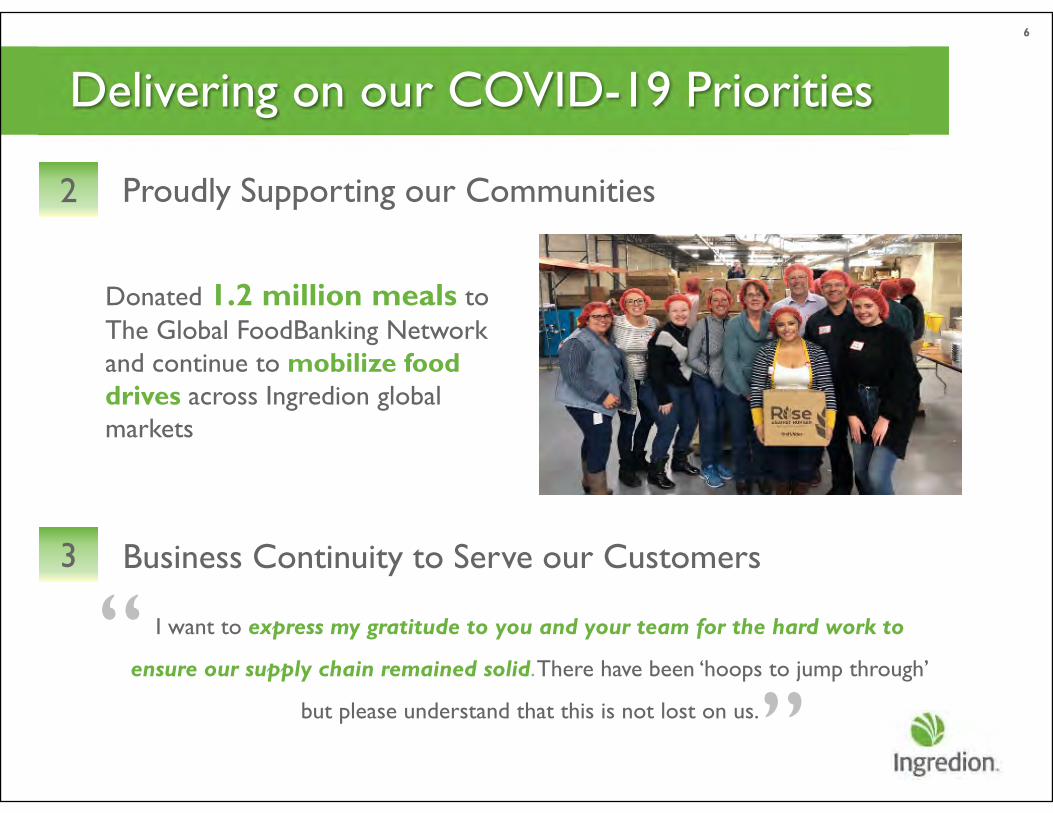
Delivering on our COVID-19 Priorities
Donated 1.2 million meals toThe Global FoodBanking Network and continue to mobilize food drives across Ingredion global markets
“ I want to express my gratitude to you and your team for the hard work to
ensure our supply chain remained solid.There have been ‘hoops to jump through’
but please understand that this is not lost on us.”
Proudly Supporting our Communities2
Business Continuity to Serve our Customers3
7
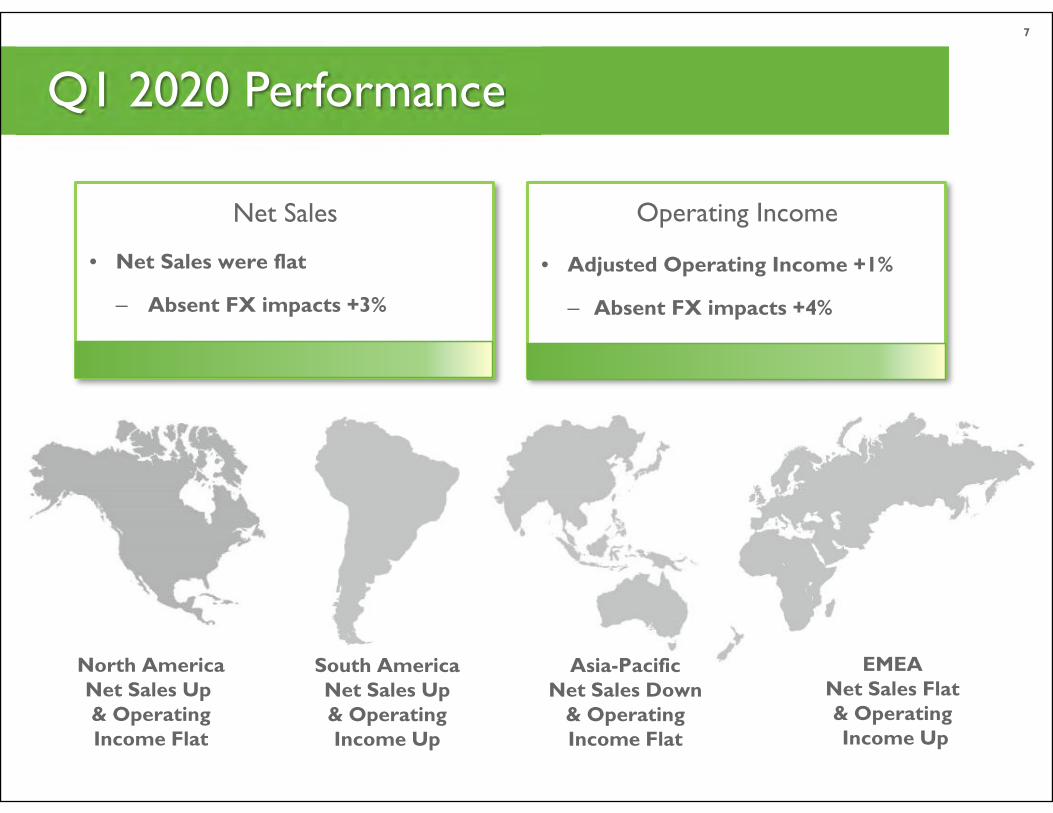
Net Sales• Net Sales were flat
– Absent FX impacts +3%
Net Sales
Net Sales
Operating Income
• Adjusted Operating Income +1%
– Absent FX impacts +4%
North America Net Sales Up& Operating Income Flat
South America Net Sales Up & Operating Income Up
Asia-Pacific Net Sales Down
& Operating Income Flat
EMEANet Sales Flat & OperatingIncome Up
Q1 2020 Performance
Net Sales
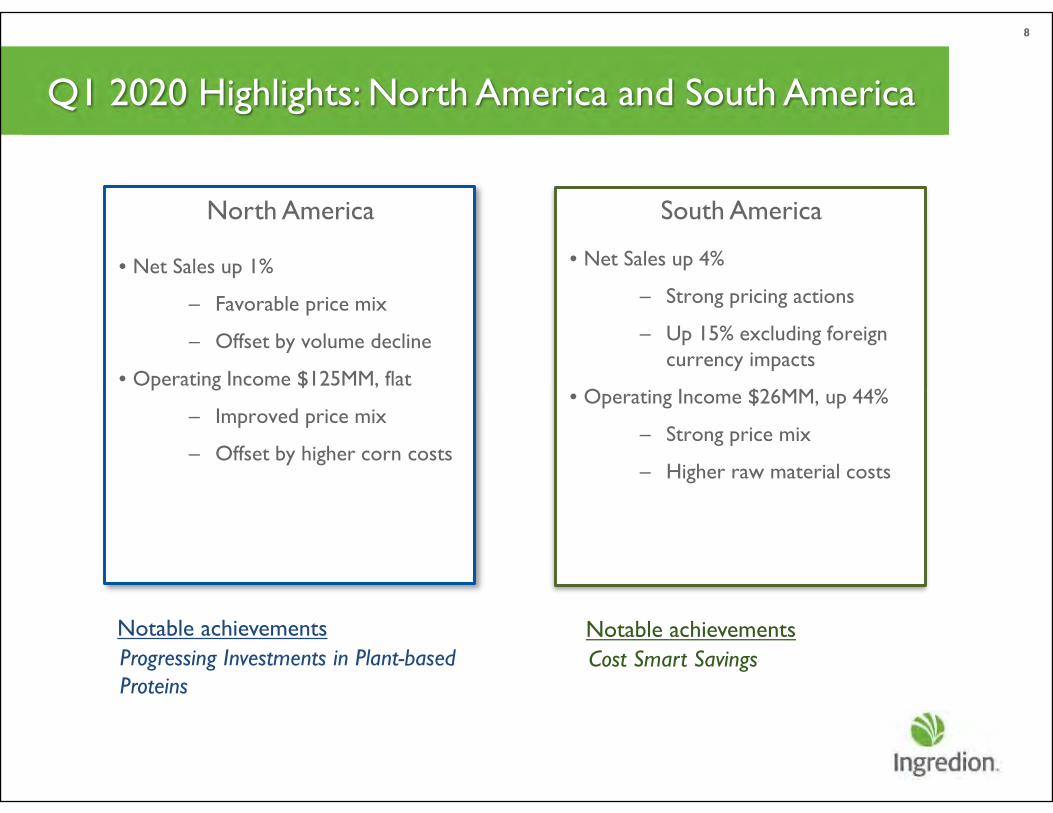
Q1 2020 Highlights: North America and South America
8
• Net Sales up 1%
– Favorable price mix
– Offset by volume decline
• Operating Income $125MM, flat
– Improved price mix
– Offset by higher corn costs
North America
Progressing Investments in Plant-based Proteins
Notable achievements
Net Sales
South America
• Net Sales up 4%
– Strong pricing actions
– Up 15% excluding foreign currency impacts
• Operating Income $26MM, up 44%
– Strong price mix
– Higher raw material costs
Cost Smart SavingsNotable achievements
9
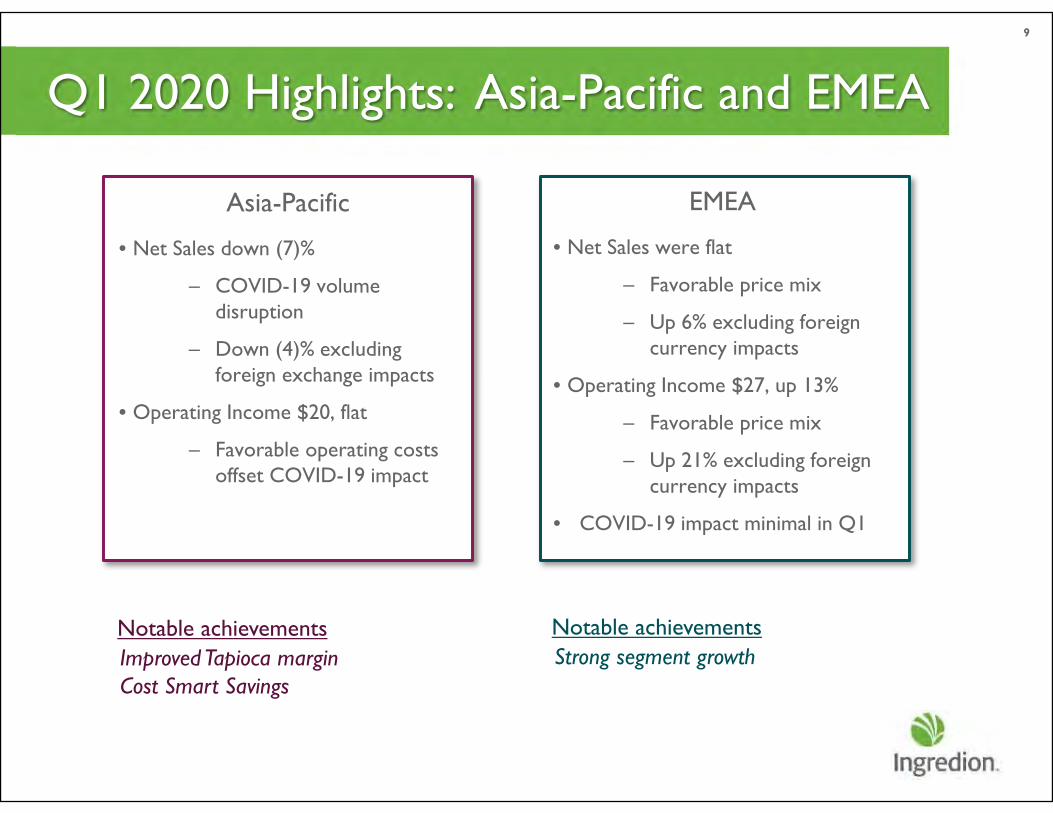
Q1 2020 Highlights: Asia-Pacific and EMEA
Net Sales
Asia-Pacific
• Net Sales down (7)%
– COVID-19 volume disruption
– Down (4)% excluding foreign exchange impacts
• Operating Income $20, flat
– Favorable operating costs offset COVID-19 impact
Improved Tapioca marginCost Smart Savings
Notable achievements
Net Sales
EMEA
• Net Sales were flat
– Favorable price mix
– Up 6% excluding foreign currency impacts
• Operating Income $27, up 13%
– Favorable price mix
– Up 21% excluding foreign currency impacts
• COVID-19 impact minimal in Q1
Strong segment growthNotable achievements
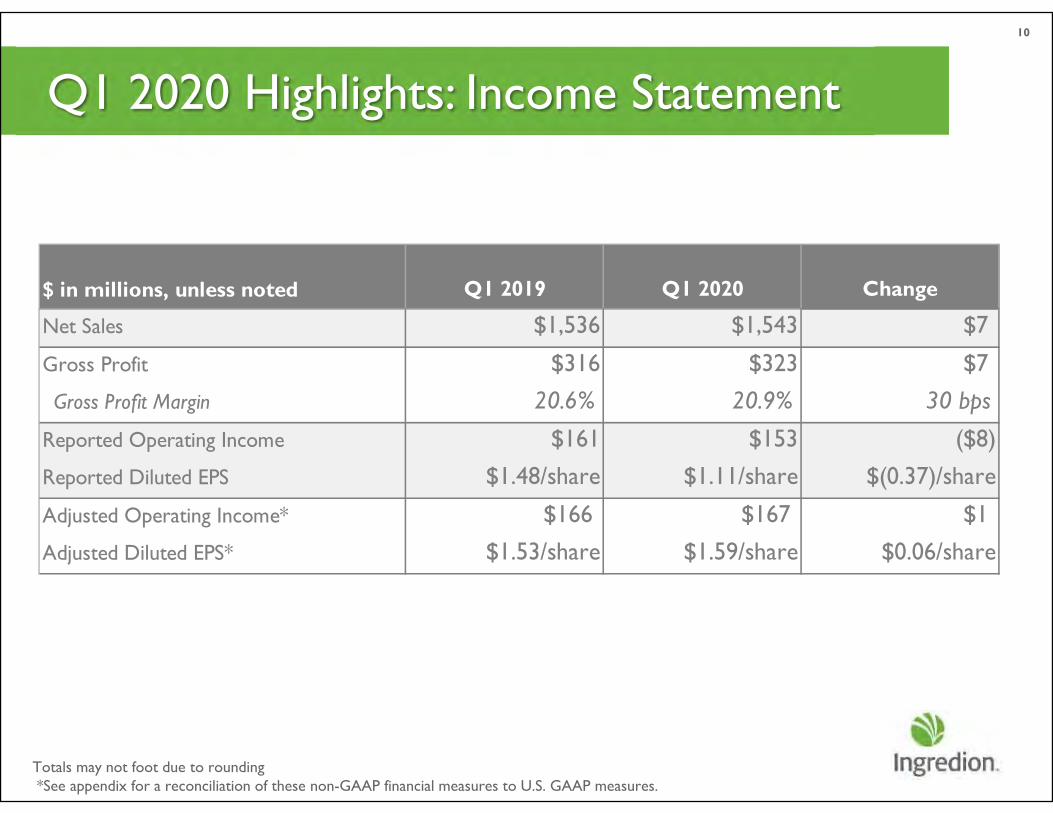
Q1 2020 Highlights: Income Statement10
Totals may not foot due to rounding *See appendix for a reconciliation of these non-GAAP financial measures to U.S. GAAP measures.
$ in millions, unless noted Q1 2019 Q1 2020 Change
Net Sales $1,536 $1,543 $7
Gross Profit $316 $323 $7
Gross Profit Margin 20.6% 20.9% 30 bps
Reported Operating Income $161 $153 ($8)
Reported Diluted EPS $1.48/share $1.11/share $(0.37)/share
Adjusted Operating Income* $166 $167 $1
Adjusted Diluted EPS* $1.53/share $1.59/share $0.06/share
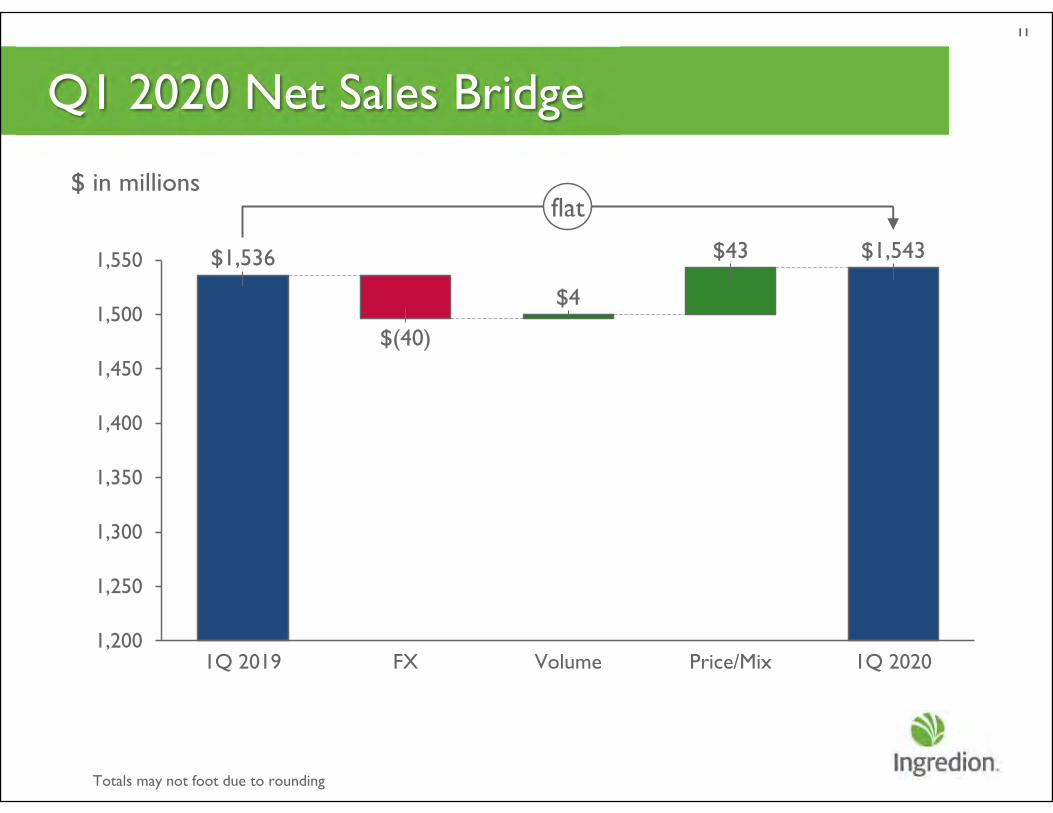
Q1 2020 Net Sales Bridge11
Totals may not foot due to rounding
$1,536 $1,543
$4
$43
1,200
1,250
1,300
1,350
1,400
1,450
1,500
1,550
FX
$(40)
1Q 2019 Price/MixVolume 1Q 2020
flat$ in millions
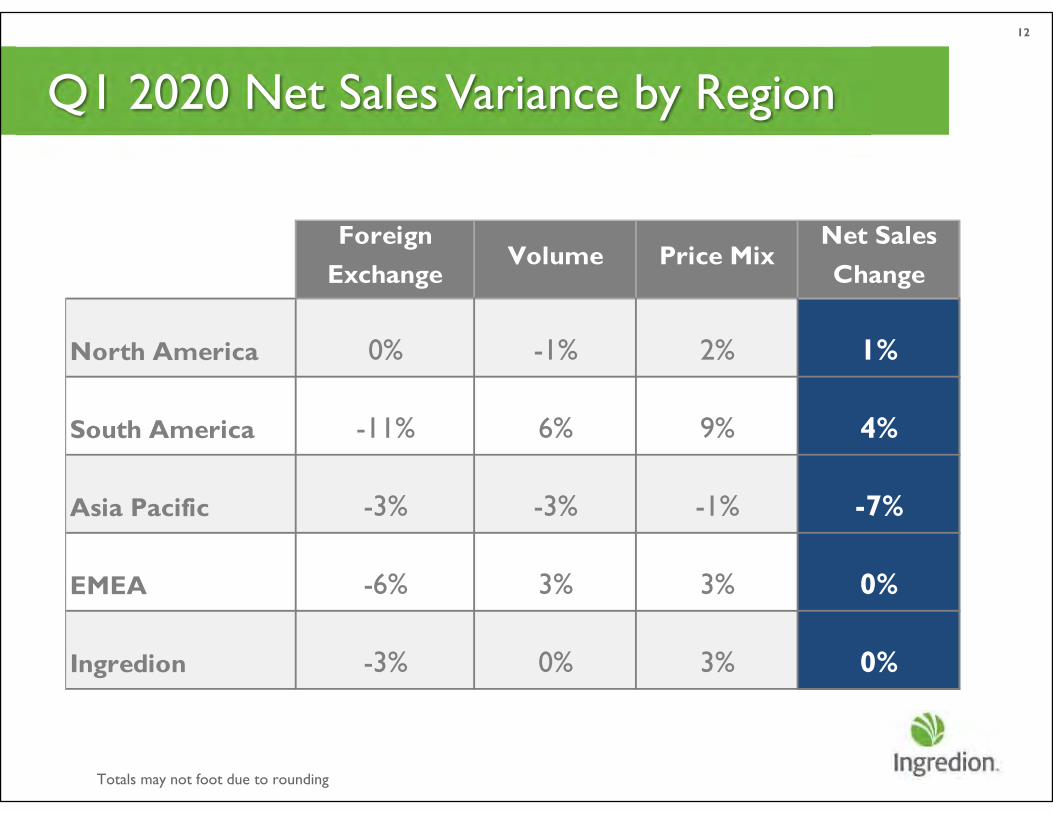
Q1 2020 Net Sales Variance by Region12
Totals may not foot due to rounding
Foreign Exchange
Volume Price MixNet Sales Change
North America 0% -1% 2% 1%
South America -11% 6% 9% 4%
Asia Pacific -3% -3% -1% -7%
EMEA -6% 3% 3% 0%
Ingredion -3% 0% 3% 0%
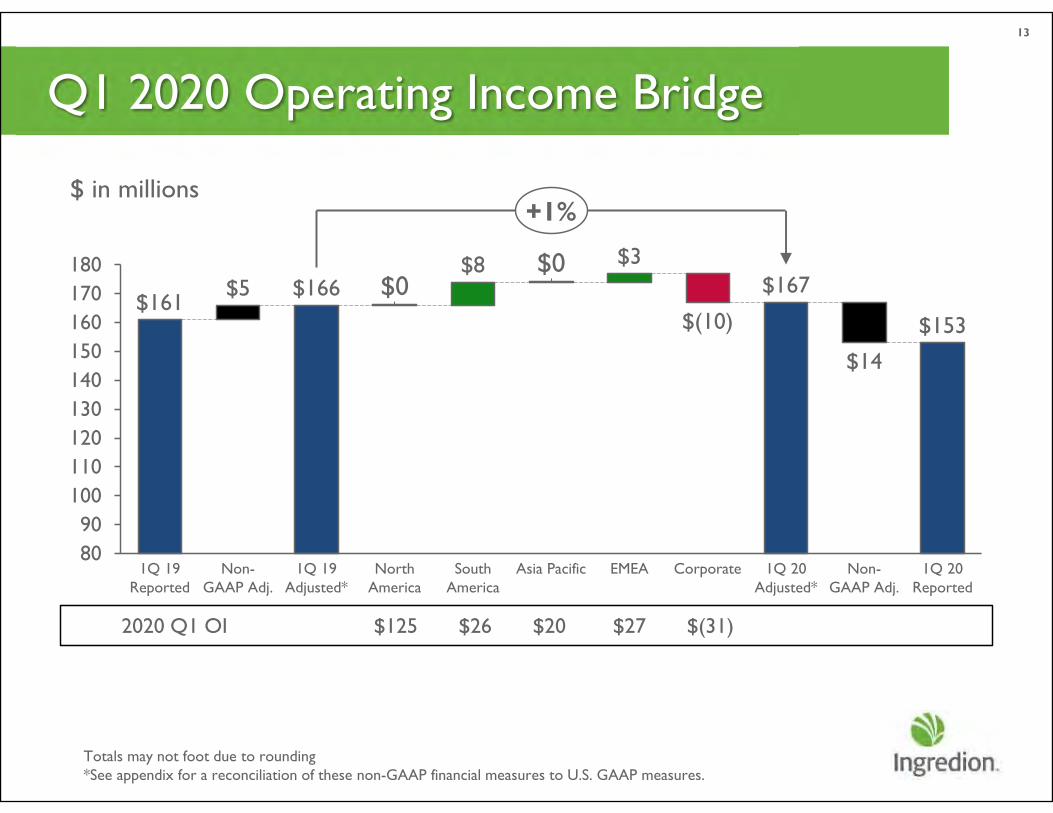
Q1 2020 Operating Income Bridge13
$ in millions
2020 Q1 OI $125 $26 $20 $27 $(31)
$161$166 $167
$153
$5$8 $3
$14
8090
100110120130140150160170180
Non-GAAP Adj.
1Q 19Adjusted*
1Q 19Reported
Asia Pacific EMEA Corporate 1Q 20Adjusted*
Non-GAAP Adj.
South America
$0
1Q 20Reported
North America
$(10)
$0
+1%
Totals may not foot due to rounding*See appendix for a reconciliation of these non-GAAP financial measures to U.S. GAAP measures.
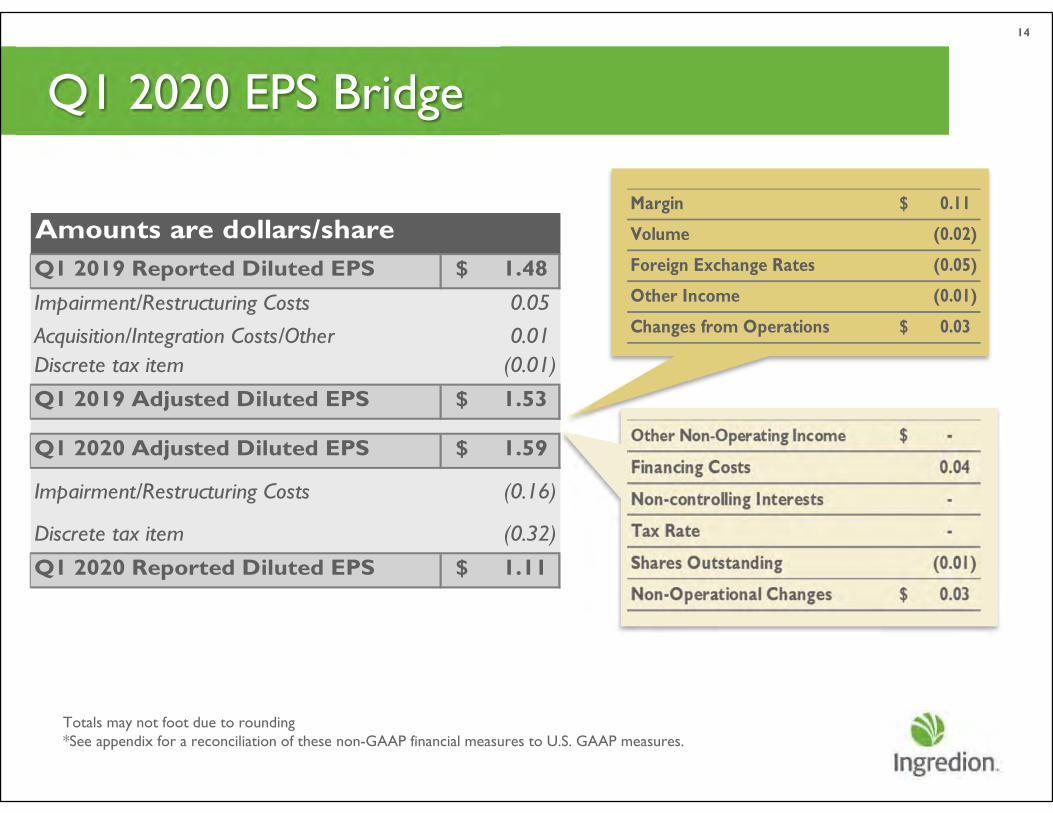
Q1 2020 EPS Bridge14
Totals may not foot due to rounding *See appendix for a reconciliation of these non-GAAP financial measures to U.S. GAAP measures.
Margin 0.11$
Volume (0.02)
Foreign Exchange Rates (0.05)
Other Income (0.01)
Changes from Operations 0.03$
1.48$ 0.05 0.01 (0.01)
1.53$
1.59$
(0.16)
(0.32)
1.11$ Discrete tax item
Q1 2020 Reported Diluted EPS
Q1 2019 Adjusted Diluted EPS
Q1 2020 Adjusted Diluted EPS
Impairment/Restructuring Costs
Amounts are dollars/shareQ1 2019 Reported Diluted EPSImpairment/Restructuring CostsAcquisition/Integration Costs/OtherDiscrete tax item
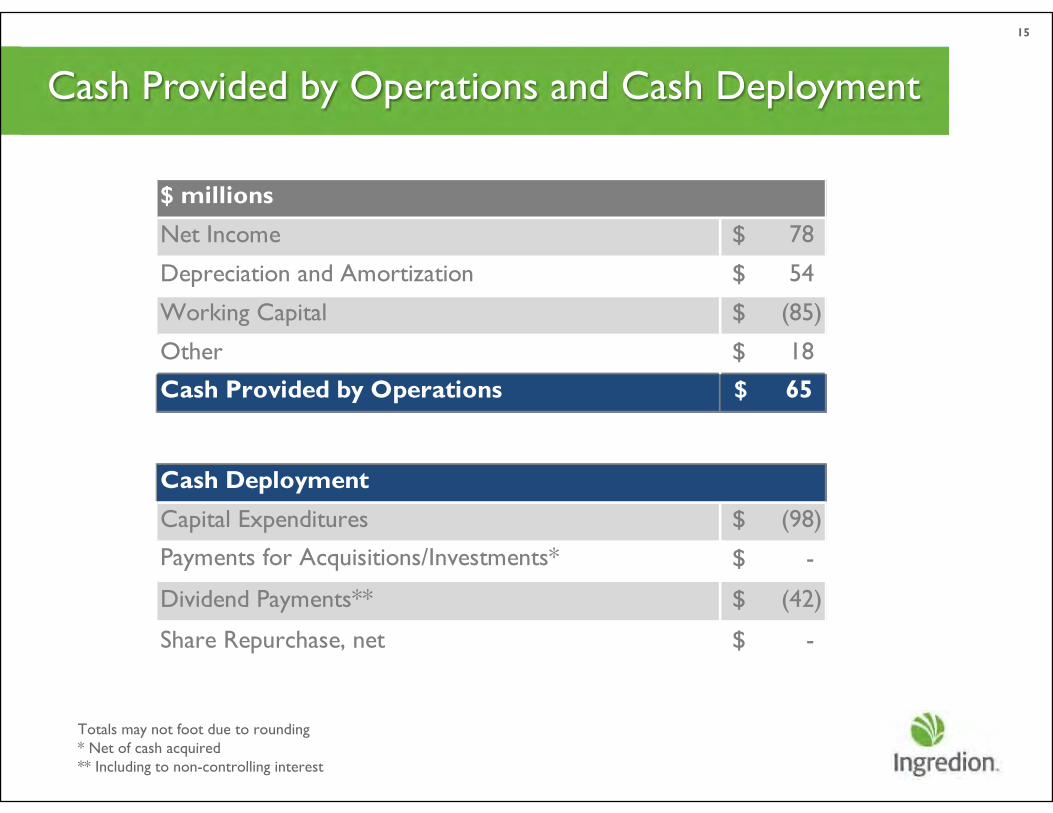
Cash Provided by Operations and Cash Deployment
15
Totals may not foot due to rounding * Net of cash acquired ** Including to non-controlling interest
$ millionsNet Income 78$
Depreciation and Amortization 54$
Working Capital (85)$
Other 18$
Cash Provided by Operations 65$
Capital Expenditures (98)$
Payments for Acquisitions/Investments* -$
Dividend Payments** (42)$
Share Repurchase, net -$
Cash Deployment
16
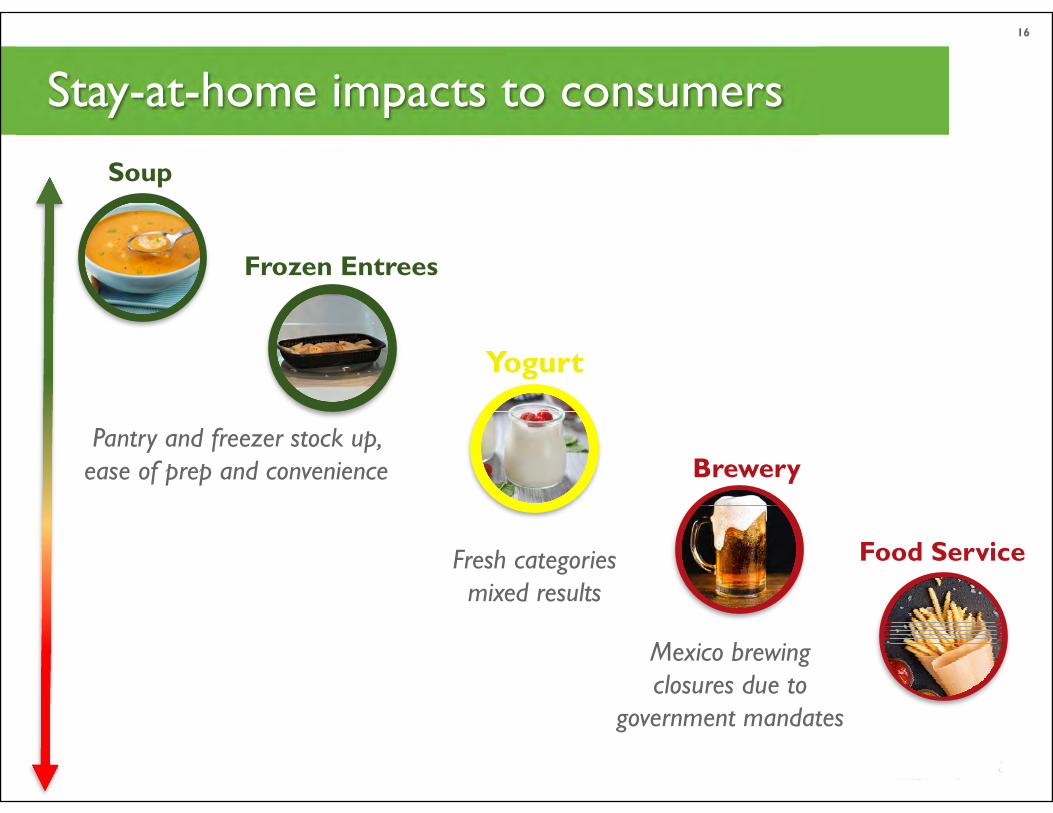
Stay-at-home impacts to consumers
Yogurt
Brewery
Soup
Frozen Entrees
Pantry and freezer stock up, ease of prep and convenience
Fresh categories mixed results
Mexico brewing closures due to
government mandates
Food Service
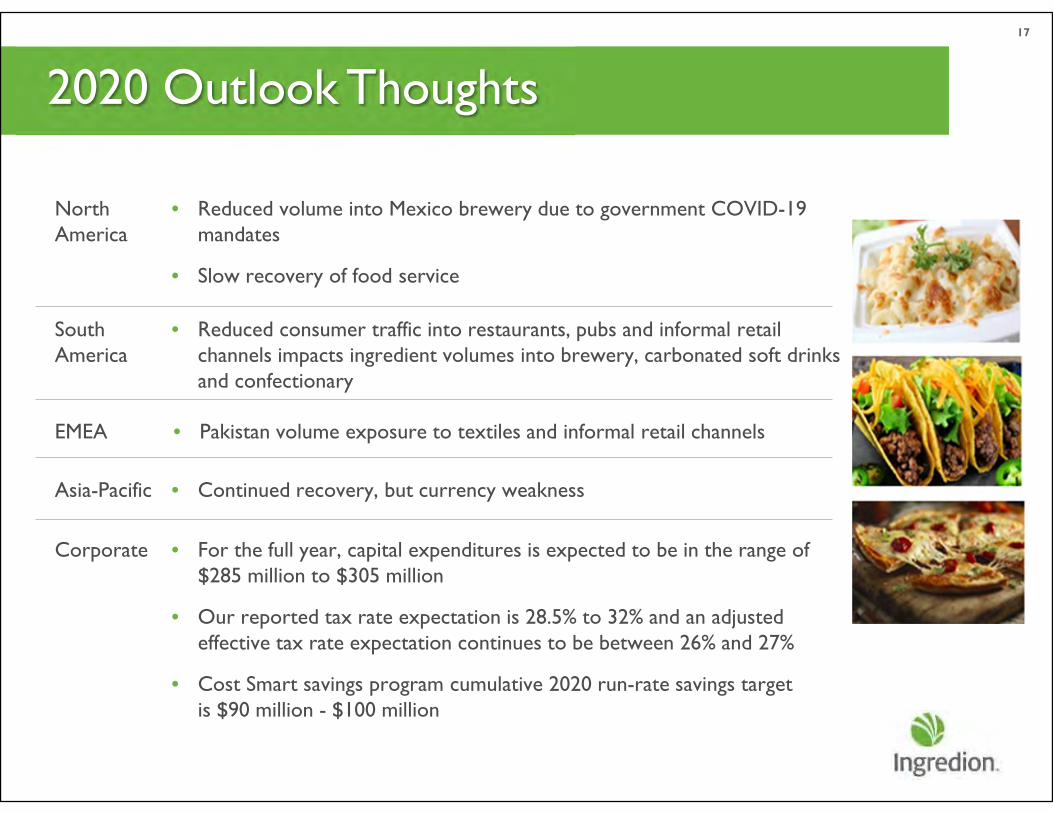
• For the full year, capital expenditures is expected to be in the range of $285 million to $305 million
• Our reported tax rate expectation is 28.5% to 32% and an adjusted effective tax rate expectation continues to be between 26% and 27%
• Cost Smart savings program cumulative 2020 run-rate savings target is $90 million - $100 million
17
2020 Outlook Thoughts
NorthAmerica
SouthAmerica
• Reduced volume into Mexico brewery due to government COVID-19 mandates
• Slow recovery of food service
• Reduced consumer traffic into restaurants, pubs and informal retail channels impacts ingredient volumes into brewery, carbonated soft drinks and confectionary
Asia-Pacific
EMEA • Pakistan volume exposure to textiles and informal retail channels
• Continued recovery, but currency weakness
Corporate
18
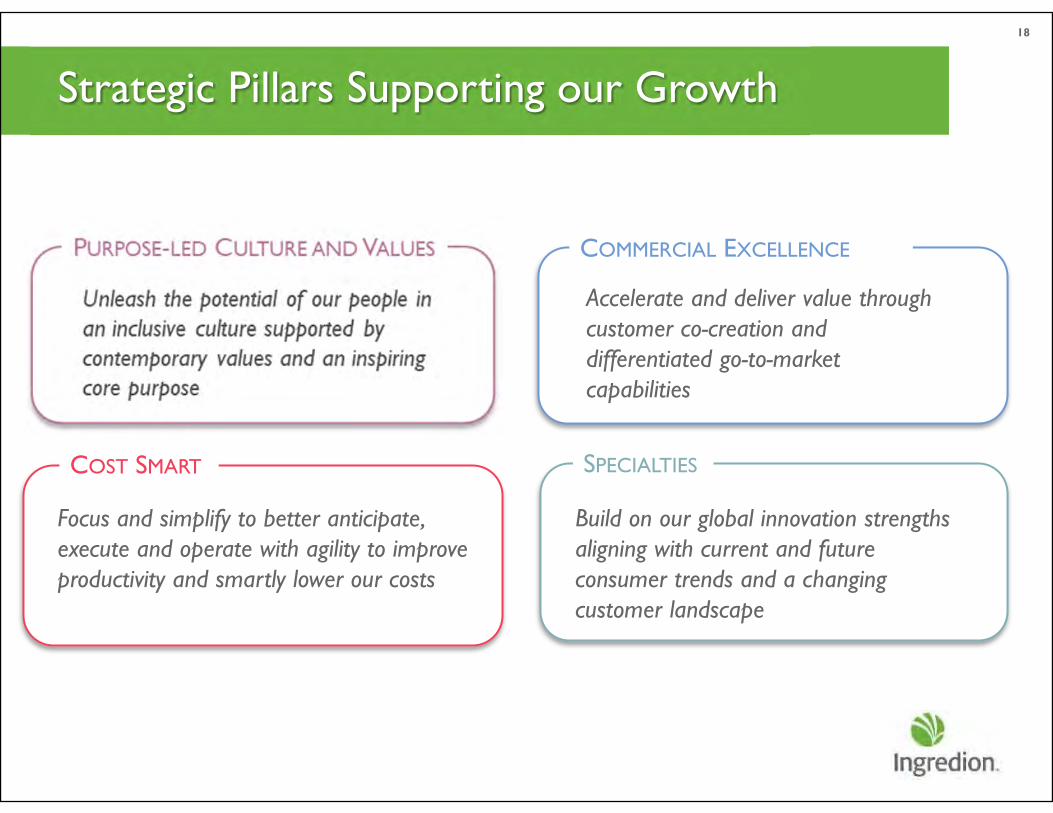
Strategic Pillars Supporting our Growth
Accelerate and deliver value through customer co-creation and differentiated go-to-market capabilities
COMMERCIAL EXCELLENCE
Build on our global innovation strengths aligning with current and future consumer trends and a changing customer landscape
SPECIALTIES
Focus and simplify to better anticipate, execute and operate with agility to improve productivity and smartly lower our costs
COST SMART
19
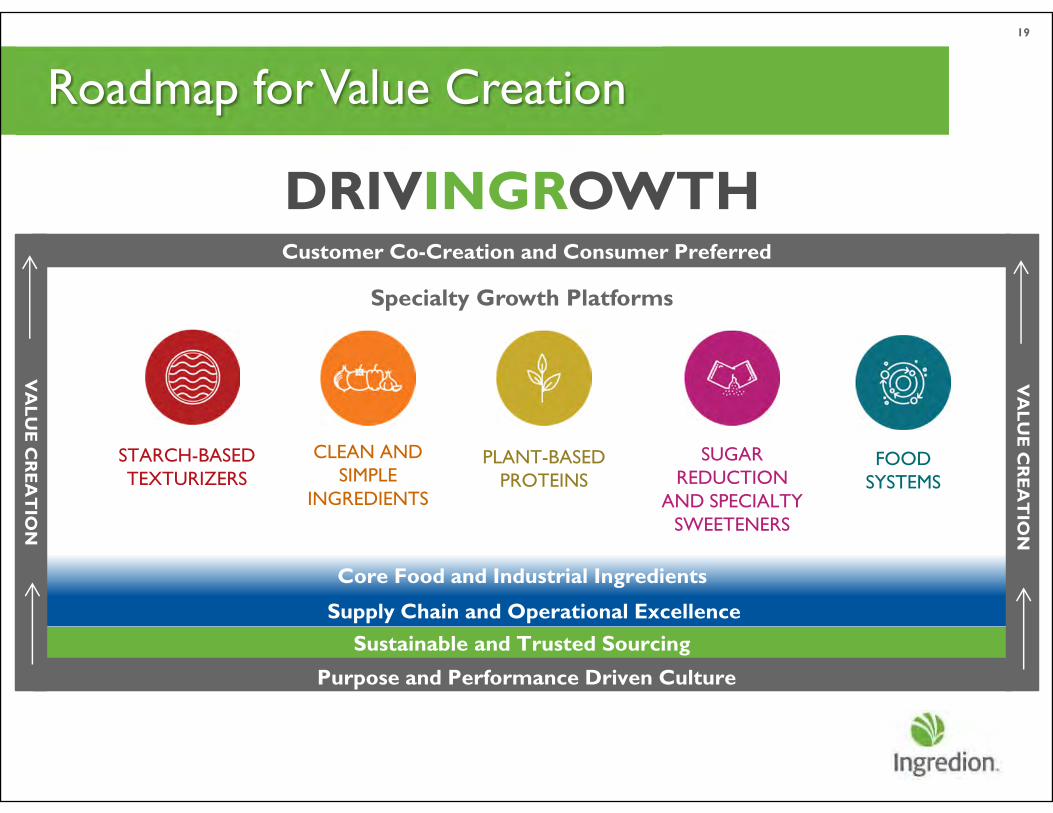
Roadmap for Value Creation
Customer Co-Creation and Consumer Preferred Innovation
Sustainable and Trusted SourcingSupply Chain and Operational Excellence
Core Food and Industrial Ingredients
Specialty Growth Platforms
VA
LUE
CR
EA
TIO
N
CLEAN AND SIMPLE
INGREDIENTS
FOOD SYSTEMS
PLANT-BASED PROTEINS
STARCH-BASED TEXTURIZERS
SUGAR REDUCTION
AND SPECIALTY SWEETENERS
DRIVINGROWTHCustomer Co-Creation and Consumer Preferred
Innovation
Purpose and Performance Driven Culture
VA
LUE
CR
EA
TIO
N

The announcement of the pending PureCircle acquisition advances our specialties strategy for sugar reduction and specialty sweeteners, by aligning with one of the most important food and beverage trends shaping the industry and impacting our customers.
20
Advancing our DRIVINGROWTH Roadmap
21
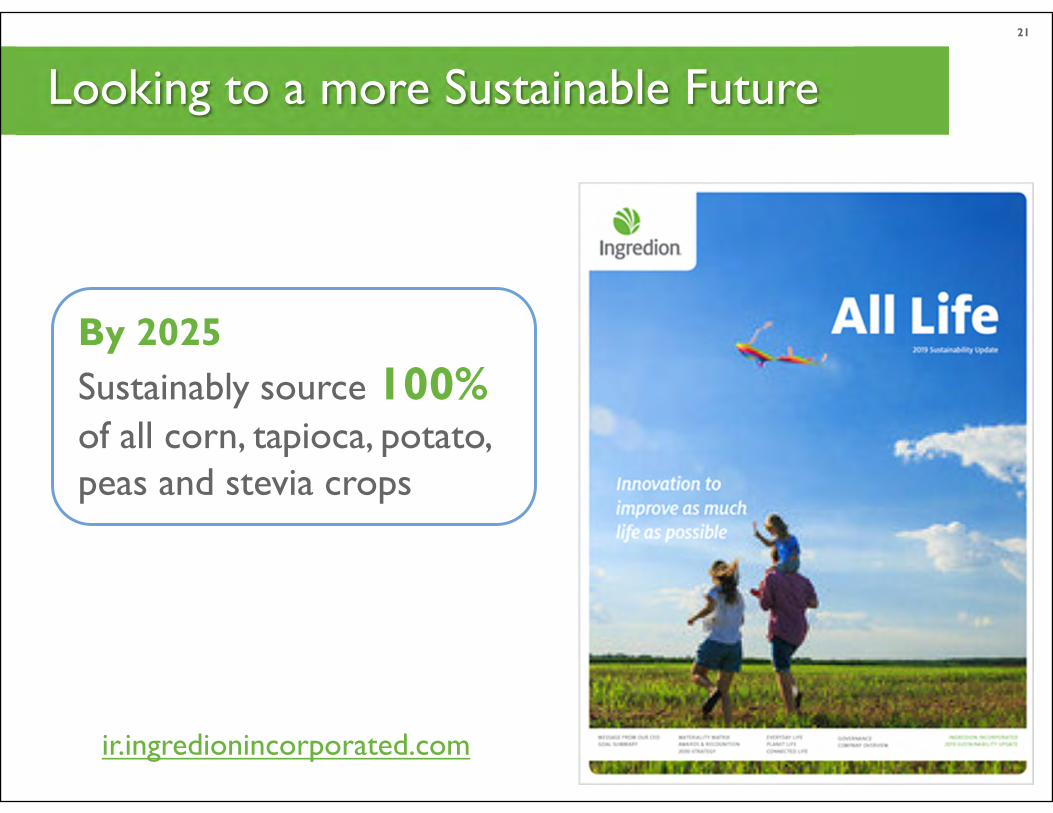
Looking to a more Sustainable Future
By 2025Sustainably source 100%of all corn, tapioca, potato, peas and stevia crops
ir.ingredionincorporated.com

• Our priorities during COVID-19 pandemic
• First quarter performance and our outlook
• Building for the future
• Questions and answers
22
Agenda

23
Upcoming Investor Events
BMO Farm to Market Conference
Virtual | May 13, 2020
Ingredion Annual Stockholders' Meeting
Virtual | May 20, 2020
To supplement the consolidated financial results prepared in accordance with Generally Accepted Accounting Principles (“GAAP”), the Company uses non-GAAP historical financial measures, which exclude certain GAAP items such as acquisition and integration costs, impairment and restructuring costs, and certain other special items. The Company generally uses the term “adjusted” when referring to these non-GAAP amounts.
Management uses non-GAAP financial measures internally for strategic decision making, forecasting future results and evaluating current performance. By disclosing non-GAAP financial measures, management intends to provide investors with a more meaningful, consistent comparison of the Company’s operating results and trends for the periods presented. These non-GAAP financial measures are used in addition to and in conjunction with results presented in accordance with GAAP and reflect an additional way of viewing aspects of our operations that, when viewed with our GAAP results, provide a more complete understanding of factors and trends affecting our business. These non-GAAP measures should be considered as a supplement to, and not as a substitute for, or superior to, the corresponding measures calculated in accordance with generally accepted accounting principles.
Non-GAAP financial measures are not prepared in accordance with GAAP; therefore, the information is not necessarily comparable to similarly titled measures of other companies. A reconciliation of each non-GAAP historical financial measure to the most comparable GAAP measure is provided below.
24
Appendix
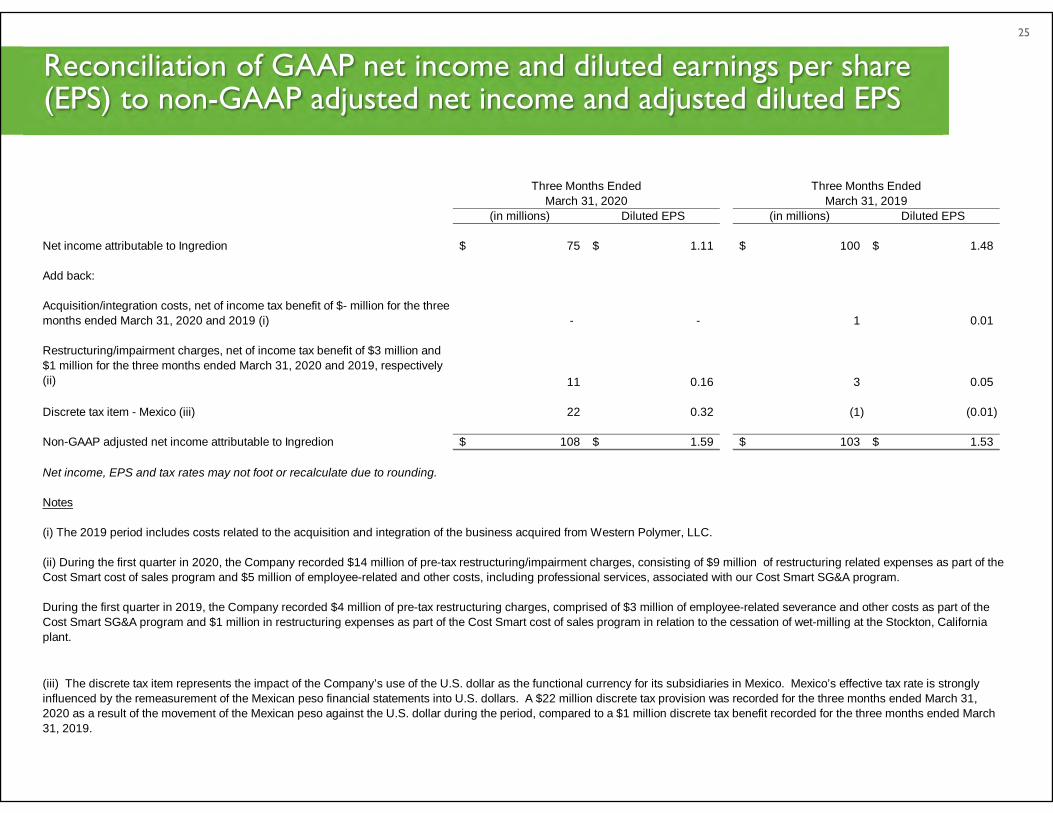
Reconciliation of GAAP net income and diluted earnings per share (EPS) to non-GAAP adjusted net income and adjusted diluted EPS
25
(in millions) Diluted EPS (in millions) Diluted EPS
Net income attributable to Ingredion 75$ 1.11$ 100$ 1.48$
Add back:
Acquisition/integration costs, net of income tax benefit of $- million for the three months ended March 31, 2020 and 2019 (i) - - 1 0.01
Restructuring/impairment charges, net of income tax benefit of $3 million and $1 million for the three months ended March 31, 2020 and 2019, respectively (ii) 11 0.16 3 0.05
Discrete tax item - Mexico (iii) 22 0.32 (1) (0.01)
Non-GAAP adjusted net income attributable to Ingredion 108$ 1.59$ 103$ 1.53$
Notes
March 31, 2020 March 31, 2019Three Months Ended Three Months Ended
Net income, EPS and tax rates may not foot or recalculate due to rounding.
(i) The 2019 period includes costs related to the acquisition and integration of the business acquired from Western Polymer, LLC.
(ii) During the first quarter in 2020, the Company recorded $14 million of pre-tax restructuring/impairment charges, consisting of $9 million of restructuring related expenses as part of the Cost Smart cost of sales program and $5 million of employee-related and other costs, including professional services, associated with our Cost Smart SG&A program.
During the first quarter in 2019, the Company recorded $4 million of pre-tax restructuring charges, comprised of $3 million of employee-related severance and other costs as part of the Cost Smart SG&A program and $1 million in restructuring expenses as part of the Cost Smart cost of sales program in relation to the cessation of wet-milling at the Stockton, California plant.
(iii) The discrete tax item represents the impact of the Company’s use of the U.S. dollar as the functional currency for its subsidiaries in Mexico. Mexico’s effective tax rate is strongly influenced by the remeasurement of the Mexican peso financial statements into U.S. dollars. A $22 million discrete tax provision was recorded for the three months ended March 31, 2020 as a result of the movement of the Mexican peso against the U.S. dollar during the period, compared to a $1 million discrete tax benefit recorded for the three months ended March 31, 2019.
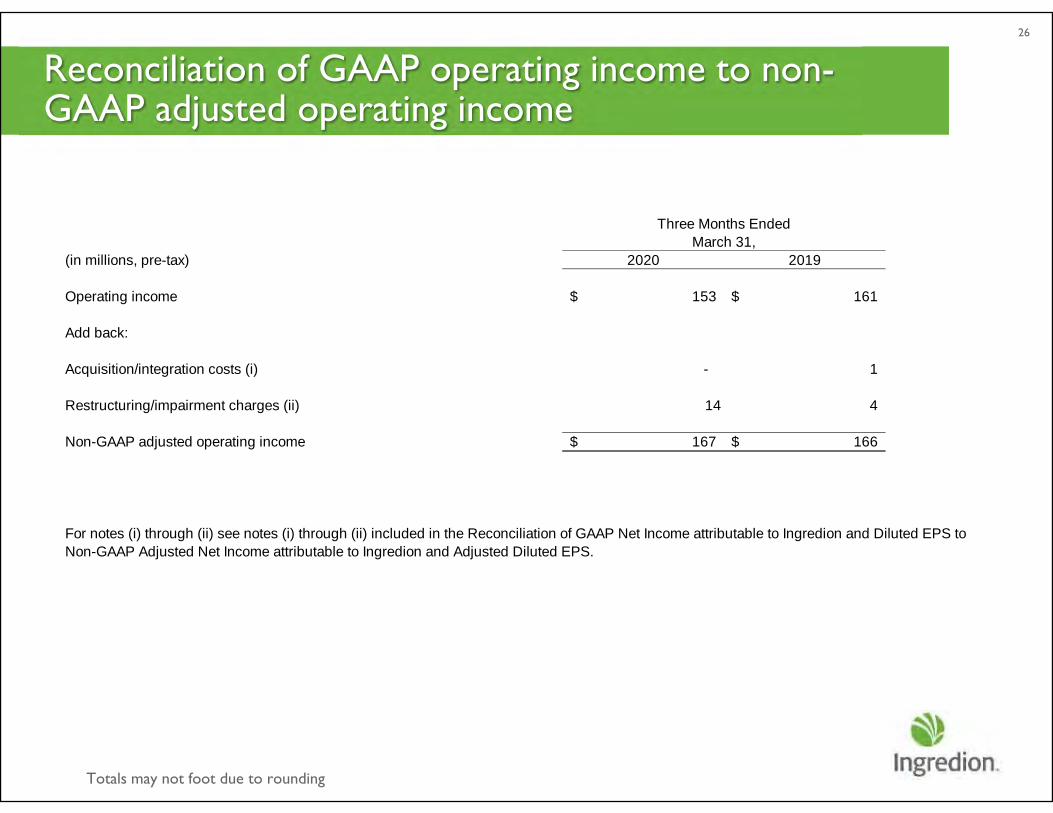
Reconciliation of GAAP operating income to non-GAAP adjusted operating income
26
Totals may not foot due to rounding
(in millions, pre-tax) 2020 2019 2020 ###
Operating income 153$ 161$ ### ##
Add back:
Acquisition/integration costs (i) - 1 0 -
Restructuring/impairment charges (ii) 14 4 14 0
Non-GAAP adjusted operating income 167$ 166$ ### ##
March 31, March 31,Three Months Ended e Months E
For notes (i) through (ii) see notes (i) through (ii) included in the Reconciliation of GAAP Net Income attributable to Ingredion and Diluted EPS to Non-GAAP Adjusted Net Income attributable to Ingredion and Adjusted Diluted EPS.
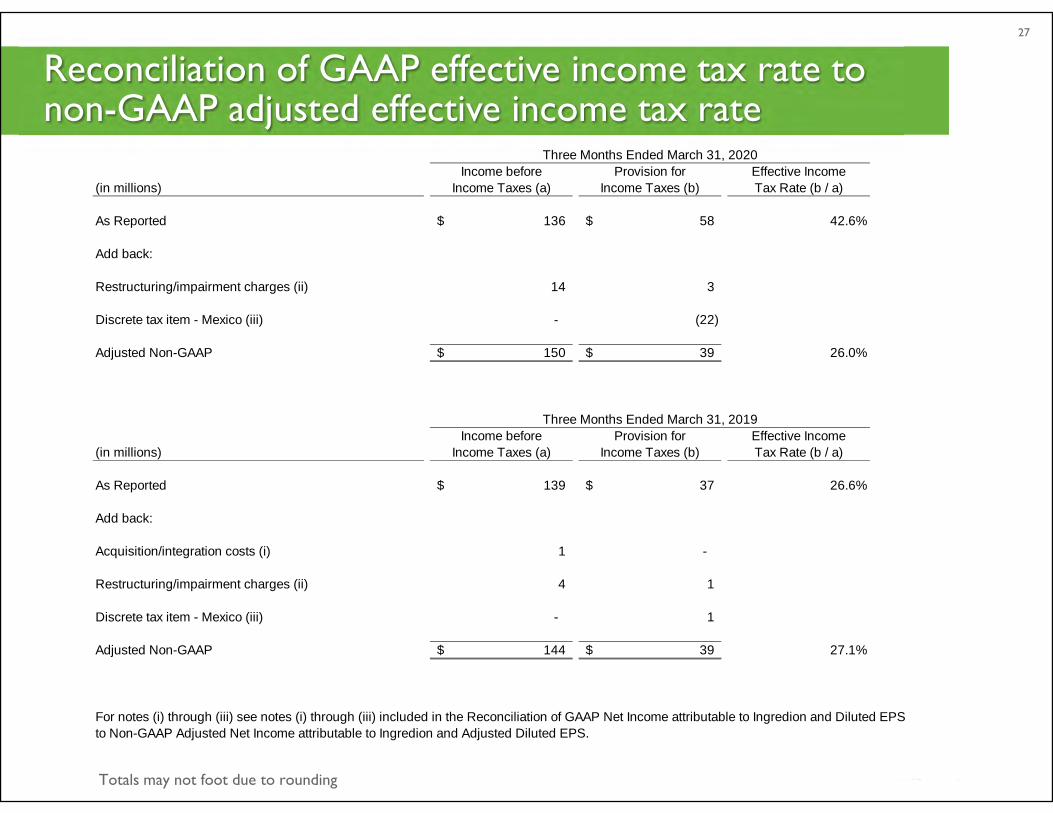
Reconciliation of GAAP effective income tax rate to non-GAAP adjusted effective income tax rate
27
Totals may not foot due to rounding
Income before Provision for Effective Income(in millions) Income Taxes (a) Income Taxes (b) Tax Rate (b / a)
As Reported 136$ 58$ 42.6%
Add back:
Restructuring/impairment charges (ii) 14 3
Discrete tax item - Mexico (iii) - (22)
Adjusted Non-GAAP 150$ 39$ 26.0%
Income before Provision for Effective Income(in millions) Income Taxes (a) Income Taxes (b) Tax Rate (b / a)
As Reported 139$ 37$ 26.6%
Add back:
Acquisition/integration costs (i) 1 -
Restructuring/impairment charges (ii) 4 1
Discrete tax item - Mexico (iii) - 1
Adjusted Non-GAAP 144$ 39$ 27.1%
Three Months Ended March 31, 2019
For notes (i) through (iii) see notes (i) through (iii) included in the Reconciliation of GAAP Net Income attributable to Ingredion and Diluted EPS to Non-GAAP Adjusted Net Income attributable to Ingredion and Adjusted Diluted EPS.
Three Months Ended March 31, 2020