Embed Size (px)
Citation preview

Copyright © 2021 COMTURE CORPORATION. All rights reserved.Copyright © 2021 COMTURE CORPORATION. All rights reserved.
COMTURE CORPORATION
1
First Quarter of the Fiscal Year Ended March 31, 2022
Financial Results Materials Transforming needs into solutions
Cloud
Big Data, AI
July 30, 2021
Koichi MukaiChairman

Copyright © 2021 COMTURE CORPORATION. All rights reserved.
1
2
Results of Operations
1Q of the FY Ended March 31, 2022

Copyright © 2021 COMTURE CORPORATION. All rights reserved.
3
)1Q FY3/21
Results
1Q FY3/22Results YoY
change (%)Amount
% to net
salesAmount
% to net
sales
Net sales4,960
million yen-
5,910
million yen- +19.2%
Operating profit557
million yen11.2%
932
million yen15.8% +67.2%
Ordinary profit560
million yen11.3%
929
million yen15.7% +65.7%
Profit
attributable to
owners of parent
369
million yen7.5%
558
million yen9.4% +51.0%
Net income per
share
11.60
yen-
17.52
yen- +51.0%
1-1 Financial Highlights (Announced July 30, 2021)
(*) COMTURE started applying Accounting Standard for Revenue Recognition (Accounting Standards Board of Japan
(ASBJ) Statement No. 29, March 31, 2020) in FY3/21, which is earlier than required.
Achieved 11 consecutive years of sales growth(*) and significant recovery in earnings with both sales and
earnings climbing to record highs

Copyright © 2021 COMTURE CORPORATION. All rights reserved.
Business Segment Performance
1Q FY3/21
Results
1Q FY3/22
Results
YoY change
(%)
Net sales 4,960 5,910 +19.2%
Cloud Solutions 1,995 2,244 +12.5%
Digital Solutions 498 572 +14.7%
Business Solutions 1,335 1,434 +7.4%
Platform, Operation Services 1,086 1,170 +7.7%
Digital Learning 44 489 +999.2%
Gross profit 1,024 1,451 +41.7%
Cloud Solutions 410 569 +38.9%
Digital Solutions 114 143 +26.0%
Business Solutions 255 311 +22.0%
Platform, Operation Services 254 284 +11.5%
Digital Learning -10 142 ー
0
2,000
4,000
6,000
1Q FY3/21Results
1Q FY3/22Results
0
300
600
900
1,200
1,500
1Q FY3/21Results
1Q FY3/22Results
Net sales
Gross profit
(Unit: million yen)
(Unit: million yen)
1-2
4
(Unit: million yen)
◼ Cloud Solutions Business
◼ Digital Solutions Business
◼ Business Solutions Business
◼ Platform, Operation Services
◼ Digital Learning

Copyright © 2021 COMTURE CORPORATION. All rights reserved.
5
Growth of the business solutions business due to the expansion of the SAPbusiness
+
-
+
-
+
+
+
Net sales Up 19.2% YoY (5,910 million yen)
Operating profit Up 67.2% YoY (932 million yen)
1-3
Sales per employee: up 5.4%
Growth of the cloud solutions business due to an increase in demand for cloud computing of internal systems, digitization of processes and other factors
Growth of the digital solutions business due to higher demand for data analysis services
Substantial investments in human resources, including more hiring of new employees, improvement of employee treatment and other activities
Contributing Factors
+
+
Growth of the platform, operation services business due to higher demand for cloud construction/transfer and outsourcing of the information systems division
Growth of the digital learning business due to the acquisition of Edifist Learning
Cost reduction through efforts to reform work styles, such as promoting
teleworking and web conferencing
Increase in costs and goodwill following the acquisition of Edifist Learning

Copyright © 2021 COMTURE CORPORATION. All rights reserved.
6
0
500
1,000
1Q FY3/21 1Q FY3/22
+376-xxx
-61
+268
-229
1-4 Components of Changes in Operating Profit
(Unit: million yen)
Operating profit
557
million yen
• Higher sales per employee(+5.4%)
• Increase in productivity
Earnings growth due to initiatives for more added
value
Increase dueto business
expansion and elimination of unprofitable
projects
Investmentsin human resources
• Higher labor cost per employee
Increase in expenses caused
by businessexpansion
Operating profit
932million yen
+375 million yen
+67.2%
YoY
• Growth of cloud solutions and digital solutions
• Higher cost due to M&As
• Higher cost for goodwill
+20Cost reduction through work style reforms
• Reduction of
commuting
expenses
• Reduction of
entertainment
expenses
• Reduction of
travel
expenses

Copyright © 2021 COMTURE CORPORATION. All rights reserved.
7
2 Earnings Forecast
FY3/22

Copyright © 2021 COMTURE CORPORATION. All rights reserved.
8
FY3/21Results
FY3/22
Initial forecast
FY3/22
Revised forecastYoY
change
(%)Amount% to net
salesAmount
% to net
salesAmount
(Increase rate)
% to net
sales
Net sales 20,868 - 23,000 -24,100(+4.8%)
- +15.5%
Operating
profit3,150 15.1% 3,500 15.2%
3,800(+8.6%)
15.8% +20.6%
Ordinary
profit3,192 15.3% 3,500 15.2%
3,800(+8.5%)
15.7% +19.0%
Profit
attributable to
owners of
parent
2,083 10.0% 2,380 10.3%2,400
(+0.8%)9.9% +15.2%
Net income
per share65.38 yen - 74.67 yen -
75.30 yen(+0.8%)
- +15.2%
Aiming for 12 consecutive years of sales growth and
11 consecutive years of earnings growth, reaching new record highs
2-1 FY3/22 Earnings Forecast
*COMTURE started applying Accounting Standard for Revenue Recognition (Accounting Standards Board of Japan (ASBJ)
Statement No. 29, March 31, 2020) in FY3/21, which is earlier than required.
Upward revision of earnings forecast on July 30, 2021
(Unit: million yen)

Copyright © 2021 COMTURE CORPORATION. All rights reserved.
FY3/21
Results
FY3/22
Forecast
YoY change
(%)
Net sales 20,868 24,100 +15.5%
Cloud Solutions 8,063 9,300 +15.3%
Digital Solutions 2,424 2,768 +14.2%
Business Solutions 5,661 5,965 +5.4%
Platform, Operation Services 4,486 4,743 +5.7%
Digital Learning 233 1,322 +467.0%
Gross profit 4,891 6,062 +23.9%
Cloud Solutions 1,863 2,466 +32.3%
Digital Solutions 660 759 +15.0%
Business Solutions 1,272 1,369 +7.6%
Platform, Operation Services 1,085 1,145 +3.5%
Digital Learning 9 321 +3433.4%
0
5,000
10,000
15,000
20,000
25,000
FY3/21Results
FY3/22Forecast
0
1,000
2,000
3,000
4,000
5,000
6,000
FY3/21Results
FY3/22Forecast
Net sales
Gross profit
(Unit: million yen)
(Unit: million yen)
2-2 Business Segment Forecast
9
(Unit: million yen)
◼ Cloud Solutions Business
◼ Digital Solutions Business
◼ Business Solutions Business
◼ Platform, Operation Services
◼ Digital Learning

Copyright © 2021 COMTURE CORPORATION. All rights reserved.
69.4 66.2 67.3
55.6 58.4 53.3
56.6
69.4
75.8 74.9 76.7
0.0
25.0
50.0
75.0
FY3/12 FY3/13 FY3/14 FY3/15 FY3/16 FY3/17 FY3/18 FY3/19 FY3/20 FY3/21 FY3/22(Forecast)
COMTURE equity ratio COMTURE ROE The average ROE of companies listed on TSE first section(*)
18.5
6.4 8.54.8 5.5
8.1 7.7 7.3 7.9 9.1 8.3 6.2
11.218.5 20.6 21.7
27.729.7
31.9
26.0
19.5 17.7
2-3 Financial Soundness and High Profitability
The goals are a shareholder’s equity of
more than 70% and a high ROE
A high equity ratio for
financial soundness
(Unit: %)
A high ROE due to strong
growth and earnings
(*Source: Mizuho Securities)
As in FY3/20, the ROE was much higher than the average for all TSE first section companies.
10
Copyright © 2021 COMTURE CORPORATION. All rights reserved.
11
3 Shareholder Returns

Copyright © 2021 COMTURE CORPORATION. All rights reserved.
12
3.00 3.674.75
7.25 7.75 8.25
1.83 2.674.00 4.67
3.003.67
4.75
7.257.75
8.25
3.00
3.70
4.75
7.257.75
9.25
0.83 1.11 1.22 1.44 1.56 1.67 2.06
2.50
4.334.00
6.33
3.83
5.20
9.75
7.25
7.75
9.25
11.9 12.4 13.2
15.9 16.4
22.6 25.5
28.7
36.1
39.6 38.9
35.2 33.9
39.2
46.6
47.4 46.8
0
10
20
30
40
50
60
FY3/06 FY3/07 FY3/08 FY3/09 FY3/10 FY3/11 FY3/12 FY3/13 FY3/14 FY3/15 FY3/16 FY3/17 FY3/18 FY3/19 FY3/20 FY3/21 FY3/22(Plan)
0
5
10
15
20
25
30
35
4Q dividend per share
3Q dividend per share
2Q dividend per share
1Q dividend per share
Payout ratio (%)
31.00
(Unit: yen)
1.50 yenDividend increase
(Unit: %)
7.00
0.33 yenCommemorative
dividendfor being listed
on TSE first section
0.33 yenCommemorative
dividend for COMTURE’s 30th anniversary
Plan to raise the dividend for the 17th consecutive year
0.83 yenDividend increase
11.00
Announced an annual dividend
increase of 2.00 yen on July 30, 2021
4.00 yen dividend increase YoY
Dividend payout ratio of 46.5%
8.00
16.24
29.00
5.00 yenDividend increase
3-1
COMTURE conducted a 3-for-1 common stock split effective on October 1, 2017 and a 2-for-1 common stock split effective on October 1, 2019.
Dividend per share has been calculated as if these stock splits had taken place at the beginning of FY3/06.
4.00 yenDividend
increase YoY
Dividend Growth
4.33
24.00
35.00
12.83
1.00 yenDividend increase
1.00 yenDividend increase
Copyright © 2021 COMTURE CORPORATION. All rights reserved.
13
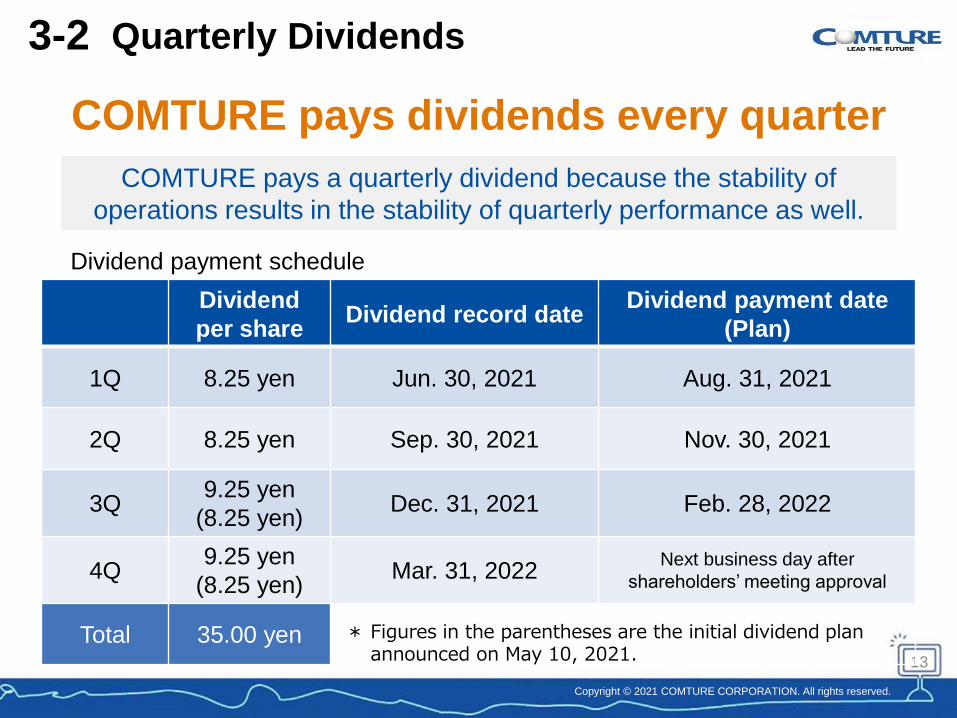
COMTURE pays a quarterly dividend because the stability of
operations results in the stability of quarterly performance as well.
Dividend
per shareDividend record date
Dividend payment date
(Plan)
1Q 8.25 yen Jun. 30, 2021 Aug. 31, 2021
2Q 8.25 yen Sep. 30, 2021 Nov. 30, 2021
3Q9.25 yen
(8.25 yen)Dec. 31, 2021 Feb. 28, 2022
4Q9.25 yen
(8.25 yen)Mar. 31, 2022
Next business day after
shareholders’ meeting approval
Total 35.00 yen
Dividend payment schedule
COMTURE pays dividends every quarter
3-2 Quarterly Dividends
* Figures in the parentheses are the initial dividend plan announced on May 10, 2021.

Copyright © 2021 COMTURE CORPORATION. All rights reserved.
14
Shareholders of record at the end of September and March every
year who own at least 300 shares receive prepaid QUO cards
worth 1,000 yen (2,000 yen every fiscal year).
* Dividend of 10,500 yen + prepaid QUO cards worth 2,000 yen
= 12,500 yen annually
• The payout ratio including QUO cards
are expected to be 55.3% for the
fiscal year ending March 31, 2022
(for shareholders holding 300 shares)
Shareholders receive special benefits
in addition to dividends
3-3 Shareholder Benefit Program

Copyright © 2021 COMTURE CORPORATION. All rights reserved.
Precautions
15
⚫ This presentation was prepared to provide information about COMTURE and is not a solicitation to invest
in COMTURE.
⚫ COMTURE exercised care regarding the accuracy of information in this presentation but does not
guarantee that this information is complete.
⚫ COMTURE assumes no responsibility whatsoever concerning any losses or damages resulting from the
use of information in this presentation.
⚫ Forecasts and other forward-looking statements in this presentation are based on the judgments of
COMTURE using information that was available when this presentation was prepared and incorporate
risks and uncertainties. As a result, actual performance may differ significantly from the forward-looking
statements in this presentation due to changes in market conditions or many other reasons.
Inquiries
Investors Relations, Corporate Planning Department
COMTURE CORPORATION
Tel: +81-(0)3-5745-9702 E-mail: [email protected]