Embed Size (px)
Citation preview

First Results of the JIP on Ultrasonic
Meters in Wet Gas Applications
Dennis van Putten - DNV-GL
Henk Riezebos - DNV-GL

DNV GL © 2013 March 17th 2015 SAFER, SMARTER, GREENER DNV GL © 2013
March 17th 2015
Dennis van Putten, Henk Riezebos
OIL & GAS
JIP US meters in wet gas applications
2
First results
DNV GL © 2013 March 17th 2015
Overview
3
JIP Project:
• Background and Goals
• Organization
JIP Project Outline
• Literature study
• Test Section Design and Procedures
JIP Preliminary Results
• First Test Results and General Physical Behaviour
• Development of Correction Algorithm
Conclusions

DNV GL © 2013 March 17th 2015
JIP Project: Background
4
Main drivers for USM wet gas field application:
- Proven track record for accurate fiscal metering purposes in dry gas
- Generic design well equipped for wet gas field development:
• Large range-ability, nearly full bore and negligible differential pressure
- Continuous improvement of USM design for wet gas environments (geometry, diagnostics)
- Also clamp-on technologies available
US meters are already used widely in wet gas applications, but:
- No generic test guidelines or qualification program for US meters in wet gas
- Not a lot of independent (third party) test results
- No agreed correction algorithm for gas volume flow w.r.t. wetness fraction

DNV GL © 2013 March 17th 2015
JIP Project: Project goals
5
Main goals of the JIP:
- Build solid foundation for widely accepted use of USM in wet gas applications
- Develop commonly accepted correction algorithm for gas volume flow w.r.t. wetness fraction based on:
• Solid theoretical framework from fundamental multiphase physics
• Experimental data from testing: JIP US and published literature

DNV GL © 2013 March 17th 2015
JIP Project: Organization
6
Project members and organization:
Technical Reference Committee
(manufacturers)
Steering Committee(E&Ps + DNV GL)
Project Manager(DNV GL)
Project Sponsor
Technical Lead – mechanical / Loop
Teachnical Lead – Testing & Algorithm
Technical Experts
Manufacturers
Instrumentation Engineer
Testing Coordinator
Operator (Head)
DNV GL © 2013 March 17th 2015
JIP Project Outline
7
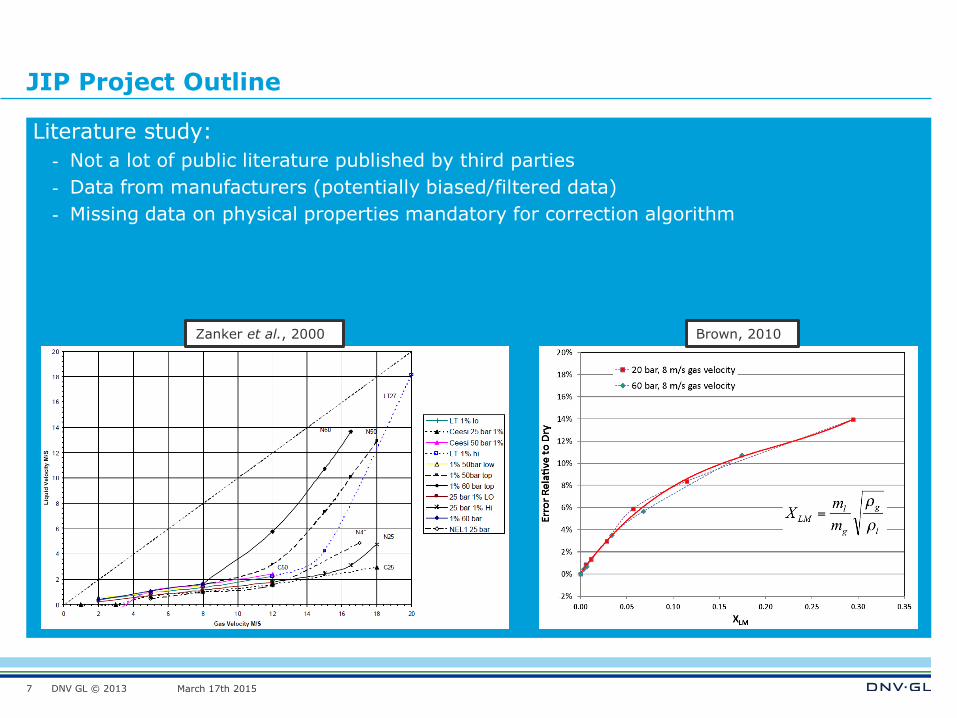
Literature study:
- Not a lot of public literature published by third parties
- Data from manufacturers (potentially biased/filtered data)
- Missing data on physical properties mandatory for correction algorithm
Zanker et al., 2000 Brown, 2010

DNV GL © 2013 March 17th 2015
JIP Project Outline
8
Literature study:
- Not a lot of public literature published by third parties
- Data from manufacturers (potentially biased/filtered data)
- Missing data on physical properties mandatory for correction algorithm
Test section design:
- Design choices by all project partners: horizontal 6” test line
- Design manufacturer specific: cross-talk boundaries, upstream development length
- Design for correction algorithm: stabile multiphase flow regimes for all US meters
Top view test section

DNV GL © 2013 March 17th 2015
JIP Project Outline
9
Literature study:
- Not a lot of public literature published by third parties
- Data from manufacturers (potentially biased/filtered data)
- Missing data on physical properties mandatory for correction algorithm
Test section design:
- Design choices by all project partners: horizontal 6” test line
- Design manufacturer specific: cross-talk boundaries, upstream development length
- Design for correction algorithm: stabile multiphase flow regimes for all US meters

DNV GL © 2013 March 17th 2015
JIP Project Outline
10
Core test matrix definition:
- Based on dimensionless numbers from fundamental multiphase flow equations relevant for US meter
- Expected dominant dimensionless numbers for wet gas flow
- Core test matrix:
• Frg = [0.7 1.2 1.7 2.2] + 2.5
• XLM = [0.01 0.02 0.04 0.08 0.15 0.3]
• DR = [0.01-0.03], 6 levels
• Pressure levels chosen such that: DR gas/oil (low p) and DR gas/water (high p) coincide
- Additional variations:
• Liquid phase oil or water: strong effect on surface tension and so on Weg
• Temperature: strong effect on liquid viscosity and so Rel
• Liquid mixtures: strong effect on liquid viscosity and so Rel
- Approximately 200 test points

DNV GL © 2013 March 17th 2015
JIP Project Outline
11
Strict test protocol:
- Baseline test consisting of 8 dry gas test points, after which adjustments can be made to the US meter to match reference
- Wet gas “blind” test matrix, no access to test setup for the manufacturers
- Test witnessed by steering committee
Data logging:
- Two output signals from US meter to DNV GL DAQ system (averaged over 10 min):
• Volumetric flow rate (subject to internal reconstruction algorithm)
• Speed of sound
- Manufacturers log diagnostics for test point validation (traffic light system)
Additional data, visualization of flow regimes:
- Liquid level monitored manually and video logging (upstream/downstream)
- No change in flow regime observed

DNV GL © 2013 March 17th 2015
JIP First Results: Baseline
12
Baseline test all US meters:
- Out-of-the-box performances: 250, 500, 750, 1000 m3/h (solid dots)
- Dry gas data points: 2 check points after baseline and during wet gas matrix (open circles)
Note: • Presentation of results in public
domain
• All presented data is labelled “green” by manufacturers
• No distinction between manufacturers

DNV GL © 2013 March 17th 2015
JIP First Results: Wet gas
13
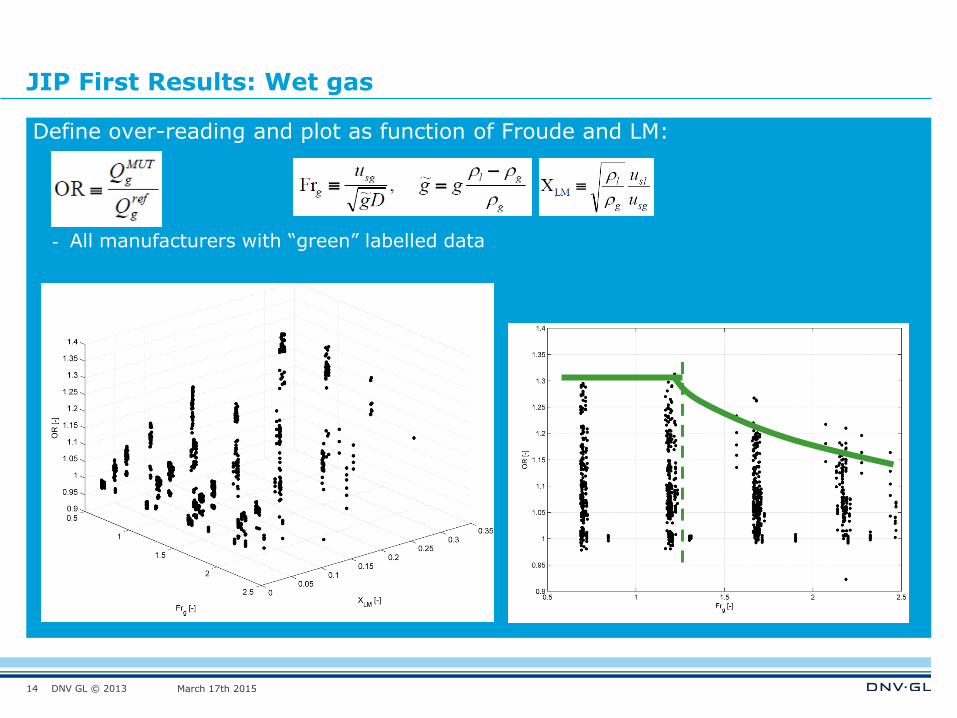
Define over-reading and plot as function of Froude and LM:
- All manufacturers with “green” labelled data
DNV GL © 2013 March 17th 2015
JIP First Results: Wet gas
14
Define over-reading and plot as function of Froude and LM:
- All manufacturers with “green” labelled data

DNV GL © 2013 March 17th 2015
JIP First Results: Development of correction algorithm
15
First version of correction algorithm has been developed: - Discussion ongoing between JIP members to further improve the algorithm
- Including data from references: Cameron, Flexim, SICK and Daniel
- Extension of data to e.g. Frg = 5.5, p = 75 bar, D = 4” and 8”, different fluids

DNV GL © 2013 March 17th 2015
JIP First Results: Development of correction algorithm
16
First version of correction algorithm has been developed: - Discussion ongoing between JIP members to further improve the algorithm
- Including data from references: Cameron, Flexim, SICK and Daniel
- Extension of data to e.g. Frg = 5.5, p = 75 bar, D = 4” and 8”, different fluids

DNV GL © 2013 March 17th 2015
JIP First Results: Ramp up tests
17
Ramp-up of liquid flow:
- Frg = 1.2 with water injection up to 13% LVF
- Similar behaviour for Frg = 2.4 and for oil injection
- 3 US meters continued to give data
DNV GL © 2013 March 17th 2015
JIP First Results: Speed of Sound
18
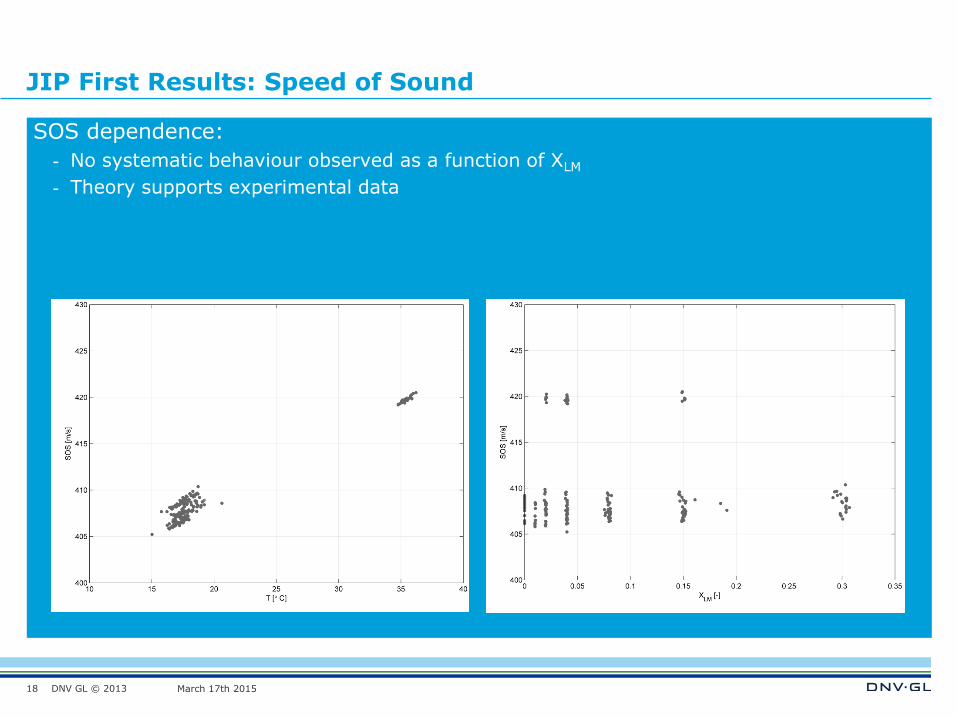
SOS dependence:
- No systematic behaviour observed as a function of XLM
- Theory supports experimental data

DNV GL © 2013 March 17th 2015
Conclusions
19
Setup of test matrix in terms of dimensionless numbers aids in the development of the correction algorithm
Strict test protocols manage the expectations and avoids discussions about tweaking meters
A correction algorithm seems feasible and data from literature seems to support the current correction algorithm

DNV GL © 2013 March 17th 2015
SAFER, SMARTER, GREENER
www.dnvgl.com
Thank you!
20
+31 50 700 9744