Embed Size (px)
Citation preview

1
© 2005 Arbitron Inc.
• portable people meter
First-Time Electronic Data on Out-of-Home and Time-Shifted Television ViewingNew Insights About Who, What and When
Bob Patchen, vice president, Research Standards and PracticesBeth Webb, manager, PPM Methods and Analysis
05-PPM-934 6/05

3
© 2005 Arbitron Inc.
• portable people meter
The New Ratings Paradigm• When it comes to media planning, the new
mantra among leading advertisers is:» I need to know my customers! I need to know who
they are, what they’re doing, and when and where they are doing it.
» I need to know how to reach my customers throughout the day, wherever they are, using the most efficient and effective means available.
» These goals cannot be met with the existing television ratings systems.
Why does having electronic data on out-of-home and time-shifted viewing matter?Because when it comes to media planning, the new mantra among advertisers is: I need to know my customers! I need to know who they are, what they’re doing, and when and where they are doing it.I need to know how to reach my customers throughout the day, wherever they are, using the most efficient and effective means available.And these goals cannot be met with the existing television ratings systems.

4
© 2005 Arbitron Inc.
• portable people meter
The PPMSM Measures Total Viewing
• The PPM is wireless and portable, so it measures viewing both at home and out of home.
• It measures both live and time-shifted viewing, automatically, for each metered person.
• For the first time we can electronically measure all TV consumption, whenever and wherever it occurs.
However, PPM measures total viewing. It’s wireless and portable, so it measures both at home and out-of-home viewing.It automatically measures both live and time-shifted viewing for each person. So for the first time all TV consumption can be electronically measured wherever it occurs.

5
© 2005 Arbitron Inc.
• portable people meter
Many of you are already familiar with the PPM system, so I’ll just provide a quick overview. When a household is recruited to join the PPM panel, each person age 6 and older is provided with their own personal meter and recharger, shown in the picture. The panelist is given three simple instructions to follow: undock the meter upon awakening, wear it all day, and dock it when you go to bed. Since the meter has a motion detector, we know on any given day if the panelist complied with these instructions.The meter automatically detects exposure to encoded audio. These exposure data are downloaded by the recharger and sent to a household data hub, which is connected to the household telephone in order to send the data back to Arbitron.

6
© 2005 Arbitron Inc.
• portable people meter
The Houston PPM Test
• Houston DMA® (population 5.1 million)
• Final panel size (July 2005)» 2,100 persons age 6+» Roughly 800 households» Installation is ongoing
• Most media outlets encoding for the test» 16 local TV stations» 46 cable channels» 43 radio stations
The data in this presentation are from our ongoing test panel located in the Houston DMA, which has a population of 5.1 million. The final panel size that will be achieved by July 2005 will be 2,100 persons ages 6+ in approximately 800 households. There are 16 local TV stations, 46 cable channels and 43 radio stations encoding in the market.

7
© 2005 Arbitron Inc.
• portable people meter
Survey Dates and Sample Data for Today’s Preliminary Report
• Two weeks: April 28-May 11, 2005
• 1,393 total persons installed in 531 households as of May 1, 2005
• Representative random sample of the total Houston television market
Today’s data are based on the first two weeks in the May survey month: April 28 –May 11. At that point, three independent sample replicates, each of which is a representative random sample of the marketplace, had been installed. The installed sample size was approximately 1,400 persons in 530 households.

8
© 2005 Arbitron Inc.
• portable people meter
PPM In-Tab Persons vs. Universe
53%
30%
16%
50%
31%
20%
Other Race/Ethnicity
Hispanic
Black
Universe PPM
May 2005, Waves 1-3
Race/Ethnicity
14%
17%
15%
16%
English-DominantHispanic
Spanish-DominantHispanic
Hispanic Language Use
On the next few bar charts, the gold bar on top is the population estimate, and the blue bar is the average daily in-tab sample percentage. As you can see, the in-tab sample closely represents the population on all of these demographic variables: race/ethnicity, language use among Hispanics...

9
© 2005 Arbitron Inc.
• portable people meter
PPM In-Tab Persons vs. Universe
26%
74%
28%
72%
No Cable or Satellite
Cable and/or Satellite
Reception Type
41%
59%
41%
59%
Not Employed Full Time
Employed Full Time
Universe PPMEmployment Status (P18+)
May 2005, Waves 1-3
...employment status, TV reception type...

10
© 2005 Arbitron Inc.
• portable people meter
PPM In-Tab Persons vs. Universe
9%
17%
14%
11%
17%
13%
10%
10%
9%
18%
11%
10%
19%
12%
12%
9%
Men 55+
Men 34-54
Men 18-34
Women 55+
Women 34-54
Women 18-34
Teens 12-17
Children 6-11
Universe PPMSex/Age Group
May 2005, Waves 1-3
...and sex/age group.

11
© 2005 Arbitron Inc.
• portable people meter
15:35 14:38
All In-Tab Persons
Out of Dock Carried
Average Daily n = 917
May 2005, Waves 1-3, In-Tab Persons 6+, Median Times
Meters Are Undocked and Worn or Carried Nearly All Day
And the motion data show that in-tab panelists had their meters undocked and in motion nearly all day.

12
© 2005 Arbitron Inc.
• portable people meter
Important Limitations• Results are preliminary, not final
• Data represent only one U.S. market
• Data cover only two weeks in May 2005» Seasonal effects likely, such as for sports
viewing (e.g., Houston Rockets were in the NBA basketball play-offs)
• Results are based on less than the full planned panel size of 2,100 persons» July 2005 full-panel data release this September
• Differences not tested for statistical significance
Before getting to the out-of-home and time-shifting results, I do want to stress that these data are preliminary. They represent only one U.S. market and cover only two weeks in May. There may be seasonal effects during these weeks. For example, both the Houston Rockets and San Antonio Spurs were in the play-offs during this week. This may have affected the percentage of out-of-home viewing.It could also have driven some time-shifting if people recorded the game or frequently rewound to rewatch plays.In addition, these results are based on less than the full planned sample size. Data from July reflecting the full panel size will be released in September.And finally, it should be noted that at this point we’re simply looking at directional patterns, so none of these differences have been tested for statistical significance.

13
© 2005 Arbitron Inc.
• portable people meter
Out-of-Home (OOH) Viewing
Let’s look at the out-of-home viewing first.

14
© 2005 Arbitron Inc.
• portable people meter
How the “At-Home Beacon” Works
• In-home data collection hub emits low-power radio frequency (RF).
• The PPM unit reports “at home” when RF detected, “out of home” when RF not detected.
Data Collection HubInstalled in Home
PPMLow-PowerRadio Waves
To determine panelist location, a low-power radio frequency transmitter has been placed in the household’s data collection hub. The meter determines location status based upon the presence or absence of this transmission.

15
© 2005 Arbitron Inc.
• portable people meter
Radio’s OOH Share Is Generally Higher with PPM But Consistent with Diary Pattern Houston DMA, April 28-May 11, 2005, Persons 12+
65% 63%71% 70%
38%
74%65%
82% 77%
62%
0%
25%
50%
75%
100%
6AM-12Mid 6AM-10AM 10AM-3PM 3PM-7PM 7PM-12MidOOH Share of Total AQH Rating
Radio Diary PPM
Before looking at the TV results, let’s compare the PPM radio out-of-home percentages to those reported by the radio diary. For each daypart, the blue bar on the left shows the percentage of out-of-home viewing as reported by the diary, and the gold bar on the right is the PPM percentage. The PPM generally shows a higher out-of-home percentage, but the overall pattern by daypart is consistent with the diary. In morning drive, the PPM and the diary report almost the same out-of-home percentage, while the PPM reports higher out-of-home in the other dayparts.

16
© 2005 Arbitron Inc.
• portable people meter
Share of Total AQH Rating from OOH Viewing Preliminary Data, Houston Panel, April 28-May 11, 2005, Persons 6+
13%
87%
At HomeOut of Home
NB: OOH share for these dates was impacted by NBA Play-Off games with Houston and San Antonio, TX, teams.
For television, the overall out-of-home viewing percentage reported by PPM for these two weeks is 13%. Again, this is a figure for this two week period and there may be a number of things influencing it. In particular, many of the basketball playoff games during this period were only on cable and since 26% of panelists live in households without cable, if they wanted to watch the games they had to watch them out-of-home.

17
© 2005 Arbitron Inc.
• portable people meter
Index of OOH Viewing Consistent Across SexesHouston Panel, April 28–May 11, 2005, Person 6+
100 10596
0
50
100
150
Total Male Female
% Q
Hs
OO
H In
dexe
d to
P6+
Next we'll look at the relationships by demos. In the next few bar graphs Out of home percentages by demo are indexed to the Persons 6+ overall percentage. Males 6+ index at 105 and Females 6+ index at 96 so the percentage of viewing that is out of home is pretty consistent across sex.

18
© 2005 Arbitron Inc.
• portable people meter
Persons 18-49 Have Highest OOH IndexHouston Panel, April 28–May 11, 2005, Persons 6+
68
110102
0
50
100
150
Age 6-17 Age 18-49 Age 50+
% Q
Hs
OO
H In
dexe
d to
P6+
Persons 18+ show considerably more out-of-home viewing than those under 18 with persons 18-49 showing the highest amount with an index of 110.

19
© 2005 Arbitron Inc.
• portable people meter
“Other,” Black Have Higher OOH Indexes Than HispanicHouston Panel, April 28–May 11, 2005, Persons 6+
103
87
110
0
50
100
150
Black Hispanic Other
% Q
Hs
OO
H In
dexe
d to
P6+
By race/ethnicity, Hispanics show the lowest percentage of out-of-home viewing. The 'other' category, which consists of all non-Black and non-Hispanic persons, indexes the highest at 110 and blacks are just slightly lower at 103.

20
© 2005 Arbitron Inc.
• portable people meter
Black Persons 18-49 Showed Highest Overall OOH Index Houston Panel, April 28–May 11, 2005, Persons 18-49
125
101113
0
50
100
150
Black Hispanic Other
% Q
Hs
OO
H In
dexe
d to
P6+
However, if you look at Persons 18-49, blacks index the highest with an index of 125. Again, initial analyses suggest that this might be a basketball effect.
21
© 2005 Arbitron Inc.
• portable people meter
Out-of-Home Television Viewing: Some Common Myths• Mostly in bars and restaurants
• Mostly men watching sports
• Primarily nights and weekends
• Little if any viewer attention
• “Low-value” audience
The conventional wisdom about out-of-home television viewing is that it takes place mostly in bars and restaurants and consists of mostly men who are watching sports-oriented programming. The belief is that it takes place mostly on nights and weekends and is a low-value audience due to lack of viewer attention. We've already shown in a previous slide that part of this isn't true—that men and women have roughly equal percentages of out-of-home viewing overall.
22
© 2005 Arbitron Inc.
• portable people meter
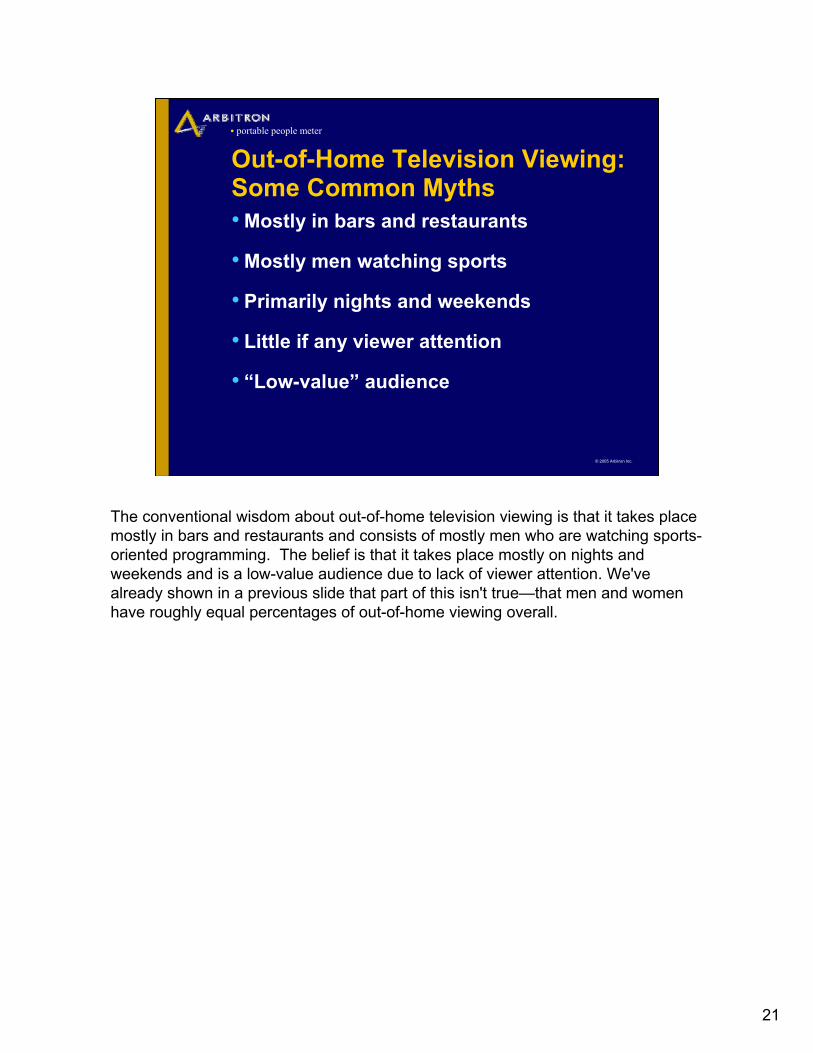
Viewing at Work Is Far More Common Than Viewing in Bars and RestaurantsU.S. OOH Viewing Locations by Percent of OOH Viewing Minutes (2003)
• Someone else’s home 57%
• At work 24%
• Bar/restaurant 5%
• Doctor’s/dentist’s office 4%
• All other places 10%
• In-tab (P18+) 1,493
• Total OOH QHs 2,845
Source: Arbitron Media Lifestyles study, Wi 2003, Total P18+, Top 100 DMAs
However, there have been data to contradict this. In an Arbitron telephone study conducted in 100 DMAs, respondents were asked to report their yesterday TV and radio consumption along with location. In this study, most out-of-home viewing was reported as taking place at someone else’s home, but the second most frequent category, with 24 percent of the out-of-home viewing, was “at work.” “At work,” of course, doesn’t just include offices. “At work” includes convenience stores, hospitals, factories, airports—all sorts of places where a TV might be available—and types of jobs where workers might bring their own portable TV, such as a security guard, gas station attendant or toll booth worker. The amount of viewing “at work” was almost five times higher than the amount reported in bars and restaurants.
23
© 2005 Arbitron Inc.
• portable people meter
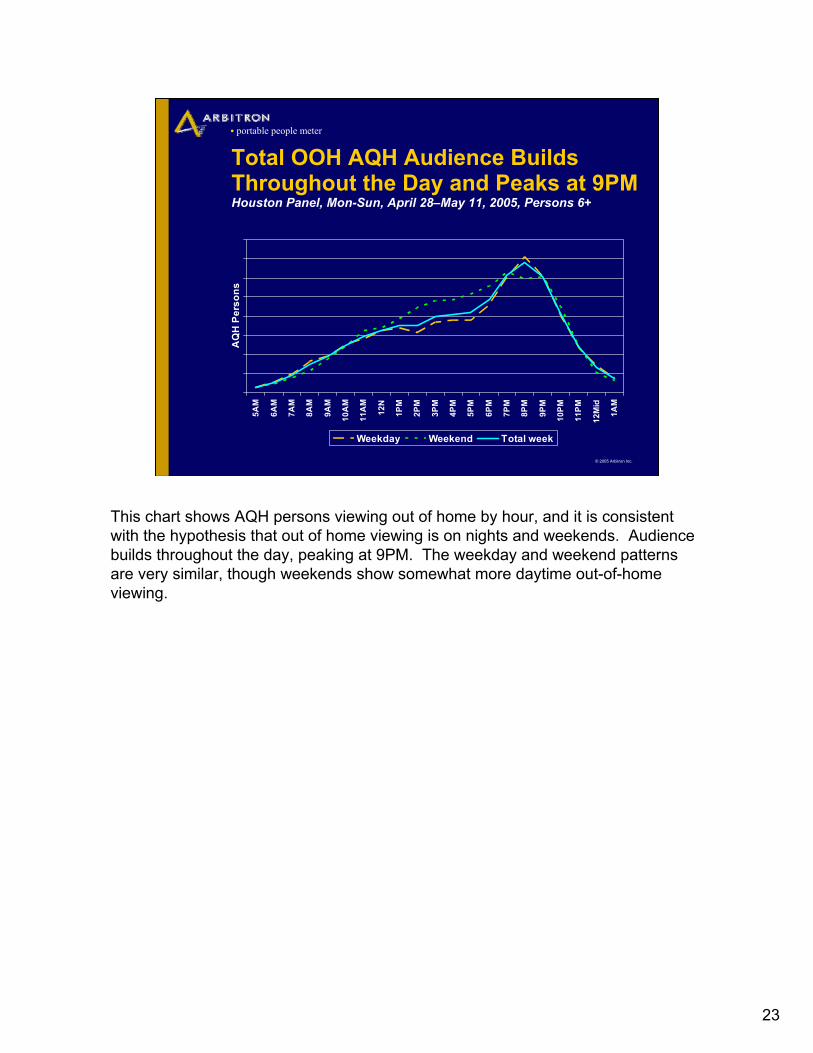
Total OOH AQH Audience Builds Throughout the Day and Peaks at 9PMHouston Panel, Mon-Sun, April 28–May 11, 2005, Persons 6+
5AM
6AM
7AM
8AM
9AM
10A
M
11A
M
12N
1PM
2PM
3PM
4PM
5PM
6PM
7PM
8PM
9PM
10PM
11PM
12M
id
1AM
AQ
H P
erso
ns
Weekday Weekend Total week
This chart shows AQH persons viewing out of home by hour, and it is consistent with the hypothesis that out of home viewing is on nights and weekends. Audience builds throughout the day, peaking at 9PM. The weekday and weekend patterns are very similar, though weekends show somewhat more daytime out-of-home viewing.

24
© 2005 Arbitron Inc.
• portable people meter
But OOH Overall Share of Audience Is Largest in DaytimeHouston Panel, Mon-Sun, April 28–May 11, 2005, Persons 6+
5AM
6AM
7AM
8AM
9AM
10A
M
11A
M
12N
1PM
2PM
3PM
4PM
5PM
6PM
7PM
8PM
9PM
10PM
11PM
12M
id
1AM
% o
f Tot
al T
V Vi
ewin
g
Weekday Weekend Total
But if you look at out-of-home viewing as a share of total television viewing, you see that the peak is actually during the daytime. This means that on a percentage basis, the daytime ratings are most affected when out-of-home viewing is not included in the total television viewing. This is also consistent with the fact that the difference between PPM and meter-diary TV ratings tended to be much larger during the daytime period than during evening or prime time.

25
© 2005 Arbitron Inc.
• portable people meter
For Both Men and Women 18-49, OOH Viewing Share Peaks 1PM-4PMHouston Panel Mon-Sun, April 28–May 11, 2005, Persons 18-49
5AM
6AM
7AM
8AM
9AM
10A
M
11A
M
12N
1PM
2PM
3PM
4PM
5PM
6PM
7PM
8PM
9PM
10PM
11PM
12M
id
1AM
% o
f Tot
al T
V Vi
ewin
g
W18-49 M18-49
Looking at just Persons 18-49, the share of out-of-home audience peaks between 1PM and 4PM for both men and women. Men have a larger percentage of OOH viewing during the evening, while the daytime OOH share of viewing is about equal between men and women.However, since women’s AQH ratings are considerably higher than men’s during the daytime period, particularly on weekdays…

26
© 2005 Arbitron Inc.
• portable people meter
Women 18-49 Dominate Daytime OOH Viewing; Men 18-49 Are Higher in Prime Houston Panel, Mon-Fri, April 28–May 11, 2005, Persons 18-49
5AM
6AM
7AM
8AM
9AM
10A
M
11A
M
12N
1PM
2PM
3PM
4PM
5PM
6PM
7PM
8PM
9PM
10PM
11PM
12M
id
1AM
AQ
H P
erso
ns
W18-49 M18-49
Soaps & Oprah?
NBA Play-Offs?
If you look at OOH audience on a rating or AQH Persons basis, there are more women than men watching TV out of home during the day when top-rated programs include soap operas and talk shows such as “Oprah” or “Dr. Phil.”And, consistent with the share curve, at night between about 9PM and 11PM, there are more men than women viewing out of home. Perhaps some of this is due to the NBA basketball play-offs during this time?

27
© 2005 Arbitron Inc.
• portable people meter
• CNBC
• The Speed Channel
• ESPN2
• Galavision
• CNN
Top Five Channels Based on Share of Their Audience in OOH LocationsHouston Panel, Total Week, Total Day, April 28–May 11, 2005, Persons 6+
During this two-week period, the top five channels as ranked by the percent of their audience that was out of home were CNBC, The Speed Channel (which primarily consists of programs related to auto and motorcycle racing), ESPN2, Galavisionand CNN.

28
© 2005 Arbitron Inc.
• portable people meter
The Announcement of the Michael Jackson Verdict Drives Jump in Percentage of OOH Viewing Houston Panel, Unweighted, Persons 6+
29%
16%
45%
28%
0%
25%
50%
75%
100%
CNN ABC Affiliate
% o
f QH
s O
OH
Previous 3 Mondays, 4:00PM-4:30PM Monday, June 13, 4:00PM-4:30Pm
+55%
+70%
And now, some late-breaking news. On the afternoon of Monday, June 13, a verdict was rendered in the Michael Jackson trial. The PPM showed that CNN and the local ABC affiliate, which has a news program during this time period, saw a significant bump in their overall ratings due to this news. And as shown in this chart, this increase in overall ratings was at least partly due to an increase in out-of-home ratings, which makes sense since many people would be away from home on a Monday afternoon between 4PM and 4:30PM. CNN showed a 55 percent increase in the percentage of their audience that was out of home as compared to a typical Monday afternoon, while there was a 70 percent increase in out-of-home share for the ABC affiliate.
29
© 2005 Arbitron Inc.
• portable people meter
Preliminary Conclusions About Out-of-Home Viewing• Preliminary results are consistent with
substantial “at-work” viewing
• OOH TV viewing provides opportunities to reach both women and men
• Daytime is best for reaching Women 18-49 OOH
• Prime time is best for reaching Men 18-49 OOH
Some preliminary conclusions about out-of-home viewing:• Preliminary results are consistent with substantial “at-work” viewing.• Out-of-home TV viewing provides opportunities to reach both women and men. • Daytime is best for reaching Women 18-49 out of home. • Prime time is best for reaching Men 18-49 out of home.For all the reasons mentioned in the “Important Limitations” slide, these conclusions as well as the overall percentages should be considered preliminary. It will be important to see if these patterns hold up over time.

30
© 2005 Arbitron Inc.
• portable people meter
Time-Shifted Viewing
Now on to time-shifted viewing…

31
© 2005 Arbitron Inc.
• portable people meter
Goals for PPM Time-Shift Reporting• Identify personal exposures delayed by
three minutes or more
• Purpose is to measure and understand propensity for delayed viewing by program, genre and daypart
• Not intended to measure commercial “zipping and zapping” today, but this is possible going forward
The goal of PPM time-shift reporting is to identify personal exposures delayed by three minutes or more in order to measure and understand propensity for delayed viewing by program, genre and daypart.At this time, PPM is not intended to measure commercial “zipping and zapping,”though this will likely be possible going forward.

32
© 2005 Arbitron Inc.
• portable people meter
Time-Shifted TV Exposure
How is time-shifting detected?
• Broadcast time stamp with one-minute granularity embedded into media code
• Broadcast time stamp compared to exposure time stamp from meter to determine if shifted
• Only viewing that takes place within seven days of the broadcast time is credited
To be able to detect time-shifting, a broadcast time stamp with one-minute granularity is inserted into the media code. When a PPM detects a media code, it can also detect this time stamp. This broadcast time stamp is compared to the time stamp from the meter, which indicates when the exposure took place in order to determine whether or not the viewing was time-shifted. All time-shifted viewing is then credited to the original broadcast time so that the correct program will receive credit for the viewing.It’s important to note that since we finalize data after seven days, only viewing that takes place within seven days of the broadcast time is included.

33
© 2005 Arbitron Inc.
• portable people meter
Panelists in DVR Households Much More Likely to Have Time-Shifted ViewingHouston Panel, April 28–May 11, 2005, Persons 6+
1.4%
10.4%
0%
10%
20%
Persons in HHs Without DVRs Persons in HHs with DVRs
% o
f QH
s Ti
me-
Shift
ed
Not surprisingly, the PPM data show that panelists in DVR households are much more likely to view time-shifted programming. 1.4 percent of the viewing by panelists in non-DVR households is time-shifted. This time-shifting could be done by VCR, or it could possibly be out-of-home DVR exposure—we haven’t yet done any analyses cross-tabbing out-of-home and time-shifted to determine this.In DVR households, overall, 10.4 percent of total quarter-hours are viewed time-shifted, though, as we’ll see later, this varies considerably by daypart.

34
© 2005 Arbitron Inc.
• portable people meter
Panelists in DVR Households Average Slightly More Overall Viewing per DayThan Persons in Non-DVR HouseholdsHouston Panel, April 28–May 11, 2005 Persons 6+
5.7 Hrs.5.1 Hrs.
0
2
4
6
8
Persons in HHs Without DVRs Persons in HHs with DVRs
Avg
. Hrs
. of V
iew
ing
per D
ay
It’s also interesting to note that panelists in DVR households watch slightly more TV overall than panelists in non-DVR households—an average of 5.7 hours per day versus 5.1.

35
© 2005 Arbitron Inc.
• portable people meter
To Date, DVR Penetration in the Houston Panel Is Below 10%• 7.3% of installed households reported
owning a DVR
• 7.5% of installed panelists lived in households that reported owning a DVR
Installed Percentages of 4/28/05
Since the vast majority of time-shifting is taking place in DVR households, the rest of the data will focus only on DVR households. In May, 7.3 percent of installed households reporting having a DVR, and this represented about 7.5 percent of installed panelists.

36
© 2005 Arbitron Inc.
• portable people meter
Panelists 18-34 and 35-54 Most Likely to Live in DVR HouseholdsHouston Panel, April 28–May 11, 2005, Persons 6+
6.2%
8.3% 8.7%7.2%
0%
10%
20%
P6-17 P18-34 P35-54 P55+
% P
erso
ns in
DVR
Hou
seho
lds
Panelists ages 18-54 are most likely to live in a household with a DVR, though there weren’t large differences by age.

37
© 2005 Arbitron Inc.
• portable people meter
Black and Hispanic Panelists Less Likely to Live in DVR HouseholdsHouston Panel, April 28–May 11, 2005, Persons 6+
3.9%
5.8%
10.3%
0%
10%
20%
Black Hispanic Other
% P
erso
ns in
DVR
Hou
seho
lds
Black and Hispanic panelists are less likely than those of other races/ethnicities to live in a DVR household.

38
© 2005 Arbitron Inc.
• portable people meter
Total Time-Shifted Viewing Consistent Across SexHouston Panel, April 28–May 11, 2005, Persons 6+ in DVR Households
10.7% 10.4%
0%
10%
20%
Male Female
% o
f QH
s Ti
me-
Shift
ed
The next few slides compare the overall, total day, total week time-shifting percentages across some variables.The percentage of time-shifted viewing by panelists in DVR households does not differ by sex; it’s 10.7 percent for men and 10.4 percent for women.

39
© 2005 Arbitron Inc.
• portable people meter
Time-Shifting Viewing is Relatively Stable by Age GroupHouston Panel, April 28–May 11, 2005, Persons 6+ in DVR Households
9.0%
11.0%10.0%
0%
10%
20%
Age 6-17 Age 18-49 Age 50+
% o
f QH
s Ti
me-
Shift
ed
There are also relatively small differences in the amount of time-shifting across age groups.

40
© 2005 Arbitron Inc.
• portable people meter
Prime-Time Programs Are Most Likely To Be Time-ShiftedHouston Panel, April 28–May 11, 2005, Persons 6+ in DVR Households
10.6%
2.4%
6.8%
9.6%
20.7%
14.3%
6.3%
0%
5%
10%
15%
20%
25%
Total Day(5AM-1AM)
5AM-9AM 9AM-4PM 4PM-7PM 7PM-9PM 9PM-11PM
11PM-1AM
% o
f QH
s Ti
me-
Shift
ed
This chart shows the percentage of time-shifted viewing based upon the broadcast time of the program. Not surprisingly, prime-time programs are the most likely to be time-shifted. About 21 percent of prime-time viewing is time-shifted.

41
© 2005 Arbitron Inc.
• portable people meter
The Vast Majority of Time-Shifted Programming Is Viewed Within One-dayTime-Shifted Minutes, Unweighted, Houston Panel, April 28–May 11, 2005
84%
13%
3%0%
10%
20%
30%
40%
50%
60%
70%
80%
90%
Within 24 Hours ofBroadcast
24-48 Hours AfterBroadcast
48 Hours or More AfterBroadcast
% o
f Tim
e-Sh
ifted
Min
utes
The vast majority of time-shifted programming—84 percent—is viewed within 24 hours of the broadcast time. Thirteen percent is viewed 24 to 48 hours after the broadcast time, while only 3 percent is viewed two to seven days after the broadcast time.

42
© 2005 Arbitron Inc.
• portable people meter
Programs with Most Time-Shifted Viewing for April 28-May 11, 2005
• May 10 “American Idol”
• May 3 “American Idol”
• May 8 “Desperate Housewives”
• May 11 “Lost”
• May 4 “Lost”
Not surprisingly, the programs during this two-week period with the most time-shifted audience consisted of programs that had some of the top-rated overall audiences: two episodes of “American Idol,” an episode of “Desperate Housewives”and two episodes of “Lost.”

43
© 2005 Arbitron Inc.
• portable people meter
Considerable Variation in Time-Shifting Behavior
• Time-shifting on individual days ranged from 0% to 100%
• Averaging over the entire two-week period, individual panelist time-shifting ranged from 0% to 65%
• In many households, time-shifting behavior varies greatly among household members
Additionally, an important thing to note that I don’t believe has been fully explored in the DVR research thus far is that there is great variation in individual time-shifting behavior.Looking at individual days, the percentages of time-shifting ranged from zero percent to 100 percent. When we looked at individual panelists and aggregated their data over the two-week period in order to get the total percentage of their viewing that was time-shifted over two weeks, this percentage ranged from zero precent to 65 percent.But what was most interesting was the extent to which individuals within the same household showed varied amounts of time-shifting.The next few charts show time-shifted percentages from some individual households.

44
© 2005 Arbitron Inc.
• portable people meter
In Some Households, Members Show Similar Percentages of Time-Shifted ViewingApril 28–May 11, 2005
27%25%
0%
10%
20%
30%
40%
50%
Person 1 Person 2
Two-Person DVR Household
In some households, as shown in this chart, individuals showed very similar overall percentages. This is a two-person household. Over the two-week period, 27 percent of Person 1’s viewing was time-shifted as was 25 percent of Person 2’s viewing.

45
© 2005 Arbitron Inc.
• portable people meter
In Others, Household Members Showed More Varied Percentages of Time-ShiftingApril 28–May 11, 2005
23%
44%
33%
0%
10%
20%
30%
40%
50%
Person 1 Person 2 Person 3
Three-Person DVR Household
This chart shows a three-person household in which the percentage of time-shifted viewing varied a bit more among the household members—from 23 percent to 44 percent. However, all the household members showed some time-shifted viewing.

46
© 2005 Arbitron Inc.
• portable people meter
In Some HHs, Individual Members Don’t Have Any Time-Shifting at AllApril 28–May 11, 2005
25%23%
0%
27%
21%
0%
10%
20%
30%
40%
50%
Person 1 Person 2 Person 3 Person 4 Person 5
Five-Person DVR Household
There are some households in which one or two members of the household don’t do any time-shifted viewing at all. This is an example of a five-person household, where four of the people show similar percentages of time-shifting, but the fifth person appears to not use the DVR at all.

47
© 2005 Arbitron Inc.
• portable people meter
In Others, It Appears That the DVR Is a Personal DeviceApril 28–May 11, 2005
0% 0%
19%
0% 0%0%
10%
20%
30%
40%
50%
Person 1 Person 2 Person 3 Person 4 Person 5
Five-Person DVR Household
In other households, such as this one, where only one household member shows time-shifted viewing, it appears that the DVR is actually a personal device rather than a household device. Perhaps this is a roommate situation or a case where a teenage or young adult child has the DVR in his or her bedroom.

48
© 2005 Arbitron Inc.
• portable people meter
Preliminary Conclusions About Time-Shifted Viewing• Overall, only about two percent of viewing is time-
shifted, but 10 percent of viewing is time-shifted in DVR households.
• As DVR penetration grows, clearly the overall percentage of viewing that is time-shifted will grow.
• Prime-time programs are most likely to be time-shifted, with highest-rated programs showing the most time-shifting.
• Within DVR households, there is considerable person-to-person variation in the amount of time-shifting.
So our preliminary conclusions on time-shifting are:• Overall, only about two percent of viewing is time-shifted, but 10 percent of viewing is time-shifted in DVR households. • As DVR penetration grows, clearly the overall percentage of viewing that is time-shifted will grow. • Prime-time programs are most likely to be time-shifted, with highest-rated programs showing the most time-shifting.• Within DVR households, there is considerable person-to-person variation in the amount of time-shifting.

49
© 2005 Arbitron Inc.
• portable people meter
Next Steps
• Complete data for July with the full panel size will be released in September.
• Client software application will provide breakouts for out-of-home and time-shifted viewing.
• We will work with customers to explore the dynamics of out-of-home and time-shifted viewing.
• We look forward to many new learnings in both of these areas.
Clearly, this is just the tip of the iceberg. Complete data for July, which will consist of the full planned sample size of 2,100 persons, will be available in September. We will, of course, work with customers to better understand the dynamics of both out-of-home and time-shifted viewing, and we look forward to many new learnings in both of these areas.

50
© 2005 Arbitron Inc.
• portable people meter
Thank you!
Stay Tuned!
So, stay tuned for more!Thank you.