Embed Size (px)
Citation preview

1 ©Rolls-Royce
Fiscal 2017 Financial Results for the Third Quarter
and Forecast for the Full Fiscal year
February 1, 2018 KOBE STEEL, LTD.
< IR Meeting Material>
- CONTENTS -
2
1.Financial Results for the Third Quarter of Fiscal 2017
2.Forecast for Fiscal 2017
3.Financial Strategy
4.Reference Information

1.Financial Results for
the Third Quarter of Fiscal 2017
3

4
Financial Results for the Third Quarter of FY2017 (Billions of yen)
1H 3Q 1~3Q
①
1H 3Q 1~3Q
②②-①
Net Sales 815.1 402.0 1,217.1 907.0 472.2 1,379.3 +162.1
Operating Income (Loss) 30.9 (35.2) (4.2) 51.4 20.4 71.8 +76.0
Ordinary Income (Loss) 12.3 (38.3) (26.0) 45.7 16.2 62.0 +88.0
excluding inventory valuation
(loss)23.8 (39.3) (15.5) 41.2 13.7 55.0 +70.5
Extraordinary Income - - - 9.0 0.0 9.1 +9.1
Net Income (Loss) Attributable
to Owners of the Parent4.1 (40.5) (36.4) 39.3 16.4 55.8 +92.3
FY2016 FY2017 Change

5
Net Sales by Segment (Billions of yen)
Net Sales
1H 3Q 1~3Q
①
1H 3Q 1~3Q
②②-①
Iron & Steel 290.3 151.3 441.6 354.4 184.2 538.7 +97.0
Welding 42.2 19.4 61.7 39.7 20.3 60.0 (1.6)
Aluminum & Copper 162.9 76.9 239.9 174.3 86.5 260.9 +20.9
Machinery 72.0 31.6 103.7 70.5 40.2 110.8 +7.1
Engineering 49.5 30.1 79.6 48.0 32.9 80.9 +1.2
Construction Machinery 156.1 72.6 228.7 182.7 84.9 267.6 +38.8
Electric Power 35.5 15.9 51.4 32.9 17.6 50.5 (0.9)
Other Businesses 31.2 16.5 47.7 29.2 18.8 48.0 +0.3
Adjustment (25.0) (12.6) (37.6) (24.9) (13.6) (38.5) (0.9)
Total 815.1 402.0 1,217.1 907.0 472.2 1,379.3 +162.1
FY2016 FY2017 Change
6
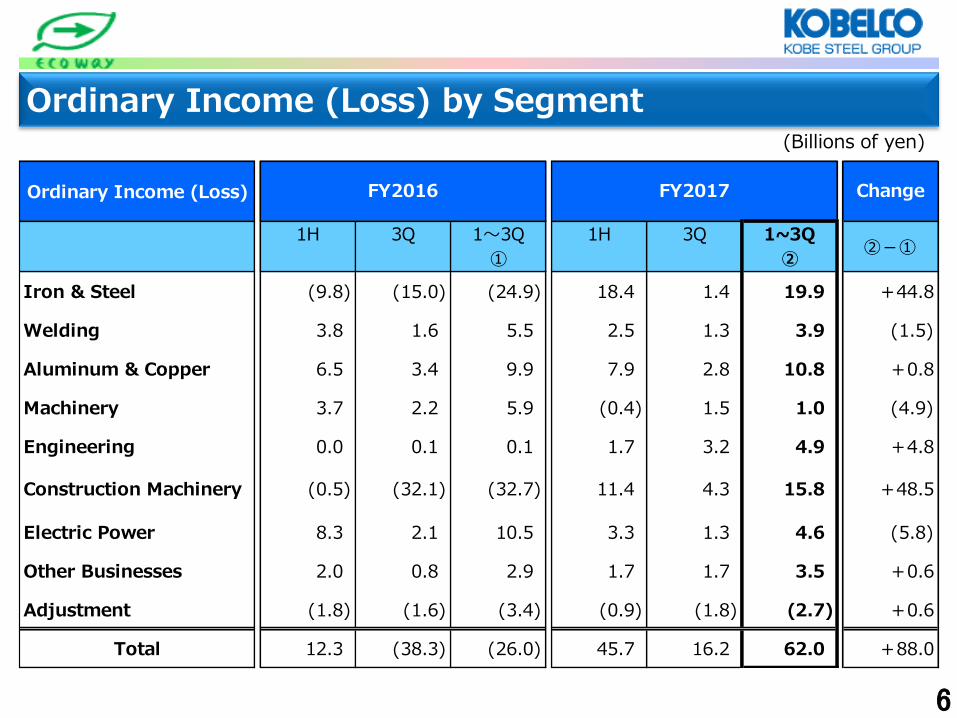
Ordinary Income (Loss) by Segment (Billions of yen)
Ordinary Income (Loss)
1H 3Q 1~3Q
①
1H 3Q 1~3Q
②②-①
Iron & Steel (9.8) (15.0) (24.9) 18.4 1.4 19.9 +44.8
Welding 3.8 1.6 5.5 2.5 1.3 3.9 (1.5)
Aluminum & Copper 6.5 3.4 9.9 7.9 2.8 10.8 +0.8
Machinery 3.7 2.2 5.9 (0.4) 1.5 1.0 (4.9)
Engineering 0.0 0.1 0.1 1.7 3.2 4.9 +4.8
Construction Machinery (0.5) (32.1) (32.7) 11.4 4.3 15.8 +48.5
Electric Power 8.3 2.1 10.5 3.3 1.3 4.6 (5.8)
Other Businesses 2.0 0.8 2.9 1.7 1.7 3.5 +0.6
Adjustment (1.8) (1.6) (3.4) (0.9) (1.8) (2.7) +0.6
Total 12.3 (38.3) (26.0) 45.7 16.2 62.0 +88.0
FY2016 FY2017 Change

7
2.Forecast for Fiscal 2017

8
Forecast for FY2017 (Billions of yen)
FY2016
Full year
①
1H 2H Full year
②
1H 2H Full year
③③-① ③-②
Net Sales 1,695.8 907.0 973.0 1,880.0 907.0 983.0 1,890.0 +194.2 +10.0
Operating Income 9.7 51.4 23.6 75.0 51.4 23.6 75.0 +65.3 ー
Ordinary Income (Loss) (19.1) 45.7 4.3 50.0 45.7 14.3 60.0 +79.1 +10.0
excluding inventory valuation
(loss)(15.6) 41.2 1.8 43.0 41.2 5.3 46.5 +62.1 +3.5
Extraordinary Income 8.1 9.0 undetermined undetermined 9.0 0.1 9.1 +1.0 ー
Net Income (Loss) Attributable
to Owners of the Parent(23.0) 39.3 undetermined undetermined 39.3 5.7 45.0 +68.0 ー
FY2017
(Previous Forecast)
FY2017
(Current Forecast)Change

9
Net Sales by Segment (Billions of yen)
Net Sales FY2016
Full year1H 2H Full year
②
1H 2H Full year
③③-① ③-②
Iron & Steel 620.6 354.4 355.6 710.0 354.4 360.6 715.0 +94.4 +5.0
Welding 82.2 39.7 40.3 80.0 39.7 40.3 80.0 (2.2) ー
Aluminum & Copper 323.3 174.3 170.7 345.0 174.3 170.7 345.0 +21.7 ー
Machinery 150.7 70.5 102.5 173.0 70.5 100.5 171.0 +20.3 (2.0)
Engineering 121.1 48.0 81.0 129.0 48.0 80.0 128.0 +6.9 (1.0)
Construction Machinery 310.4 182.7 157.3 340.0 182.7 172.3 355.0 +44.6 +15.0
Electric Power 70.6 32.9 38.1 71.0 32.9 39.1 72.0 +1.4 +1.0
Other Businesses 74.8 29.2 41.8 71.0 29.2 39.8 69.0 (5.8) (2.0)
Adjustment (58.2) (24.9) (14.1) (39.0) (24.9) (20.1) (45.0) +13.2 (6.0)
Total 1,695.8 907.0 973.0 1,880.0 907.0 983.0 1,890.0 +194.2 +10.0
FY2017
(Previous Forecast)
FY2017
(Current Forecast)Change

10
Ordinary Income(Loss)by Segment (Billions of yen)
Ordinary Income (Loss) FY2016
Full year
①
1H 2H Full year
②
1H 2H Full year
③③-① ③-②
Iron & Steel (29.5) 18.4 (4.4) 14.0 18.4 (3.4) 15.0 +44.5 +1.0
Welding 6.8 2.5 2.5 5.0 2.5 2.5 5.0 (1.8) ー
Aluminum & Copper 12.0 7.9 2.1 10.0 7.9 0.1 8.0 (4.0) (2.0)
Machinery 5.8 (0.4) 3.9 3.5 (0.4) 3.9 3.5 (2.3) ー
Engineering 2.8 1.7 2.8 4.5 1.7 3.3 5.0 +2.2 +0.5
Construction Machinery (31.3) 11.4 0.6 12.0 11.4 6.6 18.0 +49.3 +6.0
Electric Power 13.0 3.3 (0.3) 3.0 3.3 2.7 6.0 (7.0) +3.0
Other Businesses 7.6 1.7 3.8 5.5 1.7 2.8 4.5 (3.1) (1.0)
Adjustment (6.4) (0.9) (6.6) (7.5) (0.9) (4.1) (5.0) +1.4 +2.5
Total (19.1) 45.7 4.3 50.0 45.7 14.3 60.0 +79.1 +10.0
FY2017
(Previous Forecast)
FY2017
(Current Forecast)Change

11
【Iron & Steel】
Firm demand is expected to continue mainly in the domestic and overseas automotive
sector and the domestic construction sector.
While margins are anticipated to worsen temporarily due to higher prices for coking
coal, we anticipate that ordinary income will increase, reflecting improvement in
inventory valuation following higher raw material prices.
Consolidation of upstream operations at Kakogawa Works has been completed.
Consolidated operations and start-up of new equipment are progressing smoothly. We
expect the consolidation will reduce costs as planned.
Additional measures to improve profitability is also progressing as planned.
(Please see the next page for details.)
FY2017
(Billions of yen)
FY2016 Change
Full Year1H 2H Full Year
①
1H 2H Full Year
②②-①
Net Sales 620.6 354.4 355.6 710.0 354.4 360.6 715.0 +5.0
Ordinary Income
(Loss)(29.5) 18.4 (4.4) 14.0 18.4 (3.4) 15.0 +1.0
Inventory Valuation 2.0 2.5 1.5 4.0 2.5 5.5 8.0 +4.0
FY2017
(Previous Forecast)
FY2017
(Current Forecast)

【Iron & Steel】 Strengthening Profitability
12
△100
△14.9
150
Profitability is steadily improving owing to capital investment, cost cuts at the production level, and lower raw material costs.
Additional measures to improve profitability
(Impact from improved profitability +30 billion yen/year)
FY2016 + 8.5(actual)
FY2017 + 20.0(forecast)
FY2020 + 30.0(plan)
※Comparison with FY2015
Start-up of related equipment has
progressed as planned. Consolidated
operations started in Nov. 2017.
Consolidation of upstream operations
(Impact from improved profitability +15 billion yen/year)
FY2017 + 6.5(forecast) FY2018 + 15.0(plan)
※Comparison with FY2015
+11.5
・・
FY2016 (Actual)
△29.5
FY16⇒FY17 previous forecast: Main factors of cost changes Relining of a blast furnace +12.0 Consolidation of upstream operations + 6.5 Additional measures to improve profitability +11.5 Others (6.0) Total+24.0
(In billions of yen) Margin and product mix Production & shipments +3.5 Raw material prices (7.5) Exchange rate changes ± 0.0
Margin and product mix Production & shipments +71.0 Raw material prices (46.5) Exchange rate changes (4.0)
(0.5) Others
(3.0)
+20.5
(4.0)
15.0
+24.0
14.0
(29.5)
FY2017 (previous forecast)
Overall costs
reduction
Inventory valuation
Inventory valuation
FY17 previous forecast⇒current forecast: Main factors of cost changes Relining of a blast furnace ±0.0 Consolidation of upstream operations ±0.0 Additional measures to improve profitability ±0.0 Other factors of cost changes +1.5 Total +1.5
FY2017 (current forecast)
+2.0
+4.0
+1.5
Overall costs
reduction
Others

【Iron & Steel】 Production & Sales
13
FY2017
1Q 3Q 2H Full year
Full year
(Previous
Forecast)
1Q 3Q
Full year
(Current
Forecast)
Japan's Domestic crude
steel production
(Millions of
tons)52.6 26.4 52.6 105.2 52.0 26.4
<Domestic steel inventory trend>
Ordinary steel products(Millions of
tons)5.6 5.5 5.4 -- 5.7 5.7
Rolled sheets(Millions of
tons)4.0 3.8 3.8 -- 4.2 4.0
<Domestic steel inventory trend>
Finished auto production(Millions of
cars)4.4 2.4 5.0 9.4 4.7 2.5
<KOBE STEEL, LTD.>
Crude steel production(Millions of
tons)3.8 1.4 3.4 7.2 about 7.6 3.9 1.8 about 7.5
Sales volume(Millions of
tons)2.9 1.5 3.0 5.9 about 6.2 3.0 1.5 about 6.1
(Domestic) (2.0) (1.1) (2.2) (4.2) (2.2) (1.1)
(Exports) (0.9) (0.4) (0.8) (1.7) (0.8) (0.5)
Average steel selling price(Thousands of
yen/ton)68.0 69.0 73.1 70.6 81.5 81.5
Export ratio (value basis) 29.5% 27.7% 27.7% 28.6% 26.4% 29.3%
FY2017FY2016 Actual
end of Nov.
end of Nov.

14
Iron Ore & Coking Coal Price Trends ($/ton)
0
50
100
150
200
250
300
350
Iron Ore(fines) Hard Coking Coal
About 56 (4Q)
About 190
(3Q)

15
Steel Product Price Trends at Kobe Steel (Thousands of yen /ton)
60
70
80
90
100
82 (3Q)

16
【Welding】
Demand for welding materials used in the overseas shipbuilding sector is
expected to continue facing difficult conditions.
We anticipate that ordinary income will be the same as the previous forecast due
to continuing firm demand for welding systems used in the construction sector in
Japan and other factors.
FY2017
(Billions of yen)
<Sales volume of KSL Group> (Thousands of tons)
FY2017
1H 3Q 2H Full yearFull year
(Previous Forecast)1H 3Q
Full Year(Current Forecast)
Domestic 62 31 63 125 65 32
Overseas 89 40 83 172 79 41
Total 151 71 146 297 about 295 144 73 about 290
FY2017FY2016
FY2016 Change
Full Year1H 2H Full Year
①
1H 2H Full Year
②②-①
Net Sales 82.2 39.7 40.3 80.0 39.7 40.3 80.0 ー
Ordinary Income 6.8 2.5 2.5 5.0 2.5 2.5 5.0 ー
FY2017
(Previous Forecast)
FY2017
(Current Forecast)

17
【Aluminum & Copper】
We expect to benefit from an improvement in inventory valuation due to higher
aluminum and copper ingot prices.
On the other hand, we anticipate that ordinary income will decrease taking into
consideration certain assumptions including lower production, lower yield and other
factors related to the improper conduct.
FY2017
(Billions of yen)
<Sales volume of KSL> (Thousands of tons)
FY2017
1H 3Q 2H Full YearFull Year(Previous
Forecast)
1H 3QFull Year(Current
Forecast)
( Domestic ) 155 69 136 291 ― 153 67 about291
( Exports ) 31 17 36 68 ― 40 20 about82
71 35 72 143 ― 71 35 about142
FY2017FY2016
Aluminum Rolled Products
Copper Rolled Products
FY2016 Change
Full Year1H 2H Full Year
①
1H 2H Full Year
②②-①
Net Sales 323.3 174.3 170.7 345.0 174.3 170.7 345.0 ー
Ordinary Income 12.0 7.9 2.1 10.0 7.9 0.1 8.0 (2.0)
Inventory Valuation (5.5) 2.0 1.0 3.0 2.0 3.5 5.5 +2.5
FY2017
(Previous Forecast)
FY2017
(Current Forecast)

18
【Machinery】
While orders in the nonstandard compressor sector are expected to
continue facing difficult conditions, demand for plastic processing
machinery and other products for the petrochemical sector and other
sectors in China are expected to increase.
We anticipate no major changes from the previous forecast.
FY2017
(Billions of yen)
FY2016 Change
Full Year1H 2H Full Year
①
1H 2H Full Year
②②-①
Net Sales 150.7 70.5 102.5 173.0 70.5 100.5 171.0 (2.0)
Ordinary Income
(Loss)5.8 (0.4) 3.9 3.5 (0.4) 3.9 3.5 ー
Orders 128.2 67.1 about 83 about 150 67.1 about 83 about 150 ー
FY2017
(Previous Forecast)
FY2017
(Current Forecast)

19
【Engineering】
The value of orders is expected to increase due to receiving an order
for a direct reduced iron plant.
Current projects are progressing as planned. We anticipate that
ordinary income will be similar to the previous forecast.
FY2017
(Billions of yen)
FY2016 Change
Full Year1H 2H Full Year
①
1H 2H Full Year
②②-①
Net Sales 121.1 48.0 81.0 129.0 48.0 80.0 128.0 (1.0)
Ordinary Income 2.8 1.7 2.8 4.5 1.7 3.3 5.0 +0.5
Orders 174.2 55.9 about 44 about100 55.9 about 69 about 125 about 25
FY2017
(Previous Forecast)
FY2017
(Current Forecast)

20
【Construction Machinery】 (Billions of yen)
We anticipate that ordinary income will increase owing to a large
increase in unit sales of excavators on the back of brisk infrastructure
investment and replacement demand in China.
FY2017
FY2016 Change
Full Year1H 2H Full Year
①
1H 2H Full Year
②②-①
Net Sales 310.4 182.7 157.3 340.0 182.7 172.3 355.0 +15.0
Ordinary Income
(Loss)(31.3) 11.4 0.6 12.0 11.4 6.6 18.0 +6.0
Allowance for Doubtful
Accounts in China34.1 0.0 0.0 0.0 0.0 0.0 0.0 ー
FY2017
(Previous Forecast)
FY2017
(Current Forecast)

21
【Electric Power】
We anticipate that ordinary income will increase, because expenses for
new projects will be brought forward to the next fiscal year.
We will continue the stable wholesale supply of electricity from the
current Kobe Power Plant and promote new projects (Moka and Kobe)
as planned.
FY2017
(Billions of yen)
FY2016 Change
Full Year1H 2H Full Year
①
1H 2H Full Year
②②-①
Net Sales 70.6 32.9 38.1 71.0 32.9 39.1 72.0 +1.0
Ordinary Income
(Loss)13.0 3.3 (0.3) 3.0 3.3 2.7 6.0 +3.0
FY2017
(Previous Forecast)
FY2017
(Current Forecast)

22
3. Financial Strategy

Financial Strategy
23 23
Consider and implement cash generation measures on a scale of 100.0 billion yen to steadily implement growth investments, while maintaining financial discipline.
※ Cash generation measures already implemented
(Total: about 37 billion yen)
FY2016: Improve working capital 19 billion yen,
asset sales 3 billion yen, etc.
FY2017: Asset sales 15 billion yen
Cash generation measures
In principle, business cash flows are used to finance large strategic investments to grow the materials and machinery businesses, as well as for regular investments that support the business foundation.
D/E ratio 1 time or less
Basic policy
《Free cash flow》 《Debt ・ D/E ratio》
※1 ※1
(times)
: Project Finance
: Debt
: D/E Ratio
*1
△ 73.6△ 103.8 △ 131.9
△190 .0
153.0
85.8
126.7
185.0
69.6
△ 18.0 △ 5.2 △ 5.0
△ 210
△ 160
△ 110
△ 60
△ 10
40
90
140
190
FY2014 FY2015 FY2016 FY2017
: Cash flows from operating activities
: Cash flows from investing activities
: Free cash flow
650.9
776.0 789.6 750.0
26.4
13.4 7.2 15.0
0.88
1.101.17
0.40
0.60
0.80
1.00
1.20
1.40
1.60
400.0
600.0
800.0
1000.0
FY2014 FY2015 FY2016 FY2017
(Billions of yen)
(Billions of yen)
D/E Ratio excluding advance
borrowing of 117.6 billion yen
1.00 time D/E Ratio excluding advance
borrowing of 90 billion yen
0.97 times
(Forecast)
Around
1 time
(Forecast) (Forecast)

24
Dividends
Dividend
Kobe Steel aims to pay dividends on a continuous and stable basis. Dividends are decided after taking into full account the company’s financial position, business performance, future capital needs and other factors.
With regard to the improper conduct concerning products, Kobe Steel takes into
consideration uncertainties including its financial position, business performance, future capital needs such as the possible cost of compensation to customers and other parties in fiscal 2017 and beyond. As a result, the dividend for the end of fiscal 2017 is undetermined at this time.
Actual dividend
※Kobe Steel carried out a share consolidation at a ratio of 10 shares to 1 share effective on October 1, 2016.
Interim Year-end Year Interim Year-end Year Interim Year-end Year Interim Year-end Year Interim Year-end Year
- 4.0 4.0 2.0 2.0 4.0 2.0 - 2.0 - - - - Undetermined
17.7% 16.8% - -
FY2017 ForecastFY2013 FY2014 FY2015 FY2016
Dividends per
share in yen
Dividend per net
assets

25
4.Reference Information

26
Cash Flows (Billions of yen)
*1: Advance borrowing for FY 2017 (117.6 billion yen) is included.
*2 FY2016 Change
Full year 1H 2H Full year
①
1H 2H Full year
②②-①
Cash Flows from
Operating Activities126.7 124.9 undetermined undetermined 124.9 60.1 185.0 -
Cash Flows from
Investing Activities(131.9) (95.9) undetermined undetermined (95.9) (94.1) (190.0) -
Free Cash Flow(Excluding Project Financing)
(5.2) 29.0 undetermined undetermined 29.0 (34.0) (5.0) -
Free Cash Flow 3.9 28.7 undetermined undetermined 28.7 (38.7) (10.0) -
Cash and Deposits(Excluding Project Financing)
197.0 194.1 undetermined 194.1 140.0 -
FY2017
(Previous Forecast)
FY2017
(Current Forecast)
*1

27
Capital Investment (Billions of yen)
FY2014 FY2015 FY2016FY2017
(Forecast)
103.5 109.9 160.2 140.0
Ratio of
Depreciation115% 116% 167% 140%
95.3 99.1 138.9 145.0
Ratio of
Depreciation106% 105% 144% 145%
89.8 94.8 96.2 100.0
Capital Investment
(Accrual Basis)
Capital Investment
(Payment Basis)
Depreciation

28
Financial Indices
FY2014 FY2015 FY2016 FY2017
5.4% 1.6% (1.1%) 3.2%
238.19 yen (59.34 yen) (63.54 yen) 124.22 yen
0.88 (※4) 1.10 (※5)1.17 about 1
4.4% 1.3% 0.8% 2.6%
12.0% (2.9%) (3.4%) 6.4%
※1:ROS=Ordinary Income / Net Sales
※2:Kobe Steel carried out a share consolidation at a ratio of 10 shares to 1 share effective on October 1, 2016.
Therefore, net income per share takes into account this share consolidation.
D/E ratio 0.97 times (excluding early procurement of borrowings)
※5:Includes early procurement of borrowings for FY2017 (117.6 billion yen)
D/E ratio 1.00 time (excluding early procurement of borrowings)
※6:ROA=Ordinary Income / Total Assets
※7:ROE=Net Income / Equity
※3:D/E ratio: Debt (excluding IPP project finance)/stockholders' equity (FY2015 shareholders' equity)
※4:Includes early procurement of borrowings for FY2016 (90 billion yen)
D/E ratio(※3)
ROS (※1)
Net Income (loss) per share
(※2)
ROE (※7)
ROA (※6)
29
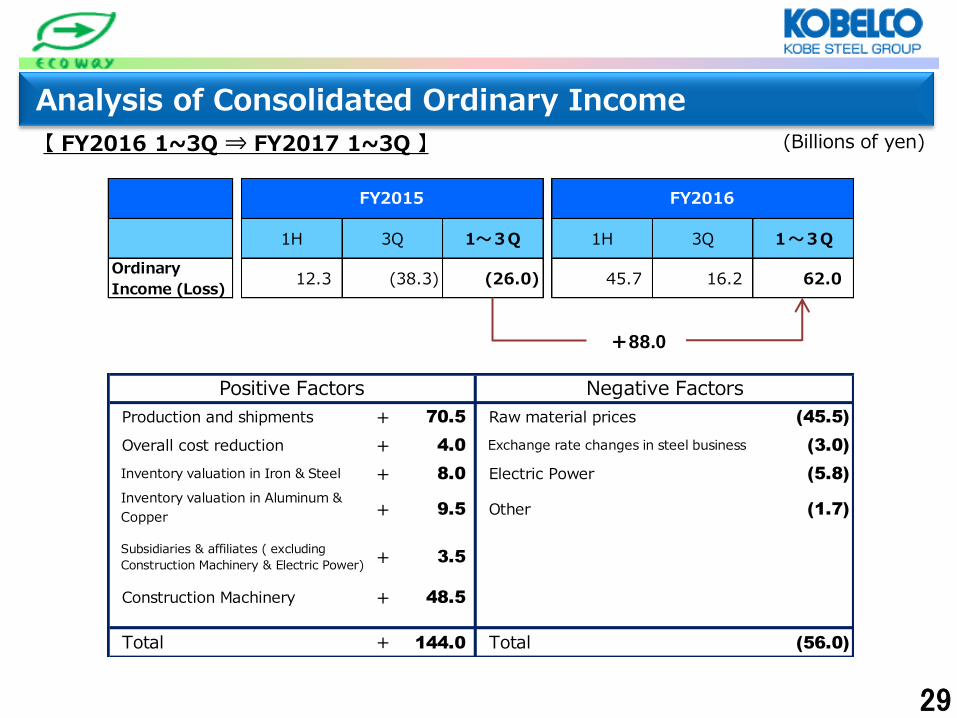
(Billions of yen)
Analysis of Consolidated Ordinary Income
【 FY2016 1~3Q ⇒ FY2017 1~3Q 】
Production and shipments + 70.5 (45.5)
Overall cost reduction + 4.0 (3.0)
Inventory valuation in Iron & Steel + 8.0 (5.8)
Inventory valuation in Aluminum &
Copper + 9.5 (1.7)
Subsidiaries & affiliates ( excluding
Construction Machinery & Electric Power)+ 3.5
Construction Machinery + 48.5
Total + 144.0 Total (56.0)
Other
Electric Power
Exchange rate changes in steel business
Raw material prices
Positive Factors Negative Factors
1H 3Q 1~3Q 1H 3Q 1~3Q
Ordinary
Income (Loss)12.3 (38.3) (26.0) 45.7 16.2 62.0
FY2015 FY2016
+88.0
30
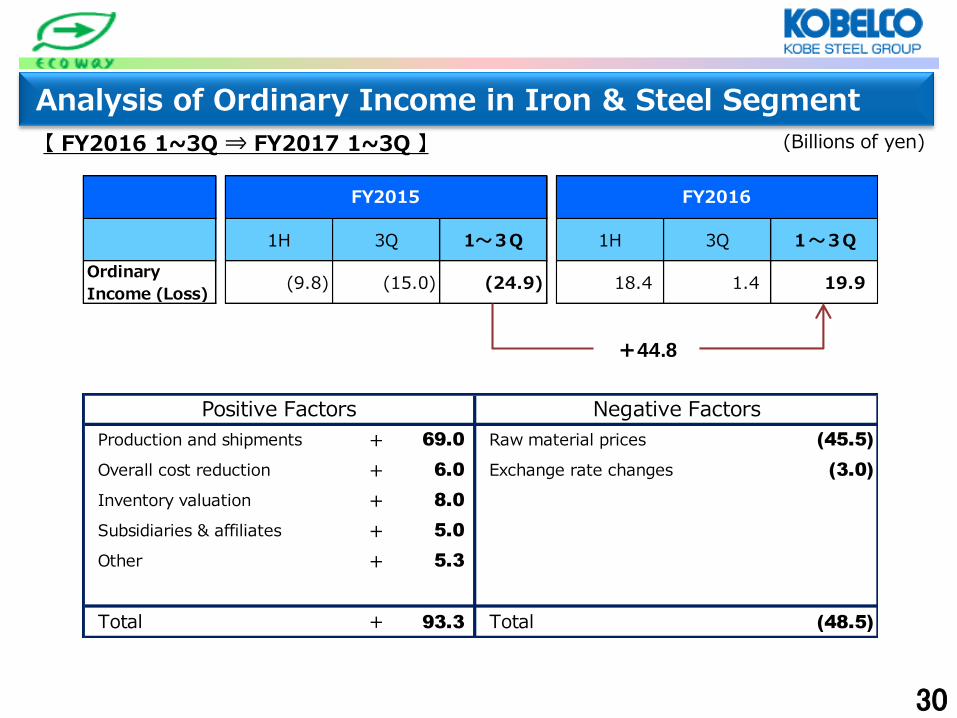
Analysis of Ordinary Income in Iron & Steel Segment
(Billions of yen) 【 FY2016 1~3Q ⇒ FY2017 1~3Q 】
Production and shipments + 69.0 (45.5)
Overall cost reduction + 6.0 (3.0)
Inventory valuation + 8.0
Subsidiaries & affiliates + 5.0
Other + 5.3
Total + 93.3 Total (48.5)
Exchange rate changes
Raw material prices
Positive Factors Negative Factors
1H 3Q 1~3Q 1H 3Q 1~3Q
Ordinary
Income (Loss)(9.8) (15.0) (24.9) 18.4 1.4 19.9
FY2015 FY2016
+44.8

31
(Billions of yen)
Analysis of Consolidated Ordinary Income
【 FY2016 ⇒ FY2017 】
1H 2H Full year 1H 2H Full year
Ordinary
Income (Loss)12.3 (31.4) (19.1) 45.7 14.3 60.0
FY2016 FY2017
+79.1
Production and shipments + 76.0 (53.0)
Overall cost reduction + 23.5 (5.0)
Inventory valuation in Iron & Steel + 6.0 (5.5)
Inventory valuation in Aluminum &
Copper + 11.0 (7.0)
Construction Machinery + 49.3 (16.2)
Total + 165.8 Total (86.7)
Raw material prices
Exchange rate changes in steel business
Subsidiaries & affiliates ( excluding
Construction Machinery & Electric Power)
Electric Power
Other
Positive Factors Negative Factors
32
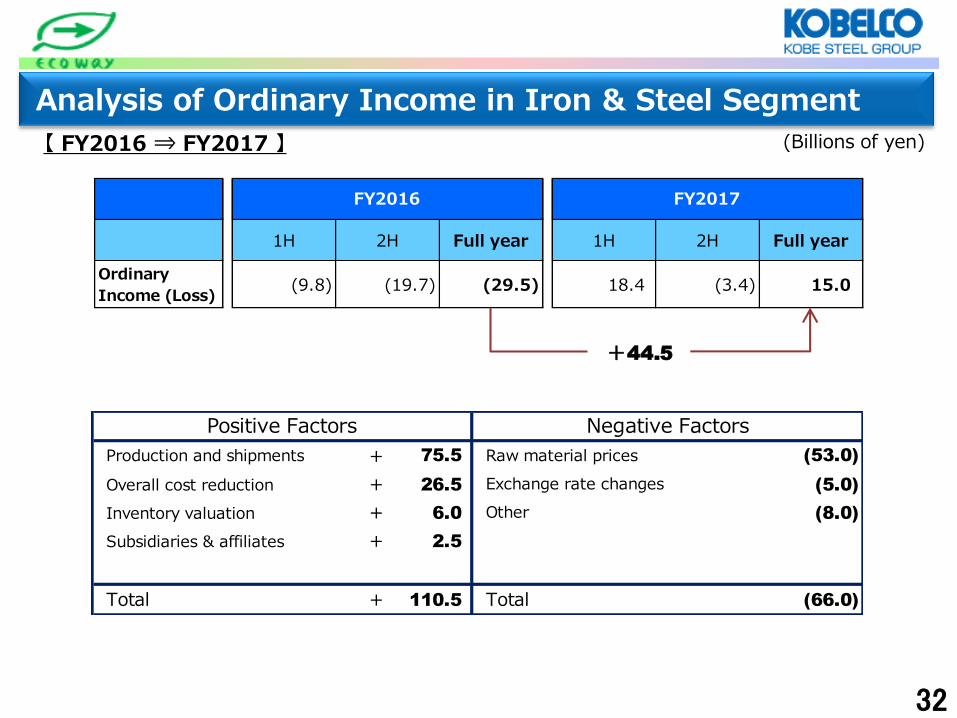
Analysis of Ordinary Income in Iron & Steel Segment
(Billions of yen) 【 FY2016 ⇒ FY2017 】
Production and shipments + 75.5 (53.0)
Overall cost reduction + 26.5 (5.0)
Inventory valuation + 6.0 (8.0)
Subsidiaries & affiliates + 2.5
Total + 110.5 Total (66.0)
Other
Exchange rate changes
Raw material prices
Positive Factors Negative Factors
1H 2H Full year 1H 2H Full year
Ordinary
Income (Loss)(9.8) (19.7) (29.5) 18.4 (3.4) 15.0
FY2016 FY2017
+44.5

33
(Billions of yen)
Analysis of Consolidated Ordinary Income
【 FY2017 Previous Forecast ⇒ FY2017 Current Forecast 】
1H 2H Full year 1H 2H Full year
Ordinary
Income45.7 4.3 50.0 45.7 14.3 60.0
FY2017 Previous Forecast FY2017 Current Forecast
+ 10.0
Production and shipments + 1.5 (7.5)
Overall cost reduction + 1.5 (3.5)
Inventory valuation in Iron & Steel + 4.0
Inventory valuation in Aluminum &
Copper + 2.5
Construction Machinery + 6.0
Electric Power + 3.0
Other + 2.5
Total + 21.0 Total (11.0)
Subsidiaries & affiliates ( excluding
Construction Machinery & Electric Power)
Raw material prices
Positive Factors Negative Factors

34
Analysis of Ordinary Income in Iron & Steel Segment
(Billions of yen) 【 FY2017 Previous Forecast ⇒ FY2017 Current Forecast 】
1H 2H Full year 1H 2H Full year
Ordinary
Income (Loss)18.4 (4.4) 14.0 18.4 (3.4) 15.0
FY2017 Previous Forecast FY2017 Current Forecast
+1.0
Production and shipments + 3.5 (7.5)
Overall cost reduction + 1.5 (1.5)
Inventory valuation + 4.0
Subsidiaries & affiliates + 1.0
Total + 10.0 Total (9.0)
Other
Raw material prices
Positive Factors Negative Factors

35
(Billions of yen)
Analysis of Consolidated Ordinary Income
【 FY2017 1H ⇒ FY2017 2H 】
1H 2H Full year 1H 2H Full year
Ordinary
Income (Loss)12.3 (31.4) (19.1) 45.7 14.3 60.0
FY2016 FY2017
(31.4)
Overall cost reduction + 2.0 (8.0)
Inventory valuation in Iron & Steel + 3.0 (3.0)
Inventory valuation in Aluminum &
Copper + 1.5 (4.8)
(0.6)
(0.5)
(21.0)
Total + 6.5 Total (37.9)
Other
Negative FactorsPositive Factors
Subsidiaries & affiliates ( excluding
Construction Machinery & Electric Power)
Electric Power
Construction Machinery
Production and shipments
Raw material prices

36
(Billions of yen)
Analysis of Ordinary Income in Iron & Steel Segment
【 FY2017 1H ⇒ FY2017 2H 】
1H 2H Full year 1H 2H Full year
Ordinary
Income (Loss)(9.8) (19.7) (29.5) 18.4 (3.4) 15.0
FY2016 FY2017
(21.8)
Overall cost reduction + 3.5 (6.0)
Inventory valuation + 3.0 (3.0)
(3.5)
(15.8)
Total + 6.5 Total (28.3)
Positive Factors Negative Factors
Other
Subsidiaries & affiliates
Raw material prices
Production and shipments

Timeline of Key Events with regard to improper conduct concerning products
37
Dates Incidents
Jun. 2016 A quality issue was detected at Shinko Wire Stainless Company, Ltd., a group company that is part of Kobe Steel’s Iron and Steel Business. We have conducted a series of actions beginning with general quality inspections to which the entire Group within and outside of Japan is subject.
Nov. 2016 We established the Quality Management Section in the MONODZUKURI (Product Manufacturing) Planning and Promotion Department at the head office to strengthen quality control.
Apr. 2017 The Quality Management Section started an audit of compliance with customers’ specifications, in addition to public standards.
Early Aug. 2017
We requested the entire Group conduct a self-inspection (of the records for the past year) beginning in September, to be completed within two months.
End of Aug. 2017
A self-inspection conducted by the Aluminum & Copper Business ahead of the planned schedule revealed that four of its business locations were involved in improper conduct relating to quality inspection. This finding was reported to the President, and we immediately ceased shipping nonconforming products.
Sep. 12, 2017
We established four task forces (Emergency Audit, Customer Support, Cause Investigation, and Public Announcement) under the President, started informing our customers, and conducted an emergency audit, including on other businesses.
Oct. 8, 2017
We made public the improper conduct that occurred at the Aluminum & Copper Business and other businesses. For details, please see the following links. Oct. 8 http://www.kobelco.co.jp/english/releases/1197808_15581.html Oct. 11 http://www.kobelco.co.jp/english/releases/1197817_15581.html Oct. 13 http://www.kobelco.co.jp/english/releases/1197835_15581.html Oct. 20 http://www.kobelco.co.jp/english/releases/1197893_15581.html
Oct. 26, 2017 Upon general completion of the self-inspection by each business and the head office’s emergency audit, we made public the progress of the safety verification process and the establishment of an Independent Investigation Committee (IIC).
Nov. 10, 2017 We publicly issued a report on the company’s investigation into root causes and measures to prevent recurrences. The Board of Directors established a Quality Governance Restructuring Deliberation Committee as its advisory organ.
Dec. 21, 2017 We announced that the IIC’s investigation would be completed around the end of February 2018. We reassigned the responsibilities of three executive officers of the Aluminum & Copper Business.
Jan. 1, 2018 We established a Quality Management Department at the head office.

38
Root Cause Analysis and Preventive Measures Proposed to Avoid Reoccurrence (as of Nov. 10, 2017)
Root Cause Analysis Preventive Measures Proposed To Avoid Reoccurrence
Management's propensity to overemphasize profitability and the insular organizational culture
• Lay down a "Quality Charter" premised on the notion that product quality takes precedence over cost or delivery deadlines, to make utmost efforts to regain trust in our technology, products, and services
• Reexamine our views on goals and performance • Create an open workplace culture where employees feel at liberty to speak their mind to each
other
Imbalanced operation of manufacturing facilities
• Consider strengthening quality governance, promoting organizational and consciousness reforms, and utilizing external human resources
• Reexamine the business flow, which allows identifying process capacity and sufficient trial manufacturing
• Initiate cross-sectional personnel rotations for quality assurance workers
Inadequate quality control processes that permitted improper conduct
• Promote automated recording of test inspection data and implement technological and administrative measures, including improving process capability
• Inspect deficiencies in operational structure and systems at every business location, even those where no misconduct has been reported
Reduced awareness of the need to comply strictly with contractual specifications
• Prepare a comprehensive internal training program for all personnel, utilizing e-learning tools where needed, to assure a universal understanding of the need for compliance with contractual specifications
Inadequate organizational system
• Establish a Quality Assurance Department in the Aluminum and Copper Business to serve audit functions and conduct training at each business location; place the Quality Assurance Section – which is responsible for quality assurance – under the direct control of each business location's chief, to be independent of the manufacturing departments to separate clearly the quality control function from the quality assurance function
• Establish a Quality Audit Department at the head office in January 2018 to check the status of quality audits by the quality assurance department of each business unit and to audit the quality of each business location of each business unit and group company
We will incorporate the findings to be reported by the Independent Investigation Committee in our deliberations of actions, expected to be completed in late Feb., to be taken and reflect the Committee’s findings and advice in formulating our ultimate preventive measures.

Progress of our Product Safety Verification (as of Feb.1, 2017)
39
We are working to verify the safety of nonconforming products in close cooperation with our customers in and outside of Japan (525 in all) who have purchased nonconforming products from Kobe Steel, Ltd. and its group companies. To date, we have identified no issues which require customers or us to cease using or recall products immediately.
Our safety verification process is categorized into three levels : [A] Customers that have completed safety verification and concluded that no safety problem exists [B] Customers that have concluded that no problem currently exists but will continue further verification [C] Customers that have not yet conducted their own safety verification but Kobe Steel has concluded that safety can be assumed with a high degree of certainty in its technical opinion and has informed customers to that effect
Released
date in
2017
Material Main useNo. of
customersA B C
Total
(A-C)
Aluminum sheets Can stock, Cars 57 36 16 0 52
Aluminum cast &
forged parts
Aircraft
Rolling stock67 4 63 0 67
Aluminum extrusions Cars, Rolling stock 34 24 8 0 32
Copper sheetsSemiconductors
Terminals38 19 19 0 38
Oct. 8,26 Kobelco & Materials Copper Tube Co., Ltd. Copper tubes Air conditioning 23 17 6 0 23
Iron &
Steel
Business
Steel Powder Division,
Kobe Steel, Ltd.Steel powder Sintered parts 1 0 1 0 1
Head Office Kobelco Research Institute, Inc. Target materials FPD optical disks 70 70 0 0 70
Shinko Metal Products Co., LtdCopper alloy tubes
Molds
Electrical machinery
Steelmaking equipment176 167 3 6 176
Shinko Aluminum Wire Co., Ltd.
Kobelco & Materials Copper Tube (M) Sdn. Bhd.
Kobelco & Materials Copper Tube (Thailand) Co., Ltd.
Suzhou Kobe Copper Technology Co., Ltd.
Copper tubes
Copper strips
Aluminum wires
Air conditioning
Terminals36 24 9 3 36
Iron &
Steel
Business
Nippon Koshuha Steel Co.
Shinko Wire Stainless Company
Jiangyin Sugita Fasten Spring Wire Co., Ltd.
Kobelco Spring Wire (Foshan) Co., Ltd.
Steel wire
Stainless steel wire
Bearings
springs22 22 0 0 22
Oct. 20
Iron &
Steel
Business
Shinko Kohan Kako, Ltd.Heavy plate
processing
Heavy plate
processed products1 1 0 0 1
525 384 125 9 518Total
Company name
Aluminum
&
Copper
Business
Oct. 8 Kobe Steel, Ltd.
Oct. 11
Oct. 13
Aluminum
&
Copper
Business
40
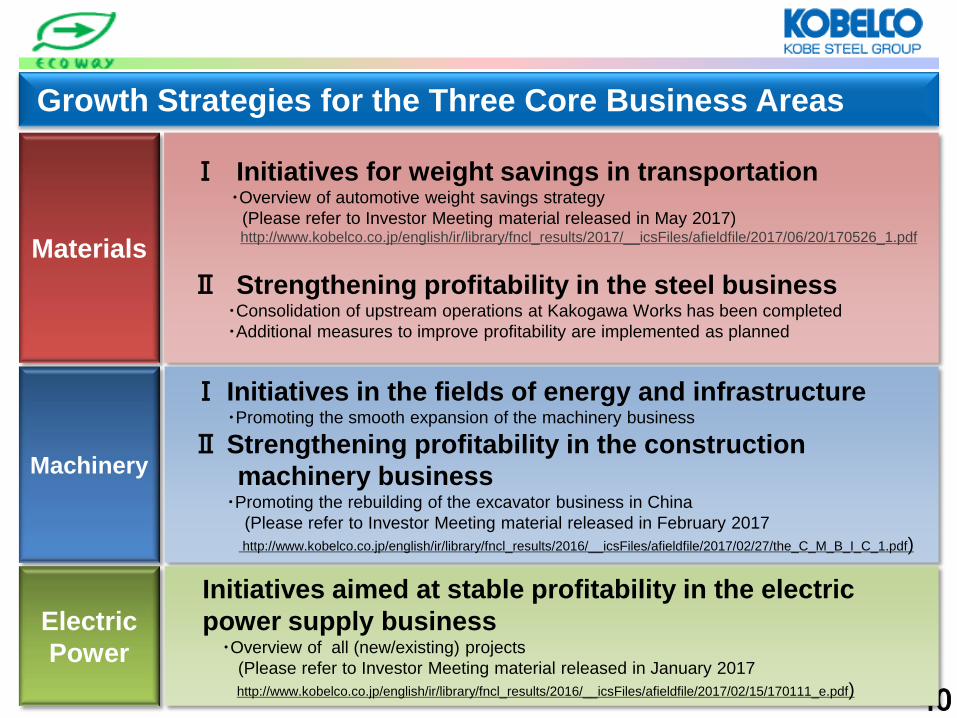
Growth Strategies for the Three Core Business Areas
Machinery
Materials
Electric
Power
Ⅰ Initiatives for weight savings in transportation
・Overview of automotive weight savings strategy
(Please refer to Investor Meeting material released in May 2017) http://www.kobelco.co.jp/english/ir/library/fncl_results/2017/__icsFiles/afieldfile/2017/06/20/170526_1.pdf
Ⅱ Strengthening profitability in the steel business ・Consolidation of upstream operations at Kakogawa Works has been completed
・Additional measures to improve profitability are implemented as planned
Ⅰ Initiatives in the fields of energy and infrastructure ・Promoting the smooth expansion of the machinery business
Ⅱ Strengthening profitability in the construction
machinery business ・Promoting the rebuilding of the excavator business in China
(Please refer to Investor Meeting material released in February 2017
http://www.kobelco.co.jp/english/ir/library/fncl_results/2016/__icsFiles/afieldfile/2017/02/27/the_C_M_B_I_C_1.pdf)
Initiatives aimed at stable profitability in the electric
power supply business ・Overview of all (new/existing) projects
(Please refer to Investor Meeting material released in January 2017
http://www.kobelco.co.jp/english/ir/library/fncl_results/2016/__icsFiles/afieldfile/2017/02/15/170111_e.pdf)

【Materials】 Initiatives for Weight Savings in Transportation
41
Field Project Country Description Schedule
AutomotiveJoint venture to make and sell steel wire rods
(Kobelco Millcon Steel Co., LTD)Thailand
First overseas location for wire rod production.
Helps meet growing auto demand in Southeast Asia.
Sep. 2015 Production of ordinary steel wire rod began
May 2017 Equipment to make special steel installed
Joint venture to make and sell CH steel wire
(Kobelco CH Wire Mexicana, S.A. de C.V.)Mexico Quickly supply products of outstanding quality to local auto parts makers Jan. 2016 Production began
Joint venture to make and sell automotive high
strength steel sheet
(Kobelco Angang Auto Steel Co., Ltd.)
China
Strengthens environmental response in China.
Established global supply network for high strength steel in Japan, the U.S.,
Europe and China.
Feb. 2016 Production began
Production and sale of aluminum sheet for automotive
closure panelsChina
First production base in China for a Japanese aluminum maker to make
aluminum sheet for closure panels.Apr. 2016 Production began
Production and sale of automotive aluminum extrusions
(Kobelco Aluminum Products & Extrusions Inc.)USA
Strengthens response to stricter fuel consumption regulations in U.S..
Establishes supply network for aluminum extrusions and fabricated
products in Japan and the U.S.
Aug. 2016 Construction began
Dec. 2017 Production begins
Mass producing high-productivity, hot stamping steel sheet -Developed a hot stamping steel sheet with outstanding productivity during
press operations. The sheet was ordered and adopted for a structural body
part of the Prius, which is producted by Toyota Motor Corporation.
2016 Mass production began
Establishment of Automotive Solution Center -The Automotive Solution Center was newly organized in the Technical
Development Group. We aim to promote rapid decision-making and
strengthen original solution proposal capabilities.
Apr. 2017 Established the center
Expansion of facilities for aluminum forged suspension
products
(Kobe Aluminum Automotive Products, LLC)
USA
This expansion plan is to meet the rising demand in North America for
aluminum forged suspension products. Kobe Steel anticipates that
automakers in the U.S. will use aluminum forged suspension products in a
wider range of vehicles.
2018 Autumn Additional facilities start
Establishment of a joint venture with Novelis Korea
(Ulsan Aluminum Ltd.)
South
Korea
This plan is in response to the growing demand for automotive
aluminum panel materials in Asia, including Japan and China.
It aims to secure stable production and supply capacity in upstream
operations.
Sep. 2017 Joint venture to be established
Expansion of facilities for aluminum sheet for automotive
closure panels at the Moka PlantJapan
The expansion plan is to respond to the growing demand for
aluminum closure panels in Asia, including Japan and China.
Kobe Steel aims to build a stable supply structure for high quality
aluminum sheets for closure panels.
FY2017 Construction begins
Jan. 2020 Production begins
Increase of production capacity to make hot-dipped
galvanized ultra high-strength steel for automotive use in
the U.S.
(PRO-TEC Coating Company)
USA
This plan is in response to growing demand for automotive high-
strength steel sheet in the United States. The new continuous
galvanizing line will have the capability to produce high-formability,
ultra high-strength steel.
Jul. 2017 Production begin
AircraftBegan mass production of large titanium forged
parts for Airbus planesー
First in Japan to succeed in research on and mass production of large
forgings for landing gears.Jul. 2016 Production began
After receiving approval, began mass production of titanium
alloy forgings for large GE jet engine
Received approval as a supplier of titanium alloy forged parts (shafts) for
large commercail GE jet engine.Aug. 2016 Received certification. Began mass production.
Ships Start of sales of robotic welding systems for shipbuilding -The robotic welding system enables automatic welding to assemble large
blocks in shipbuilding. It contributes to improve efficiency in welding work.FY2017 Sales began

【Machinery】 Initiatives in the Fields of Energy and Infrastructure
42
Field Project Country Description Schedule
Welding
Integration of small transportable
welding robot business
(Kobelco ROBOTiX Co., Ltd.)
-
100% subsidiary of Kobe Steel, Kobelco Robot Service Co., Ltd. succeeded
the 'Ishimatsu welding robot series',small transportable welding robots
owned by MHI Solution Technologies Co., Ltd. In addition,
the company name was changed. The integration is aimed to respond to
customer's diversified needs such as labor-saving at welding sites.
Dec. 2017
Succession of small transportable
welding robot business
Company name changed
Sales begin for new oil-free standard
air compressorsー World's highest class of energy efficiency; low-noise operation Oct. 2016 Sales began
HyAC mini-A all-in-one, compact
compressor package for hydrogen
refueling stations in the U.S.
USA
We have started marketing the HyAC mini-A, an all-in-one, compact compressor
package for stationary hydrogen refueling stations designed for use in the U. S.. It
consists of a high-pressure hydrogen compressor and a refrigerator sold together
with a high-pressure storage tank unit and a dispenser as a set. We are the first in
Japan to sell hydrogen compressors for hydrogen refueling stations overseas.
Feb. 2017 Sales began
Binary power generation system for
Lake Toya Hot Spring in HokkaidoJapan
Our binary power generation system, a high-efficiency and conpact package, is
used in a project for geothermal enegy utilization in Toyako-cho in Hokkaido.Mar. 2017 Order received
Large-capacity compressor test facility
opensJapan
One of the largest in the world, this test facility is capable of conducting
performance tests on nonstandard compressors with variable-speed motors
of 40 MW. It enables Kobe Steel to satisfy conditions to enter the large-
capacity compressor market. We are focusing on the Asian market, where
Kobe Steel has an edge.
Apr. 2017 Facility opened
Establishment of a compressor service
company in the Philippines
(Kobelco Machinery Philippines Inc.)
Philippines
Kobe Steel established a company in the Philippines to dispatch supervisors
and provide engineering services for its nonstandard compressor business to
expand its services in the region. It aims to further grow its global non-
standard compressor business and set down roots in areas of demand.
Feb 2017 Established
Apr.2017 Sales began
Industrial
Machinery
Acquisition of Swedish isostatic press
manufacturer Quintus TechnologiesSweden
Kobe Steel acquired Swedish company Quintus Technologies AB, the world leader
in isostatic presses, which are widely applicable in the manufacture of high-
performance products, such as aircraft parts, power generation turbine and
semiconductor materials. It aims to increase the profitability of Industrial
Machinery Division.
Apr. 2017 Acquisition completed
Sales begin of ultra-large crawler
cranes in Japan (lifting capacity of
1,250t)
ー One of Japan's largest crawler cranes May 2016 Sales began
Operation of energy-recovery waste
treatment plantJapan
Utilizes fluidized bed gasification and combustion furnace.
Next-generation incineration furnace contributes to a more compact facility,
maximizes power generation and reduces environmental burden.
Jun. 2016 Order received
2016-2019 Construction of facility
2019-2039 Facility in operation
Received order to construction and
operate a wide-area waste treatment
plant
Japan
To handle a wide variety of waste, a stoker-type incineration furnace will be
used for safe, stable incineration. Low excess air combustion and high-
efficiency power generation contribute to lowering the environmental
burden.
Dec. 2016 Order received
2016-2022 Construction of facility
2022-2042 Facility in operation
Compressors
Construction
Machinery
Engineering

43
【Electric Power】 Initiatives for Stable Profitability
in the Electric Power Supply Business
Field Project Country Description Schedule
Electric
Power
Nos. 1 & 2 units at Kobe
(Kobelco Power Kobe, Inc.)Japan
Pulverized coal-fired, supercritical pressure
power generation equipment, started from
2002. New contracts were formed as
current contracts are ending.
Capacity: 1.4 mil. kW (700,000 kW × 2)
Apr. 2002 No. 1 unit starts up
Apr. 2004 No. 2 unit starts up
[Start of new contracts]
No.1 unit: from Apr. 2017
No.2 unit: from Apr. 2019
Nos. 1 & 2 units at Moka
(Kobelco Power Moka, Inc.)Japan
Japan's first full-scale inland power plant. Will
have one of Japan's highest levels of generation
efficiency. Method Method is gas turbine
combined cycle, using city gas as fuel.
Capacity: 1.248 mil. kW (624,000 kW X2)
Jun. 2016 Construction began
2H 2019 No. 1 Unit starts up
1H 2020 No. 2 Unit starts up
Nos. 3 & 4 units at Kobe
(provisional name: Kobe Works Thermal
Power Plant)
Japan
To feature cutting-edge coal-fired, ultra-
supercritical generation equipment
Capacity: 1.3 mil. kW (650,000 kW x 2)
FY2021 No. 3 unit to start up
FY2022 No. 4 unit to start up

44
Core Values of KOBELCO
1. We provide technologies, products and services that win the trust and confidence of our customers we serve and the society in which we live.
2. We value each employee and support his and her growth on an individual basis, while creating a cooperative and harmonious environment.
3. Through continuous and innovative changes, we create new values for the society of which we are a member.

45
Cautionary Statement • Certain statements in this presentation contain forward-looking
statements concerning forecasts, assertions, prospects, intentions and strategies. The decisions and assumptions leading to these statements were based on information currently available to Kobe Steel. Due to possible changes in decisions and assumptions, future business operation, and internal and external conditions, actual results may differ materially from the projected forward-looking statements. Kobe Steel is not obligated to revise the forward-looking contents of this presentation.
• Uncertain and variable factors include, but are not limited to: – Changes in economic outlook, demand and market conditions – Political situation and trade and other regulations – Changes in currency exchange rates – Availability and market conditions of raw materials – Products and services of competing companies, pricing policy,
alliances, and business development including M&As – Strategy changes of alliance partners