Embed Size (px)
Citation preview
Fiscal Policy, Deficits, and Debt
30
McGraw-Hill/Irwin Copyright © 2012 by The McGraw-Hill Companies, Inc. All rights reserved.
Fiscal Policy
• Deliberate changes in:
• Government spending
• Taxes• Designed to:
• Achieve full-employment
• Control inflation
• Encourage economic growth
LO1 30-2
Expansionary Fiscal Policy
• Use during a recession
• Increase government spending
• Decrease taxes
• Combination of both
• Create a deficit
LO1 30-3
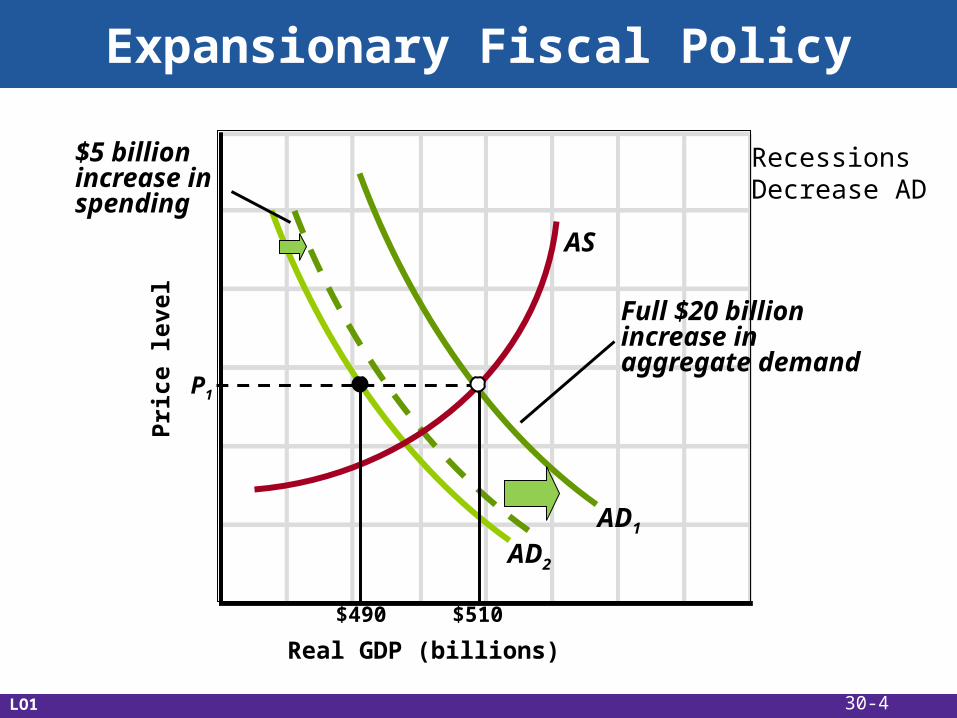
Expansionary Fiscal Policy
Real GDP (billions)
Pri
ce l
evel
AD2
AD1
$5 billion increase inspending
Full $20 billion increase inaggregate demand
AS
$490 $510
P1
LO1
RecessionsDecrease AD
30-4
Contractionary Fiscal Policy
• Use during demand-pull inflation
• Decrease government spending
• Increase taxes
• Combination of both
• Create a surplus
LO1 30-5
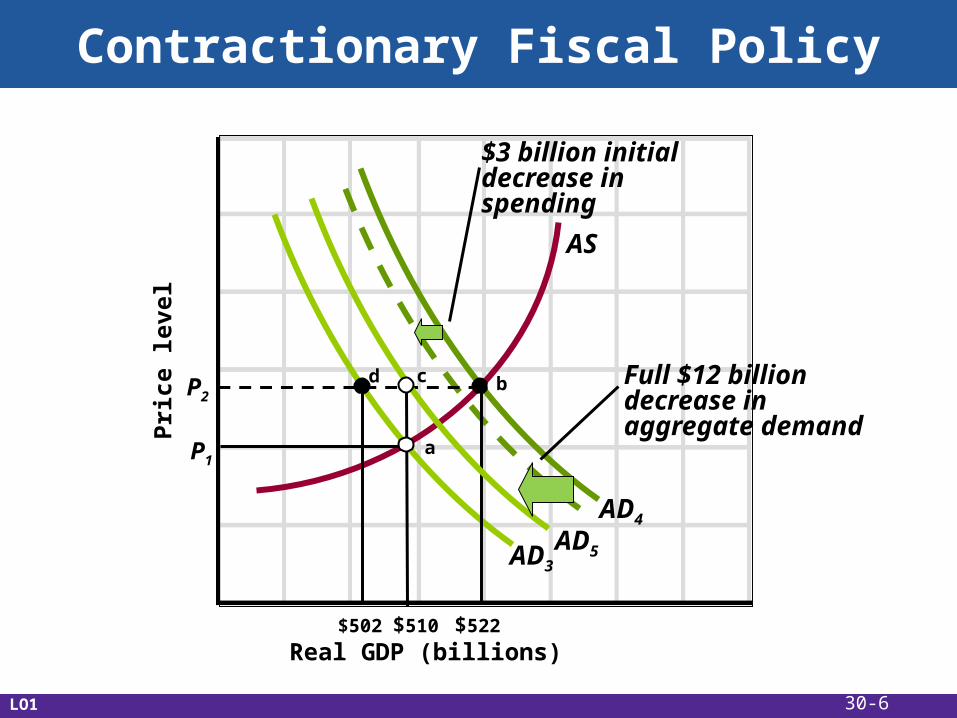
Contractionary Fiscal Policy
Real GDP (billions)
Pri
ce l
evel
AD3
AD4
$3 billion initialdecrease inspending
Full $12 billion decrease inaggregate demand
AS
$502 $522
P2
AD5
$510
d b
aP1
c
LO1 30-6
Policy Options: G or T?
• To expand the size of government
• If recession, then increase government spending
• If inflation, then increase taxes• To reduce the size of government
• If recession, then decrease taxes
• If inflation, then decrease government spending
LO1 30-7
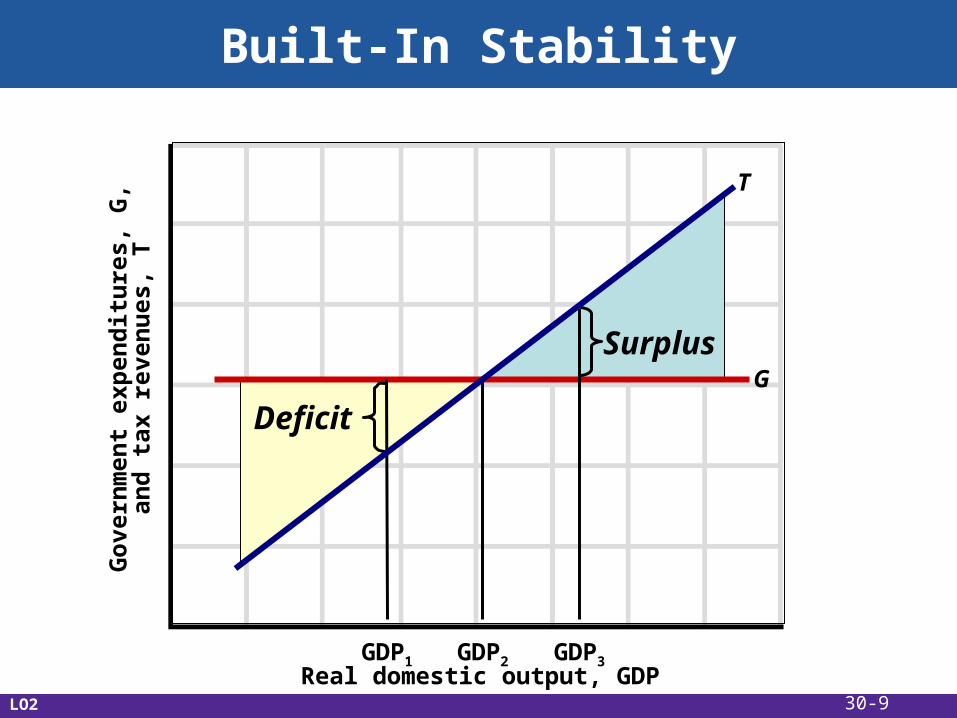
Built-In Stability
• Automatic stabilizers
• Taxes vary directly with GDP
• Transfers vary inversely with GDP• Reduces severity of business
fluctuations• Tax progressivity
• Progressive tax system
• Proportional tax system
• Regressive tax systemLO2 30-8
Built-In Stability
G
T
Deficit
Surplus
GDP1 GDP2 GDP3Real domestic output, GDP
Go
vern
men
t ex
pen
dit
ure
s, G
,an
d t
ax r
even
ues
, T
LO2 30-9
Evaluating Fiscal Policy
• Is the fiscal policy…
• Expansionary?
• Neutral?
• Contractionary?• Use the cyclically adjusted budget to
evaluate
LO3 30-10
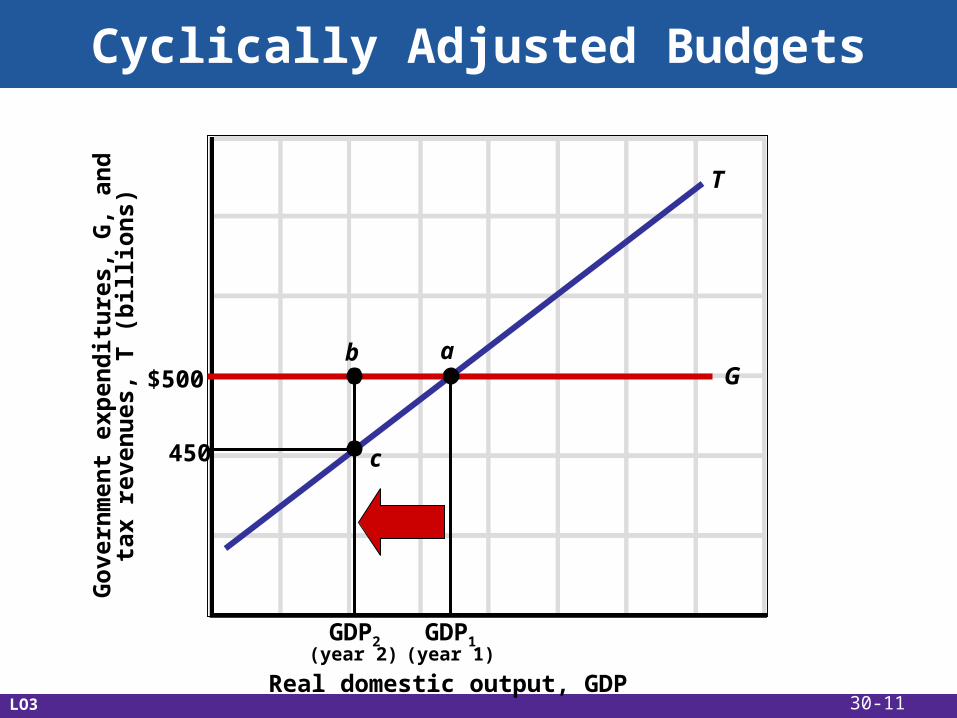
Cyclically Adjusted Budgets
G
T
GDP2 GDP1
Real domestic output, GDP
Go
vern
men
t ex
pen
dit
ure
s, G
, an
dta
x re
ven
ues
, T
(b
illi
on
s)
(year 2) (year 1)
$500
450
ab
c
LO3 30-11
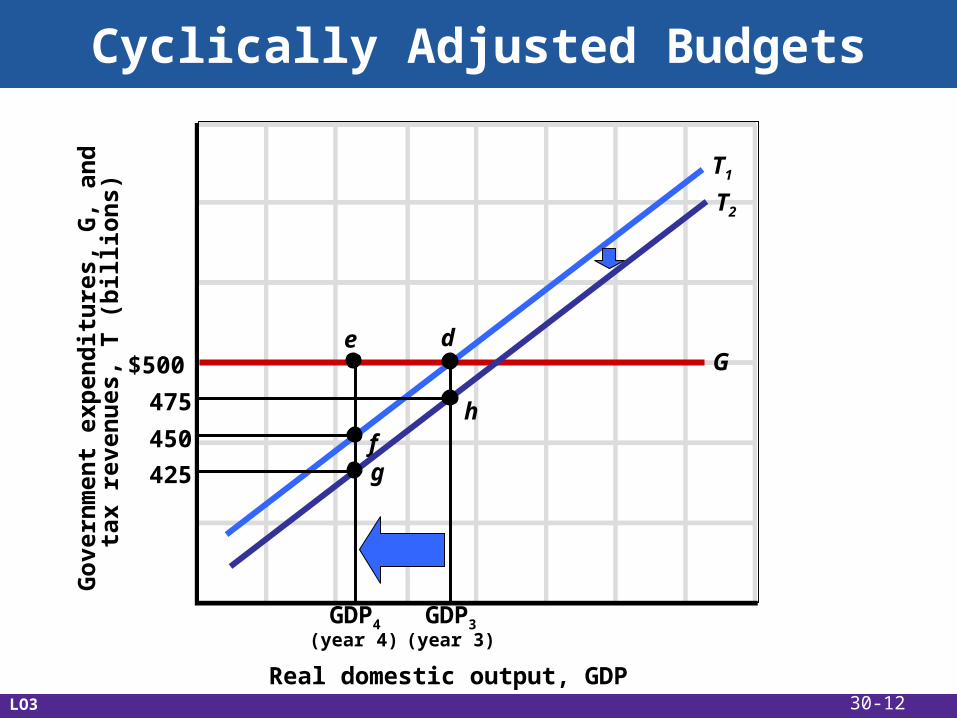
Cyclically Adjusted Budgets
G
T1
GDP4 GDP3
Real domestic output, GDP
Go
vern
men
t ex
pen
dit
ure
s, G
, an
d
tax
reve
nu
es,
T (
bil
lio
ns)
(year 4) (year 3)
$500
450
de
f
475
425 g
T2
h
LO3 30-12
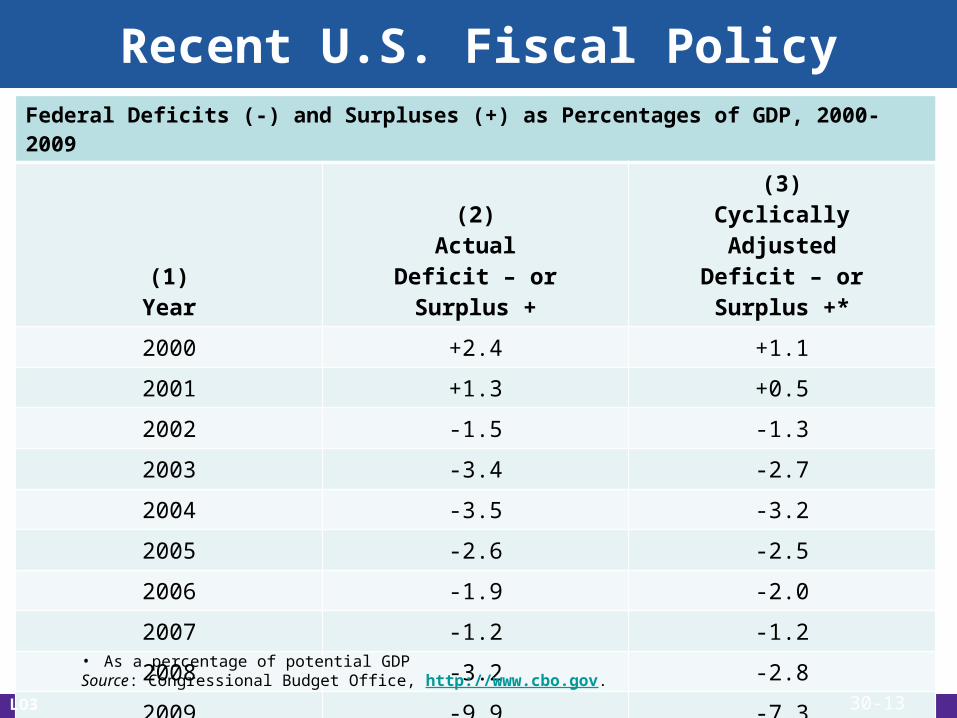
Recent U.S. Fiscal PolicyFederal Deficits (-) and Surpluses (+) as Percentages of GDP, 2000-2009
(1)Year
(2)Actual
Deficit – orSurplus +
(3)CyclicallyAdjusted
Deficit – orSurplus +*
2000 +2.4 +1.1
2001 +1.3 +0.5
2002 -1.5 -1.3
2003 -3.4 -2.7
2004 -3.5 -3.2
2005 -2.6 -2.5
2006 -1.9 -2.0
2007 -1.2 -1.2
2008 -3.2 -2.8
2009 -9.9 -7.3
• As a percentage of potential GDPSource: Congressional Budget Office, http://www.cbo.gov.
LO3 30-13
Fiscal Policy: The Great Recession
• Financial market problems began in 2007
• Credit market freeze• Pessimism spreads to the overall
economy• Recession officially began December
2007 and lasted 18 months
LO4 30-14
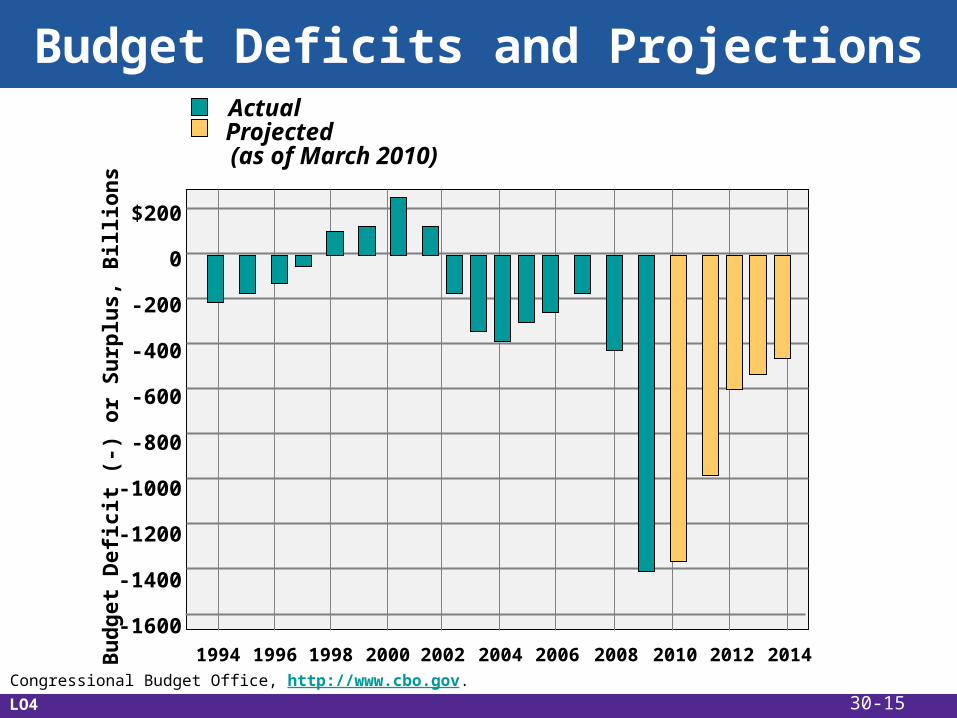
Budget Deficits and Projections
Source: Congressional Budget Office, http://www.cbo.gov.
$200
0
-200
-400
-600
-800
-1000
-1200
-1400
-1600
Bu
dg
et D
efic
it (
-) o
r S
urp
lus,
Bill
ion
s
1994 1996 1998 2000 2002 2004 2006 2008 2010 2012 2014
ActualProjected
(as of March 2010)
LO4 30-15
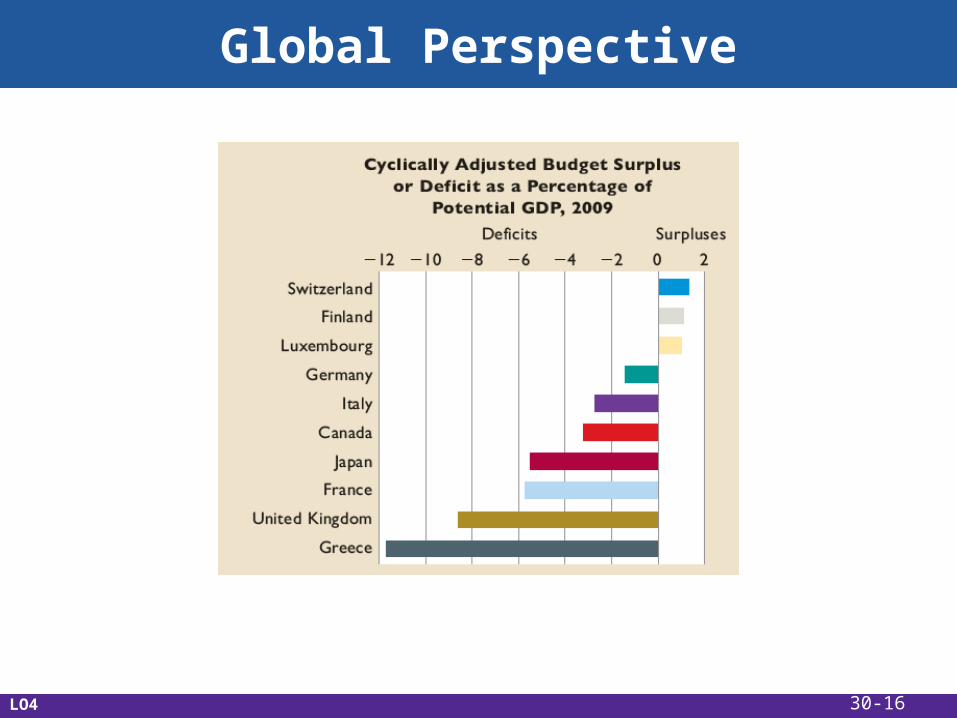
Global Perspective
LO4 30-16
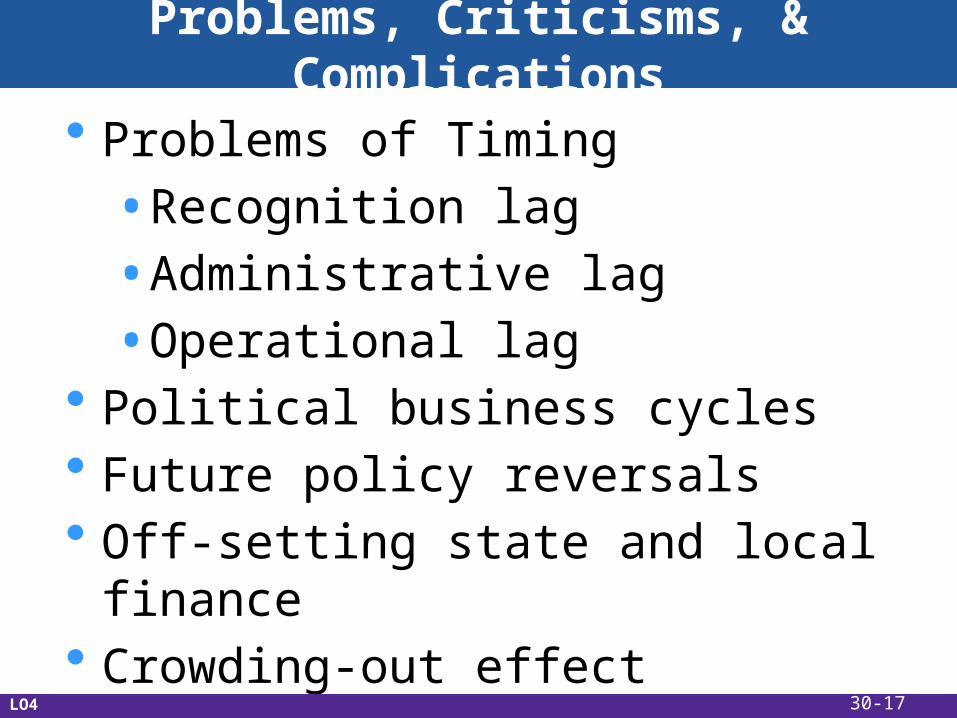
Problems, Criticisms, & Complications
• Problems of Timing
• Recognition lag
• Administrative lag
• Operational lag• Political business cycles• Future policy reversals• Off-setting state and local finance• Crowding-out effect
LO4 30-17
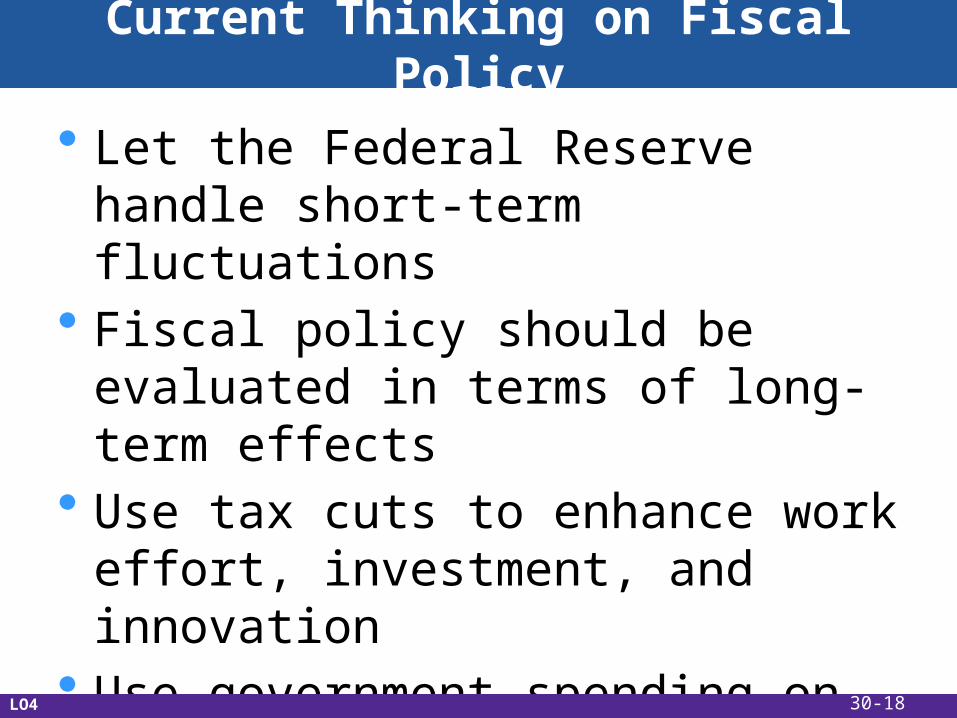
Current Thinking on Fiscal Policy
• Let the Federal Reserve handle short-term fluctuations
• Fiscal policy should be evaluated in terms of long-term effects
• Use tax cuts to enhance work effort, investment, and innovation
• Use government spending on public capital projects
LO4 30-18
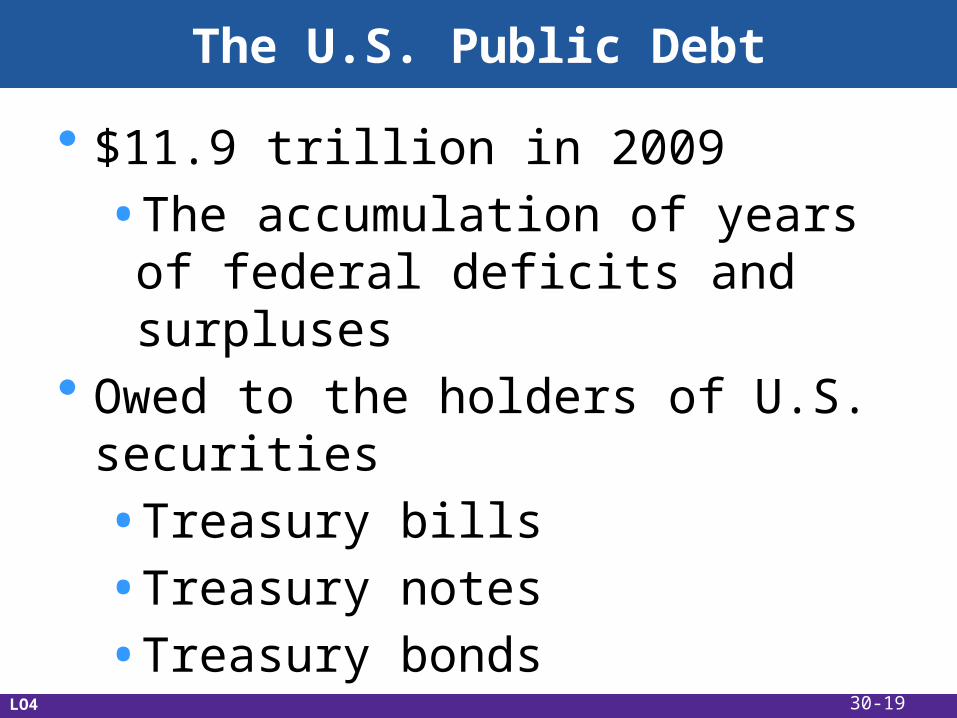
The U.S. Public Debt
• $11.9 trillion in 2009
• The accumulation of years of federal deficits and surpluses
• Owed to the holders of U.S. securities
• Treasury bills
• Treasury notes
• Treasury bonds
• U.S. savings bonds
LO4 30-19
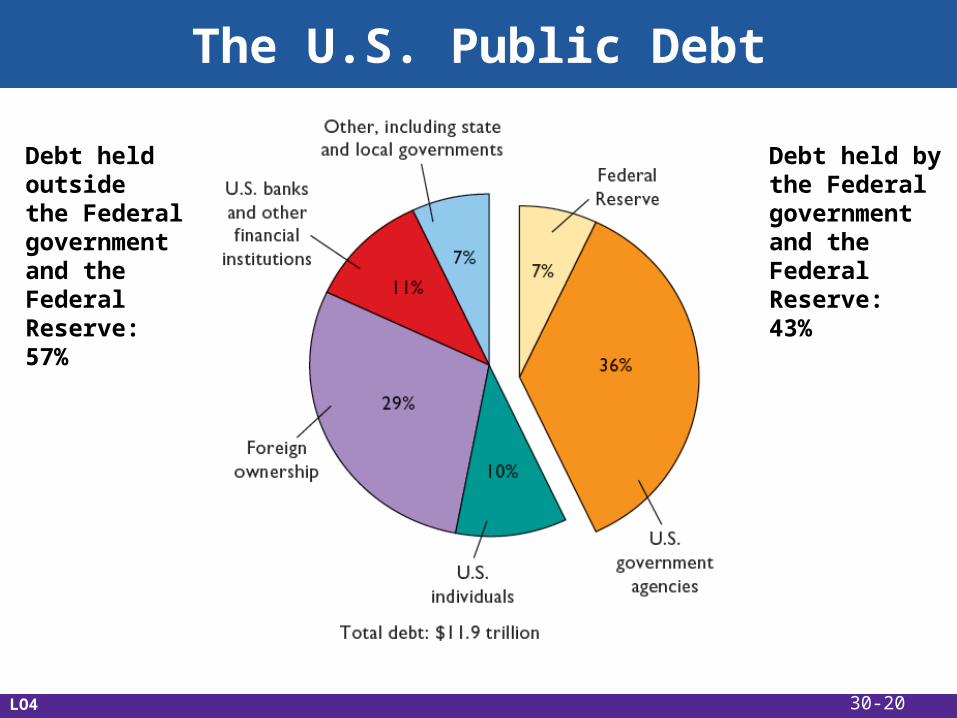
The U.S. Public Debt
LO4
Debt held outsidethe Federal government and theFederal Reserve:57%
Debt held bythe Federal government and the Federal Reserve:43%
30-20
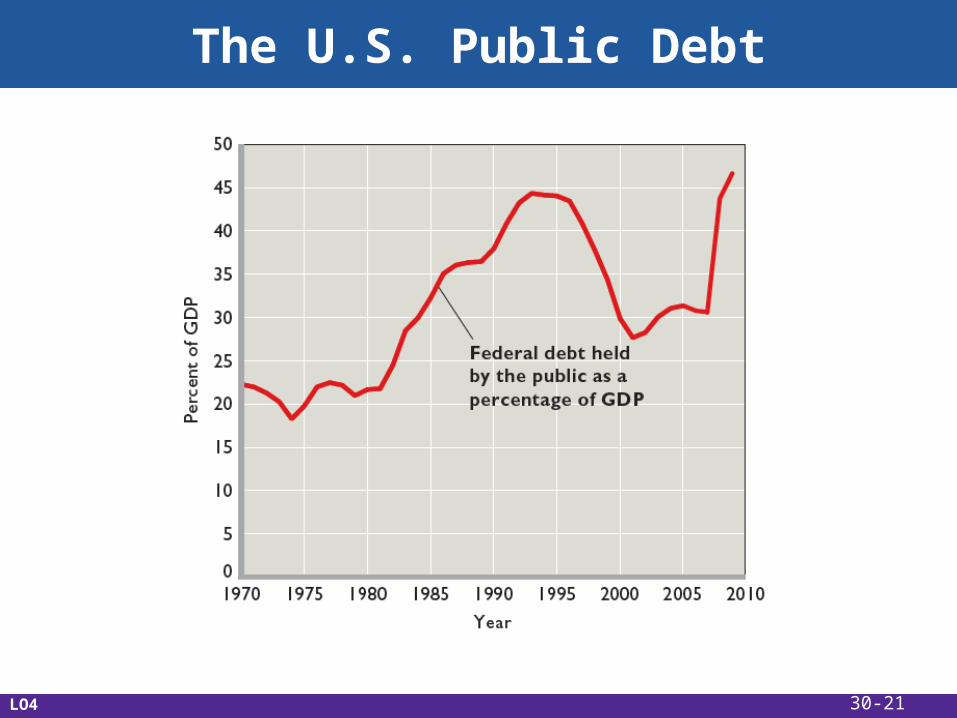
The U.S. Public Debt
LO4 30-21
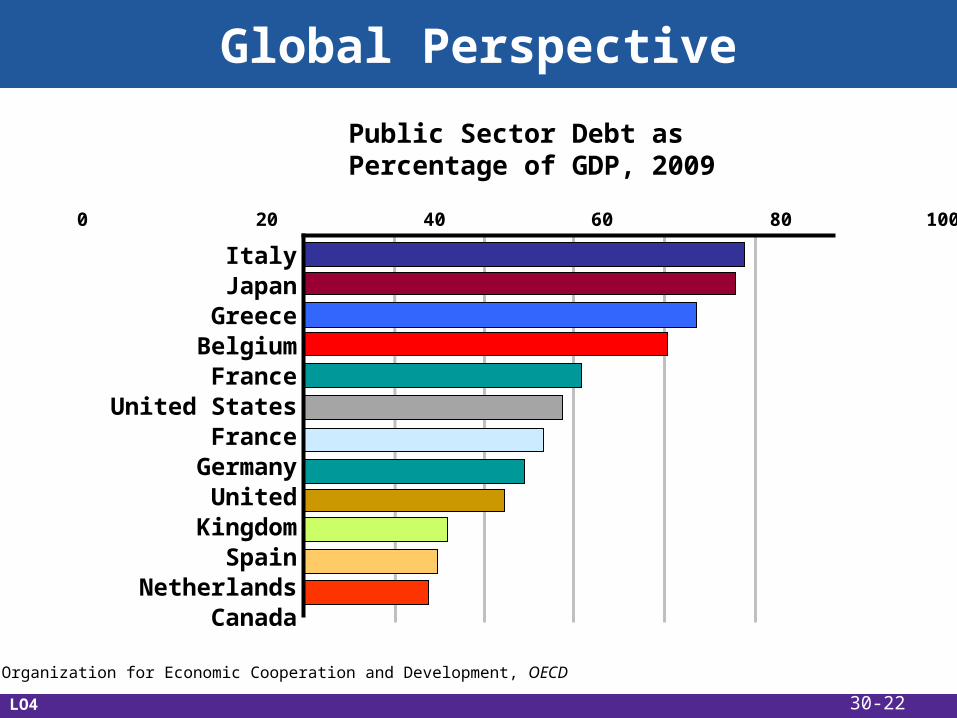
Global Perspective
Public Sector Debt as Percentage of GDP, 2009
ItalyJapan
GreeceBelgium
FranceUnited States
FranceGermany
United KingdomSpain
NetherlandsCanada
0 20 40 60 80 100
Source: Organization for Economic Cooperation and Development, OECD
LO4 30-22
The U.S. Public Debt
• Interest charges on debt
• Largest burden of the debt
• 1.3% of GDP in 2009• False Concerns
• Bankruptcy•Refinancing•Taxation
• Burdening future generations
LO4 30-23
Substantive Issues
• Income distribution• Incentives• Foreign-owned public debt• Crowding-out effect revisited
• Future generations
• Public investment
LO4 30-24
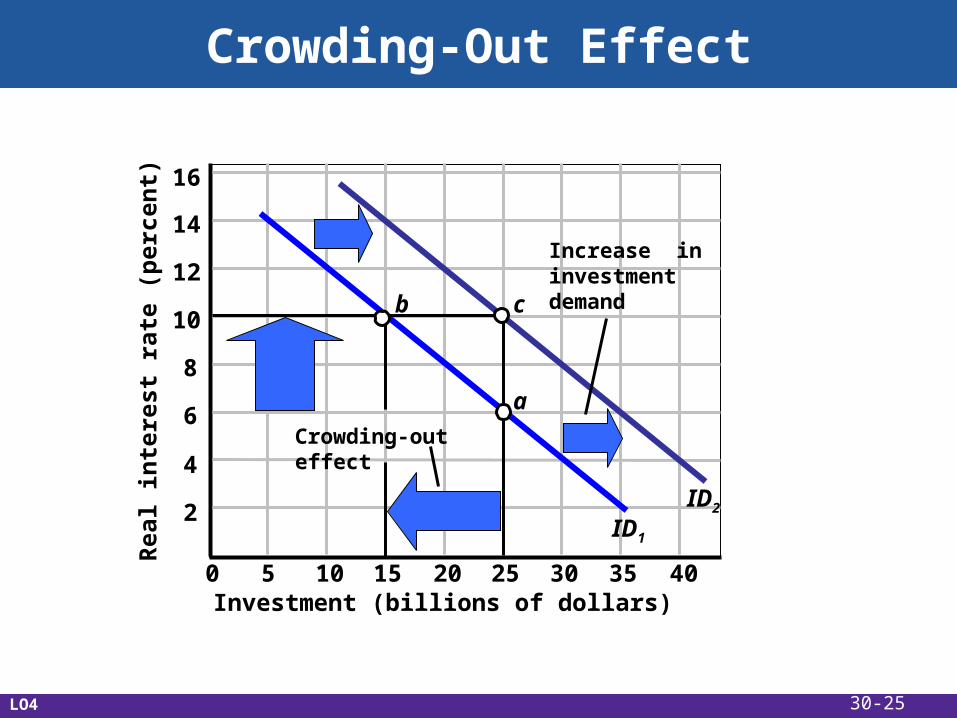
Crowding-Out Effect
5 10 15 20 25 30 35 400
2
4
6
8
10
12
14
16R
eal
inte
rest
rat
e (p
erce
nt)
Investment (billions of dollars)
ID1
ID2
a
b c
Increase ininvestmentdemand
Crowding-out effect
LO4 30-25
Social Security, Medicare Shortfalls
• More Americans will be receiving benefits as they age
• Social security shortfalls
• Income during retirement
• Funds will be depleted by 2037• Medicare shortfalls
• Medical care during retirement
• Funds will be depleted by 2017
30-26
Social Security, Medicare Shortfalls
• Possible options “to fix” include:
• Increasing the retirement age
• Increasing the portion of earnings subject to the social security tax
• Disqualifying wealthy individuals
• Redirecting low-skilled immigrants to higher-skilled, higher paying work
• Defined contribution plans owned by individuals
30-27