Embed Size (px)
Citation preview
Dennis J. Gallagher Auditor
Office of the Auditor
Audit Services Division
City and County of Denver
Fiscal Sustainability: Financial Condition and Transparency
Performance Audit
December 2013
The Auditor of the City and County of Denver is independently elected by the citizens of Denver.
He is responsible for examining and evaluating the operations of City agencies for the purpose
of ensuring the proper and efficient use of City resources and providing other audit services and
information to City Council, the Mayor and the public to improve all aspects of Denver’s
government. He also chairs the City’s Audit Committee.
The Audit Committee is chaired by the Auditor and consists of seven members. The Audit
Committee assists the Auditor in his oversight responsibilities of the integrity of the City’s finances
and operations, including the integrity of the City’s financial statements. The Audit Committee is
structured in a manner that ensures the independent oversight of City operations, thereby
enhancing citizen confidence and avoiding any appearance of a conflict of interest.
Audit Committee
Dennis Gallagher, Chair Robert Bishop
Maurice Goodgaine Jeffrey Hart
Leslie Mitchell Timothy O’Brien, Vice-Chair
Rudolfo Payan
Audit Staff
Audrey Donovan, Deputy Director, CIA, CRMA, CGAP
Chris Horton, Audit Supervisor, PhD, CGAP, CRMA, CCSA
Marcus Garrett, Audit Supervisor, CIA, CGAP, CRMA
Bonnie Doty, Lead Auditor, MGPS
Anna Hansen, Lead Auditor
Robyn Lamb, Lead Auditor
You can obtain copies of this report by contacting us at:
Office of the Auditor
201 West Colfax Avenue, Department 705 Denver CO, 80202
(720) 913-5000 Fax (720) 913-5247
Or download and view an electronic copy by visiting our website at:
www.denvergov.org/auditor
To promote open, accountable, efficient and effective government by performing impartial reviews and other audit services
that provide objective and useful information to improve decision making by management and the people.
We will monitor and report on recommendations and progress towards their implementation.
City and County of Denver 201 West Colfax Avenue, Department 705 Denver, Colorado 80202 720-913-5000
FAX 720-913-5247 www.denvergov.org/auditor
Dennis J. Gallagher
Auditor
December 19, 2013
Cary Kennedy, Deputy Mayor, Chief Financial Officer
Department of Finance
City and County of Denver
Dear Ms. Kennedy:
Attached is the Auditor’s Office Audit Services Division’s report of their audit of fiscal
sustainability, specifically financial condition and the transparency of financial reporting. This is
the first report covering the City’s fiscal sustainability. The purpose of the audit was to assess the
City’s financial condition using a well-regarded methodology and determine if there were any
areas that needed additional attention and investigation by your department. The Division will
report further on fiscal sustainability in early 2014.
I’m pleased to report that our assessment of the City’s financial condition had numerous positive
results, including several favorable financial condition indicators and our determination that the
City’s public financial reporting adheres to leading practices in several areas. However, we
noted some areas of concern regarding the amount of debt that the City maintains, particularly
with respect to debt at Denver International Airport. We also make recommendations regarding
areas where the City can further enhance its financial transparency as we seek to become a
world class city. I am confident that these findings will not fall on rocky soil under your leadership.
If you have any questions, please call Kip Memmott, Director of Audit Services, at 720-913-5000.
Sincerely,
Dennis J. Gallagher
Auditor
DJG/cnh
cc: Honorable Michael Hancock, Mayor
Honorable Members of City Council
Members of Audit Committee
Ms. Janice Sinden, Chief of Staff
Ms. Stephanie O’Malley, Deputy Chief of Staff
Ms. Beth Machann, Controller
Mr. Brendan Hanlon, Budget Director

To promote open, accountable, efficient and effective government by performing impartial reviews and other audit services
that provide objective and useful information to improve decision making by management and the people.
We will monitor and report on recommendations and progress towards their implementation.
Mr. Robert Gibson, Director of Cash, Risk, and Capital Funding
Mr. Doug Friednash, City Attorney
Ms. Janna Young, City Council Executive Staff Director
Mr. L. Michael Henry, Staff Director, Board of Ethics
Ms. Kim Day, Manager of the Department of Aviation
Mr. Patrick Heck, Chief Financial Officer, Department of Aviation
Mr. Steven Hutt, Executive Director, Denver Employees Retirement Plan
To promote open, accountable, efficient and effective government by performing impartial reviews and other audit services
that provide objective and useful information to improve decision making by management and the people.
We will monitor and report on recommendations and progress towards their implementation.
City and County of Denver 201 West Colfax Avenue, Department 705 Denver, Colorado 80202 720-913-5000
FAX 720-913-5247 www.denvergov.org/auditor
Dennis J. Gallagher
Auditor
AUDITOR’S REPORT
We have completed an audit assessing the fiscal sustainability of the City, specifically related to
its financial condition and the transparency of its financial reporting practices. This is the first
report reviewing the City’s fiscal sustainability. This audit had two objectives: to assess the City’s
current financial condition; and to assess the degree to which financial information is publicly
reported in comparison to leading practice.
This performance audit is authorized pursuant to the City and County of Denver Charter, Article
V, Part 2, Section 1, General Powers and Duties of Auditor, and was conducted in accordance
with generally accepted government auditing standards. Those standards require that we plan
and perform the audit to obtain sufficient, appropriate evidence to provide a reasonable basis
for our findings and conclusions based on our audit objectives. We believe that the evidence
obtained provides a reasonable basis for our findings and conclusions based on our audit
objectives.
The audit found that as of December 31, 2012, Denver’s overall financial condition is promising
due to a favorable financial position and positive revenue-related financial indicators. However,
the audit identified unfavorable indicators of financial condition related to debt, capital assets,
and liabilities. Left unchecked, these unfavorable financial condition areas may diminish the
City’s ability to provide existing services on an ongoing basis. Audit work also determined that
the City has enhanced transparency and accessibility of financial information through the use of
several web pages, and could potentially become a local government transparency leader by
further improving the financial data it shares with stakeholders.
We extend our appreciation to the Chief Financial Officer, the City Controller, the City Budget
Director, the Director of Cash, Risk, and Capital Funding, and all of the other City personnel and
outside parties who assisted us during the audit.
Audit Services Division
Kip Memmott, MA, CGAP, CRMA
Director of Audit Services
Background The Department of Finance is
responsible for the City’s financial
management, including collecting
revenues and other funds, tracking
and accounting for City funds, and
creating the City Budget. The
Department of Finance is led by the
Chief Financial Officer. Key
components of the Department
include the Treasury Division, the
Controller’s Office, and the Budget
and Management Office.
Purpose This audit report contains the results
of two audit objectives: to assess the
City’s current financial condition; and
to assess the degree to which
financial information is publicly
reported in comparison to leading
practice. The financial condition
assessment included a review of
thirteen financial condition
indicators, such as revenues,
liquidity, solvency, capital assets,
debt management, expenditures, and
post-employment benefits such as
pensions.
City and County of Denver – Office of the Auditor Audit Services Division
REPORT HIGHLIGHTS
Fiscal Sustainability: Financial Condition and Transparency
December 2013
The audit evaluated the City’s fiscal health based thirteen key financial indicators, and assessed the extent
to which the City conforms to leading practice in financial transparency.
Highlights As of December 31, 2012, Denver’s overall financial condition is
promising. For example, since 2009, the City’s ability to handle
unforeseen resource needs over the short-term has trended
upward. Moreover, since 2009, the City has reduced reliance on
general revenues (primarily taxes) and increased the self-
sufficiency of basic government services. While Denver’s current
financial outlook is promising, the audit identified several less
favorable indicators of financial condition which warrant further
analysis. These include primary government debt burden per
resident, the sufficiency of Denver’s Enterprise Funds’ resources to
repay debt, and the City’s maintenance of capital assets. These
indicators are intended to provide a snapshot of potential financial
concerns so the City’s leadership can conduct further assessment
and implement appropriate and timely responses.
The audit also found that, while the City has increased
transparency and accessibility of financial information through its
reports and website, more could be done to enhance transparency
for its various stakeholders by adopting recently articulated leading
practices in financial reporting.
For a complete copy of this report, visit www.denvergov.org/auditor Or Contact the Auditor’s Office at 720.913.5000
TABLE OF CONTENTS
INTRODUCTION & BACKGROUND 1
SCOPE 9
OBJECTIVE 9
METHODOLOGY 9
FINDING 1 12
Denver’s Financial Condition Is Promising but There Are Some Key
Unfavorable Financial Indicators That Warrant Additional
Attention 12
Denver’s Current and Historic Financial Condition 12
10-Point Test Financial Indicators with Favorable Results 15
1. Short-run Financial Position 16
2. Liquidity 17
3. Financial Asset Performance 18
4. Solvency 19
5. Primary Government Revenues 20
6. Governmental Activities Revenues 21
10-Point Test Financial Indicators with Unfavorable Results 23
7. Primary Government Debt Burden Per Capita 24
8. Governmental Funds Debt Coverage 26
9. Enterprise Funds Debt Coverage 27
10. Capital Assets 28
Results of Three Additional Financial Indicator Analyses 30
1. Expenditures 32
2. Post-Employment Benefits Liability 34
3. Unfunded Pension Liability 37
Importance of City Management Performing a Periodic Financial
Condition Analysis 38
TABLE OF CONTENTS (continued)
RECOMMENDATIONS 38
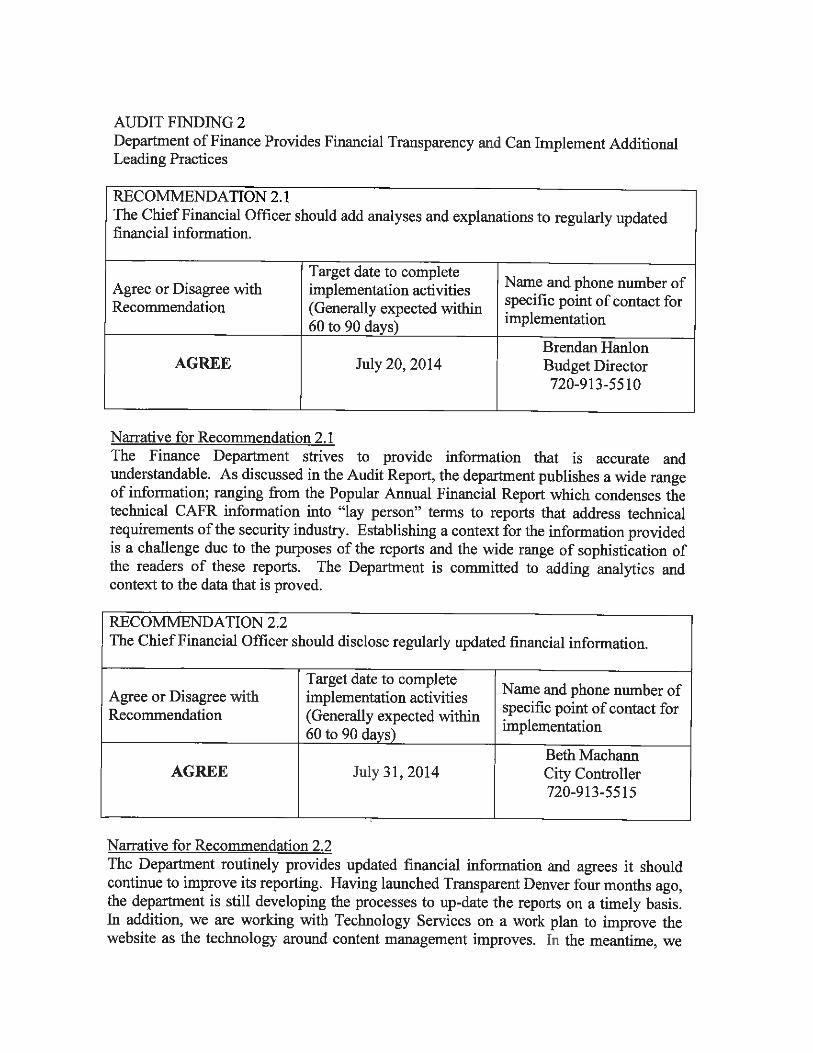
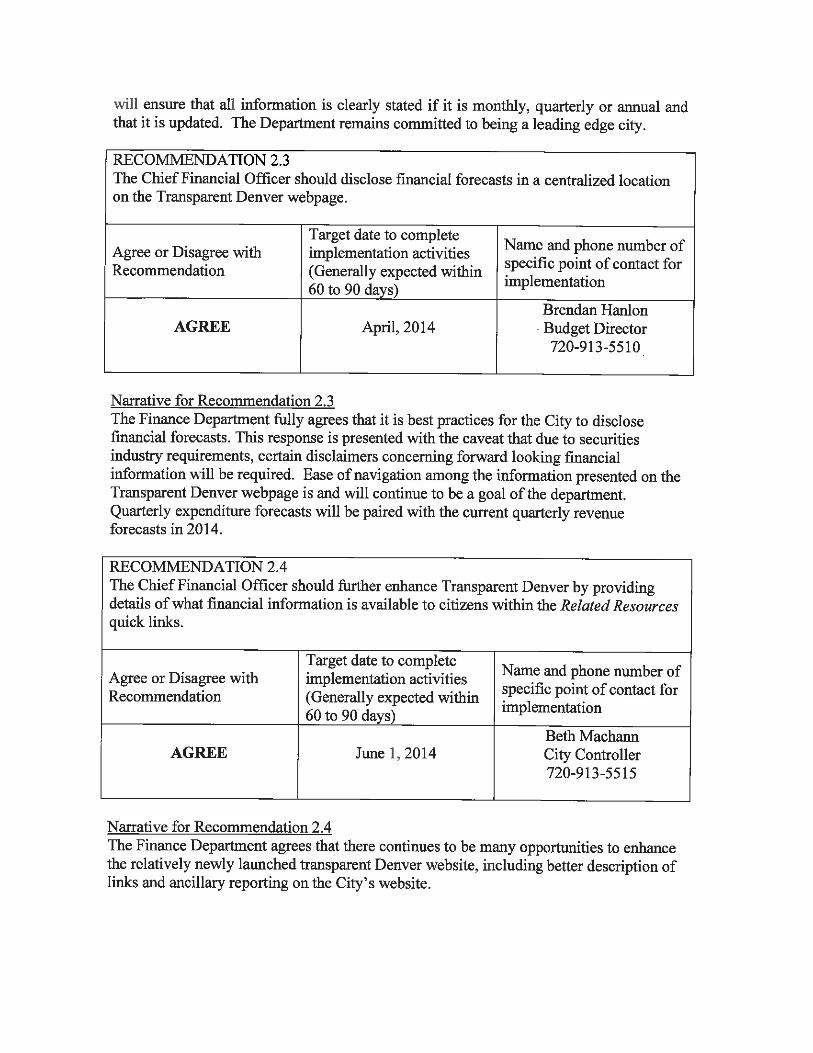
FINDING 2 39
Department of Finance Provides Financial Transparency and Can
Implement Additional Leading Practices 39
RECOMMENDATIONS 43
APPENDIX A 44
10-Point Test Rankings for Denver and Benchmark Cities, 2002-
2012 44
Favorable Indicators 44
Unfavorable Indicators 48
APPENDIX B 50
Interpretation of 10-Point Test Scores 50
AGENCY RESPONSE 52
P a g e 1
Office of the Auditor OOffffiiccee ooff tthhee AAuuddiittoorr
INTRODUCTION & BACKGROUND
Overview of Key Divisions in the Department of Finance
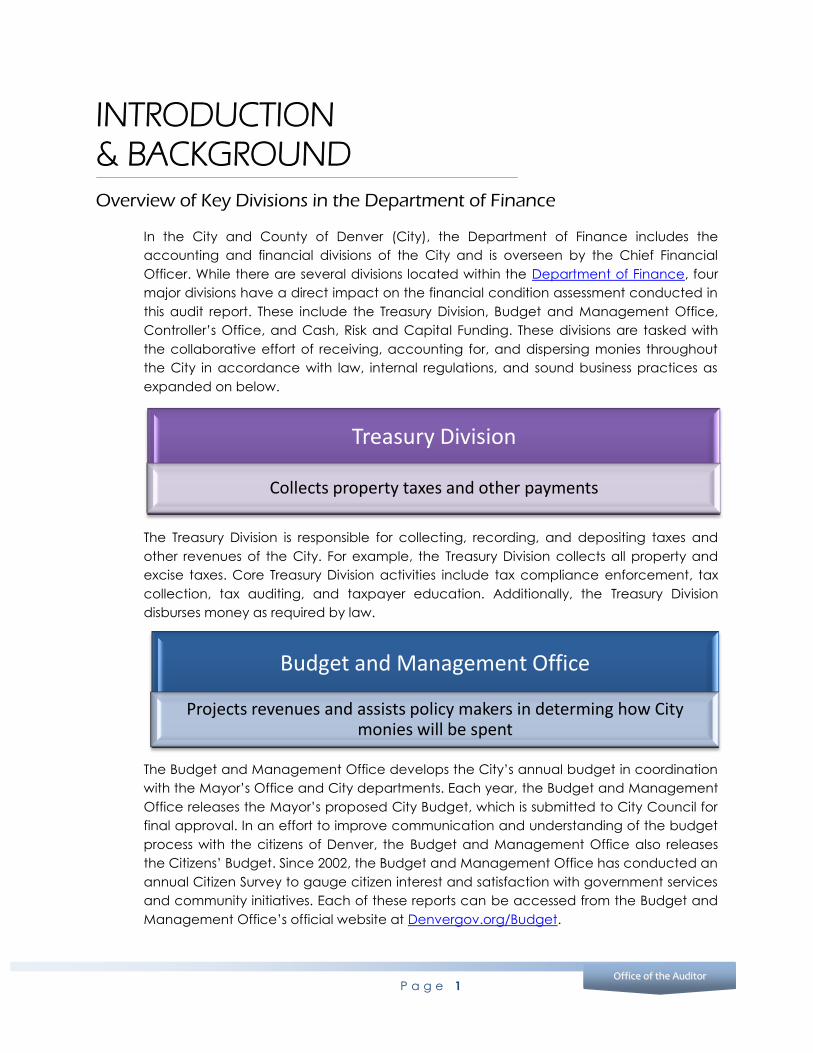
In the City and County of Denver (City), the Department of Finance includes the
accounting and financial divisions of the City and is overseen by the Chief Financial
Officer. While there are several divisions located within the Department of Finance, four
major divisions have a direct impact on the financial condition assessment conducted in
this audit report. These include the Treasury Division, Budget and Management Office,
Controller’s Office, and Cash, Risk and Capital Funding. These divisions are tasked with
the collaborative effort of receiving, accounting for, and dispersing monies throughout
the City in accordance with law, internal regulations, and sound business practices as
expanded on below.
The Treasury Division is responsible for collecting, recording, and depositing taxes and
other revenues of the City. For example, the Treasury Division collects all property and
excise taxes. Core Treasury Division activities include tax compliance enforcement, tax
collection, tax auditing, and taxpayer education. Additionally, the Treasury Division
disburses money as required by law.
The Budget and Management Office develops the City’s annual budget in coordination
with the Mayor’s Office and City departments. Each year, the Budget and Management
Office releases the Mayor’s proposed City Budget, which is submitted to City Council for
final approval. In an effort to improve communication and understanding of the budget
process with the citizens of Denver, the Budget and Management Office also releases
the Citizens’ Budget. Since 2002, the Budget and Management Office has conducted an
annual Citizen Survey to gauge citizen interest and satisfaction with government services
and community initiatives. Each of these reports can be accessed from the Budget and
Management Office’s official website at Denvergov.org/Budget.
Treasury Division
Collects property taxes and other payments
Budget and Management Office
Projects revenues and assists policy makers in determing how City monies will be spent
P a g e 2
City and County of Denver
The Controller’s Office is responsible for accounting, payroll, and financial reporting in the
City. Core activities include establishing, maintaining, and enforcing the City’s
accounting policies and procedures, which are often conveyed through the adoption of
Fiscal Accountability Rules. Further, the Controller’s Office develops the Comprehensive
Annual Financial Report (CAFR)—an annual report that contains audited financial
information on the operations of the City. The audit of CAFR data is performed by the
City’s external auditor under the oversight of the City’s Independent Audit Committee.
Moreover, the Controller’s Office issues the Popular Annual Financial Report—a citizen-
centric report focused on providing the public with a less complicated breakdown of the
City’s finances. In addition, the Controller’s Office works with the independent external
auditors to provide vital financial data for the creation of the annual Single Audit—a
federally mandated assessment of non-federal entities, such as municipal governments,
that expended more than $500,000 or more in federal awards, such as grants.
The Cash, Risk, and Capital Funding (CRCF) Division was created in 2012, by combining
the Financial Management Section of the Treasury Division with the Risk Management
Division. CRCF’s financial management roles include overseeing the City’s banking
services, cash, and investments, and managing debt issuances. CRCF’s risk
management roles include overseeing the City’s self-funded Worker’s Compensation
insurance program, and managing the City’s risk and exposure due to activities of
departments, agencies, and employees.
City Budget
For 2014 the Mayor has proposed a budget of $1.64 billion for all appropriated funds. The
budget is divided into three general groups of appropriated funds: governmental funds;
proprietary funds; and fiduciary funds.1
Governmental Funds—Governmental funds are the funds used for the City’s basic
operations. This group includes the General Fund, which is the main operating fund for
the City, composed mostly of tax revenues. The General Fund is the funding source for
1 All information in this section was derived from the Approved 2013 Budget and the Mayor’s Proposed 2014 Budget, and from
guidance provided by the Governmental Accounting Standards Board (www.gasb.org).
Controller's Office
Ensures City monies are properly collected, distributed, paid, and recorded
Cash, Risk, and Capital Funding
Manages the cash position, oversees cash handling practices, coordinates commercial banking services, and invests the City's funds
P a g e 3
Office of the Auditor OOffffiiccee ooff tthhee AAuuddiittoorr
cornerstone municipal activities such as Police, Fire, Public Works, and Parks and
Recreation. In 2014, the proposed funding level for the General Fund is $1.06 billion,
about 65 percent of the entire proposed budget for the City.
Other specific governmental funds are the Special Revenue Funds, the Capital
Improvement Funds, and the Debt Service Fund. The Special Revenue Funds consist of
monies that have dedicated purposes, such as federal or state grants. Special Revenue
Funds support varied activities, including economic development, human services, and
public safety. Capital Improvement Funds provide a means for the purchase and
maintenance of major capital assets, though such assets may also be purchased
through different funds depending on the circumstances.2 The City’s various Capital
Improvement Funds comprise monies from various sources, such as property taxes, voter-
approved general obligation bonds, state lottery proceeds, the Highway Users Trust Fund,
and royalties paid to the City from the Winter Park Ski Resort. Finally, the Debt Service
Fund exists to support ongoing long-term debt payments.
Proprietary Funds—The City’s two main types of proprietary funds support business-like
activities and operate similar to funds utilized by the private sector. Most of the City’s
proprietary funds are Enterprise Funds, while a few are Internal Service Funds. The
Enterprise Funds receive revenue primarily from user charges, where the specific users
rather than general taxpayers are responsible for the ongoing revenue stream. The City
has four different enterprise funds, in order of highest revenues to lowest: the Aviation
Enterprise Fund, which supports Denver International Airport; the Wastewater
Management Enterprise Fund, which supports the City’s wastewater and storm water
sewer operations; the Golf Enterprise Fund, which supports operations of the City’s five
municipal golf courses; and the Environmental Services Enterprise Fund, which supports
the City’s efforts to manage environmental liability. The City’s Internal Service Funds
account for goods and services provided to City departments on a cost reimbursement
basis. Fleet, Asphalt Plant, and Workers’ Compensation are examples of Internal Service
Funds.
Fiduciary Funds—The City’s fiduciary funds comprise resources held by a government but
belonging to individuals or entities other than the City government. A prime example of a
fiduciary fund is a trust fund for a public employee pension plan.
Passage of Amendment 2A—The approved 2013 City budget improved significantly in
comparison to the last few years, in part due to the passage of Amendment 2A in
November 2012. Amendment 2A’s passage allowed the City to retain an estimated $44
million of property tax revenue that had been previously credited back to Denver
taxpayers. These funds allowed the City to enhance service levels in various areas, such
as extending the hours during which Denver’s public libraries are open, restoring child
care assistance funding, and providing free access to recreation centers and outdoor
pools for Denver students. In addition, Amendment 2A funding allowed additional
recruits for both the Denver Police Department and the Denver Fire Department. The
additional Amendment 2A funds also increased funding for the Business Incentive Fund,
2 Capital improvement funds are used for the acquisition, repair, or rehabilitation of assets that last for fifteen years or more.
Examples of major capital assets are roads, bridges, buildings, and parks.
P a g e 4
City and County of Denver
expanded the number of lane miles to be paved in the Street Paving Program,
earmarked monies for the technology infrastructure improvements, and increased the
City’s Contingency and Reserve Fund Balance.3
Sources of Revenue
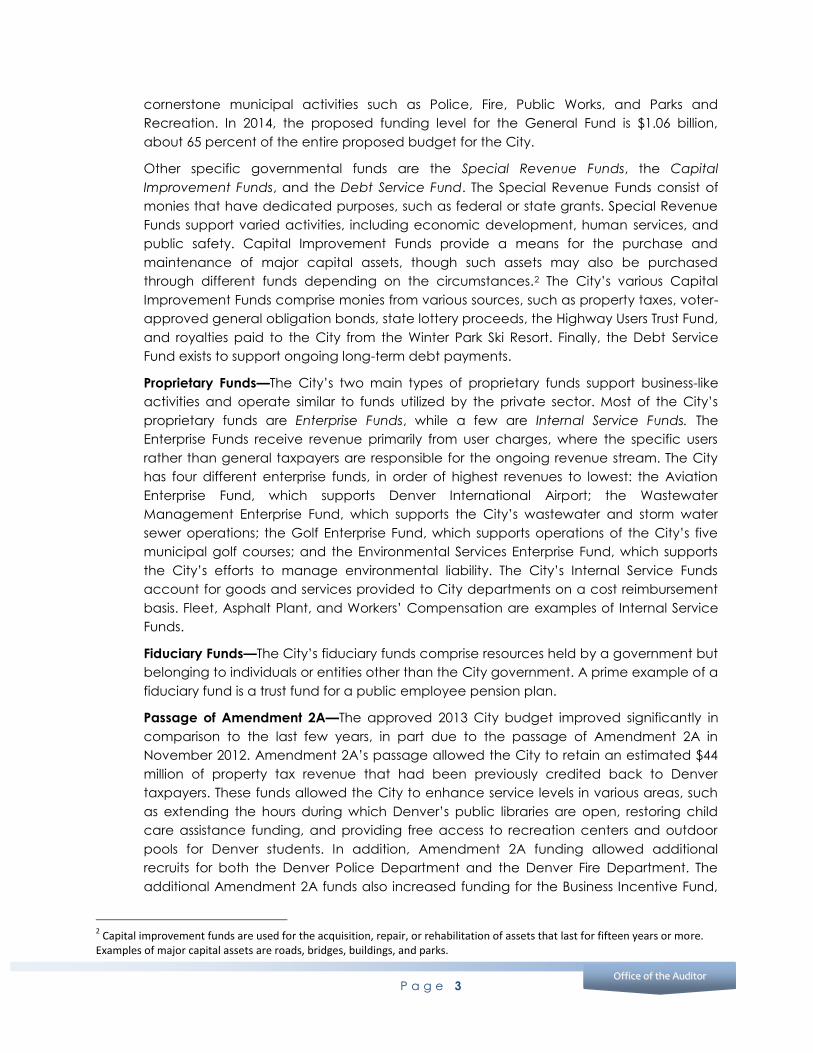
The City receives revenues from a variety of sources. In 2012, the City received
$2,510,198,000 in total revenues for both governmental activities ($1,576,562,000) and
business-type activities ($933,636,000). Governmental activities are those activities
generally financed through taxes and intergovernmental revenues, while business-type
activities are those activities financed, at least in part, by fees and charges. As shown in
Figure 1, the three leading revenue sources for governmental activities revenue in 2012
were sales tax (31.4%), charges for services (20.6%), and property tax (18.2%).
Figure 1: Revenues by Source – Governmental Activities
Source: City of Denver 2012 CAFR: Statement of Activities.
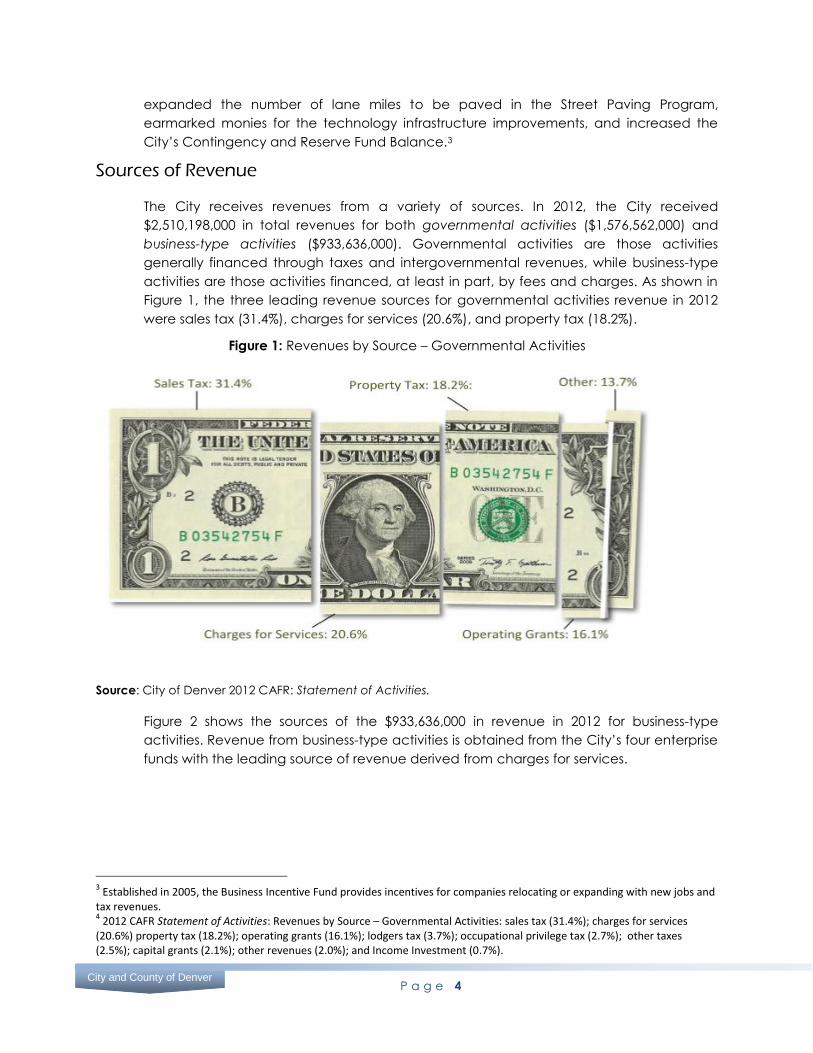
Figure 2 shows the sources of the $933,636,000 in revenue in 2012 for business-type
activities. Revenue from business-type activities is obtained from the City’s four enterprise
funds with the leading source of revenue derived from charges for services.
3 Established in 2005, the Business Incentive Fund provides incentives for companies relocating or expanding with new jobs and
tax revenues. 4 2012 CAFR Statement of Activities: Revenues by Source – Governmental Activities: sales tax (31.4%); charges for services
(20.6%) property tax (18.2%); operating grants (16.1%); lodgers tax (3.7%); occupational privilege tax (2.7%); other taxes (2.5%); capital grants (2.1%); other revenues (2.0%); and Income Investment (0.7%).
P a g e 5
Office of the Auditor OOffffiiccee ooff tthhee AAuuddiittoorr
Figure 2: Revenues by Source – Business-Type Activities
Source: City of Denver 2012 CAFR: Statement of Activities.
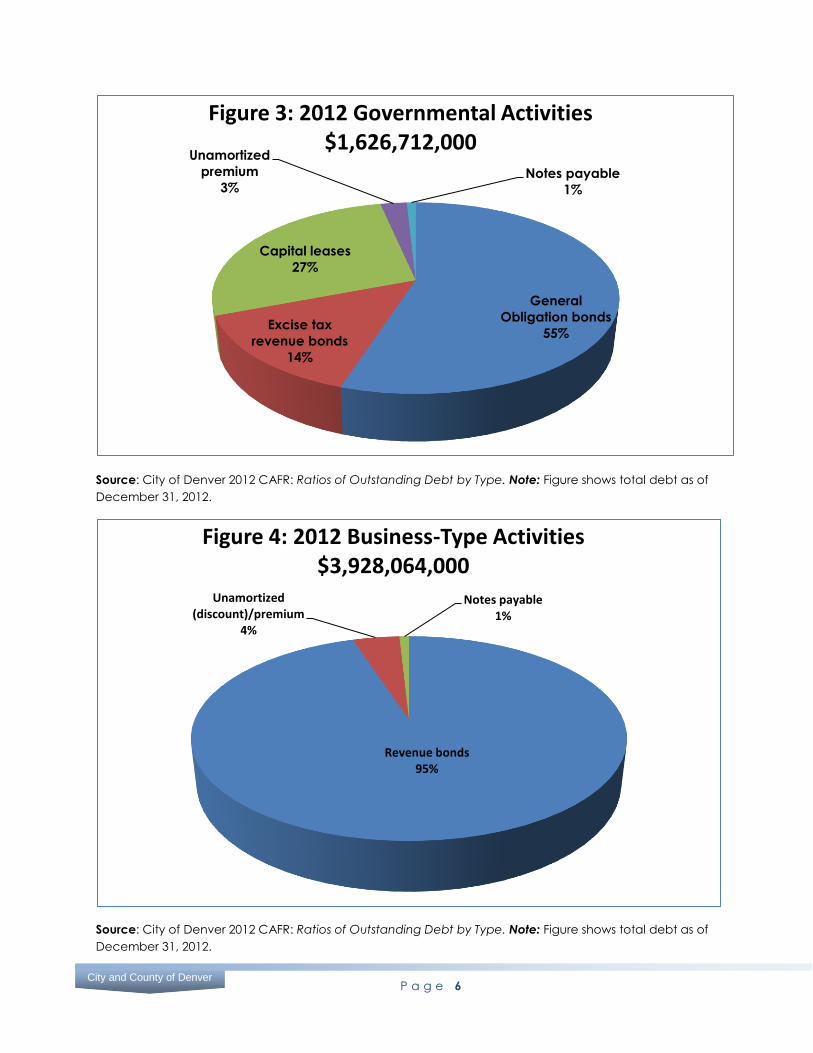
Sources of Debt
The City has various debt service funds to account for the accumulation of financial
resources and the payment of general long-term debt principal, interest, and related
costs. These financial resources are restricted, committed, or assigned to specific
expenditure sources for principle and interest payments. The total debt for both
governmental activities ($1,626,712,000) and business-type activities ($3,928,064,000) in
2012 was $5,554,776,000.
City Debt Funds—Debt issued by the City may be used to fund long-term investments
that help finance initiatives approved by the voters of Denver, purchase equipment, or
secure capital leases. The majority of debt held by the City is in General Obligation
Bonds, a type of debt that is issued directly by the City—with voter approval—and is paid
down with monies raised from taxes or other approved revenue sources. The City’s
General Obligation debt received a “Triple-A” rating from the three major rating
agencies.5 Other debt mechanisms include capital leases, revenue bonds, and lease
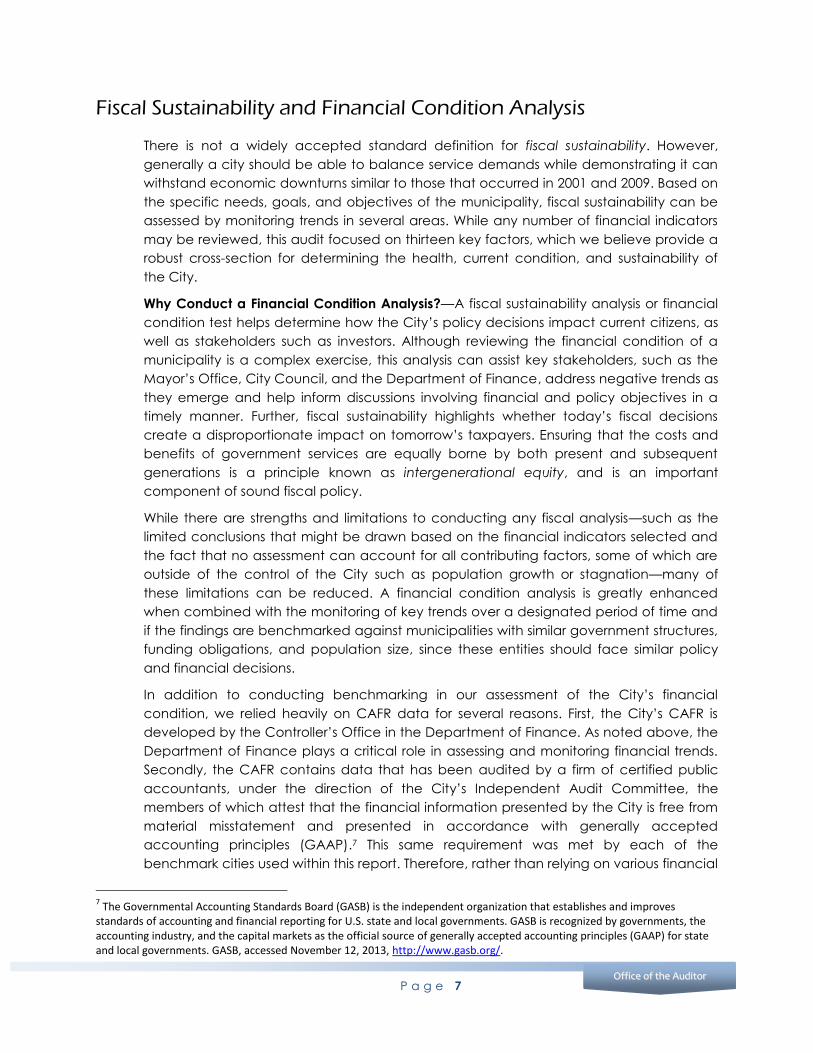
purchase agreements.6 Figure 3 and Figure 4 show the breakdown of the debt held by
the City as of fiscal year end 2012.
5 Fitch, Moody’s, and Standard and Poor’s.
6 Certificates of Participation (COPs) are a type of lease purchase agreement, typically used for a higher dollar amount. We will
discuss COPs in the subsequent fiscal sustainability audit report.
P a g e 6
City and County of Denver
Source: City of Denver 2012 CAFR: Ratios of Outstanding Debt by Type. Note: Figure shows total debt as of
December 31, 2012.
Source: City of Denver 2012 CAFR: Ratios of Outstanding Debt by Type. Note: Figure shows total debt as of
December 31, 2012.
General
Obligation bonds
55% Excise tax
revenue bonds
14%
Capital leases
27%
Unamortized
premium
3% Notes payable
1%
Figure 3: 2012 Governmental Activities $1,626,712,000
Revenue bonds 95%
Unamortized (discount)/premium
4%
Notes payable 1%
Figure 4: 2012 Business-Type Activities $3,928,064,000
P a g e 7
Office of the Auditor OOffffiiccee ooff tthhee AAuuddiittoorr
Fiscal Sustainability and Financial Condition Analysis
There is not a widely accepted standard definition for fiscal sustainability. However,
generally a city should be able to balance service demands while demonstrating it can
withstand economic downturns similar to those that occurred in 2001 and 2009. Based on
the specific needs, goals, and objectives of the municipality, fiscal sustainability can be
assessed by monitoring trends in several areas. While any number of financial indicators
may be reviewed, this audit focused on thirteen key factors, which we believe provide a
robust cross-section for determining the health, current condition, and sustainability of
the City.
Why Conduct a Financial Condition Analysis?—A fiscal sustainability analysis or financial
condition test helps determine how the City’s policy decisions impact current citizens, as
well as stakeholders such as investors. Although reviewing the financial condition of a
municipality is a complex exercise, this analysis can assist key stakeholders, such as the
Mayor’s Office, City Council, and the Department of Finance, address negative trends as
they emerge and help inform discussions involving financial and policy objectives in a
timely manner. Further, fiscal sustainability highlights whether today’s fiscal decisions
create a disproportionate impact on tomorrow’s taxpayers. Ensuring that the costs and
benefits of government services are equally borne by both present and subsequent
generations is a principle known as intergenerational equity, and is an important
component of sound fiscal policy.
While there are strengths and limitations to conducting any fiscal analysis—such as the
limited conclusions that might be drawn based on the financial indicators selected and
the fact that no assessment can account for all contributing factors, some of which are
outside of the control of the City such as population growth or stagnation—many of
these limitations can be reduced. A financial condition analysis is greatly enhanced
when combined with the monitoring of key trends over a designated period of time and
if the findings are benchmarked against municipalities with similar government structures,
funding obligations, and population size, since these entities should face similar policy
and financial decisions.
In addition to conducting benchmarking in our assessment of the City’s financial
condition, we relied heavily on CAFR data for several reasons. First, the City’s CAFR is
developed by the Controller’s Office in the Department of Finance. As noted above, the
Department of Finance plays a critical role in assessing and monitoring financial trends.
Secondly, the CAFR contains data that has been audited by a firm of certified public
accountants, under the direction of the City’s Independent Audit Committee, the
members of which attest that the financial information presented by the City is free from
material misstatement and presented in accordance with generally accepted
accounting principles (GAAP).7 This same requirement was met by each of the
benchmark cities used within this report. Therefore, rather than relying on various financial
7 The Governmental Accounting Standards Board (GASB) is the independent organization that establishes and improves
standards of accounting and financial reporting for U.S. state and local governments. GASB is recognized by governments, the accounting industry, and the capital markets as the official source of generally accepted accounting principles (GAAP) for state and local governments. GASB, accessed November 12, 2013, http://www.gasb.org/.
P a g e 8
City and County of Denver
sources, the controls surrounding the CAFR ensure that the conclusions contained within
this report are derived from audited, complete, and reliable financial data.
Transparency
Transparency is one of the cornerstones of democracy. Through greater insight into the
activities of government, citizens are better able to hold their elected officials and the
civil servants accountable for their actions. The City provides a significant amount of
financial information to citizens and other stakeholders to enhance transparency and
accountability, including the City’s Proposed and Adopted Budgets, the Comprehensive
Annual Financial Report, the Disclosure Statement to City investors, the Popular Annual
Financial Report and Citizens’ Budget, which are both intended for non-financial experts.
The City’s Transparent Denver website enhanced the City’s transparency efforts when it
came online in July 2013. The website seeks to aid citizens and other stakeholders in
understanding the City’s financial condition even better, by providing more detail on
revenues and expenditures down to the level of individual payments. Transparent Denver
further enhances the City’s efforts at a time when the City has been recognized as an
“advancing city” in the area of transparency.8
8 United States Federation of State Public Interest Research Groups. “Transparency in City Spending. Rating the Availability of
Online Government Data in America’s Largest Cities”: January 23, 2013, http://www.uspirg.org/reports/usp/tranparency-city-spending.
P a g e 9
Office of the Auditor OOffffiiccee ooff tthhee AAuuddiittoorr
SCOPE
The audit reviewed data from the City’s CAFR for the years 2002 through 2012, and also
used CAFR data from six benchmark cities—Charlotte, North Carolina; Columbus, Ohio;
Nashville, Tennessee; Portland, Oregon; San Francisco, California; and Seattle,
Washington—for the same eleven-year period. Further, audit findings reflect
transparency practices that were current as of October 23, 2013.
This report is the result of a performance audit, and was not performed as part of the
City's annual financial audit on the City's financial statements.
OBJECTIVE
The audit included four objectives, two of which will be discussed in this report and two of
which will be reported on in early 2014. This report contains the results of audit objectives
that: assessed the City’s current financial condition; and the degree to which financial
information is publicly reported in comparison to leading practice. The financial
condition analysis was not intended and should not be used as a predictive
(prospective) analysis, but rather as a broad analytical and diagnostic tool.
In addition to this report, our objective of assessing the City’s debt management
processes and ascertaining the status of recommendations made in December 2011 by
the City’s Structural Financial Task Force will be reported on in early 2014.9
METHODOLOGY
This report utilizes various standard information-gathering techniques, as well as a
comprehensive approach to assess the City’s financial condition.
Standard Techniques for Gathering Information—In keeping with our standard information
gathering approach, the audit team interviewed various officials and employees within
the Department of Finance and reviewed numerous City finance documents to develop
information for this report. Among the documents we reviewed were the City’s 2012 and
2013 budgets, the City’s CAFRs from 2002 through 2012, the management letter issued by
the City’s external auditor in May 2013, City fiscal accountability rules, the City’s debt
policy, and City Disclosure Statements. In addition to internal documents we also
reviewed numerous external documents, including fiscal sustainability or financial
condition audits from Portland, Oregon, and Lawrence, Kansas, and the financial trend
9 In 2011, Mayor Vidal appointed a Structural Financial Task Force, comprising twenty-one community, business, and civic
leaders, to address Denver’s structural budget gap. The Task Force spent approximately one year analyzing the City’s finances and in January 2012 issued nearly thirty recommendations to eliminate the ongoing budget gap.
P a g e 10
City and County of Denver
monitoring report from Golden, Colorado. We also reviewed multiple methodologies for
evaluating municipal financial condition, including approaches presented by the
International City/County Management Association (ICMA) and by an article entitled “A
Manageable System of Economic Condition Analysis for Governments.”10, 11 Finally, we
conducted an interview with Dean Mead, who developed the financial condition
assessment methodology we used (the 10-Point Test), to clarify questions regarding
usage and interpretation.12
To better understand leading practice in municipal financial transparency, we reviewed
documents from the Securities and Exchange Commission, the National Association of
State Controllers, Auditors, and Treasurers, and the United States Federation of State
Public Interest Research Groups. Further, we reviewed and analyzed the financial
reporting contained on the City’s new Transparent Denver website.
Financial Condition Assessment—To create a picture of Denver’s financial condition, we
utilized a test of ten financial indicators—the 10-Point Test—developed by Dean Mead of
GASB and outlined in Chapter 15 of the textbook entitled Public Financial
Management.13 We augmented the 10-Point Test by assessing three indicators from
ICMA’s Financial Trend Monitoring System.
For the 10-Point Test we identified six benchmark cities—Charlotte, North Carolina;
Columbus, Ohio; Nashville, Tennessee; Portland, Oregon; San Francisco, California; and
Seattle, Washington—based on their size, geographic location, type of government, and
the presence of a large enterprise fund similar to that which funds DIA.14 Each city's
CAFRs from 2002 through 2012 were obtained and specific financial condition data
collected, analyzed, and scored in comparison to other cities. We used the scoring
methodology outlined in Chapter 15 of Public Financial Management to provide an
overall assessment of the financial condition indicators of Denver and the benchmark
cities. Quartile ranges were statistically calculated for each indicator using MS Excel. The
points awarded for each of the ten ratios were then totaled and compared among the
cities. We did not develop a 10-Point Test style score for the ICMA indicators. Therefore
the results of our analysis of the ICMA indictors are presented separately in Finding 1.
10
Dean Mead. (2006). “A Manageable System of Economic Condition Analysis for Governments” in Howard Frank, ed., Public Financial Management, 383-419, Boca Raton, FL: CRC Press. 11
ICMA. (2003). Evaluating Financial Condition: A Handbook for Local Governments, 4th
ed. Washington, DC: ICMA. 12
Dean Mead is Research Manager at the GASB, overseeing the GASB’s research agenda, managing external research, interfacing with the academic community, and coordinating constituent outreach. Mead is the author of the GASB’s User Guide Series. He has published articles in journals such as Public Budgeting & Finance, Journal of Policy Analysis and Management, State and Local Government Review, Journal of Public Health Management and Practice, and Journal of Government Financial Management. He has recently contributed chapters to The Handbook of Municipal Bonds, Handbook of Local Government Fiscal Health, Management Policies in Local Government Finance, and Public Financial Management. “GASB Update: Government and Nonprofit Section American Accounting Association March 8, 2013”, accessed November 12, 2013, http://www.gasb.org/jsp/GASB/Document_C/GASBDocumentPage&cid=1176162204587. 13
Mead refined and extended the original 10-Point Test developed by Ken Brown. We used the Mead version of the test for our analysis. For more information about the Brown version see: Ken Brown. (December 1993). The 10-Point Test of Financial Condition: Toward an Easy-to-Use Assessment Tool for Smaller Cities, Government Finance Review, 21-26. (http://gfoa.org/services/dfl/bulletin/BUDGET-10-point-test.pdf) 14
Nashville, Tennessee, and San Francisco, California, are unified city-county governments, and Charlotte, North Carolina has a governmental structure that overlaps to some degree with Mecklenberg County.
P a g e 11
Office of the Auditor OOffffiiccee ooff tthhee AAuuddiittoorr
Some Limitations to Determining Comparable Data—The thirteen financial condition
indicators we assessed used reliable data from cities’ audited financial statements
(CAFRs); however, although the CAFR document is generally presented in the same way
across different cities, in a few cases we found that not all CAFR data is presented the
same for each city in each year. There were three key limitations. First, some cities
presented data differently over time due to differences in when GASB statement
changes were implemented.15 Second, deferred revenues per the Statement of Net
Assets (or Net Position) used to calculate solvency was presented as deferred revenues in
early years, unearned revenues in later years, or even deferred credits (with explanation
in notes that deferred credits included deferred revenues). Third, we noted differences
when comparing Denver to other cities in our assessment of post employment benefits
(PEB) liability and unfunded pension liability as a percentage of pension plan assets. Both
of these calculations divided the total unfunded liability into the actuarial value of assets
of the plans. However, most cities did not begin reporting PEB data in their CAFRs until
2008.
While these differences impacted our ability to ensure that we were comparing like data,
we have made efforts to validate our comparison efforts through discussions with subject
matter experts. Further, the areas in which data were presented differently among cities
made up a small percentage of the overall data set and we believe that the potential
impact of an unreliable comparison is insignificant.
15
GASB statements set the generally accepted accounting principles (GAAP) for state and local governments.
P a g e 12
City and County of Denver
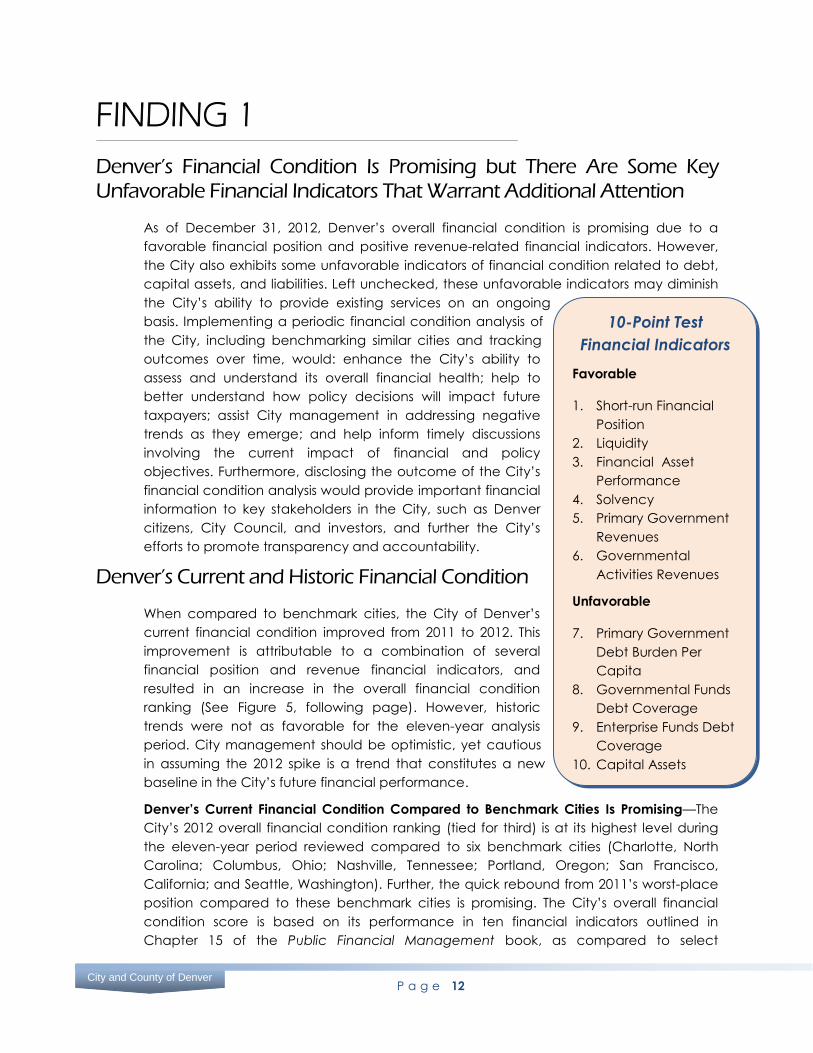
10-Point Test
Financial Indicators
Favorable
1. Short-run Financial
Position
2. Liquidity
3. Financial Asset
Performance
4. Solvency
5. Primary Government
Revenues
6. Governmental
Activities Revenues
Unfavorable
7. Primary Government
Debt Burden Per
Capita
8. Governmental Funds
Debt Coverage
9. Enterprise Funds Debt
Coverage
10. Capital Assets
FINDING 1
Denver’s Financial Condition Is Promising but There Are Some Key Unfavorable Financial Indicators That Warrant Additional Attention
As of December 31, 2012, Denver’s overall financial condition is promising due to a
favorable financial position and positive revenue-related financial indicators. However,
the City also exhibits some unfavorable indicators of financial condition related to debt,
capital assets, and liabilities. Left unchecked, these unfavorable indicators may diminish
the City’s ability to provide existing services on an ongoing
basis. Implementing a periodic financial condition analysis of
the City, including benchmarking similar cities and tracking
outcomes over time, would: enhance the City’s ability to
assess and understand its overall financial health; help to
better understand how policy decisions will impact future
taxpayers; assist City management in addressing negative
trends as they emerge; and help inform timely discussions
involving the current impact of financial and policy
objectives. Furthermore, disclosing the outcome of the City’s
financial condition analysis would provide important financial
information to key stakeholders in the City, such as Denver
citizens, City Council, and investors, and further the City’s
efforts to promote transparency and accountability.
Denver’s Current and Historic Financial Condition
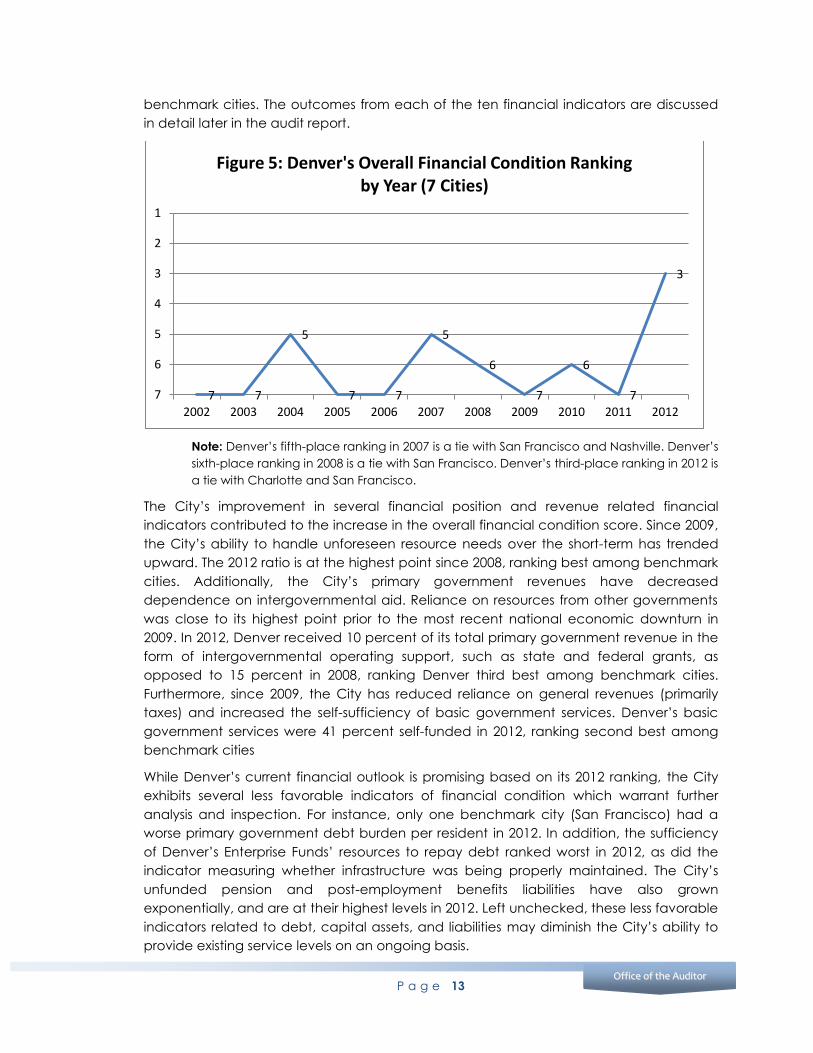
When compared to benchmark cities, the City of Denver’s
current financial condition improved from 2011 to 2012. This
improvement is attributable to a combination of several
financial position and revenue financial indicators, and
resulted in an increase in the overall financial condition
ranking (See Figure 5, following page). However, historic
trends were not as favorable for the eleven-year analysis
period. City management should be optimistic, yet cautious
in assuming the 2012 spike is a trend that constitutes a new
baseline in the City’s future financial performance.
Denver’s Current Financial Condition Compared to Benchmark Cities Is Promising—The
City’s 2012 overall financial condition ranking (tied for third) is at its highest level during
the eleven-year period reviewed compared to six benchmark cities (Charlotte, North
Carolina; Columbus, Ohio; Nashville, Tennessee; Portland, Oregon; San Francisco,
California; and Seattle, Washington). Further, the quick rebound from 2011’s worst-place
position compared to these benchmark cities is promising. The City’s overall financial
condition score is based on its performance in ten financial indicators outlined in
Chapter 15 of the Public Financial Management book, as compared to select
P a g e 13
Office of the Auditor OOffffiiccee ooff tthhee AAuuddiittoorr
benchmark cities. The outcomes from each of the ten financial indicators are discussed
in detail later in the audit report.
Note: Denver’s fifth-place ranking in 2007 is a tie with San Francisco and Nashville. Denver’s
sixth-place ranking in 2008 is a tie with San Francisco. Denver’s third-place ranking in 2012 is
a tie with Charlotte and San Francisco.
The City’s improvement in several financial position and revenue related financial
indicators contributed to the increase in the overall financial condition score. Since 2009,
the City’s ability to handle unforeseen resource needs over the short-term has trended
upward. The 2012 ratio is at the highest point since 2008, ranking best among benchmark
cities. Additionally, the City’s primary government revenues have decreased
dependence on intergovernmental aid. Reliance on resources from other governments
was close to its highest point prior to the most recent national economic downturn in
2009. In 2012, Denver received 10 percent of its total primary government revenue in the
form of intergovernmental operating support, such as state and federal grants, as
opposed to 15 percent in 2008, ranking Denver third best among benchmark cities.
Furthermore, since 2009, the City has reduced reliance on general revenues (primarily
taxes) and increased the self-sufficiency of basic government services. Denver’s basic
government services were 41 percent self-funded in 2012, ranking second best among
benchmark cities
While Denver’s current financial outlook is promising based on its 2012 ranking, the City
exhibits several less favorable indicators of financial condition which warrant further
analysis and inspection. For instance, only one benchmark city (San Francisco) had a
worse primary government debt burden per resident in 2012. In addition, the sufficiency
of Denver’s Enterprise Funds’ resources to repay debt ranked worst in 2012, as did the
indicator measuring whether infrastructure was being properly maintained. The City’s
unfunded pension and post-employment benefits liabilities have also grown
exponentially, and are at their highest levels in 2012. Left unchecked, these less favorable
indicators related to debt, capital assets, and liabilities may diminish the City’s ability to
provide existing service levels on an ongoing basis.
7 7
5
7 7
5
6
7
6
7
3
1
2
3
4
5
6
7
2002 2003 2004 2005 2006 2007 2008 2009 2010 2011 2012
Figure 5: Denver's Overall Financial Condition Ranking by Year (7 Cities)
P a g e 14
City and County of Denver
Denver’s Historic Financial Condition Compared to Benchmark Cities Has Been Less
Promising—Historically, the City’s financial condition as compared to six benchmark cities
has been unfavorable. Denver’s overall financial condition ranking was worst in six of the
eleven years, or 55 percent, of the analysis period: 2002, 2003, 2005, 2006, 2009, and 2011.
While several of these years represent periods of national economic downturn, this
suggests Denver did not manage the economic stress of these periods and respond as
well as the benchmark cities. In addition, there is no clear trend that can be derived from
the City’s 2002 through 2012 overall financial condition rankings, other than showing that
the City experienced wide fluctuations from year to year. Therefore, City management
should be cautious in assuming the 2012 spike is a trend that constitutes a new baseline
in the City’s future financial performance.
As explained in the audit report Methodology section, we performed a financial
condition analysis of the City and six benchmark cities. This analysis included ten financial
condition indicators (the 10-Point Test) from Chapter 15 of Public Financial Management,
written by Dean Mead of the Governmental Accounting Standards Board, and three
financial condition indicators from the International City/County Management
Association’s (ICMA) Evaluating Financial Condition handbook.16 The first ten financial
condition indicators were compared with results from the benchmark cities and
reviewed over an eleven-year period (2002 through 2012). The three additional indicators
were also reviewed over the same eleven-year period (2002 through 2012) but not
measured against benchmark cities due to the lack of comparable information for all
three indicators. For example, post-employment health benefits (PEHB) liability data was
presented by Denver for the entire eleven-year analysis period, but for only five years by
most of the benchmark cities. In addition, PEHB plan and pension plan liabilities varied
greatly based on whether most city employees participated in a city-established plan
like Denver or in a state-established plan like Columbus. Cities whose employees
participate in a state-established plan contribute to the plan but do not incur liability.
The results of the 10-Point Test and our additional analysis are documented in the
following three sections: 10-Point Test Financial Indicators with Favorable Results; 10-Point
Test Financial Indicators with Unfavorable Results; and Results of Three Additional
Financial Indicator Analyses.
16
ICMA. (2003). Evaluating Financial Condition: A Handbook for Local Governments, 4th
ed. Washington, DC: ICMA.
P a g e 15
Office of the Auditor OOffffiiccee ooff tthhee AAuuddiittoorr
HOW TO READ THE 10-POINT TEST FINANCIAL INDICATORS RESULTS
Financial ratios were calculated for Denver and each of the benchmark cities.
The average ratio of benchmark cities was then determined. The average
benchmark and Denver’s ratios are presented as graphs throughout both this
section and the next section, entitled 10-Point Test Financial Indicators with
Unfavorable Results. Denver’s ratios are presented in column form, while the
average of benchmark cities is presented in line form. All graphs are displayed
to present a higher chart position as better. Therefore, if Denver’s column is
higher than the average benchmark line, Denver’s performance was better
than the average. In order to present chart position in this manner, the y-axis of
some graphs has been inverted.
10-Point Test Financial Indicators with Favorable Results
The financial condition analysis determined the City displayed favorable results for six
indicators. These favorable indicators contributed to Denver’s 2012 increase in overall
ranking—tied for third—compared to benchmark cities. Indicators with favorable results
included:
Financial Position—Financial position is a government’s financial standing at a
given point in time. Financial position is measured by four indicators: (1) short-run
financial position, (2) liquidity, (3) financial performance, and (4) solvency.
Revenues—Revenues determine the capacity of a city to provide services.
Revenues are measured by two indicators: (5) primary government revenues and
(6) governmental activities revenues.
P a g e 16
City and County of Denver
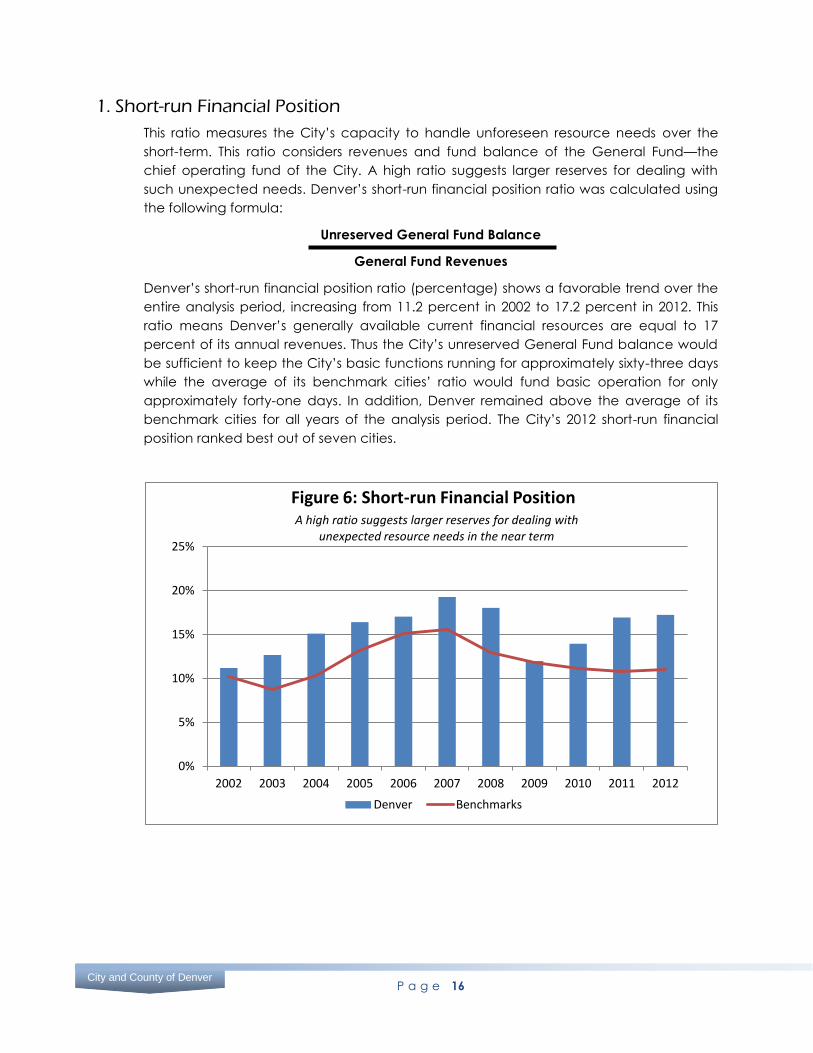
1. Short-run Financial Position
This ratio measures the City’s capacity to handle unforeseen resource needs over the
short-term. This ratio considers revenues and fund balance of the General Fund—the
chief operating fund of the City. A high ratio suggests larger reserves for dealing with
such unexpected needs. Denver’s short-run financial position ratio was calculated using
the following formula:
Unreserved General Fund Balance
General Fund Revenues
Denver’s short-run financial position ratio (percentage) shows a favorable trend over the
entire analysis period, increasing from 11.2 percent in 2002 to 17.2 percent in 2012. This
ratio means Denver’s generally available current financial resources are equal to 17
percent of its annual revenues. Thus the City’s unreserved General Fund balance would
be sufficient to keep the City’s basic functions running for approximately sixty-three days
while the average of its benchmark cities’ ratio would fund basic operation for only
approximately forty-one days. In addition, Denver remained above the average of its
benchmark cities for all years of the analysis period. The City’s 2012 short-run financial
position ranked best out of seven cities.
0%
5%
10%
15%
20%
25%
2002 2003 2004 2005 2006 2007 2008 2009 2010 2011 2012
Figure 6: Short-run Financial Position
Denver Benchmarks
A high ratio suggests larger reserves for dealing with unexpected resource needs in the near term
P a g e 17
Office of the Auditor OOffffiiccee ooff tthhee AAuuddiittoorr
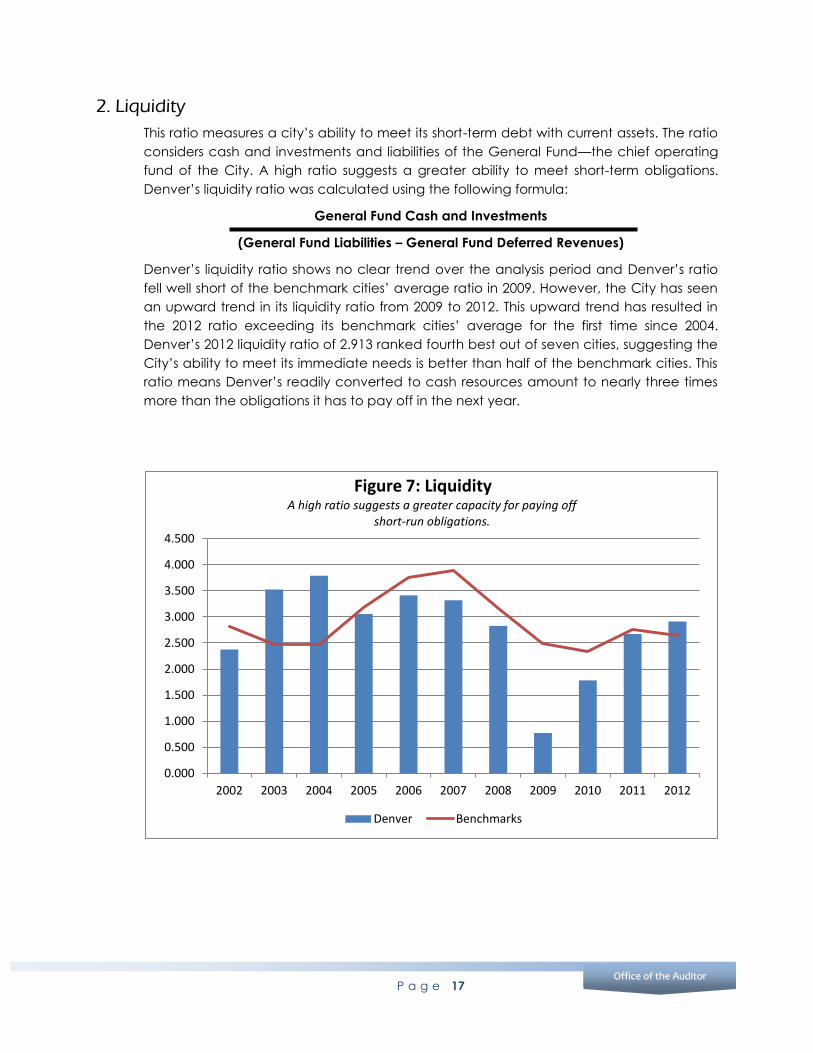
2. Liquidity
This ratio measures a city’s ability to meet its short-term debt with current assets. The ratio
considers cash and investments and liabilities of the General Fund—the chief operating
fund of the City. A high ratio suggests a greater ability to meet short-term obligations.
Denver’s liquidity ratio was calculated using the following formula:
General Fund Cash and Investments
(General Fund Liabilities – General Fund Deferred Revenues)
Denver’s liquidity ratio shows no clear trend over the analysis period and Denver’s ratio
fell well short of the benchmark cities’ average ratio in 2009. However, the City has seen
an upward trend in its liquidity ratio from 2009 to 2012. This upward trend has resulted in
the 2012 ratio exceeding its benchmark cities’ average for the first time since 2004.
Denver’s 2012 liquidity ratio of 2.913 ranked fourth best out of seven cities, suggesting the
City’s ability to meet its immediate needs is better than half of the benchmark cities. This
ratio means Denver’s readily converted to cash resources amount to nearly three times
more than the obligations it has to pay off in the next year.
0.000
0.500
1.000
1.500
2.000
2.500
3.000
3.500
4.000
4.500
2002 2003 2004 2005 2006 2007 2008 2009 2010 2011 2012
Figure 7: Liquidity
Denver Benchmarks
A high ratio suggests a greater capacity for paying off short-run obligations.
P a g e 18
City and County of Denver
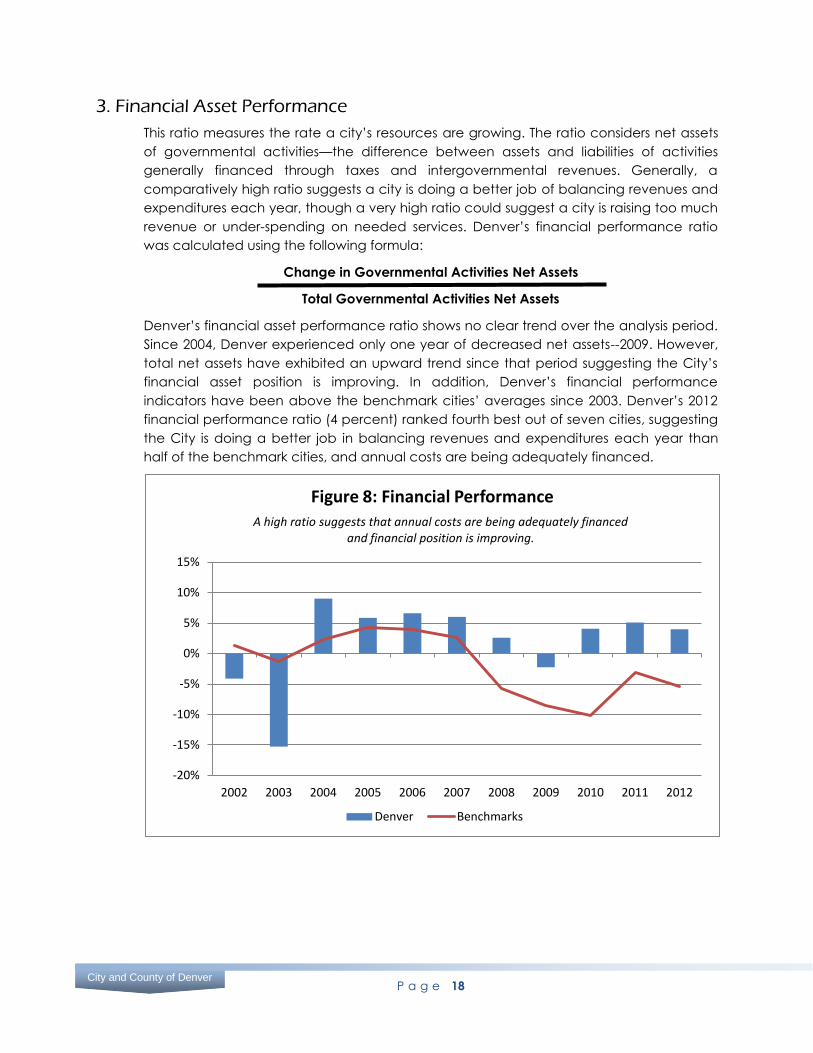
3. Financial Asset Performance
This ratio measures the rate a city’s resources are growing. The ratio considers net assets
of governmental activities—the difference between assets and liabilities of activities
generally financed through taxes and intergovernmental revenues. Generally, a
comparatively high ratio suggests a city is doing a better job of balancing revenues and
expenditures each year, though a very high ratio could suggest a city is raising too much
revenue or under-spending on needed services. Denver’s financial performance ratio
was calculated using the following formula:
Change in Governmental Activities Net Assets
Total Governmental Activities Net Assets
Denver’s financial asset performance ratio shows no clear trend over the analysis period.
Since 2004, Denver experienced only one year of decreased net assets--2009. However,
total net assets have exhibited an upward trend since that period suggesting the City’s
financial asset position is improving. In addition, Denver’s financial performance
indicators have been above the benchmark cities’ averages since 2003. Denver’s 2012
financial performance ratio (4 percent) ranked fourth best out of seven cities, suggesting
the City is doing a better job in balancing revenues and expenditures each year than
half of the benchmark cities, and annual costs are being adequately financed.
-20%
-15%
-10%
-5%
0%
5%
10%
15%
2002 2003 2004 2005 2006 2007 2008 2009 2010 2011 2012
Figure 8: Financial Performance
Denver Benchmarks
A high ratio suggests that annual costs are being adequately financed and financial position is improving.
P a g e 19
Office of the Auditor OOffffiiccee ooff tthhee AAuuddiittoorr
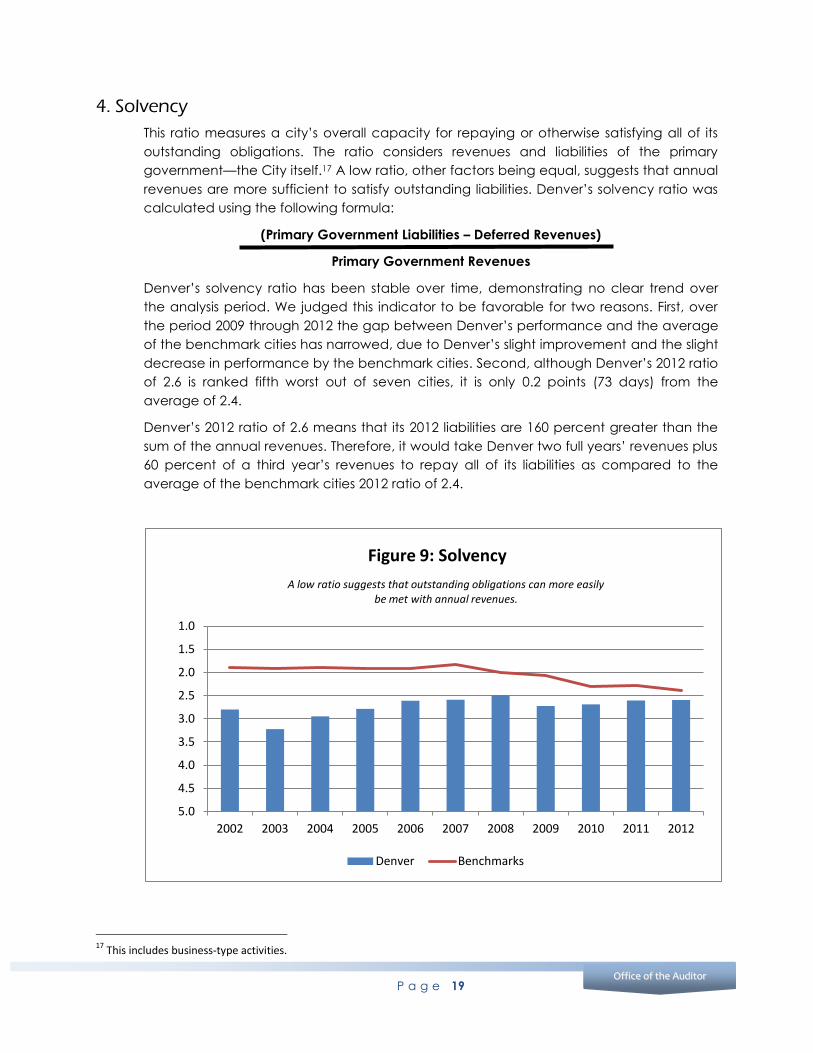
4. Solvency
This ratio measures a city’s overall capacity for repaying or otherwise satisfying all of its
outstanding obligations. The ratio considers revenues and liabilities of the primary
government—the City itself.17 A low ratio, other factors being equal, suggests that annual
revenues are more sufficient to satisfy outstanding liabilities. Denver’s solvency ratio was
calculated using the following formula:
(Primary Government Liabilities – Deferred Revenues)
Primary Government Revenues
Denver’s solvency ratio has been stable over time, demonstrating no clear trend over
the analysis period. We judged this indicator to be favorable for two reasons. First, over
the period 2009 through 2012 the gap between Denver’s performance and the average
of the benchmark cities has narrowed, due to Denver’s slight improvement and the slight
decrease in performance by the benchmark cities. Second, although Denver’s 2012 ratio
of 2.6 is ranked fifth worst out of seven cities, it is only 0.2 points (73 days) from the
average of 2.4.
Denver’s 2012 ratio of 2.6 means that its 2012 liabilities are 160 percent greater than the
sum of the annual revenues. Therefore, it would take Denver two full years’ revenues plus
60 percent of a third year’s revenues to repay all of its liabilities as compared to the
average of the benchmark cities 2012 ratio of 2.4.
17
This includes business-type activities.
1.0
1.5
2.0
2.5
3.0
3.5
4.0
4.5
5.0
2002 2003 2004 2005 2006 2007 2008 2009 2010 2011 2012
Figure 9: Solvency
Denver Benchmarks
A low ratio suggests that outstanding obligations can more easily be met with annual revenues.
P a g e 20
City and County of Denver
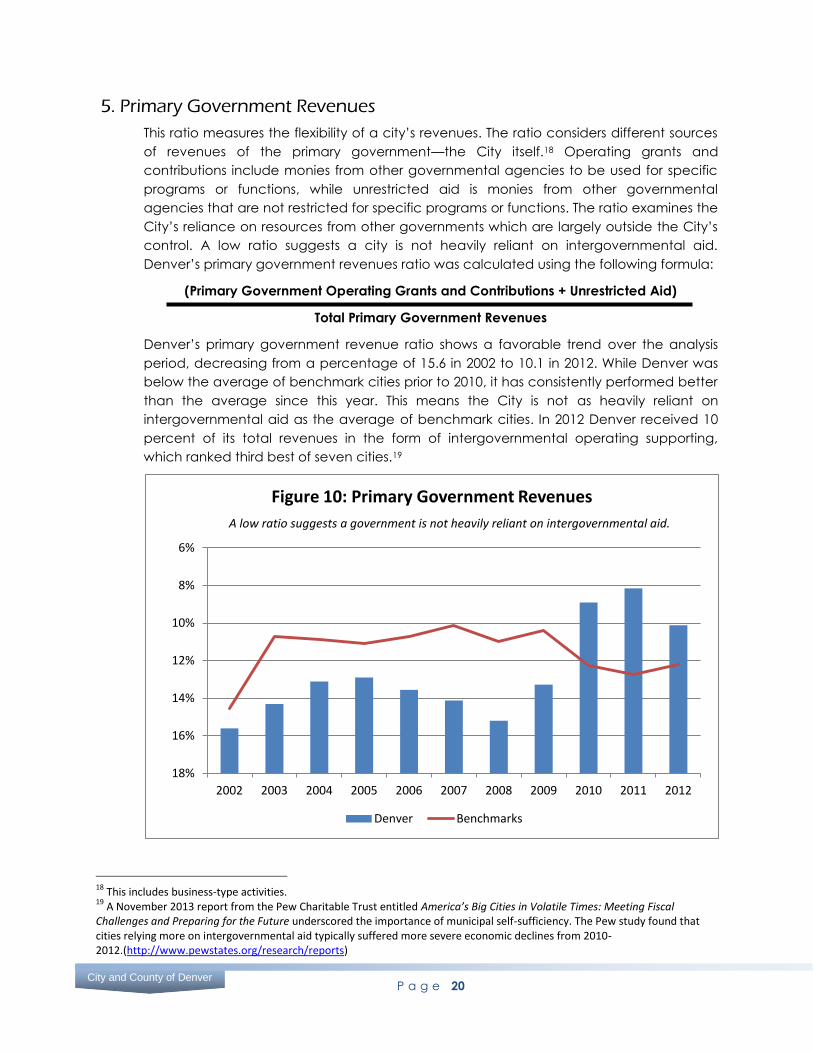
5. Primary Government Revenues
This ratio measures the flexibility of a city’s revenues. The ratio considers different sources
of revenues of the primary government—the City itself.18 Operating grants and
contributions include monies from other governmental agencies to be used for specific
programs or functions, while unrestricted aid is monies from other governmental
agencies that are not restricted for specific programs or functions. The ratio examines the
City’s reliance on resources from other governments which are largely outside the City’s
control. A low ratio suggests a city is not heavily reliant on intergovernmental aid.
Denver’s primary government revenues ratio was calculated using the following formula:
(Primary Government Operating Grants and Contributions + Unrestricted Aid)
Total Primary Government Revenues
Denver’s primary government revenue ratio shows a favorable trend over the analysis
period, decreasing from a percentage of 15.6 in 2002 to 10.1 in 2012. While Denver was
below the average of benchmark cities prior to 2010, it has consistently performed better
than the average since this year. This means the City is not as heavily reliant on
intergovernmental aid as the average of benchmark cities. In 2012 Denver received 10
percent of its total revenues in the form of intergovernmental operating supporting,
which ranked third best of seven cities.19
18
This includes business-type activities. 19
A November 2013 report from the Pew Charitable Trust entitled America’s Big Cities in Volatile Times: Meeting Fiscal Challenges and Preparing for the Future underscored the importance of municipal self-sufficiency. The Pew study found that cities relying more on intergovernmental aid typically suffered more severe economic declines from 2010-2012.(http://www.pewstates.org/research/reports)
6%
8%
10%
12%
14%
16%
18%
2002 2003 2004 2005 2006 2007 2008 2009 2010 2011 2012
Figure 10: Primary Government Revenues
Denver Benchmarks
A low ratio suggests a government is not heavily reliant on intergovernmental aid.
P a g e 21
Office of the Auditor OOffffiiccee ooff tthhee AAuuddiittoorr
6. Governmental Activities Revenues
This ratio presents information about revenue sufficiency and the use of governmental
revenues. The ratio considers expenses and program revenues for governmental
activities—those activities generally financed through taxes and intergovernmental
revenues. When governmental activities expenses exceed revenues raised by a City
from charges, fees, and grants, the result is a net expense, and additional funding must
be provided by general revenues to support the activities. Therefore, this ratio shows the
degree to which governmental activities’ functions and programs are self-financed or
the degree to which they depend on financing from governmental revenues, primarily
taxes. A low ratio suggests services are less reliant on general revenue financing and are
more self-supporting through charges for services, grants, and contributions. Denver’s
governmental activities revenues ratio was calculated using the following formula:
Net (Expense) Revenue for Governmental Activities
Total Governmental Activities Expense
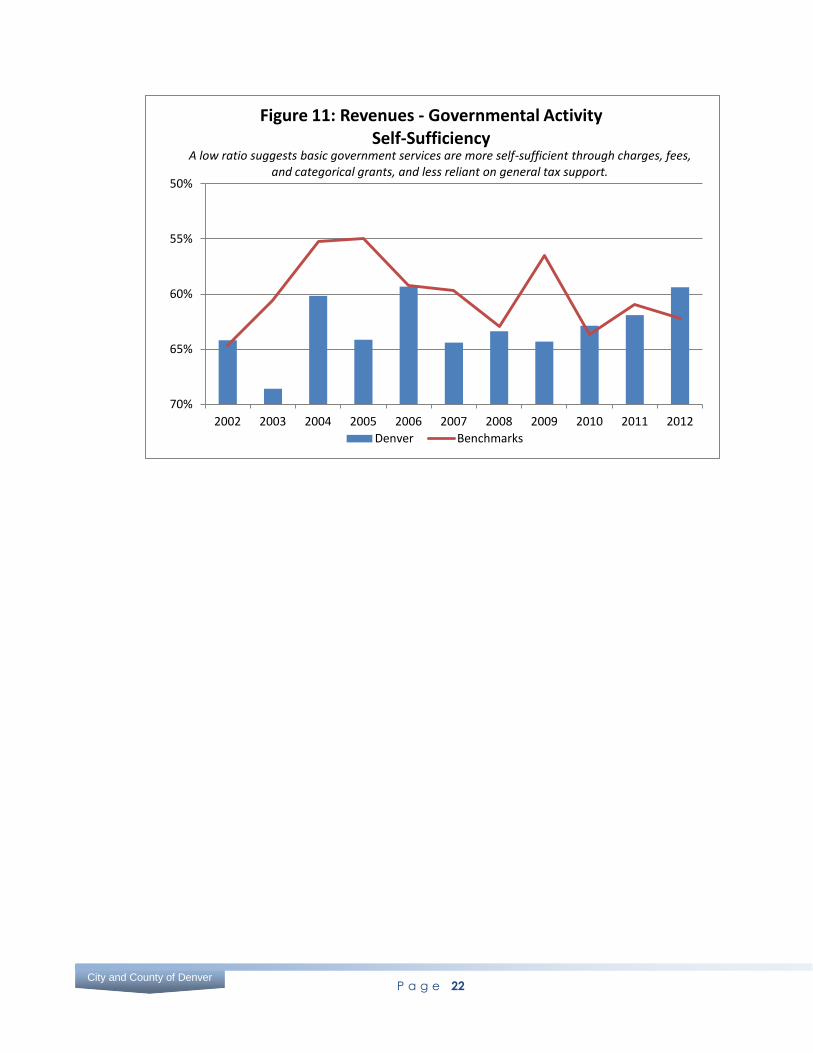
While Denver’s governmental activities revenue ratio shows no clear trend over the
analysis period, there has been an upward trend since 2009. Specifically, Denver’s
percentage of governmental activities supported by general taxes decreased from 64.3
in 2009 to 59.4 in 2012. Denver’s 2012 ratio means that 59 percent of the expenses of
Denver’s 2012 governmental activities functions and programs were financed with taxes
and other revenues while 41 percent were self-funded through charges for services,
grants, and contributions. Denver’s 2012 ratio was lower than the benchmark average,
suggesting the City’s governmental activities are more self-sufficient than the average.
Denver ranks second best of seven cities for 2012.
X -1
P a g e 22
City and County of Denver
50%
55%
60%
65%
70%
2002 2003 2004 2005 2006 2007 2008 2009 2010 2011 2012
Figure 11: Revenues - Governmental Activity Self-Sufficiency
Denver Benchmarks
A low ratio suggests basic government services are more self-sufficient through charges, fees, and categorical grants, and less reliant on general tax support.
P a g e 23
Office of the Auditor OOffffiiccee ooff tthhee AAuuddiittoorr
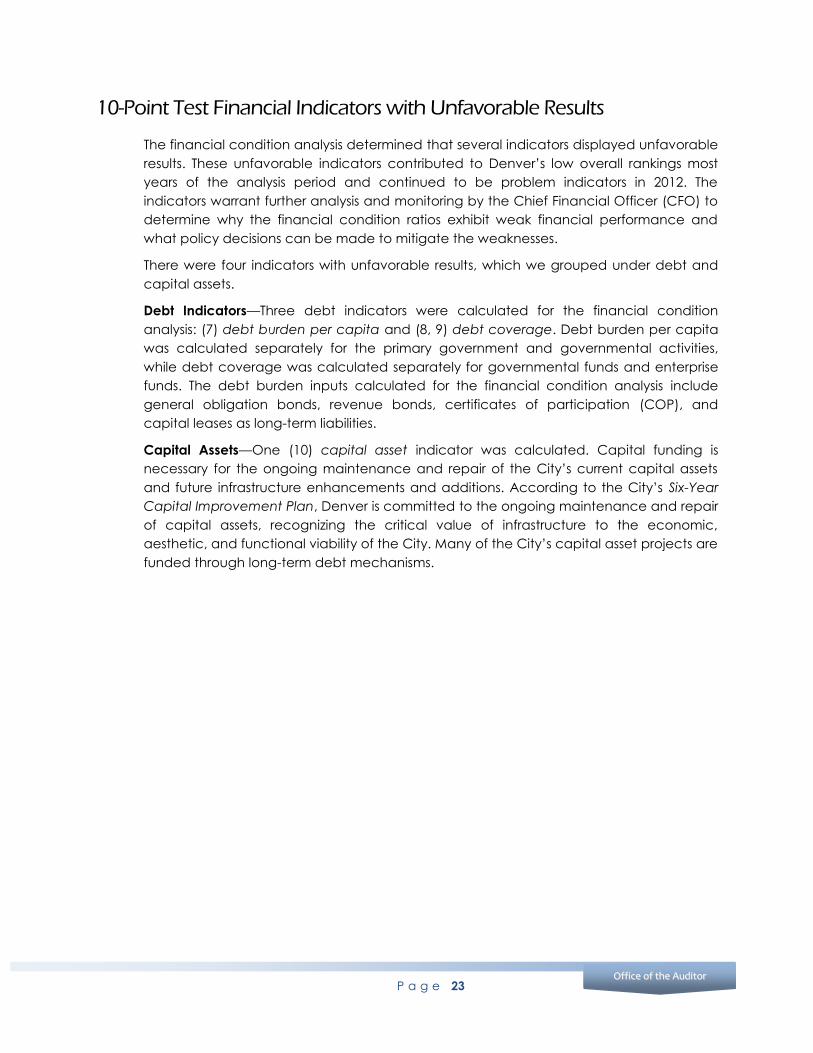
10-Point Test Financial Indicators with Unfavorable Results
The financial condition analysis determined that several indicators displayed unfavorable
results. These unfavorable indicators contributed to Denver’s low overall rankings most
years of the analysis period and continued to be problem indicators in 2012. The
indicators warrant further analysis and monitoring by the Chief Financial Officer (CFO) to
determine why the financial condition ratios exhibit weak financial performance and
what policy decisions can be made to mitigate the weaknesses.
There were four indicators with unfavorable results, which we grouped under debt and
capital assets.
Debt Indicators—Three debt indicators were calculated for the financial condition
analysis: (7) debt burden per capita and (8, 9) debt coverage. Debt burden per capita
was calculated separately for the primary government and governmental activities,
while debt coverage was calculated separately for governmental funds and enterprise
funds. The debt burden inputs calculated for the financial condition analysis include
general obligation bonds, revenue bonds, certificates of participation (COP), and
capital leases as long-term liabilities.
Capital Assets—One (10) capital asset indicator was calculated. Capital funding is
necessary for the ongoing maintenance and repair of the City’s current capital assets
and future infrastructure enhancements and additions. According to the City’s Six-Year
Capital Improvement Plan, Denver is committed to the ongoing maintenance and repair
of capital assets, recognizing the critical value of infrastructure to the economic,
aesthetic, and functional viability of the City. Many of the City’s capital asset projects are
funded through long-term debt mechanisms.
P a g e 24
City and County of Denver
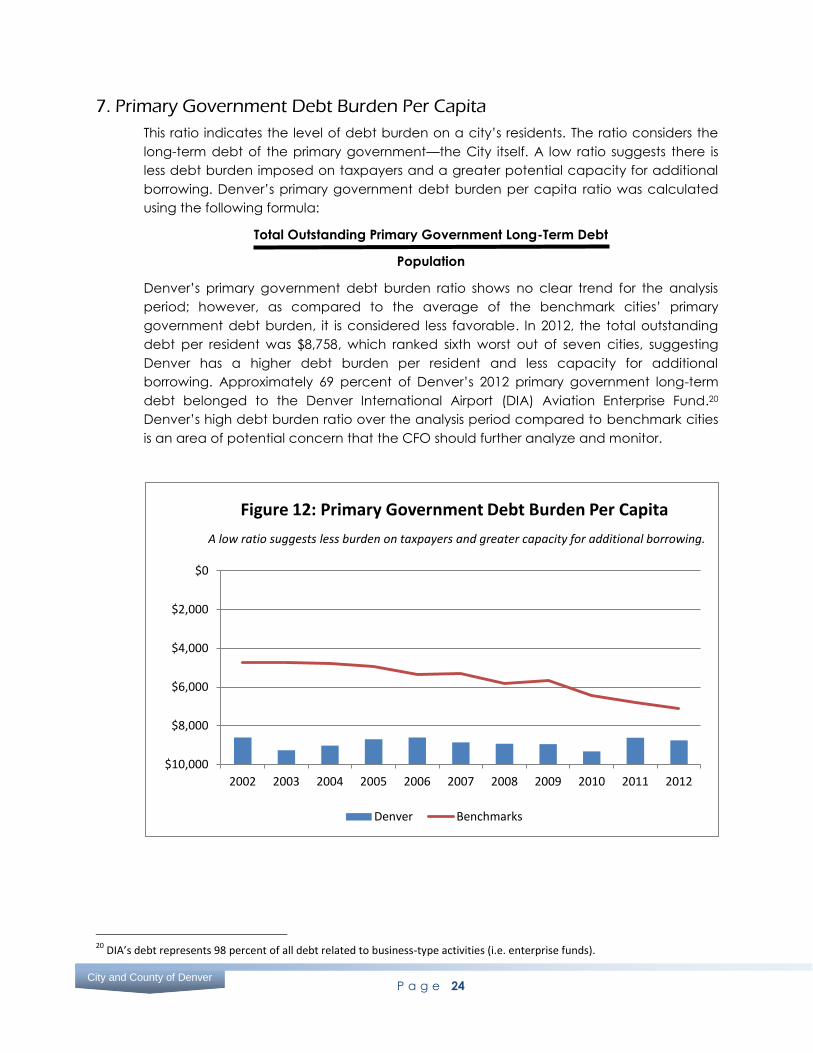
7. Primary Government Debt Burden Per Capita
This ratio indicates the level of debt burden on a city’s residents. The ratio considers the
long-term debt of the primary government—the City itself. A low ratio suggests there is
less debt burden imposed on taxpayers and a greater potential capacity for additional
borrowing. Denver’s primary government debt burden per capita ratio was calculated
using the following formula:
Total Outstanding Primary Government Long-Term Debt
Population
Denver’s primary government debt burden ratio shows no clear trend for the analysis
period; however, as compared to the average of the benchmark cities’ primary
government debt burden, it is considered less favorable. In 2012, the total outstanding
debt per resident was $8,758, which ranked sixth worst out of seven cities, suggesting
Denver has a higher debt burden per resident and less capacity for additional
borrowing. Approximately 69 percent of Denver’s 2012 primary government long-term
debt belonged to the Denver International Airport (DIA) Aviation Enterprise Fund.20
Denver’s high debt burden ratio over the analysis period compared to benchmark cities
is an area of potential concern that the CFO should further analyze and monitor.
20
DIA’s debt represents 98 percent of all debt related to business-type activities (i.e. enterprise funds).
$0
$2,000
$4,000
$6,000
$8,000
$10,000
2002 2003 2004 2005 2006 2007 2008 2009 2010 2011 2012
Figure 12: Primary Government Debt Burden Per Capita
Denver Benchmarks
A low ratio suggests less burden on taxpayers and greater capacity for additional borrowing.
P a g e 25
Office of the Auditor OOffffiiccee ooff tthhee AAuuddiittoorr
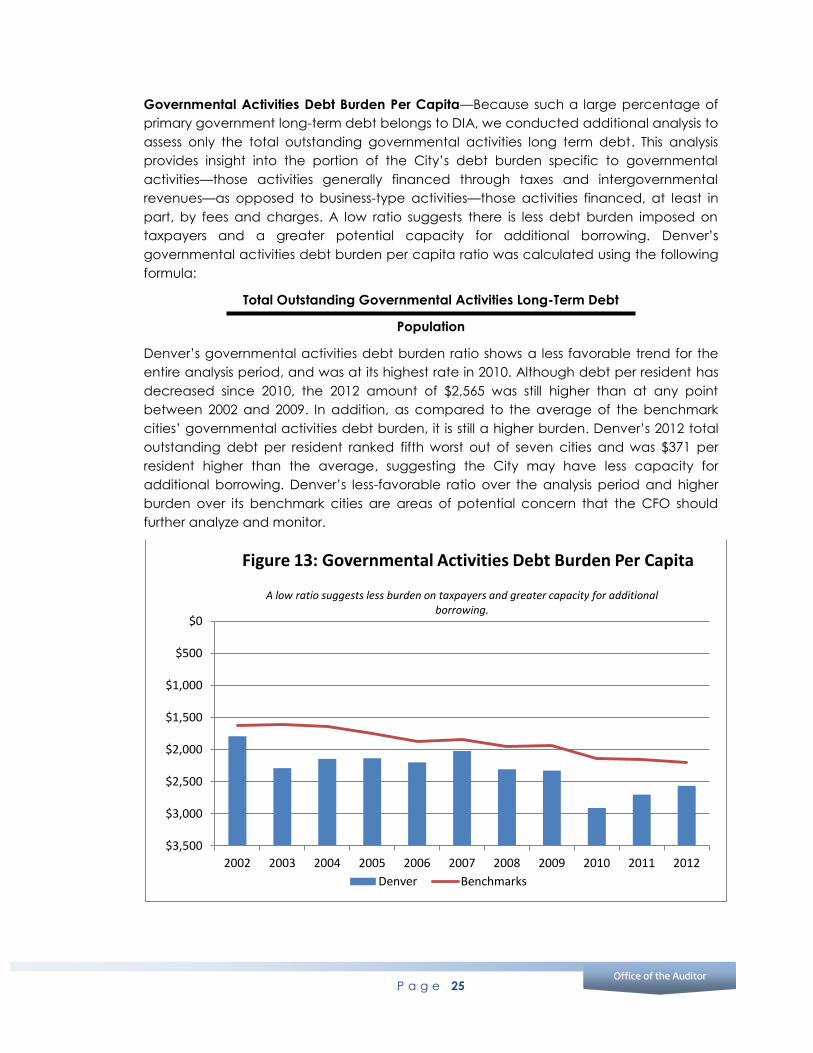
Governmental Activities Debt Burden Per Capita—Because such a large percentage of
primary government long-term debt belongs to DIA, we conducted additional analysis to
assess only the total outstanding governmental activities long term debt. This analysis
provides insight into the portion of the City’s debt burden specific to governmental
activities—those activities generally financed through taxes and intergovernmental
revenues—as opposed to business-type activities—those activities financed, at least in
part, by fees and charges. A low ratio suggests there is less debt burden imposed on
taxpayers and a greater potential capacity for additional borrowing. Denver’s
governmental activities debt burden per capita ratio was calculated using the following
formula:
Total Outstanding Governmental Activities Long-Term Debt
Population
Denver’s governmental activities debt burden ratio shows a less favorable trend for the
entire analysis period, and was at its highest rate in 2010. Although debt per resident has
decreased since 2010, the 2012 amount of $2,565 was still higher than at any point
between 2002 and 2009. In addition, as compared to the average of the benchmark
cities’ governmental activities debt burden, it is still a higher burden. Denver’s 2012 total
outstanding debt per resident ranked fifth worst out of seven cities and was $371 per
resident higher than the average, suggesting the City may have less capacity for
additional borrowing. Denver’s less-favorable ratio over the analysis period and higher
burden over its benchmark cities are areas of potential concern that the CFO should
further analyze and monitor.
$0
$500
$1,000
$1,500
$2,000
$2,500
$3,000
$3,500
2002 2003 2004 2005 2006 2007 2008 2009 2010 2011 2012
Figure 13: Governmental Activities Debt Burden Per Capita
Denver Benchmarks
A low ratio suggests less burden on taxpayers and greater capacity for additional borrowing.
P a g e 26
City and County of Denver
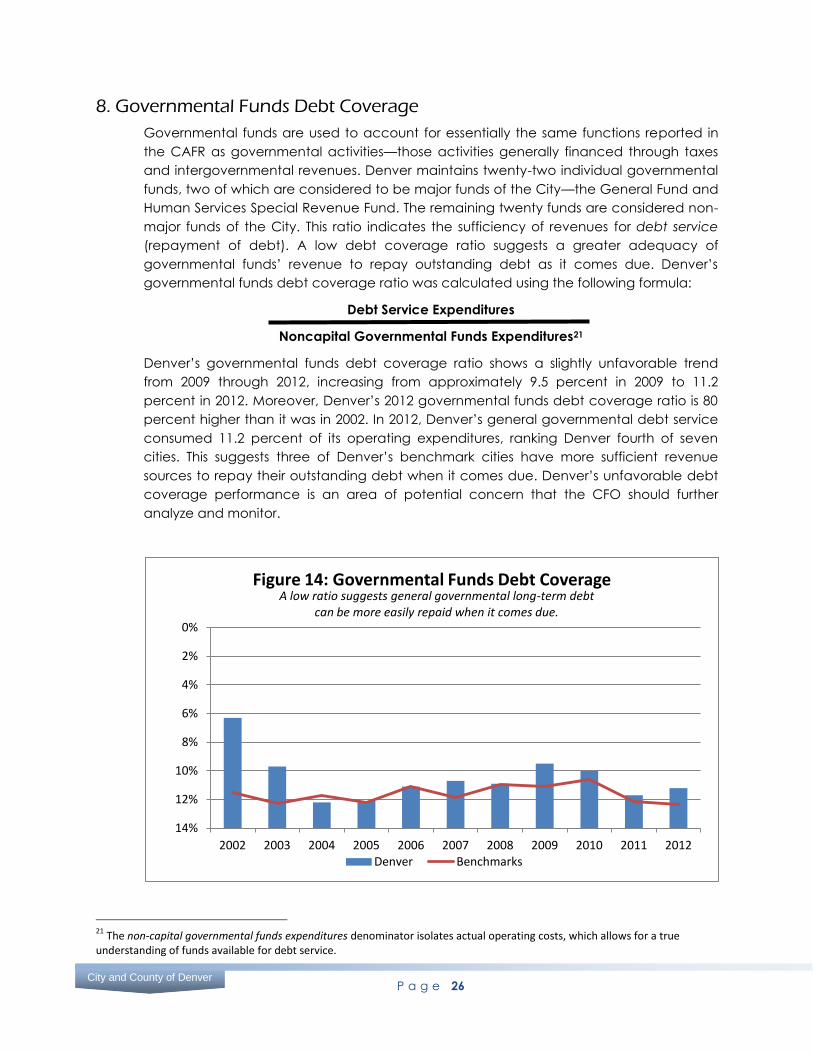
8. Governmental Funds Debt Coverage
Governmental funds are used to account for essentially the same functions reported in
the CAFR as governmental activities—those activities generally financed through taxes
and intergovernmental revenues. Denver maintains twenty-two individual governmental
funds, two of which are considered to be major funds of the City—the General Fund and
Human Services Special Revenue Fund. The remaining twenty funds are considered non-
major funds of the City. This ratio indicates the sufficiency of revenues for debt service
(repayment of debt). A low debt coverage ratio suggests a greater adequacy of
governmental funds’ revenue to repay outstanding debt as it comes due. Denver’s
governmental funds debt coverage ratio was calculated using the following formula:
Debt Service Expenditures
Noncapital Governmental Funds Expenditures21
Denver’s governmental funds debt coverage ratio shows a slightly unfavorable trend
from 2009 through 2012, increasing from approximately 9.5 percent in 2009 to 11.2
percent in 2012. Moreover, Denver’s 2012 governmental funds debt coverage ratio is 80
percent higher than it was in 2002. In 2012, Denver’s general governmental debt service
consumed 11.2 percent of its operating expenditures, ranking Denver fourth of seven
cities. This suggests three of Denver’s benchmark cities have more sufficient revenue
sources to repay their outstanding debt when it comes due. Denver’s unfavorable debt
coverage performance is an area of potential concern that the CFO should further
analyze and monitor.
21
The non-capital governmental funds expenditures denominator isolates actual operating costs, which allows for a true understanding of funds available for debt service.
0%
2%
4%
6%
8%
10%
12%
14%
2002 2003 2004 2005 2006 2007 2008 2009 2010 2011 2012
Figure 14: Governmental Funds Debt Coverage
Denver Benchmarks
A low ratio suggests general governmental long-term debt can be more easily repaid when it comes due.
P a g e 27
Office of the Auditor OOffffiiccee ooff tthhee AAuuddiittoorr
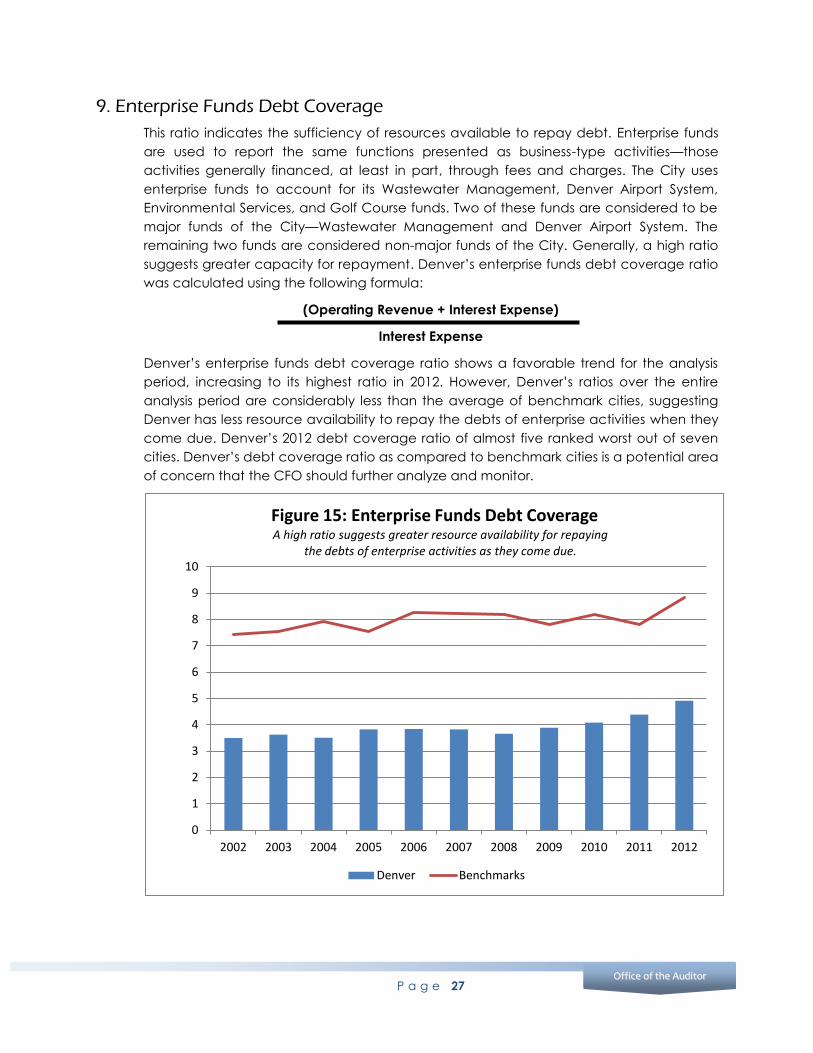
9. Enterprise Funds Debt Coverage
This ratio indicates the sufficiency of resources available to repay debt. Enterprise funds
are used to report the same functions presented as business-type activities—those
activities generally financed, at least in part, through fees and charges. The City uses
enterprise funds to account for its Wastewater Management, Denver Airport System,
Environmental Services, and Golf Course funds. Two of these funds are considered to be
major funds of the City—Wastewater Management and Denver Airport System. The
remaining two funds are considered non-major funds of the City. Generally, a high ratio
suggests greater capacity for repayment. Denver’s enterprise funds debt coverage ratio
was calculated using the following formula:
(Operating Revenue + Interest Expense)
Interest Expense
Denver’s enterprise funds debt coverage ratio shows a favorable trend for the analysis
period, increasing to its highest ratio in 2012. However, Denver’s ratios over the entire
analysis period are considerably less than the average of benchmark cities, suggesting
Denver has less resource availability to repay the debts of enterprise activities when they
come due. Denver’s 2012 debt coverage ratio of almost five ranked worst out of seven
cities. Denver’s debt coverage ratio as compared to benchmark cities is a potential area
of concern that the CFO should further analyze and monitor.
0
1
2
3
4
5
6
7
8
9
10
2002 2003 2004 2005 2006 2007 2008 2009 2010 2011 2012
Figure 15: Enterprise Funds Debt Coverage
Denver Benchmarks
A high ratio suggests greater resource availability for repaying the debts of enterprise activities as they come due.
P a g e 28
City and County of Denver
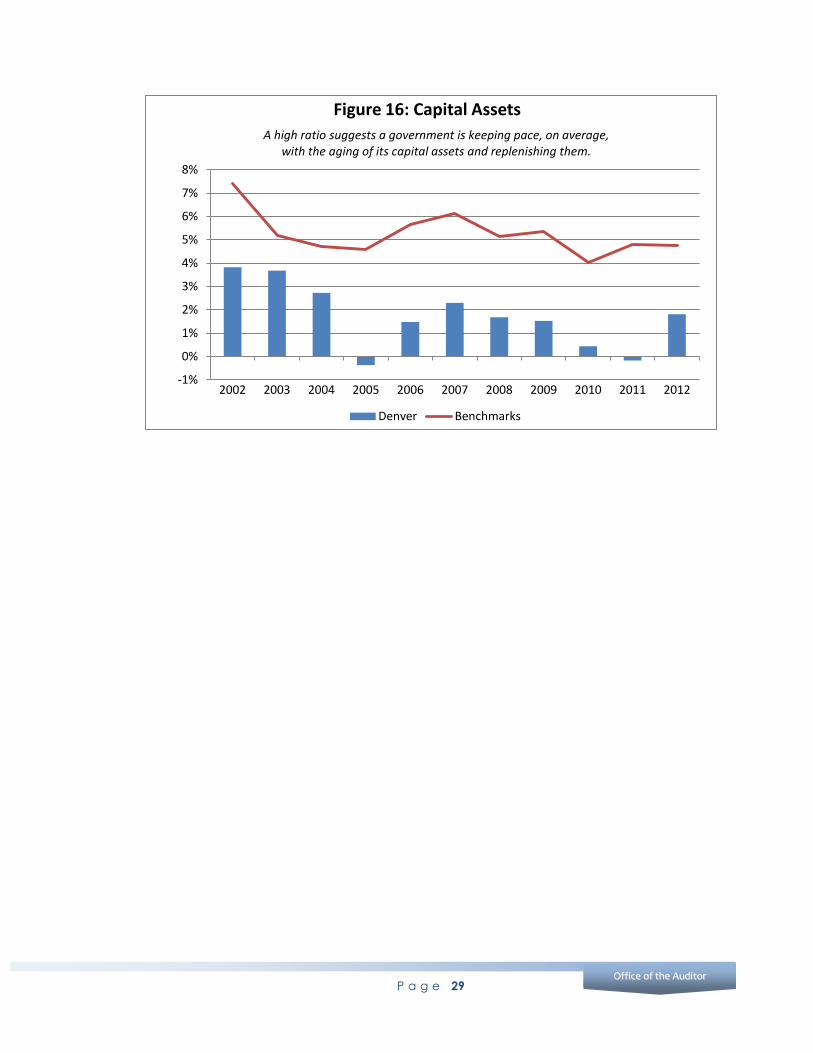
10. Capital Assets
The City’s capital assets include buildings and improvements; motor vehicles and
motorized equipment; furniture, machinery, and other equipment; collections; library
books; and infrastructure. This ratio measures whether capital assets are being properly
maintained. It is an indicator of whether a city’s investment in purchasing or constructing
new assets and refurbishing old assets is keeping pace with the rate of depreciation and
disposal of assets. A positive percentage change suggests the capital stock is being
replenished while a negative number suggests the capital stock is being depleted.
Therefore, a high ratio suggests a government is keeping pace, on average, with the
aging of its capital assets and replenishing them as necessary. Denver’s capital assets
ratio was calculated using the following formula:
(Primary Government Capital Assets Ending Net Value – Beginning Net Value)
Beginning Net Value
Denver’s capital assets ratio shows an unfavorable trend for the analysis period. In
addition, Denver’s ratios were consistently lower than the average of benchmark cities
during this time. Furthermore, in both 2005 and 2011, Denver had negative percentage
changes suggesting the City has not always kept pace with the aging of its capital assets
or replenished them as necessary. Denver’s 2012 capital assets ratio of .018 ranked worst
out of seven cities, and has continually ranked worst since 2005. While this ratio means
that the net value of the City’s capital assets increased 1.8 percent over the previous
year, the: unfavorable trend over the analysis period, lower than average ratios as
compared to benchmark cities, and the negative percentage change in 2011 are areas
of potential concern that the CFO should further analyze and monitor.
This indicator may be of particular concern given the already high debt burden imposed
on residents when considering that many of the City’s capital asset projects are funded
through long-term debt mechanisms. For example, in November 2007, Denver voters
authorized up to $550 million in “Better Denver” general obligation bonds related to 319
different capital improvement projects. In addition, the City has routinely issued COPs—
which do not require the vote of the people—to expand City buildings and property,
such as the Webb Municipal Office Building, Central Platte Campus Facility, and the
Blair-Caldwell African American Research Library, increasing the debt burden on
taxpayers.
P a g e 29
Office of the Auditor OOffffiiccee ooff tthhee AAuuddiittoorr
-1%
0%
1%
2%
3%
4%
5%
6%
7%
8%
2002 2003 2004 2005 2006 2007 2008 2009 2010 2011 2012
Figure 16: Capital Assets
Denver Benchmarks
A high ratio suggests a government is keeping pace, on average, with the aging of its capital assets and replenishing them.
P a g e 30
City and County of Denver
Results of Three Additional Financial Indicator Analyses
Based on our research into financial condition analysis and our assessment of financial
trends for local governments, we determined that it would be appropriate to review
some indicators not included in the 10-Point Test. Therefore, we augmented the 10-Point
Test by assessing three indicators from the International City/County Management
Association’s (ICMA’s) Financial Trend Monitoring System that cover expenditures,
pension benefits liabilities, and non-pension post-employment benefit liabilities. We did
not develop a score for these indicators. Therefore the results of our analysis of the ICMA
indictors are presented separately from the results of the 10-Point Test. These three
additional indicators were reviewed over an eleven-year period (2002 through 2012) but
not measured against benchmark cities, thus the results discuss Denver’s performance
only. Please note that the three indicators have six subcomponents, and the reader will
see ratios and graphs for each of these six subcomponents. Indicators assessed included:
Expenditures—Expenditures are an approximate measure of a local government’s
service output. Generally, the more a government spends in constant dollars, the more
services it is providing. However, this formula does not take into account how effective
the services are or how efficiently they are delivered. Analyzing a city’s expenditure
profile aids in identifying issues related to:
Excessive expenditure growth compared to revenue or program growth that
creates future liabilities
An undesirable increase in fixed costs
Ineffective budgetary controls
A decline in personnel productivity
Expenditures were measured using two ratios: expenditures per capita and employees
per capita. Figures 17 and 18 display Denver’s performance related to expenditures.
Unlike the other figures in the finding, these two figures do not convey that a higher chart
position is synonymous with better performance, since these analyses are based on year-
to-year trends (horizontal) rather than a pre-determined optimal direction (vertical).
Unfunded Post-Employment Benefits Liabilities and Pension Benefits Liabilities—An
unfunded liability is incurred in the current or a prior year that does not have to be paid
until a future year, and for which reserves have not been set aside. An unfunded liability
represents a legal commitment to pay at some time in the future. If such obligations are
permitted to grow over a long period of time, they can have a substantial effect on a
local government’s financial condition.
Analyzing a city’s unfunded liabilities can answer the following questions.
Is the pension liability increasing? How fast is it growing? How much is
unfunded?
Are pension contributions, pension system assets, and investment earnings
keeping pace with the growth in benefits?
Is the amount of unused vacation and sick leave per employee increasing?
P a g e 31
Office of the Auditor OOffffiiccee ooff tthhee AAuuddiittoorr
Are policies for the payment of unused vacation and sick leave realistic
compared to the City’s ability to pay?
Are the costs of future health insurance premiums for retirees a significant
future obligation for the City?
We measured two types of unfunded liabilities financial indicators: post-employment
benefits liability and pension liability. Post-employment benefits liabilities were measured
using three ratios: compensated absences liability, post-employment health benefits
liability, and total post-employment benefits liability. Pension liabilities were measured
using one ratio: actuarial value of assets as a percentage of actuarial accrued liability.
These four ratios are illustrated in Figures 19 through 22, which are oriented to show higher
chart position as synonymous with better performance.
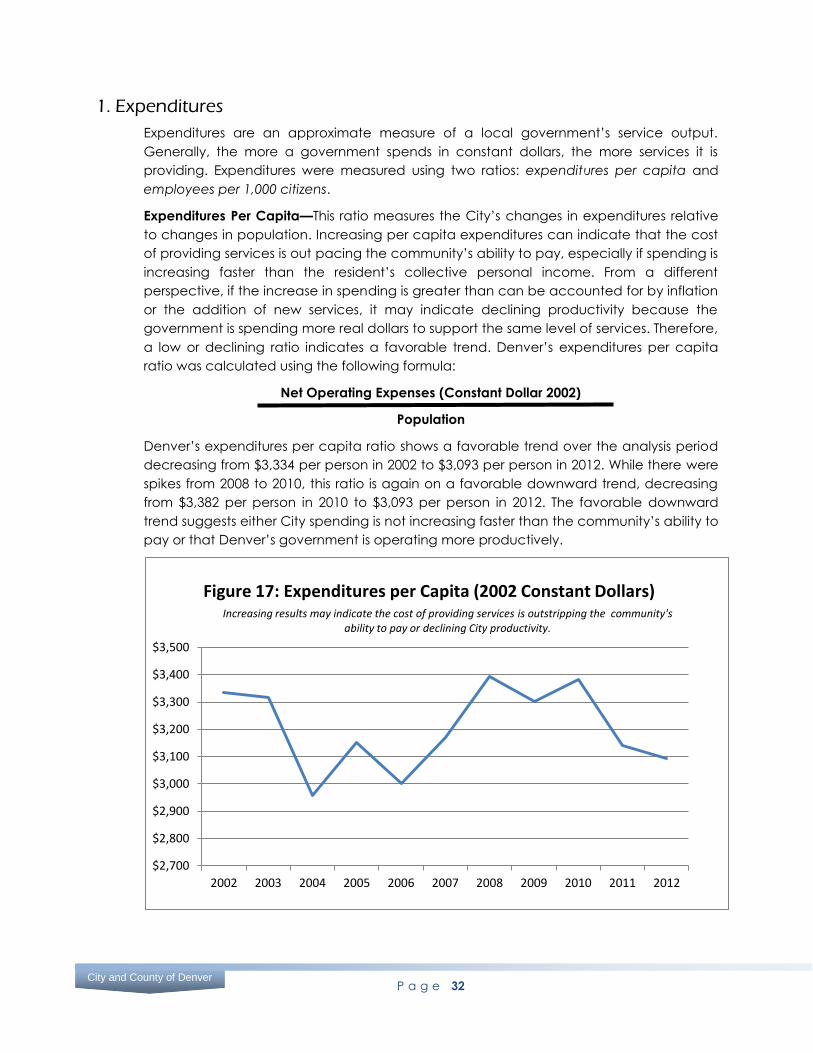
P a g e 32
City and County of Denver
1. Expenditures
Expenditures are an approximate measure of a local government’s service output.
Generally, the more a government spends in constant dollars, the more services it is
providing. Expenditures were measured using two ratios: expenditures per capita and
employees per 1,000 citizens.
Expenditures Per Capita—This ratio measures the City’s changes in expenditures relative
to changes in population. Increasing per capita expenditures can indicate that the cost
of providing services is out pacing the community’s ability to pay, especially if spending is
increasing faster than the resident’s collective personal income. From a different
perspective, if the increase in spending is greater than can be accounted for by inflation
or the addition of new services, it may indicate declining productivity because the
government is spending more real dollars to support the same level of services. Therefore,
a low or declining ratio indicates a favorable trend. Denver’s expenditures per capita
ratio was calculated using the following formula:
Net Operating Expenses (Constant Dollar 2002)
Population
Denver’s expenditures per capita ratio shows a favorable trend over the analysis period
decreasing from $3,334 per person in 2002 to $3,093 per person in 2012. While there were
spikes from 2008 to 2010, this ratio is again on a favorable downward trend, decreasing
from $3,382 per person in 2010 to $3,093 per person in 2012. The favorable downward
trend suggests either City spending is not increasing faster than the community’s ability to
pay or that Denver’s government is operating more productively.
$2,700
$2,800
$2,900
$3,000
$3,100
$3,200
$3,300
$3,400
$3,500
2002 2003 2004 2005 2006 2007 2008 2009 2010 2011 2012
Figure 17: Expenditures per Capita (2002 Constant Dollars) Increasing results may indicate the cost of providing services is outstripping the community's
ability to pay or declining City productivity.
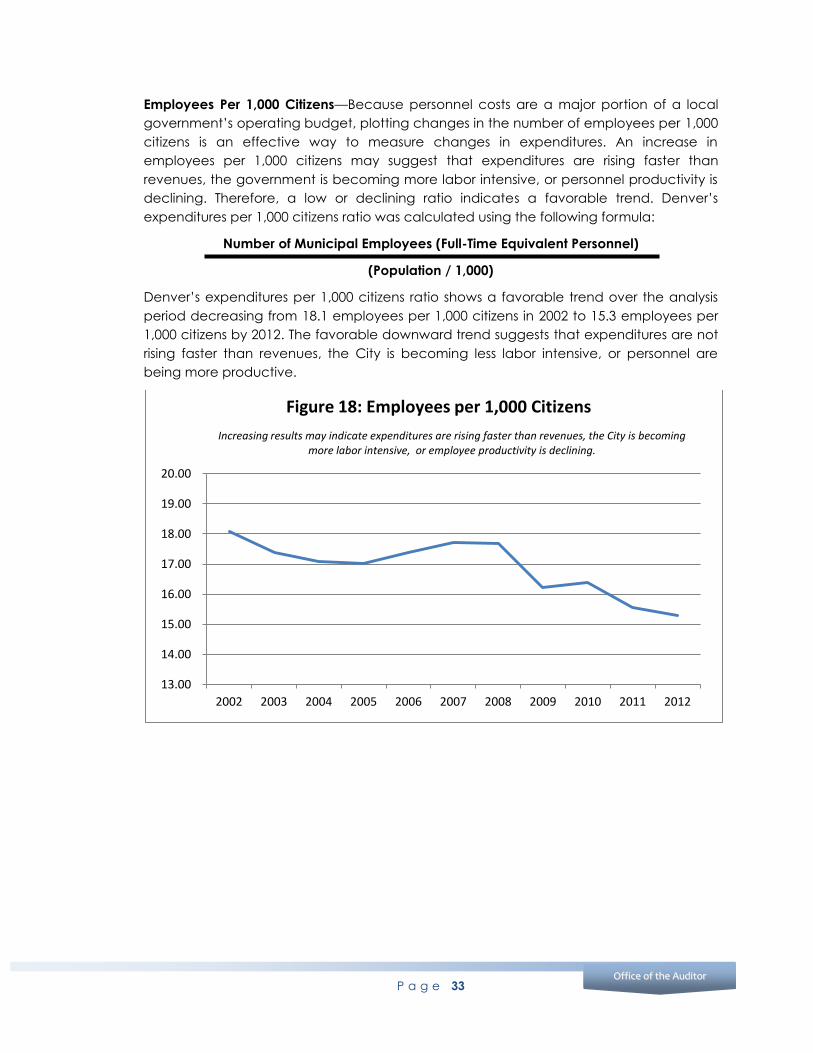
P a g e 33
Office of the Auditor OOffffiiccee ooff tthhee AAuuddiittoorr
Employees Per 1,000 Citizens—Because personnel costs are a major portion of a local
government’s operating budget, plotting changes in the number of employees per 1,000
citizens is an effective way to measure changes in expenditures. An increase in
employees per 1,000 citizens may suggest that expenditures are rising faster than
revenues, the government is becoming more labor intensive, or personnel productivity is
declining. Therefore, a low or declining ratio indicates a favorable trend. Denver’s
expenditures per 1,000 citizens ratio was calculated using the following formula:
Number of Municipal Employees (Full-Time Equivalent Personnel)
(Population / 1,000)
Denver’s expenditures per 1,000 citizens ratio shows a favorable trend over the analysis
period decreasing from 18.1 employees per 1,000 citizens in 2002 to 15.3 employees per
1,000 citizens by 2012. The favorable downward trend suggests that expenditures are not
rising faster than revenues, the City is becoming less labor intensive, or personnel are
being more productive.
13.00
14.00
15.00
16.00
17.00
18.00
19.00
20.00
2002 2003 2004 2005 2006 2007 2008 2009 2010 2011 2012
Figure 18: Employees per 1,000 Citizens
Increasing results may indicate expenditures are rising faster than revenues, the City is becoming more labor intensive, or employee productivity is declining.
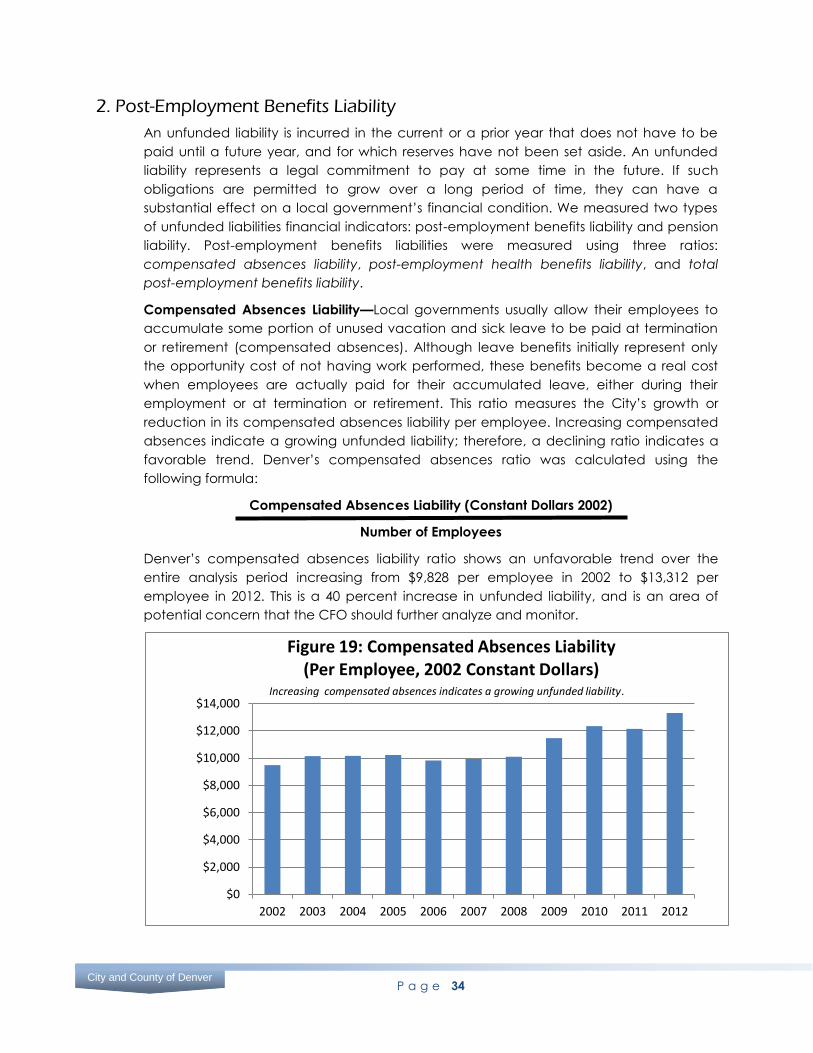
P a g e 34
City and County of Denver
2. Post-Employment Benefits Liability
An unfunded liability is incurred in the current or a prior year that does not have to be
paid until a future year, and for which reserves have not been set aside. An unfunded
liability represents a legal commitment to pay at some time in the future. If such
obligations are permitted to grow over a long period of time, they can have a
substantial effect on a local government’s financial condition. We measured two types
of unfunded liabilities financial indicators: post-employment benefits liability and pension
liability. Post-employment benefits liabilities were measured using three ratios:
compensated absences liability, post-employment health benefits liability, and total
post-employment benefits liability.
Compensated Absences Liability—Local governments usually allow their employees to
accumulate some portion of unused vacation and sick leave to be paid at termination
or retirement (compensated absences). Although leave benefits initially represent only
the opportunity cost of not having work performed, these benefits become a real cost
when employees are actually paid for their accumulated leave, either during their
employment or at termination or retirement. This ratio measures the City’s growth or
reduction in its compensated absences liability per employee. Increasing compensated
absences indicate a growing unfunded liability; therefore, a declining ratio indicates a
favorable trend. Denver’s compensated absences ratio was calculated using the
following formula:
Compensated Absences Liability (Constant Dollars 2002)
Number of Employees
Denver’s compensated absences liability ratio shows an unfavorable trend over the
entire analysis period increasing from $9,828 per employee in 2002 to $13,312 per
employee in 2012. This is a 40 percent increase in unfunded liability, and is an area of
potential concern that the CFO should further analyze and monitor.
$0
$2,000
$4,000
$6,000
$8,000
$10,000
$12,000
$14,000
2002 2003 2004 2005 2006 2007 2008 2009 2010 2011 2012
Figure 19: Compensated Absences Liability (Per Employee, 2002 Constant Dollars)
Increasing compensated absences indicates a growing unfunded liability.
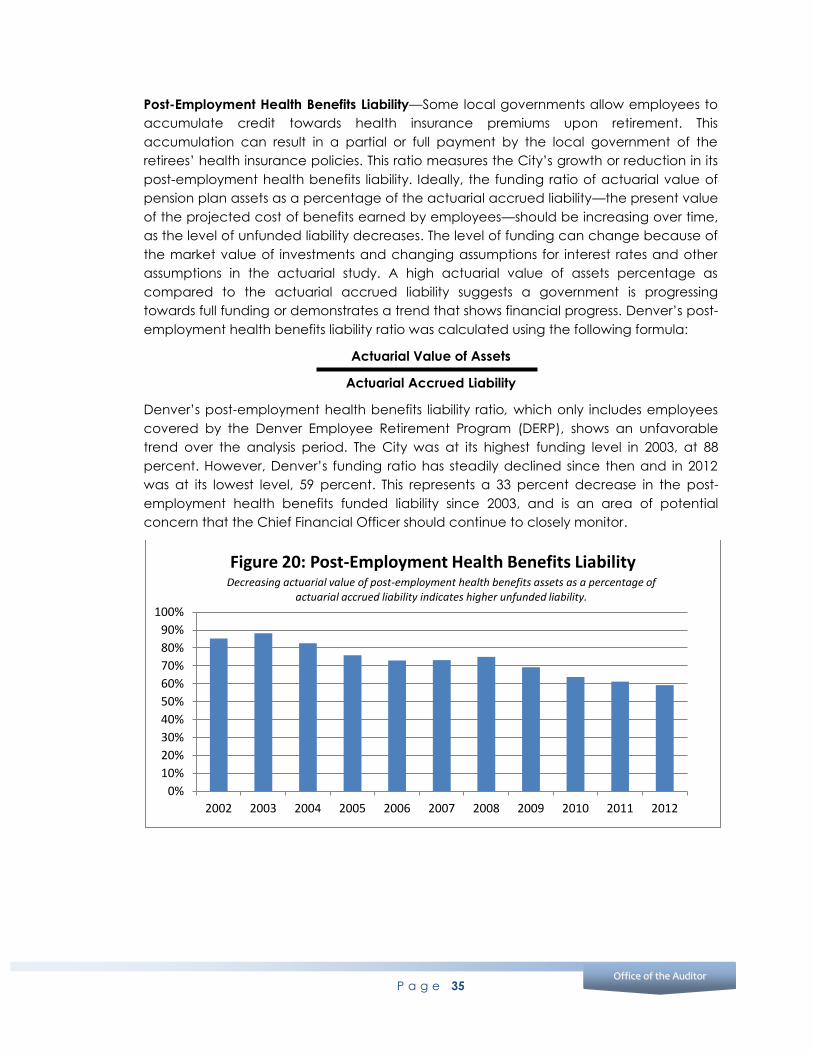
P a g e 35
Office of the Auditor OOffffiiccee ooff tthhee AAuuddiittoorr
Post-Employment Health Benefits Liability—Some local governments allow employees to
accumulate credit towards health insurance premiums upon retirement. This
accumulation can result in a partial or full payment by the local government of the
retirees’ health insurance policies. This ratio measures the City’s growth or reduction in its
post-employment health benefits liability. Ideally, the funding ratio of actuarial value of
pension plan assets as a percentage of the actuarial accrued liability—the present value
of the projected cost of benefits earned by employees—should be increasing over time,
as the level of unfunded liability decreases. The level of funding can change because of
the market value of investments and changing assumptions for interest rates and other
assumptions in the actuarial study. A high actuarial value of assets percentage as
compared to the actuarial accrued liability suggests a government is progressing
towards full funding or demonstrates a trend that shows financial progress. Denver’s post-
employment health benefits liability ratio was calculated using the following formula:
Actuarial Value of Assets
Actuarial Accrued Liability
Denver’s post-employment health benefits liability ratio, which only includes employees
covered by the Denver Employee Retirement Program (DERP), shows an unfavorable
trend over the analysis period. The City was at its highest funding level in 2003, at 88
percent. However, Denver’s funding ratio has steadily declined since then and in 2012
was at its lowest level, 59 percent. This represents a 33 percent decrease in the post-
employment health benefits funded liability since 2003, and is an area of potential
concern that the Chief Financial Officer should continue to closely monitor.
0%
10%
20%
30%
40%
50%
60%
70%
80%
90%
100%
2002 2003 2004 2005 2006 2007 2008 2009 2010 2011 2012
Figure 20: Post-Employment Health Benefits Liability Decreasing actuarial value of post-employment health benefits assets as a percentage of
actuarial accrued liability indicates higher unfunded liability.
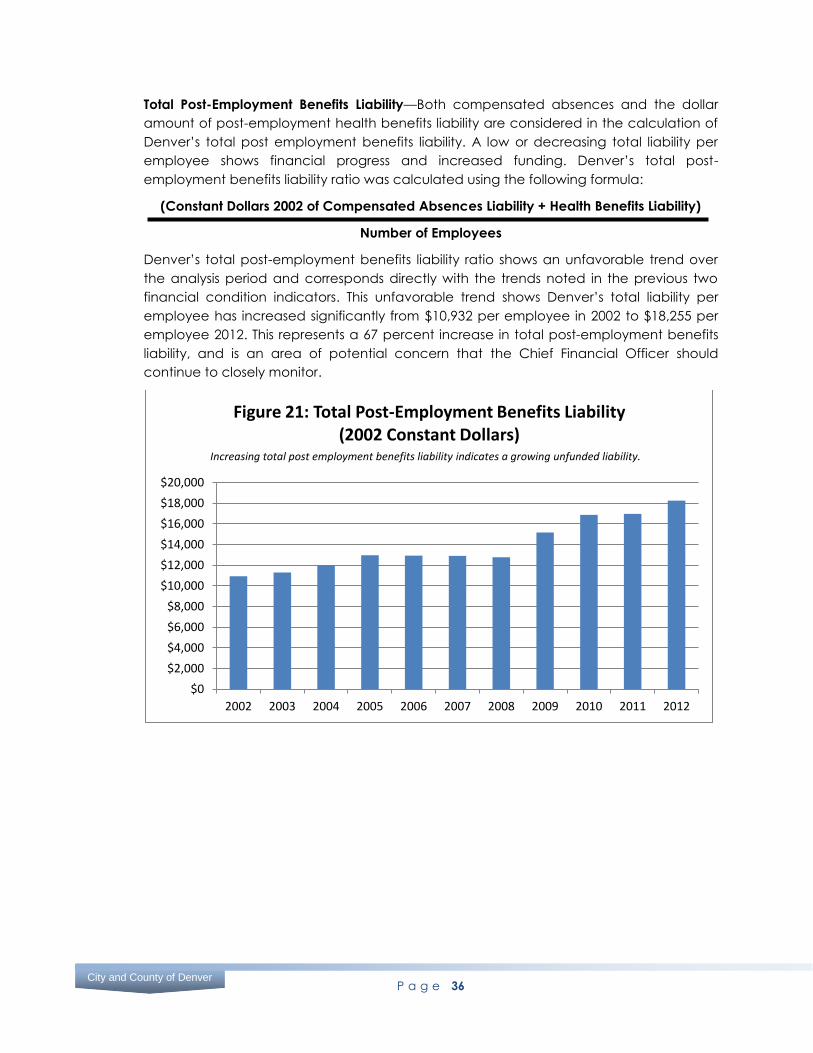
P a g e 36
City and County of Denver
Total Post-Employment Benefits Liability—Both compensated absences and the dollar
amount of post-employment health benefits liability are considered in the calculation of
Denver’s total post employment benefits liability. A low or decreasing total liability per
employee shows financial progress and increased funding. Denver’s total post-
employment benefits liability ratio was calculated using the following formula:
(Constant Dollars 2002 of Compensated Absences Liability + Health Benefits Liability)
Number of Employees
Denver’s total post-employment benefits liability ratio shows an unfavorable trend over
the analysis period and corresponds directly with the trends noted in the previous two
financial condition indicators. This unfavorable trend shows Denver’s total liability per
employee has increased significantly from $10,932 per employee in 2002 to $18,255 per
employee 2012. This represents a 67 percent increase in total post-employment benefits
liability, and is an area of potential concern that the Chief Financial Officer should
continue to closely monitor.
$0
$2,000
$4,000
$6,000
$8,000
$10,000
$12,000
$14,000
$16,000
$18,000
$20,000
2002 2003 2004 2005 2006 2007 2008 2009 2010 2011 2012
Figure 21: Total Post-Employment Benefits Liability (2002 Constant Dollars)
Increasing total post employment benefits liability indicates a growing unfunded liability.
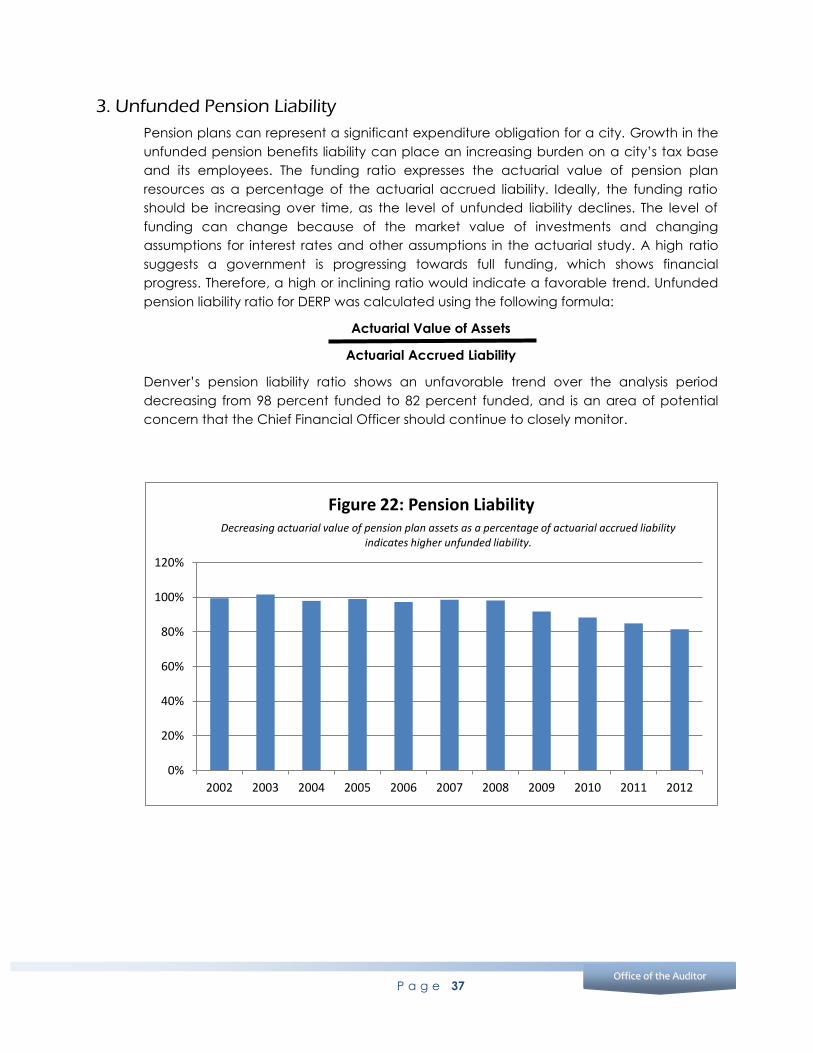
P a g e 37
Office of the Auditor OOffffiiccee ooff tthhee AAuuddiittoorr
3. Unfunded Pension Liability
Pension plans can represent a significant expenditure obligation for a city. Growth in the
unfunded pension benefits liability can place an increasing burden on a city’s tax base
and its employees. The funding ratio expresses the actuarial value of pension plan
resources as a percentage of the actuarial accrued liability. Ideally, the funding ratio
should be increasing over time, as the level of unfunded liability declines. The level of
funding can change because of the market value of investments and changing
assumptions for interest rates and other assumptions in the actuarial study. A high ratio
suggests a government is progressing towards full funding, which shows financial
progress. Therefore, a high or inclining ratio would indicate a favorable trend. Unfunded
pension liability ratio for DERP was calculated using the following formula:
Actuarial Value of Assets
Actuarial Accrued Liability
Denver’s pension liability ratio shows an unfavorable trend over the analysis period
decreasing from 98 percent funded to 82 percent funded, and is an area of potential
concern that the Chief Financial Officer should continue to closely monitor.
0%
20%
40%
60%
80%
100%
120%
2002 2003 2004 2005 2006 2007 2008 2009 2010 2011 2012
Figure 22: Pension Liability Decreasing actuarial value of pension plan assets as a percentage of actuarial accrued liability
indicates higher unfunded liability.
P a g e 38
City and County of Denver
Importance of City Management Performing a Periodic Financial Condition Analysis
By performing a financial condition analysis of the City, we were able to identify potential
financial weaknesses specific to the City’s debt burden and coverage, capital assets,
and unfunded liabilities. The financial condition analysis included two important
components—trending Denver’s financial performance over a period of time and
benchmarking the City’s financial performance against comparable cities. Computing a
single set of ratios for one year tells you very little. The ratios need to be evaluated over a
period of time in order to understand and give weight to the direction in which the City is
heading. Additional context can be provided through benchmarking against other
comparable governments to determine whether the City’s financial condition is
improving or deteriorating relative to others.22
Our review of the City’s financial indicators is a broad analytical and diagnostic tool—
based on historical data—to identify potential financial strengths and weaknesses. The
CFO should perform a more detailed analysis of the unfavorable trends identified to
determine why the ratios exhibit weak financial performance and what policy decisions
could be made to mitigate the weaknesses. In addition, the CFO should develop and
implement a methodology—including trending and benchmarking—to periodically
analyze financial ratios and determine the City’s ongoing financial condition. By doing
so, the CFO will gain valuable insight into the City’s financial health and how policy
decisions have impacted current and future taxpayers. This analysis can assist key
stakeholders—including the Mayor’s Office, City Council, and the Department of
Finance—address negative trends as they emerge and help inform discussions involving
financial and policy objectives in a timely manner. Furthermore, the CFO should disclose
the outcome of the financial analysis on the City’s Transparent Denver website to
promote enhanced transparency and accountability to Denver’s citizens.
RECOMMENDATIONS
1.1. The Chief Financial Officer should perform a more detailed analysis of the
unfavorable trends identified in our financial condition analysis to determine why
the financial condition ratios exhibit weak financial performance and what policy
decisions can be made to mitigate the weaknesses.
1.2. The Chief Financial Officer should develop and implement a methodology—
including trending and benchmarking—to periodically analyze financial ratios
and determine the City’s ongoing financial condition.
1.3. The Chief Financial Officer should disclose the outcome of the financial analysis
on the City’s Transparent Denver website to promote enhanced transparency
and accountability with Denver’s citizens.
22
Dean Mead. (2006). “A Manageable System of Economic Condition Analysis for Governments” in Howard Frank, ed., Public Financial Management, 389, Boca Raton, FL: CRC Press.
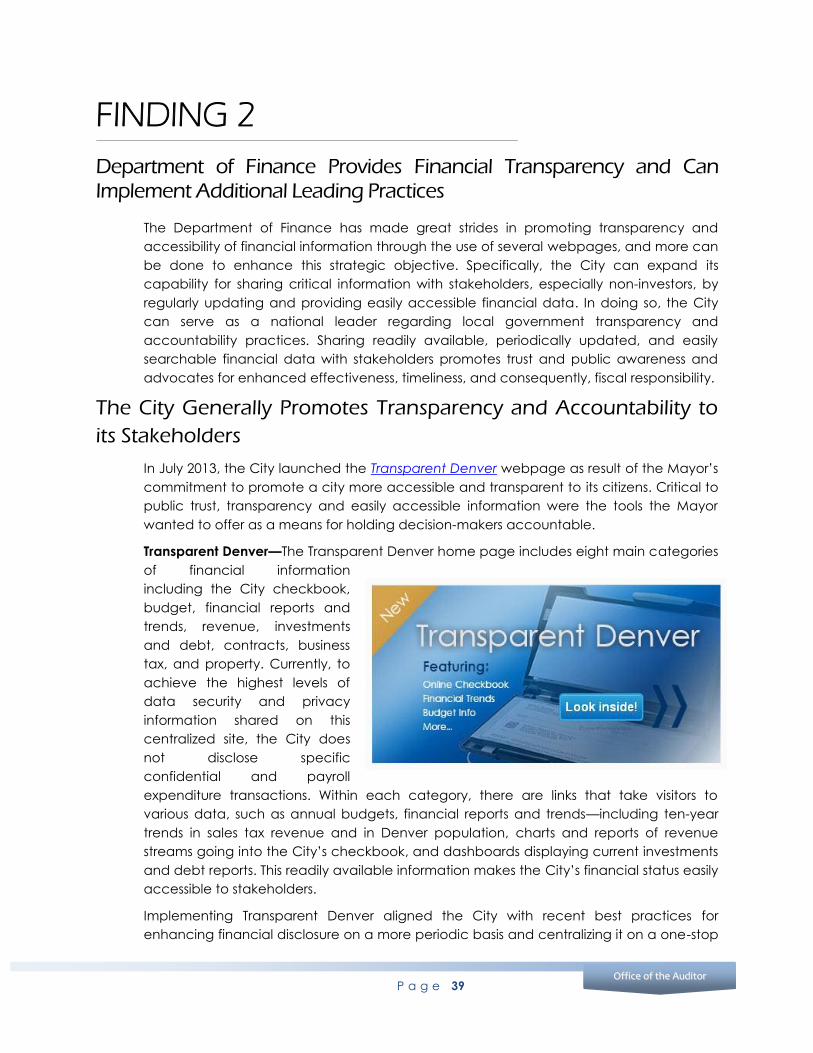
P a g e 39
Office of the Auditor OOffffiiccee ooff tthhee AAuuddiittoorr
FINDING 2
Department of Finance Provides Financial Transparency and Can Implement Additional Leading Practices
The Department of Finance has made great strides in promoting transparency and
accessibility of financial information through the use of several webpages, and more can
be done to enhance this strategic objective. Specifically, the City can expand its
capability for sharing critical information with stakeholders, especially non-investors, by
regularly updating and providing easily accessible financial data. In doing so, the City
can serve as a national leader regarding local government transparency and
accountability practices. Sharing readily available, periodically updated, and easily
searchable financial data with stakeholders promotes trust and public awareness and
advocates for enhanced effectiveness, timeliness, and consequently, fiscal responsibility.
The City Generally Promotes Transparency and Accountability to
its Stakeholders
In July 2013, the City launched the Transparent Denver webpage as result of the Mayor’s
commitment to promote a city more accessible and transparent to its citizens. Critical to
public trust, transparency and easily accessible information were the tools the Mayor
wanted to offer as a means for holding decision-makers accountable.
Transparent Denver—The Transparent Denver home page includes eight main categories
of financial information
including the City checkbook,
budget, financial reports and
trends, revenue, investments
and debt, contracts, business
tax, and property. Currently, to
achieve the highest levels of
data security and privacy
information shared on this
centralized site, the City does
not disclose specific
confidential and payroll
expenditure transactions. Within each category, there are links that take visitors to
various data, such as annual budgets, financial reports and trends—including ten-year
trends in sales tax revenue and in Denver population, charts and reports of revenue
streams going into the City’s checkbook, and dashboards displaying current investments
and debt reports. This readily available information makes the City’s financial status easily
accessible to stakeholders.
Implementing Transparent Denver aligned the City with recent best practices for
enhancing financial disclosure on a more periodic basis and centralizing it on a one-stop
P a g e 40
City and County of Denver
webpage. Transparent Denver provides the public critical financial information in a more
user-friendly, centralized, and easily searchable manner than before. Specifically, the
newly established webpage includes critical prior years’ information, such as the
Consolidated Annual Financial Reports (CAFRs), as well as some important current year
data, namely both revenues and expenditures, and debt and investment disclosures. In
addition, the Transparent Denver webpage provides a useful Related Resources section
within each webpage category. This section provides quick links between Transparent
Denver and other webpages not as easily located, such as the Peak Performance
Initiative and Measure 2A Service Investments.
Before Transparent Denver, the City Published Various Financial Information in Disparate
Webpages—Before launching Transparent Denver the City reported various financial
data online, although this information was mostly related to prior-year activities and was
disseminated on disparate, unconnected webpages. Specifically, the City disclosed
financial information as it related to different financial functions and services of the City.
For example, the Assessor’s Office webpage posted property tax assessments, which are
updated annually, while the Controller’s Office webpage posted the Comprehensive
Annual Financial Reports (CAFRs), the Popular Annual Financial Reports (PAFRs), and the
annual Single Audit Reports. All of these documents provided citizens with critical
information about City financial activities that occurred in the previous year. In addition
to prior year data, the Budget and Management Office (BMO) webpage made
available the projected data for the upcoming year in the City’s annual budgets and
the citizen’s budgets, which presented the budget highlights to citizens in a more concise
format. Moreover, BMO offered the results of citizen’s surveys, which provide resident
opinions about community and services provided by the City. While all this financial
information was disclosed on the City’s network, the site visitors would need a basic
understanding of which office webpages to visit to locate specific financial information.
The development of Transparent Denver has partially addressed this issue, by
aggregating access to some information on a single webpage. However, further
improvements are still needed.
Leading Practices Suggest Some Improvements Are Possible
Although the City has been issuing financial information online and although it has
centralized financial information on its Transparent Denver webpage, the most recent
trend in best and leading-edge practices encourage municipalities and local
government to expand on the data they disclose and to make the accessibility to
financial information more user-friendly.
U.S. Securities and Exchange Commission (SEC)—The SEC issued a report in July 2012,
titled Report on the Municipal Securities Market, to highlight concerns surrounding the
municipal securities market. Some of these concerns included content and timeliness of
financial information, accuracy and adequacy of disclosure of pension and OPEB
P a g e 41
Office of the Auditor OOffffiiccee ooff tthhee AAuuddiittoorr
funding obligations, and enhanced disclosure of derivatives in order to provide investors
and issuers a clear understanding of the terms and risks to the municipal issuer.23
To address these concerns, the report presented a number of recommendations calling
for potential legislative and regulatory changes allowing the SEC authority to improve
municipal securities disclosures and practices. For example, the SEC called for the ability
to mandate an expanded, timelier, and continuous disclosure of information, including
the timeframes and frequency of such information, and the ability to control the form
and content of the financial statements of municipal issuers of securities.
National Association of State Auditors, Comptrollers and Treasurers (NASACT)—To address
concerns brought forward by the SEC regarding financial reporting practices, NASACT
developed a guide in August 2013, titled Voluntary Interim Financial Reporting: Best
Practices for State Governments. Recognizing that disclosure and financial reporting are
very important aspects of ensuring accountability and improving transparency with the
investing community and local government stakeholders, this document recommends
ten best practices for states and local governments to disclose on a voluntary basis.24 The
goal of interim disclosure is to allow stakeholders to efficiently observe their government’s
financial condition in as timely a manner as possible.
Among the ten recommendations, NASACT suggested that four be updated on a
quarterly basis. These include tax revenues, budget updates, cash flow, and debt
outstanding. NASACT further suggested the other six recommendations be updated and
disclosed in the interim period in which a change occurs. These include economic
forecasts, pensions and other post-employment benefits (OPEB), interest rate swaps and
bank liquidity, investments, debt management policies, and Electronic Municipal Market
Access (EMMA) filings. For example, NASACT recommended releasing updated versions
of annual actuarial reports on pension liability or OPEB in the interim reporting period as
soon as the entity receives them. Moreover, interim disclosure reports should include
updates to the city’s interest rate swap portfolio, bank liquidity, and credit facilities.
Finally, disclosure should include updates to the debt management policies when
effective and presenting any filings with the EMMA system that have been made in the
most recent period.
United States Federation of State Public Interest Research Groups (U.S. PIRG)—U.S. PIRG
issued a report in January 2013, titled Transparency in City Spending – Rating the
Availability of Online Government Data in America’s Largest Cities. The document
reported that being able to see how governments use public funds is the foundation of
transparency in government spending public funds, bolsters public confidence, improves
responsiveness, and promotes greater effectiveness and fiscal responsibility.25
23
U.S. Securities and Exchange Commission. “Report on the Municipal Securities Market”: July 31, 2012, http://www.sec.gov/news/studies/2012/munireport073112.pdf. 24
NASACT. “Voluntary Interim Financial Reporting: Best Practices for State Governments”: August 2013, http://nasact.org/nasact/publications/papers/best_practices_document.pdf. 25
U.S. PIRG. “Transparency in City Spending – Rating the Availability of Online Government Data in America’s Largest Cities”: January 23, 2013, http://www.uspirg.org/reports/usp/transparency-city-spending.
P a g e 42
City and County of Denver
The study looked at America’s thirty most populous cities, including Denver, and ranked
them based on their progress toward Transparency 2.0—a standard of encompassing
one-stop, one-click budget accountability and accessibility. The report grouped these
thirty cities into five categories: leading cities, advancing cities, emerging cities, lagging
cities, or failing cities. While Chicago, New York City, and San Francisco were recognized
as leading cities for delivering easy-to-access, encompassing information on government
spending, Denver was ranked as an advancing city along with Baltimore, Cincinnati, San
Antonio, and Washington, D.C. As advancing cities, these municipalities were
recognized for having made government spending data available online, although the
information provided was either slightly more limited or more difficult to access than the
spending data in leading cities.
Finally, the study reported that the benefits of transparency websites that help disclose
city spending practices have come with a low price tag. To validate this point, the
research group surveyed Denver and other cities, including Las Vegas and Phoenix, and
reported that these cities estimated the cost of launching their transparency website was
very little or minimal.
The City Should Continue to Elevate its Transparency and Accountability Status to
Become a Leading-Edge City—Although financial-related data is reported and is
centrally disclosed on the Transparent Denver webpage, the City could provide to its
stakeholders a more thorough, timely presentation and explanation of data. While being
transparent means to disclose financial information, it also involves providing tools and
explanations of what that data mean. Interpretations and explanations of raw financial
data would enable the City to put the data into context and consequently provide
stakeholders, especially non-investors, with a deeper level of understanding of the City’s
financial performance. Additionally, if adopted, this model would elevate the City to the
next level of a leading-edge city in transparency and accountability to the community,
which could further align the City with current best practices and the Mayor’s goals for
the City. Therefore, the Chief Financial Officer (CFO) should add analyses and
explanations to regularly updated financial information
Presenting updated, timely reports of financial information including explanations
addressing what has occurred in the interim would allow stakeholders to have a more
comprehensive vision of the financial condition of their City and understand why certain
decisions were made. The Transparent Denver webpage currently includes monthly or
quarterly reports of the City’s investments and debt; however, the reports on the
webpage as of November 8, 2013, are not timely. The investments portfolio performance
report is for the quarter ending March 31, 2013; the aggregate investments portfolio
summary is as of May 31, 2013; and the City debt portfolio dashboard is as of April 1,
2013. In addition, while budget-to-actual General Fund revenue information as of June
2013 is presented in the General Fund Revenue Report, the report does not provide
context regarding where the City’s revenue collections are in relation to where they
were expected to be at that time. Furthermore, current budget-to-actual expenditure
details are not provided. Consequently, the CFO should disclose regularly updated
financial information.
P a g e 43
Office of the Auditor OOffffiiccee ooff tthhee AAuuddiittoorr
Additionally, disclosing financial forecasts, as well as their underlying analyses, in an easily
accessible way would provide stakeholders with explanations behind choices and
decisions made by City management and enhance both transparency and
accountability. The BMO prepares a three-year General Fund revenue and expenditure
forecast as a planning tool to provide the City with the ability to anticipate future
challenges in revenue generation and expense imbalances so that corrective action
can be taken before a crisis develops. This information is not made available to the
public. In addition, the BMO prepares a longer-range budget forecast—currently 2013 to
2030. While we were able to locate the revenues and expenditures forecasts on a City
webpage, they were not accessible through the Transparent Denver webpage; rather,
they were incorporated within the Structural Financial Task Force webpage, which is not
a Related Resources quick links option. The CFO should disclose financial forecasts in a
centralized location on the Transparent Denver webpage.
Finally, although Transparent Denver currently provides Related Resources quick links on
each webpage, these links do not clarify the types of financial information available on
these other pages. The CFO should further enhance Transparent Denver by providing
details of what financial information is available to citizens within the Related Resources
quick links.
RECOMMENDATIONS
2.1. The Chief Financial Officer should add analyses and explanations to regularly
updated financial information.
2.2. The Chief Financial Officer should disclose regularly updated financial
information.
2.3. The Chief Financial Officer should disclose financial forecasts in a centralized
location on the Transparent Denver webpage.
2.4. The Chief Financial Officer should further enhance Transparent Denver by
providing details of what financial information is available to citizens within the
Related Resources quick links.
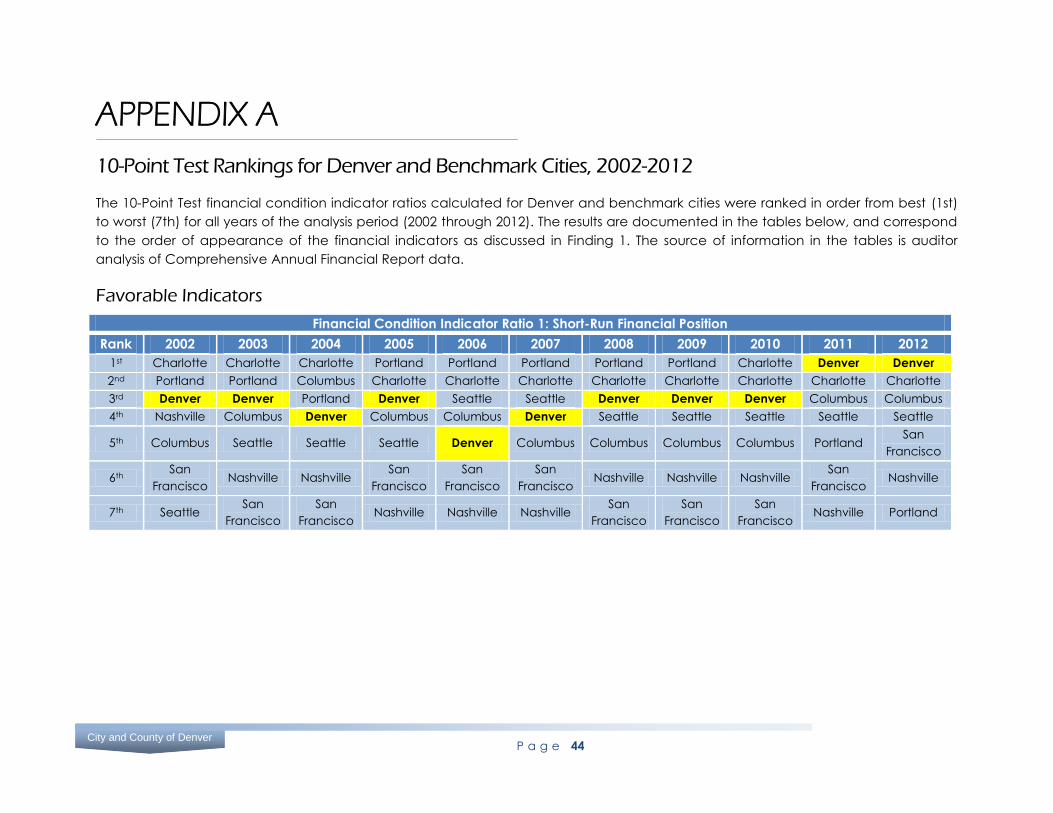
P a g e 44
City and County of Denver
APPENDIX A
10-Point Test Rankings for Denver and Benchmark Cities, 2002-2012
The 10-Point Test financial condition indicator ratios calculated for Denver and benchmark cities were ranked in order from best (1st)
to worst (7th) for all years of the analysis period (2002 through 2012). The results are documented in the tables below, and correspond
to the order of appearance of the financial indicators as discussed in Finding 1. The source of information in the tables is auditor
analysis of Comprehensive Annual Financial Report data.
Favorable Indicators
Financial Condition Indicator Ratio 1: Short-Run Financial Position
Rank 2002 2003 2004 2005 2006 2007 2008 2009 2010 2011 2012
1st Charlotte Charlotte Charlotte Portland Portland Portland Portland Portland Charlotte Denver Denver
2nd Portland Portland Columbus Charlotte Charlotte Charlotte Charlotte Charlotte Charlotte Charlotte Charlotte
3rd Denver Denver Portland Denver Seattle Seattle Denver Denver Denver Columbus Columbus
4th Nashville Columbus Denver Columbus Columbus Denver Seattle Seattle Seattle Seattle Seattle
5th Columbus Seattle Seattle Seattle Denver Columbus Columbus Columbus Columbus Portland San
Francisco
6th San
Francisco Nashville Nashville
San
Francisco
San
Francisco
San
Francisco Nashville Nashville Nashville
San
Francisco Nashville
7th Seattle San
Francisco
San
Francisco Nashville Nashville Nashville
San
Francisco
San
Francisco
San
Francisco Nashville Portland
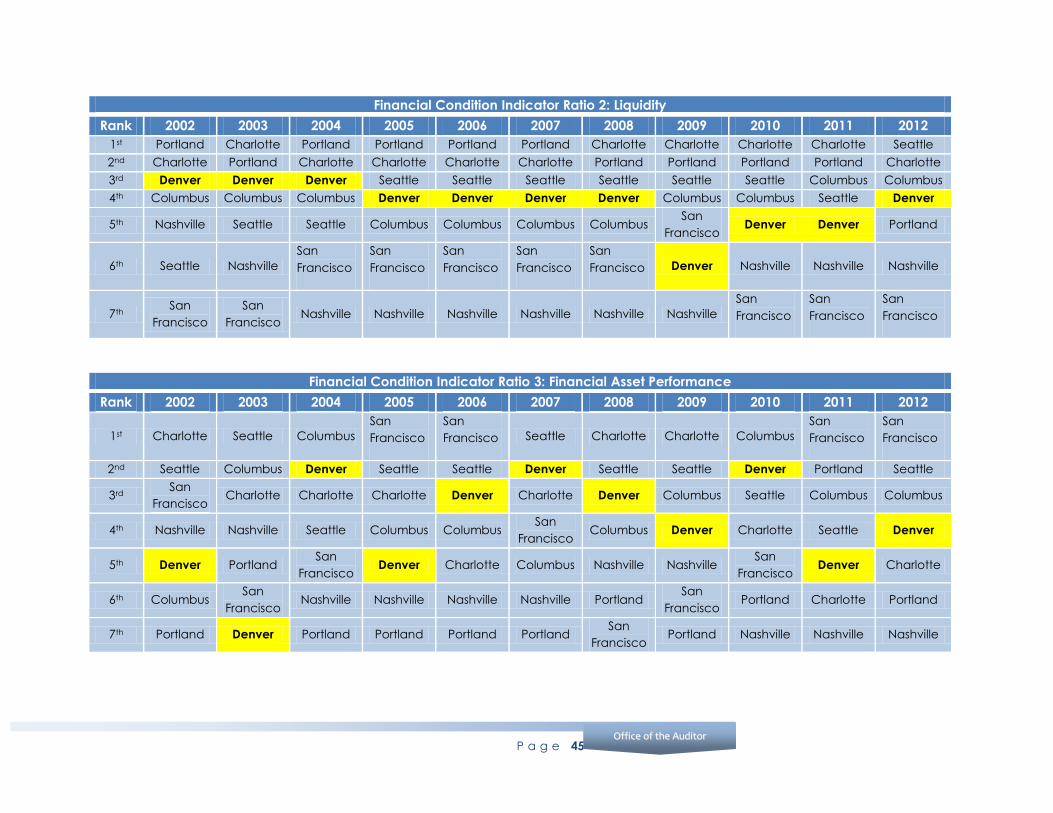
P a g e 45
Office of the Auditor OOffffiiccee ooff tthhee AAuuddiittoorr
Financial Condition Indicator Ratio 2: Liquidity
Rank 2002 2003 2004 2005 2006 2007 2008 2009 2010 2011 2012
1st Portland Charlotte Portland Portland Portland Portland Charlotte Charlotte Charlotte Charlotte Seattle
2nd Charlotte Portland Charlotte Charlotte Charlotte Charlotte Portland Portland Portland Portland Charlotte
3rd Denver Denver Denver Seattle Seattle Seattle Seattle Seattle Seattle Columbus Columbus
4th Columbus Columbus Columbus Denver Denver Denver Denver Columbus Columbus Seattle Denver
5th Nashville Seattle Seattle Columbus Columbus Columbus Columbus San
Francisco Denver Denver Portland
6th Seattle Nashville
San
Francisco
San
Francisco
San
Francisco
San
Francisco
San
Francisco Denver Nashville Nashville Nashville
7th San
Francisco
San
Francisco Nashville Nashville Nashville Nashville Nashville Nashville
San
Francisco
San
Francisco
San
Francisco
Financial Condition Indicator Ratio 3: Financial Asset Performance
Rank 2002 2003 2004 2005 2006 2007 2008 2009 2010 2011 2012
1st Charlotte Seattle Columbus
San
Francisco
San
Francisco Seattle Charlotte Charlotte Columbus
San
Francisco
San
Francisco
2nd Seattle Columbus Denver Seattle Seattle Denver Seattle Seattle Denver Portland Seattle
3rd San
Francisco Charlotte Charlotte Charlotte Denver Charlotte Denver Columbus Seattle Columbus Columbus
4th Nashville Nashville Seattle Columbus Columbus San
Francisco Columbus Denver Charlotte Seattle Denver
5th Denver Portland San
Francisco Denver Charlotte Columbus Nashville Nashville
San
Francisco Denver Charlotte
6th Columbus San
Francisco Nashville Nashville Nashville Nashville Portland
San
Francisco Portland Charlotte Portland
7th Portland Denver Portland Portland Portland Portland San
Francisco Portland Nashville Nashville Nashville
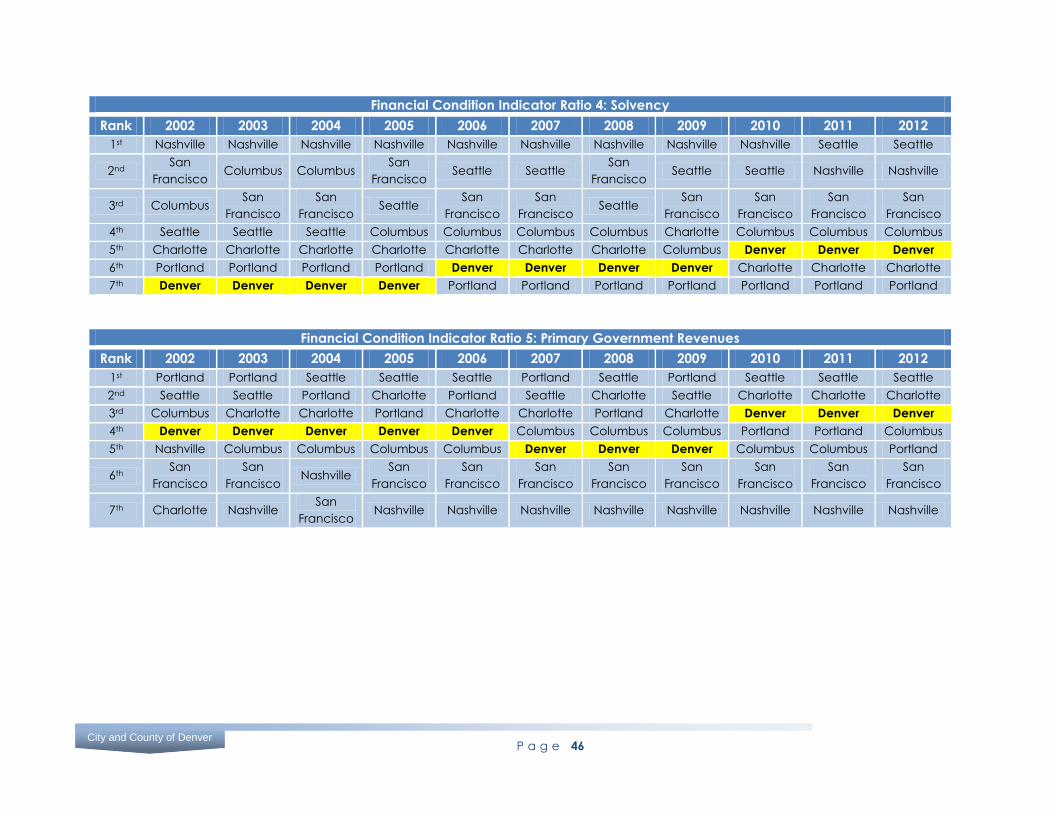
P a g e 46
City and County of Denver
Financial Condition Indicator Ratio 4: Solvency
Rank 2002 2003 2004 2005 2006 2007 2008 2009 2010 2011 2012
1st Nashville Nashville Nashville Nashville Nashville Nashville Nashville Nashville Nashville Seattle Seattle
2nd San
Francisco Columbus Columbus
San
Francisco Seattle Seattle
San
Francisco Seattle Seattle Nashville Nashville
3rd Columbus San
Francisco
San
Francisco Seattle
San
Francisco
San
Francisco Seattle
San
Francisco
San
Francisco
San
Francisco
San
Francisco
4th Seattle Seattle Seattle Columbus Columbus Columbus Columbus Charlotte Columbus Columbus Columbus
5th Charlotte Charlotte Charlotte Charlotte Charlotte Charlotte Charlotte Columbus Denver Denver Denver
6th Portland Portland Portland Portland Denver Denver Denver Denver Charlotte Charlotte Charlotte
7th Denver Denver Denver Denver Portland Portland Portland Portland Portland Portland Portland
Financial Condition Indicator Ratio 5: Primary Government Revenues
Rank 2002 2003 2004 2005 2006 2007 2008 2009 2010 2011 2012
1st Portland Portland Seattle Seattle Seattle Portland Seattle Portland Seattle Seattle Seattle
2nd Seattle Seattle Portland Charlotte Portland Seattle Charlotte Seattle Charlotte Charlotte Charlotte
3rd Columbus Charlotte Charlotte Portland Charlotte Charlotte Portland Charlotte Denver Denver Denver
4th Denver Denver Denver Denver Denver Columbus Columbus Columbus Portland Portland Columbus
5th Nashville Columbus Columbus Columbus Columbus Denver Denver Denver Columbus Columbus Portland
6th San
Francisco
San
Francisco Nashville
San
Francisco
San
Francisco
San
Francisco
San
Francisco
San
Francisco
San
Francisco
San
Francisco
San
Francisco
7th Charlotte Nashville San
Francisco Nashville Nashville Nashville Nashville Nashville Nashville Nashville Nashville
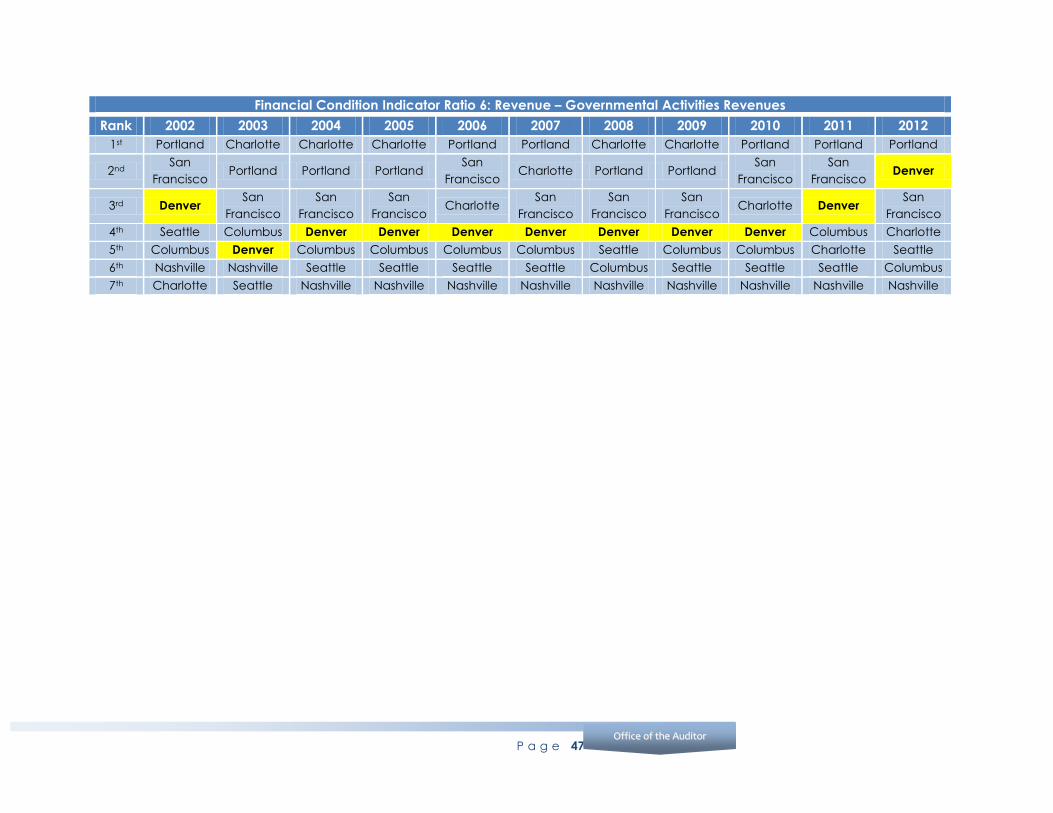
P a g e 47
Office of the Auditor OOffffiiccee ooff tthhee AAuuddiittoorr
Financial Condition Indicator Ratio 6: Revenue – Governmental Activities Revenues
Rank 2002 2003 2004 2005 2006 2007 2008 2009 2010 2011 2012
1st Portland Charlotte Charlotte Charlotte Portland Portland Charlotte Charlotte Portland Portland Portland
2nd San
Francisco Portland Portland Portland
San
Francisco Charlotte Portland Portland
San
Francisco
San
Francisco Denver
3rd Denver San
Francisco
San
Francisco
San
Francisco Charlotte
San
Francisco
San
Francisco
San
Francisco Charlotte Denver
San
Francisco
4th Seattle Columbus Denver Denver Denver Denver Denver Denver Denver Columbus Charlotte
5th Columbus Denver Columbus Columbus Columbus Columbus Seattle Columbus Columbus Charlotte Seattle
6th Nashville Nashville Seattle Seattle Seattle Seattle Columbus Seattle Seattle Seattle Columbus
7th Charlotte Seattle Nashville Nashville Nashville Nashville Nashville Nashville Nashville Nashville Nashville
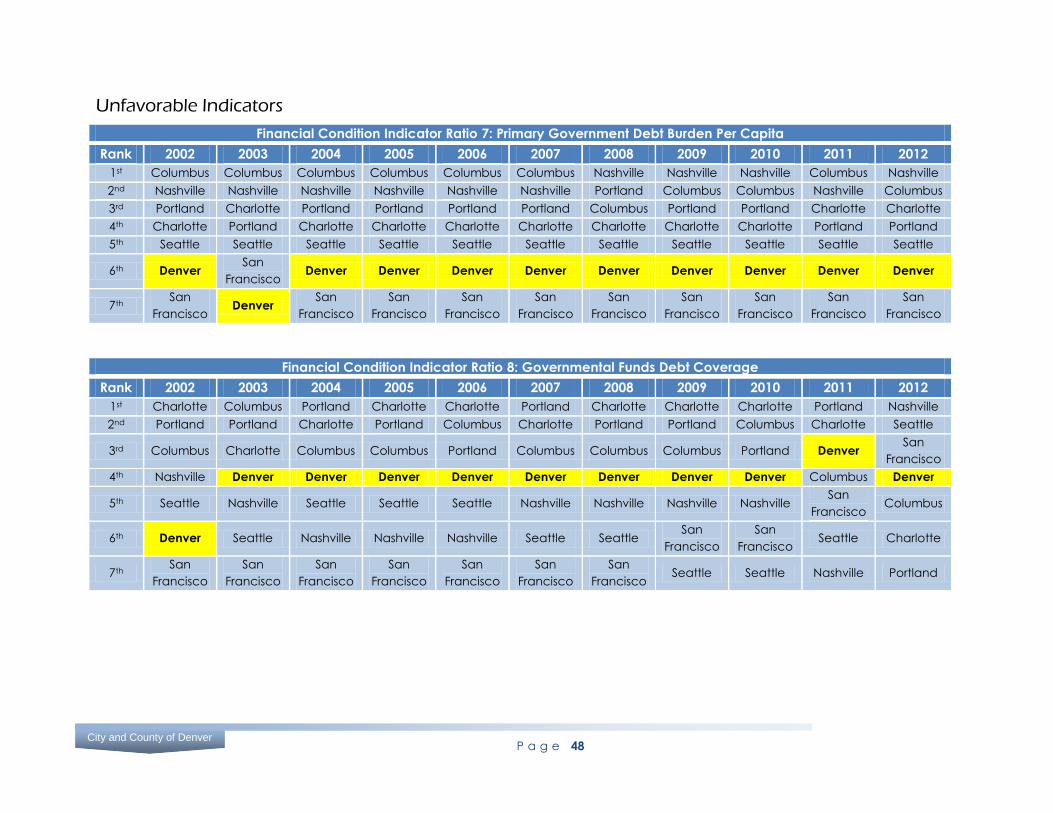
P a g e 48
City and County of Denver
Unfavorable Indicators
Financial Condition Indicator Ratio 7: Primary Government Debt Burden Per Capita
Rank 2002 2003 2004 2005 2006 2007 2008 2009 2010 2011 2012
1st Columbus Columbus Columbus Columbus Columbus Columbus Nashville Nashville Nashville Columbus Nashville
2nd Nashville Nashville Nashville Nashville Nashville Nashville Portland Columbus Columbus Nashville Columbus
3rd Portland Charlotte Portland Portland Portland Portland Columbus Portland Portland Charlotte Charlotte
4th Charlotte Portland Charlotte Charlotte Charlotte Charlotte Charlotte Charlotte Charlotte Portland Portland
5th Seattle Seattle Seattle Seattle Seattle Seattle Seattle Seattle Seattle Seattle Seattle
6th Denver San
Francisco Denver Denver Denver Denver Denver Denver Denver Denver Denver
7th San
Francisco Denver
San
Francisco
San
Francisco
San
Francisco
San
Francisco
San
Francisco
San
Francisco
San
Francisco
San
Francisco
San
Francisco
Financial Condition Indicator Ratio 8: Governmental Funds Debt Coverage
Rank 2002 2003 2004 2005 2006 2007 2008 2009 2010 2011 2012
1st Charlotte Columbus Portland Charlotte Charlotte Portland Charlotte Charlotte Charlotte Portland Nashville
2nd Portland Portland Charlotte Portland Columbus Charlotte Portland Portland Columbus Charlotte Seattle
3rd Columbus Charlotte Columbus Columbus Portland Columbus Columbus Columbus Portland Denver San
Francisco
4th Nashville Denver Denver Denver Denver Denver Denver Denver Denver Columbus Denver
5th Seattle Nashville Seattle Seattle Seattle Nashville Nashville Nashville Nashville San
Francisco Columbus
6th Denver Seattle Nashville Nashville Nashville Seattle Seattle San
Francisco
San
Francisco Seattle Charlotte
7th San
Francisco
San
Francisco
San
Francisco
San
Francisco
San
Francisco
San
Francisco
San
Francisco Seattle Seattle Nashville Portland
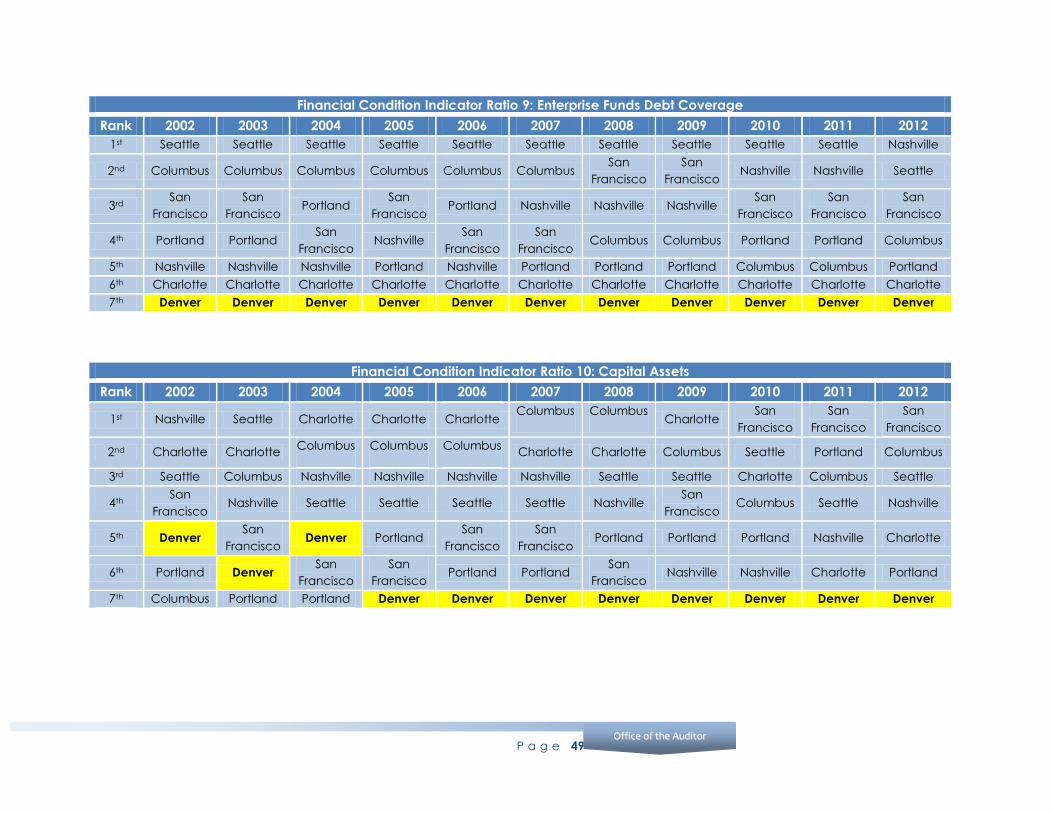
P a g e 49
Office of the Auditor OOffffiiccee ooff tthhee AAuuddiittoorr
Financial Condition Indicator Ratio 9: Enterprise Funds Debt Coverage
Rank 2002 2003 2004 2005 2006 2007 2008 2009 2010 2011 2012
1st Seattle Seattle Seattle Seattle Seattle Seattle Seattle Seattle Seattle Seattle Nashville
2nd Columbus Columbus Columbus Columbus Columbus Columbus San
Francisco
San
Francisco Nashville Nashville Seattle
3rd San
Francisco
San
Francisco Portland
San
Francisco Portland Nashville Nashville Nashville
San
Francisco
San
Francisco
San
Francisco
4th Portland Portland San
Francisco Nashville
San
Francisco
San
Francisco Columbus Columbus Portland Portland Columbus
5th Nashville Nashville Nashville Portland Nashville Portland Portland Portland Columbus Columbus Portland
6th Charlotte Charlotte Charlotte Charlotte Charlotte Charlotte Charlotte Charlotte Charlotte Charlotte Charlotte
7th Denver Denver Denver Denver Denver Denver Denver Denver Denver Denver Denver
Financial Condition Indicator Ratio 10: Capital Assets
Rank 2002 2003 2004 2005 2006 2007 2008 2009 2010 2011 2012
1st Nashville Seattle Charlotte Charlotte Charlotte Columbus Columbus
Charlotte San
Francisco
San
Francisco
San
Francisco
2nd Charlotte Charlotte Columbus Columbus Columbus
Charlotte Charlotte Columbus Seattle Portland Columbus
3rd Seattle Columbus Nashville Nashville Nashville Nashville Seattle Seattle Charlotte Columbus Seattle
4th San
Francisco Nashville Seattle Seattle Seattle Seattle Nashville
San
Francisco Columbus Seattle Nashville
5th Denver San
Francisco Denver Portland
San
Francisco
San
Francisco Portland Portland Portland Nashville Charlotte
6th Portland Denver San
Francisco
San
Francisco Portland Portland
San
Francisco Nashville Nashville Charlotte Portland
7th Columbus Portland Portland Denver Denver Denver Denver Denver Denver Denver Denver
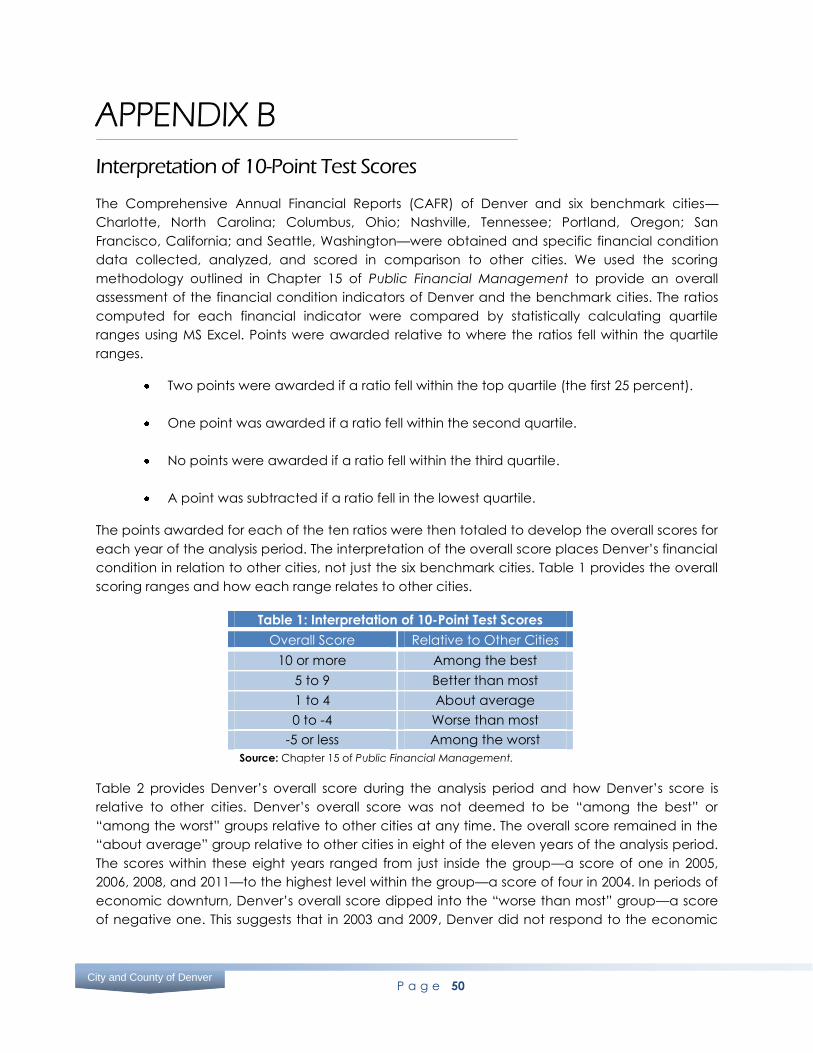
P a g e 50
City and County of Denver
APPENDIX B
Interpretation of 10-Point Test Scores
The Comprehensive Annual Financial Reports (CAFR) of Denver and six benchmark cities—
Charlotte, North Carolina; Columbus, Ohio; Nashville, Tennessee; Portland, Oregon; San
Francisco, California; and Seattle, Washington—were obtained and specific financial condition
data collected, analyzed, and scored in comparison to other cities. We used the scoring
methodology outlined in Chapter 15 of Public Financial Management to provide an overall
assessment of the financial condition indicators of Denver and the benchmark cities. The ratios
computed for each financial indicator were compared by statistically calculating quartile
ranges using MS Excel. Points were awarded relative to where the ratios fell within the quartile
ranges.
Two points were awarded if a ratio fell within the top quartile (the first 25 percent).
One point was awarded if a ratio fell within the second quartile.
No points were awarded if a ratio fell within the third quartile.
A point was subtracted if a ratio fell in the lowest quartile.
The points awarded for each of the ten ratios were then totaled to develop the overall scores for
each year of the analysis period. The interpretation of the overall score places Denver’s financial
condition in relation to other cities, not just the six benchmark cities. Table 1 provides the overall
scoring ranges and how each range relates to other cities.
Table 1: Interpretation of 10-Point Test Scores
Overall Score Relative to Other Cities
10 or more Among the best
5 to 9 Better than most
1 to 4 About average
0 to -4 Worse than most
-5 or less Among the worst
Source: Chapter 15 of Public Financial Management.
Table 2 provides Denver’s overall score during the analysis period and how Denver’s score is
relative to other cities. Denver’s overall score was not deemed to be “among the best” or
“among the worst” groups relative to other cities at any time. The overall score remained in the
“about average” group relative to other cities in eight of the eleven years of the analysis period.
The scores within these eight years ranged from just inside the group—a score of one in 2005,
2006, 2008, and 2011—to the highest level within the group—a score of four in 2004. In periods of
economic downturn, Denver’s overall score dipped into the “worse than most” group—a score
of negative one. This suggests that in 2003 and 2009, Denver did not respond to the economic
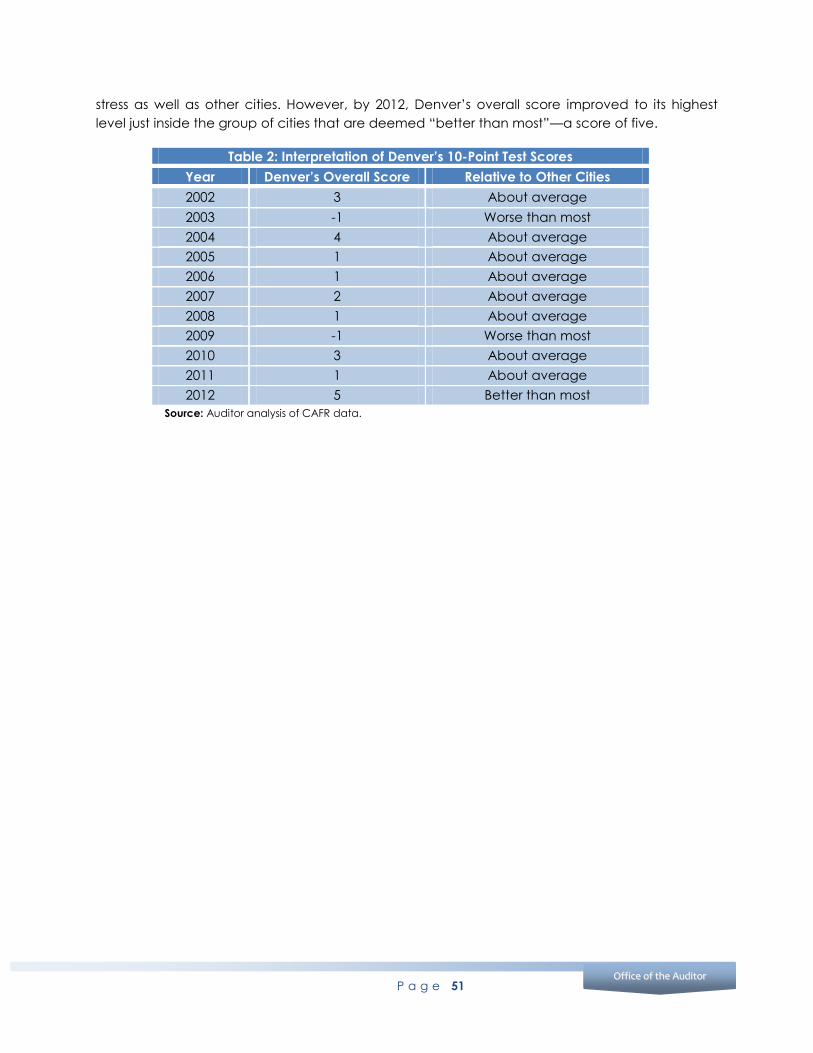
P a g e 51
Office of the Auditor OOffffiiccee ooff tthhee AAuuddiittoorr
stress as well as other cities. However, by 2012, Denver’s overall score improved to its highest
level just inside the group of cities that are deemed “better than most”—a score of five.
Table 2: Interpretation of Denver’s 10-Point Test Scores
Year Denver’s Overall Score Relative to Other Cities
2002 3 About average
2003 -1 Worse than most
2004 4 About average
2005 1 About average
2006 1 About average
2007 2 About average
2008 1 About average
2009 -1 Worse than most
2010 3 About average
2011 1 About average
2012 5 Better than most
Source: Auditor analysis of CAFR data.

P a g e 52
City and County of Denver
AGENCY RESPONSE