Embed Size (px)
Citation preview

THE WORLD BANK
Silvana Tordo
W O R L D B A N K W O R K I N G P A P E R N O . 1 2 3
Fiscal Systems for HydrocarbonsDesign Issues


Silvana Tordo
W O R L D B A N K W O R K I N G P A P E R N O . 1 2 3
Fiscal Systems for HydrocarbonsDesign Issues
THE WORLD BANK
Washington, D.C.

Copyright © 2007The International Bank for Reconstruction and Development / The World Bank1818 H Street, N.W.Washington, D.C. 20433, U.S.A.All rights reservedManufactured in the United States of AmericaFirst Printing: August 2007
printed on recycled paper
1 2 3 4 5 10 09 08 07
World Bank Working Papers are published to communicate the results of the Bank’s work to thedevelopment community with the least possible delay. The manuscript of this paper thereforehas not been prepared in accordance with the procedures appropriate to formally-edited texts.Some sources cited in this paper may be informal documents that are not readily available.
The findings, interpretations, and conclusions expressed herein are those of the author(s)and do not necessarily reflect the views of the International Bank for Reconstruction and Devel-opment/The World Bank and its affiliated organizations, or those of the Executive Directors ofThe World Bank or the governments they represent.
The World Bank does not guarantee the accuracy of the data included in this work. Theboundaries, colors, denominations, and other information shown on any map in this work donot imply any judgment on the part of The World Bank of the legal status of any territory orthe endorsement or acceptance of such boundaries.
The material in this publication is copyrighted. Copying and/or transmitting portions orall of this work without permission may be a violation of applicable law. The International Bankfor Reconstruction and Development/The World Bank encourages dissemination of its workand will normally grant permission promptly to reproduce portions of the work.
For permission to photocopy or reprint any part of this work, please send a request withcomplete information to the Copyright Clearance Center, Inc., 222 Rosewood Drive, Danvers,MA 01923, USA, Tel: 978-750-8400, Fax: 978-750-4470, www.copyright.com.
All other queries on rights and licenses, including subsidiary rights, should be addressedto the Office of the Publisher, The World Bank, 1818 H Street NW, Washington, DC 20433, USA,Fax: 202-522-2422, email: [email protected].
ISBN-13: 978-0-8213-7266-1eISBN: 978-0-8213-7267-8ISSN: 1726-5878 DOI: 10.1596/978-0-8213-7266-1
Silvana Tordo is Senior Energy Economist in the Oil, Gas, and Mining Policy Division of theWorld Bank.
Library of Congress Cataloging-in-Publication Data has been requested.

Contents
Abstract v
Acknowledgments vii
1. Introduction 1
2. The Life Cycle of a Petroleum Project 3
3. Legal Arrangements in the Petroleum Industry 7
4. Fiscal Regimes for the Petroleum Sector: Tax and Non-Tax Instruments 11
5. Designing Efficient Fiscal Systems 13
6. Fiscal Systems’ Measures and Economic Indicators 17
7. Designing Petroleum Fiscal Systems: Issues to be Considered 21
8. Conclusion 29
APPENDIXES
A Key Elements of Successful Petroleum Legal Frameworks 35
B Tax and Non-Tax Components of Petroleum Fiscal Systems 37
C Government Take 47
D Economic Impact of Alternative Fiscal Parameters 49
E Government Take and Project IRR at Different Levels of Cost Recovery Limit 55
F Field A, Fiscal Model 1: Alternative Triggers 61
G Government Take and Project IRR at Different Price Levels 63
H Government Participating Interest 69
Bibliography 71
LIST OF TABLES
1. Key Features of Concessionary and Contractual Systems 9
2. Main Differences between Concessionary Systems and Production Sharing Contracts 10
3. Flexible, Neutral, and Stable Fiscal Regime 14
4. Key Project Parameters 22
5. Fiscal System Indices 23
6. Contractor’s and Host Government’s NPV Variation 25
iii

7. Break-Even Price 27
8. Royalties 37
9. Ring Fencing 38
10. Corporate Income Tax 39
11. Resource Rent Tax 40
12. Import and Export Duties 41
13. Value Added Tax 41
14. Surface Taxes 42
15. Bonuses 42
16. Government Participation 43
17. Cost Recovery Limit 44
18. Profit Oil Split 44
19. Foreign Exchange Controls 45
20. Environmental Taxes and Bonds, and Other Performance Bonds 45
21. Local Content Obligations 46
22. Economic Impact of Alternative Fiscal Parameters—Field A 50
23. Economic Impact of Alternative Fiscal Parameters—Field B 51
24. Economic Impact of Alternative Fiscal Parameters—Field C 52
25. Economic Impact of Alternative Fiscal Parameters—Field D 53
26. Government Participating Interest—Field A 70
LIST OF FIGURES
1. The Project Cycle 4
2. Petroleum Legal Arrangements 8
LIST OF GRAPHS
1. Government Take and Project IRR at Different Levels ofCost Recovery Limit—Field A 56
2. Government Take and Project IRR at Different Levels ofCost Recovery Limit—Field B 57
3. Government Take and Project IRR at Different Levels ofCost Recovery Limit—Field C 58
4. Government Take and Project IRR at Different Levels ofCost Recovery Limit—Field D 59
5. Government Take and Project IRR at Different Price Levels—Field A 64
6. Government Take and Project IRR at Different Price Levels—Field B 65
7. Government Take and Project IRR at Different Price Levels—Field C 66
8. Government Take and Project IRR at Different Price Levels—Field D 67
iv Contents
v
Abstract
Although host governments and the investors may share one common objective—thedesire for the project to generate high levels of revenue—their other goals are not
entirely aligned. Host governments aim to maximize the rent for their country over time,while achieving other development and socioeconomic objectives. Investors’ aim is to ensurethat the return on investment is consistent with the risk associated with the project, and withtheir corporations’ strategic objectives. To reconcile these often conflicting objectives, moreand more countries rely on transparent institutional arrangements and flexible, neutral fiscalregimes. This paper examines the key elements of the legal and fiscal frameworks utilized inthe petroleum sector and aims to outline desirable features that should be considered in thedesign of fiscal policy with the objective of optimizing the host government’s benefits, takinginto account the effect that this would have on the private sector’s investment.


vii
Acknowledgments
The author thanks Daniel Johnston, Charles P. McPherson, Hossein Razavi, Robert W.Bacon, and Peter van der Veen for their constructive comments, and Randy Hecht for
her helpful edits and suggestions.


CHAPTER 1
Introduction
The global market for oil and gas exploration has evolved to the point that much ofthe world’s surface open to exploitation has taken on some of the characteristicsof a commodity. Governments compete for capital and technology to develop their
hydrocarbon sector. In order to devise and apply the appropriate policies, strategies andtactics, each must assess its position in the global marketplace and evaluate its particularsituation, boundary conditions, concerns and objectives. Companies look for investmentopportunities that suit their corporate strategies and risk-reward profiles. The initial deci-sion to invest and the resulting allocation of revenue and benefits are greatly influencedby the content of existing legal arrangements and fiscal policies.
The fiscal regime can be used to convert a government’s policy into economic signalsto the market, and influence investment decisions, provided that the framework is clear, isnot changed retroactively, and does not discriminate among the actors. Several countrieshave used favorable taxation of oil and gas to support the development of the sector in addi-tion to relevant sector reforms. The challenge of an efficient fiscal system is to induce max-imum effort from the oil companies while ensuring that the host government is adequatelycompensated.
In designing a fiscal system, a government has to answer the following questions: Whatis the effect of the fiscal regime on oil/gas output? Does it discourage the development of mar-ginal fields? Does it influence the pace of development? Does it favor early abandonment?Is it insensitive to oil/gas price and cost variation? In other words, how flexible, neutral andstable is the fiscal regime?
Many fiscal systems around the world make use of sliding scales for the determinationof at least one of the following parameters: royalty, bonuses, profit oil/gas split, cost recov-ery, and taxes. Sliding scales introduce flexibility into the system by allowing it to respond
1

to changes in project variables. Unfortunately, the vast majority of these sliding scales arelinked to daily or cumulative production targets. Hence they are insensitive to changes ineconomic variables. No wonder that the persistently high level of oil prices in recent yearshas pushed many host governments to seek improvement in their contractual terms.
High oil prices have also triggered higher demand for services and equipment, whichin turn has increased their cost.1 As many fiscal systems2 were designed when oil prices werein the US$15-18 barrel range and finding and development costs were US$5-9 barrel, thesesystems no longer efficiently capture the projects’ economic rent.
High risks and long project cycles are key elements of the oil and gas industry. As riskscan differ substantially by project and over time, an efficient fiscal system needs to be flexi-ble enough to allocate risks equitably, thus minimizing the need for and cost of negotiationsor renegotiations. Such a system would be, at least in theory, more stable and better suitedto mitigating the investment risk. If correctly designed, the fiscal system has the potential toreduce the procyclicity of investment: a less variable flow of investment is more likely tosupport the creation of spare capacity, thus reducing price volatility.
In today’s competitive market, many diverging interests must be recognized and accom-modated to establish an effective and attractive legal and fiscal framework for hydrocarbonexploration and production. No ideal or model regime is available for policy makers to adopt.Each country’s circumstances, needs, and objectives define the key features of an appro-priate legal and fiscal framework. This paper provides an overview of the key features ofpetroleum fiscal systems around the world and attempts to outline desirable features fordesigning a fiscal regime for the management of a country’s petroleum endowment.Chapters 2 and 3 provide background material on, respectively, the stages of an oil and gasproject and the type of legal arrangements normally used in the petroleum sector. Therelative advantages and disadvantages of the tax and non-tax instruments used in petroleumfiscal regimes are discussed in Chapter 4. Chapter 5 outlines the features of successful fiscalregimes, while system measures and economic indicators are described in Chapter 6. Finally,in Chapter 7, a sensitivity analysis is used to illustrate some typical fiscal systems’ design issues.
2 World Bank Working Paper
1. The World Offshore Oil and Gas Products and Spend Forecast 2007-11, published by Douglas-Westwood, predicts this trend to continue over the next five years, with particular emphasis on deepwater floating and subsea production solutions. Operating costs are also expected to increase by morethan 50 percent by 2011 as a result of increasing output and producing a higher share of more expensiveoil. The impact will differ among regions.
2. Including some R-Factor and RoR-based systems. For a definition of R-Factor and RoR see Chapter 4.

CHAPTER 2
The Life Cycle of a Petroleum Project
The stages of a typical oil and gas project can be described as follows:
1. Licensing: In most cases the host government grants a license (lease, or block area)or enters into a contractual arrangement with an oil company or group of oil com-panies to explore for and develop a field without transferring the ownership of themineral resources.
2. Exploration: After acquiring the rights, the oil company carries out geological andgeophysical surveys such as seismic surveys and core borings. The data so acquiredare processed and interpreted and, if a play appears promising, exploratory drillingis carried out. Depending on the location of the well a drilling rig, drill ship, semi-submersible, jack-up, or floating vessel will be used.
3. Appraisal: If hydrocarbons are discovered, further delineation wells are drilled toestablish the amount of recoverable oil, production mechanism, and structure type.Development planning and feasibility studies are performed, and the preliminarydevelopment plan is used to estimate the development costs.
4. Development: If the appraisal wells are favorable and the decision is made to pro-ceed, then the next stage of development planning commences using site-specificgeotechnical and environmental data. Once the design plan has been selected andapproved, contractors are invited to bid for tender. Normally, after approval ofthe environmental impact assessment by the relevant government entity, devel-opment drilling is carried out and the necessary production and transportationfacilities are built.
3

5. Production: Once the wells are completed and the facilities are commissioned, pro-duction starts. Workovers3 must be carried out periodically to ensure the contin-ued productivity of the wells, and secondary and/or tertiary recovery4 may be usedto enhance productivity at a later time.
6. Abandonment: At the end of the useful life of the field, which for most structuresoccurs when the production cost of the facility is equal to the production revenue(the so-called “economic limit”), a decision is made to abandon. For a successfulremoval, operators generally begin planning one or two years prior to the planneddate of decommissioning (or earlier depending on the complexity of the operation).
Figure 1 provides a graphic representation of the project cycle.
The risk profile of the project changes during its life cycle. Risks can be grouped underthree main categories: geological, financial, and political. In general terms, while geologi-cal risk begins to diminish after a discovery, the political and financial risks intensify. Oneof the reasons for this is that the bargaining power and relative strength of the investors’and the host government’s positions shift during the cycle of petroleum exploration anddevelopment. By the time production commences, capital investment is a sunk cost, andfacilities installed in foreign countries represent a source of vulnerability to the investor.
4 World Bank Working Paper
3. Any operation performed on a well subsequent to its completion.4. In the first stage of hydrocarbon production natural reservoir energy, such as gasdrive, waterdrive
or gravity drainage, displaces hydrocarbons from the reservoir into the wellbore and up to surface. Ini-tially, the reservoir pressure is considerably higher than the bottomhole pressure inside the wellbore. Thishigh natural differential pressure drives hydrocarbons toward the well and up to surface. However, as thereservoir pressure declines because of production, so does the differential pressure. When the reservoirpressure is so low that the production rates are not economical, or when the proportions of gas or waterin the production stream are too high, secondary or tertiary recovery methods may be used. Secondaryrecovery consists of injecting an external fluid, such as water or gas, into the reservoir through injectionwells located in rock that has fluid communication with production wells. The purpose of secondaryrecovery is to maintain reservoir pressure and to displace hydrocarbons toward the wellbore. Tertiaryrecovery (or enhanced oil recovery) involves the use of sophisticated techniques that alter the originalproperties of the oil. Enhanced oil recovery can begin after a secondary recovery process or at any timeduring the productive life of an oil reservoir. Its purpose is not only to restore formation pressure, butalso to improve oil displacement or fluid flow in the reservoir.
Figure 1. The Project Cycle
Production
Start of Production
Lease Exploration Development Closure Post-Closure
Recovery
End of Production
Lease is returned

Although many of the variables that affect the profitability of a petroleum project arebeyond the control of both the host government and the investing companies, the hostgovernment can take actions to minimize uncertainty. Options include providing poten-tial investors with access to existing geological and geophysical data; strengthening macro-economic and fiscal stability; improving transparency and the rule of law; promotingcontract stability; and signing/ratifying relevant international conventions.
Project uncertainty correlates directly with the cost of the investment: reducing uncer-tainty results in a reduction of the cost of capital, which in turn increases the rent potentiallyavailable for taxation. Risk management is a key feature of the oil industry. Companieshedge against risk by investing in a diverse portfolio of projects and by involving multiplepartners. Countries may not have the same ability to diversify their investments. Hence theyhedge against risk by establishing flexible fiscal systems5 and transferring part of the risk tooil companies.
Fiscal Systems for Hydrocarbons 5
5. See Chapter 5 below.


CHAPTER 3
Legal Arrangements in the Petroleum Industry
The legal basis for hydrocarbon exploration, development and production is nor-mally established in a country’s constitution.6 Normally, the hydrocarbon law,formulated at parliamentary level, sets out the principles of law, while those pro-
visions that do not affect principles of law, or that may need periodic adjustments (suchas technical requirements, administrative procedures, and administrative fees), are set inregulations.7 Governments grant exploration, development and production rights in par-ticular areas or blocks by means of concessions or contracts, depending on their legal sys-tems. Where no hydrocarbon law exists, comprehensive contractual agreements betweenhost governments and investors are used.8
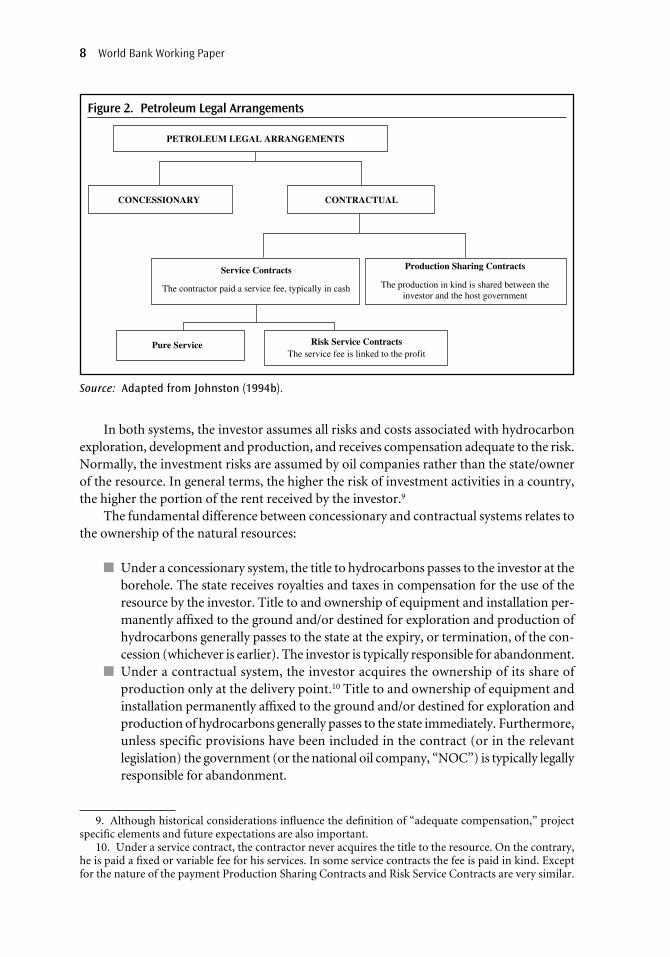
Various legal systems have been developed to address the rights and obligations of hostgovernment and of private investors. These can be grouped under two families: conces-sionary systems and contractual systems (see Figure 2).
7
6. The consistency of the legal framework with the constitutional foundation affects the security andstability of the legal framework. This issue is particularly significant because many countries’ constitutionsdiffer substantially in the degree to which they recognize or guarantee private property rights or prohibitprivate parties or foreigners from acquiring property rights in general and mineral rights in particular; vestthe authority to grant petroleum rights in the state or provincial governments or agencies rather than thenational government, vest the authority to regulate specific matters in special agencies (i.e., environmentprotection) or in the executive branch (for example, taxation, foreign exchange, employment, and so on)or in the judiciary (settlement of disputes). Due to the capital intensive and long term nature of petroleumprojects, certainty of rights is particularly important for private investors.
7. These are normally issued at the executive or ministerial level and do not require the legislativebranch’s approval.
8. This approach may be favored by those countries that face the uncertainty of entering the sector forthe first time or in cases where the importance of the petroleum activity may not justify the design ofunique policy regimes.
8 World Bank Working Paper
9. Although historical considerations influence the definition of “adequate compensation,” projectspecific elements and future expectations are also important.
10. Under a service contract, the contractor never acquires the title to the resource. On the contrary,he is paid a fixed or variable fee for his services. In some service contracts the fee is paid in kind. Exceptfor the nature of the payment Production Sharing Contracts and Risk Service Contracts are very similar.
Figure 2. Petroleum Legal Arrangements
PETROLEUM LEGAL ARRANGEMENTS
CONCESSIONARY CONTRACTUAL
Pure Service
Service Contracts
The production in kind is shared between theinvestor and the host government
The contractor paid a service fee, typically in cash
Production Sharing Contracts
Risk Service ContractsThe service fee is linked to the profit
Source: Adapted from Johnston (1994b).
In both systems, the investor assumes all risks and costs associated with hydrocarbonexploration, development and production, and receives compensation adequate to the risk.Normally, the investment risks are assumed by oil companies rather than the state/ownerof the resource. In general terms, the higher the risk of investment activities in a country,the higher the portion of the rent received by the investor.9
The fundamental difference between concessionary and contractual systems relates tothe ownership of the natural resources:
■ Under a concessionary system, the title to hydrocarbons passes to the investor at theborehole. The state receives royalties and taxes in compensation for the use of theresource by the investor. Title to and ownership of equipment and installation per-manently affixed to the ground and/or destined for exploration and production ofhydrocarbons generally passes to the state at the expiry, or termination, of the con-cession (whichever is earlier). The investor is typically responsible for abandonment.
■ Under a contractual system, the investor acquires the ownership of its share ofproduction only at the delivery point.10 Title to and ownership of equipment andinstallation permanently affixed to the ground and/or destined for exploration andproduction of hydrocarbons generally passes to the state immediately. Furthermore,unless specific provisions have been included in the contract (or in the relevantlegislation) the government (or the national oil company, “NOC”) is typically legallyresponsible for abandonment.

Fiscal Systems for Hydrocarbons 9
Table 1. Key Features of Concessionary and Contractual Systems
Concessionary Systems
• In its most basic form, a concessionarysystem has three components: royalty;deductions (such as operating costs,depreciation, depletion and amortization,intangible drilling costs); and tax.
• The royalty is normally a percentage ofthe proceeds of the sale of hydrocarbon11.It can be determined on a sliding scale,the terms of which may be negotiable orbiddable, and paid in cash or in kind. Theroyalty represents a cost of doing businessand is thus tax-deductible.
• The definition of fiscal costs is describedin the legislation of the country or in theparticular concession agreement. Royaltiesand operating expenditures are normallyexpensed in the year in which they occur,and depreciation is calculated accordingto applicable legislation. 12 Some countriesallow the deduction of investment credits,interest on financing, and bonuses.
• The taxable income under a concession-ary agreement may be taxed at the coun-try’s basic corporate tax rate. Specialinvestment incentive programs and spe-cial resource taxes may also apply. Taxlosses are normally carried forward untilfull recovery. 13
Contractual Systems
• Under a production sharing contract (PSC)the contractor receives a share of productionfor services performed. In its most basicform, a PSC has four components: royalty,cost recovery, profit oil, and tax.
• Similar to concessionary systems. In addition,normally royalties are not cost recoverable.
• Fiscal costs are defined and rules for amor-tization and depreciation are established in the legislation of the country or in theparticular PSC. After payment of royalties,the contractor is allowed to recover costs in accordance with contractual provisions (a cost recovery limit may apply). Theremainder of the production is split betweenthe host government and the oil company ata stipulated (often negotiated) rate.
• Corporate taxes may apply or may be paidby the host government or its NOC on behalfof the contractor. Income tax is calculatedon taxable income (revenue net of royalties,allowable costs, and government share of profit oil). Tax losses are normally carried forward until full recovery.13 Inmost countries, when cost recovery limitsexist, the company’s share of profit oil in any given accounting period is not thetaxable base14.
11. In some cases the royalty is calculated on net production. Some countries use fiscal prices for thepurpose of royalty and corporate tax calculation. These prices are defined periodically and are normallylinked to international market prices. The majority of the countries refer to arms length sales to third par-ties. Whether or not a country uses fiscal prices, deductions or additions are normally allowed to take intoaccount differences in quality between the reference crude (gas) and the particular crude (gas) as well astransport costs.
12. The exact manner in which costs are capitalized or expensed depends on the tax regime of thecountry and the manner in which rules for integrated and independent producers vary. The successful-efforts and full-cost methods used in oil and gas accounting are discussed in detail in Gallun et al., 2001.In general terms, if costs are capitalized, they may be expensed through the statutory amortization anddepreciation schedule, through abandonment, impairment, or depletion. If they are expensed, they aretreated as period expenses and charged against revenue in the current period. The primary differencebetween the two methods is the timing of the expense against revenue and the manner in which costs areaccumulated and amortized.
13. Several countries limit the number of years for tax loss carry forward.14. In fact, the company may receive a share of profit oil but may not be in a taxable position.

Given the risky nature of the industry, in both types of legal systems the investor’s abil-ity to share the risk by transferring all or part of its rights to other investors, and the objec-tivity and transparency of the conditions for government approval or denial of suchtransfer (including any relevant performance guarantee) are an important element of theoverall attractiveness of a country’s regime.
The key features of concessionary and contractual systems are summarized in Table 1.Table 2 outlines the main differences between concessions and production sharing contracts.
10 World Bank Working Paper
Table 2. Main Differences between Concessionary Systems and Production Sharing Contracts
Ownership of nation’s mineral resources
Title transfer point
Company entitlement
Entitlement percentage
Ownership of facilities
Management and control
Government participation (carried working interest)
Ring fencing
Production Sharing Contracts
Held by sovereign state
At the export point
Cost oil/gas + profit oil/gas
Typically 50–60%
Held by the state
More direct government control and participation
More likely
More likely
Concessionary Systems
Held by sovereign state
At the wellhead
Gross production less royalty
Typically 90%
Held by company
Typically less government control
Less likely
Less likely
Source: Johnston (1994b).
Although in most countries, all matters related to petroleum exploration, developmentand production tend to be governed by sector specific legislation and regulation, countriesthat have recently reformed their hydrocarbon sector have shown a preference for theestablishment of modular legal frameworks. In these cases, all matters related to hydro-carbon rights and their use are governed by the hydrocarbon law/regulations; all mattersrelating to taxation are defined in the tax code/regulations; all issues relating to environ-ment protection are defined in the environmental law/regulations; and so on. Thus, thehydrocarbon law incorporates other laws by reference. Modularity increases transparencyand accountability, reduces administration costs, and facilitates compliance.15 The topicstypically addressed in modern legal frameworks are summarized in Appendix A.
15. A clear, simple and non-discretionary legal and regulatory framework is an important factor forattracting foreign investment. This affects the entire value chain from the award of exploration and pro-duction rights to the disclosure of information that affects the citizenry. There are various ways of improv-ing the transparency in the management and oversight of the sector: the standardization of the terms ofexploration and production, the reduction of the discretion of the administrative authorities, the simpli-fication of awarding and permitting procedures, the development of an efficient and functioning opentitle system, the adoption of standardized form of agreements, the predefinition of standard shape formof blocks, the granting of greater operating freedom to the contractors, the adherence to internationalarbitration (in particular where the local court system does not provide sufficient guarantees), and therespect of international disclosure practice are examples in this direction.

CHAPTER 4
Fiscal Regimes for the Petroleum Sector
Tax and Non-Tax Instruments
Petroleum activities around the world are subject to a great variety of taxation instru-ments. These include taxes that apply to all other sectors of the economy and taxesthat are specific to the oil industry. In addition, non-tax forms of rent collection
(like surface fees, bonuses and production sharing) are typically used.Special provisions are often included in petroleum fiscal regimes to modify the timing
or magnitude of the revenue appropriations. These provisions are normally intended asincentives designed to attract investors, or to accommodate unique attributes of a petro-leum asset, or to influence the choices of the investors toward specific public policy goals.
The most commonly used special provisions include:
11
Accelerated capital cost allowances
Depletionallowances
Assets are depreciated in many ways over their expected life (usefullife of equipment, economic life of the reservoir). The methods used inthe industry are: (a) straight-line (equal annual deductions); (b) declin-ing balance (straight-line depreciation calculated for the remainingvalue of the asset each year); (c) double declining balance (doublesstraight-line depreciation for the remaining value the asset each year);(d) sum of year digits (based on an inverted scale that is the ratio of thenumber of digits in a given year divided by the total of all years digits);and (e) unit of production (the capital cost of equipment, after deduc-tion of the accumulated depreciation and of the salvage value, is mul-tiplied by the ratio between the total production in a year and therecoverable reserves remaining at the beginning of the tax year).
The depletion allowance is the deduction from gross income allowedto investors in exhaustible commodities (such as minerals, oil, or gas)for the depletion of the deposits. The theory behind the allowance isthat an incentive is necessary to stimulate investment in this high-riskindustry: as the reservoir depletes, the company will need to under-take more exploration to find new reservoirs. The depletion allowance

12 World Bank Working Paper
Interest deduction rules
Loss carry forward
Investment credits
Tax holidays
Stability provisions
is meant to subsidize further exploration. Since the industry is a globalone, it is quite likely that the depletion allowance may be used to sub-sidize exploration in competing countries. For this among other rea-sons, depletion allowances are granted/have been granted by only afew countries: Barbados, Canada, Pakistan and the USA. The FilipinoParticipation Incentive Allowance—FPIA - is similar to a depletionallowance.
Project financing is quite common for large projects or for small oilcompanies. Normally interests on loans are deductible from taxableincome and qualify for cost recovery. Inter-company interests may alsobe cost recoverable and tax deductible, if calculated on an arms-lengthbasis.
This refers to the ability of a company to “carry forward” losses from oneyear to offset tax liability in future years. When limitations apply the losscan be carried forward for a set number of years (normally 5 to 7) afterwhich the benefit expires. In most cases, unlimited loss carry forwardis granted.
In some countries, governments provide an incentive to investors byallowing them to recover an additional percentage of tangible capitalexpenditure (also known as investment uplifts or “allowances” andinvestment credits). In some cases investment credits can be taxable.
When capital investment in a project is considerable, the host govern-ment may grant tax holidays to investors. For example, Myanmaroffers a three year tax holiday period on income tax in PSC(www.energy.gov.mm/MOGE_3.htm). Tax holidays provide a valuableadvantage to investing companies that can accelerate the projectpayback. On the other hand, host governments should be careful inutilizing this mechanism to attract investors.
See Chapter 5.
A variety of costs are also imposed on companies that affect the profitability of theiroperations. Some are fairly common while other reflect specific countries’ conditions.These costs include inter-company services, valuation of oil and gas, foreign exchangeregulations, domestic market obligations, government equity, performance bonds, landowner compensations, local content obligations, and requirement intended to ensure goodenvironmental practices and adequate site reclamation funding.
A description of the main tax and non tax instruments commonly used in the petro-leum industry is given in Appendix B, Tables 7 to 19.

CHAPTER 5
Designing Efficient Fiscal Systems
Although the host government and the investor may share one common objective—the desire for the project to generate high levels of revenue their other objectivesare not entirely aligned:
■ Host governments aim to obtain the maximum value (not volume) for theircountries over time in terms of net receipts for treasury. Their goal is to maxi-mize the wealth from their natural resources and, at the same time, attract for-eign investment. Host governments also have development and socioeconomicobjectives, such as job creation, transfer of technology, and development of localinfrastructure.
■ Oil companies aim to ensure that the return on capital is consistent with the riskassociated with the project and with the strategic objectives of the corporation.
From the government’s standpoint, this means the design of a tax system that:
(i) supports macroeconomic stability by providing predictable and stable tax revenueflows;
(ii) permits capturing a greater share of the revenue during periods of high profits;(iii) avoids the introduction of distorting effects through the fiscal instruments;(iv) maximizes the present value of revenue receipts by providing for appropriations
during the early years of production; and(v) is neutral and encourages economic efficiency as a yardstick.
13

Advantages
• One of the most important advantages of establishing aflexible structure (a progressive mechanism for rentextraction) is its stability over time: as market and projectconditions change over time,18 flexible fiscal systems limitthe need for renegotiation.
• The advantage of a neutral fiscal regime is its economic effi-ciency. A neutral tax does not impact resource allocation.With respect to the investing company, a tax is neutral whenit leaves the pre-tax ranking of possible investment outcomesequal to the post-tax ranking. With respect to a particularindustry, a tax is neutral when it does not divert investmentsto or from that industry.
• Stability clauses can be grouped under two categories:“freezing clauses” that maintain the contract and/or fiscalterms unchanged for the duration of the contract or for a cer-tain period of time; and “equilibrium clauses” that allow foran adjustment of the contractual terms over time so that achange in circumstances does not damage or benefit oneparty to the advantage or detriment of the other.19
• In industries with long time cycles and substantial up frontinvestments, stable and predictable contractual and fiscalterms are an important consideration in ranking investmentopportunities, with obvious effects on a country’s futureprospects. This is particularly true for the oil and gas industry,in which long project cycles are coupled with great uncer-tainty with regard to resource prices and project output.
• The stability of the fiscal regime also impacts business confi-dence and affects the level of investment in and pace ofdevelopment of existing projects.
• Contract and fiscal stability clauses are used in both conces-sionary and contractual systems. According to a recent study,of 110 countries analyzed, 77 percent offered fiscal stabilityprotection.20 In a recent survey conducted by Deloitte onbehalf of the Aberdeen and Grampian Chamber of Com-merce, contract and fiscal stability was indicated as primaryfactor in determining business confidence and rankinginvestment opportunities.21
What do flexibility, neutrality and stability mean?
• A “flexible” fiscal regimeis one that provides thegovernment with an ade-quate share of economicrent under varying condi-tions of profitability.16
This type of regime tar-gets the economic rent.17
• A “neutral” fiscal regimeneither encourages overinvestment nor detersinvestments that wouldotherwise take place.
• A “stable” fiscal regime isone that does not changeover a certain period oftime, or one whosechanges are predictable.
14 World Bank Working Paper
16. There are various ways to do this. For example, one could envisage a progressive income tax anda sliding scale royalty in the case of concessionary systems; or a progressive government take linked topetroleum prices or project rate of return in the case of production-sharing arrangements. The further“downstream” a government goes to extract the rent, the less regressive the system. Signature bonuses(which are paid before a discovery is made) and royalties (which are paid whether or not a field yields apositive result) are the most regressive forms of rent extraction.
17. A fiscal regime that targets the extra revenue that is not required to persuade the investor to con-tinue with the investment and that, if taxed away, will still allow the company to realize an acceptablereturn on its investment.
18. One of the most important elements of profitability of a project is the oil price level. The variabil-ity and volatility of oil prices provide for the possibility that even projects with normal profits can expe-rience periods where excess profits are generated.
Table 3. A Flexible, Neutral, and Stable Fiscal Regime

From the investing company’s standpoint this means the search for a tax system thatprovides for:
(i) a minimum number of front-end loaded non profit-sensitive taxes;(ii) the ability to repatriate profits to shareholders in their home countries; and
(iii) an overall policy environment that is transparent, predictable, stable and based oninternationally recognized industry standards and the rule of law so that decisionscan be made with reasonable confidence.
The use of flexible, neutral and stable fiscal regimes facilitates the reconciliation ofthese objectives. The characteristics of these regimes are summarized in Table 3.
In addition to the above described characteristics, the host government needs to takeinto consideration its relative position vis-à-vis other countries. In a purely competitiveworld, countries with favorable geologic potential, high wellhead prices, low developmentcosts, and low political risk will tend to offer tougher fiscal terms than those with less favor-able geology, low wellhead prices, high development cost, and high political risk. The eco-nomic strength and political stability of the country, oil supply balance, regional marketdemands, global economic conditions, and financial health of the petroleum sector alsoinfluence fiscal terms. It is commonly accepted that the level of government take22 isinversely proportional to the quality and availability of investment opportunities. How-ever, countries with harsh fiscal regimes or the greatest success probability provide no guar-antees in the profitability of the project. Because the fiscal terms are only one of theelements that determine the profitability of a project, a “tough” contract may be highlyprofitable, while a very “favorable” contract may not be.23
It is important to note that good fiscal design without complementary institutionalstructures may still not achieve the desired goals: design needs to be within the administra-tive and audit capacity of the relevant institutions. Therefore, a simpler system may be moreviable than a theoretically ideal but complex to manage system.24 This is particularly impor-tant in countries that are new to the oil industry and/or have significant capacity constraints.
Fiscal Systems for Hydrocarbons 15
19. For a summary of the law and practice with respect to renegotiation of long-term internationalinvestment agreements in the natural resources and energy sector see Abba Kolo & Thomas W. Walde,Renegotiation and Contract adaptation in the International investment projects: Applicable Legal Prin-ciples & Industry practices, Transnational Dispute Management, Volume 1, Issue 01, February 2004.
20. As noted by Baunsgaard (2001), the data refers to contracts in existence up until 1997. Since thenmore and more countries have been offering fiscal stability clauses.
21. See the Aberdeen and Grampian Chamber Oil and Gas Survey, 2004–05. On the importance offiscal stability the report concludes: “The last two years have witnessed an upturn in North Sea activityalong with increased capital investment and drilling activity. Our first three surveys charted this rise inactivity and the parallel rise in business confidence. A recurrent theme throughout previous surveys hasbeen the critical importance of a stable tax regime if this rise in North Sea activity is to continue. The Gov-ernment’s decision to increase the supplementary North Sea oil charge from 10% to 20% jeopardizes thefiscal stability essential to sustain activity, encourage investment and maintain the North Sea’s longevity.As we predicted, we can now see the first signs of the impact the Chancellor’s pre-budget report has hadon investment plans for the UK continental shelf.”
22. The government take is the host government’s share of the revenue streams associated with a par-ticular project. It is normally expressed in percentage terms. See Chapter 6 below.
23. This is one of the reasons used to argue in favor of project specific fiscal terms as opposed to stan-dard, sector wise, non negotiable fiscal terms (Johnston 1994).
24. Royalty and tax systems, even with sliding scale features, are used by many countries, and are usu-ally quite easy to manage.


CHAPTER 6
Fiscal Systems’ Measures and Economic Indicators
To evaluate a fiscal system, governments and oil companies use different measures:
■ Oil companies aim to optimize their portfolio of assets. They use economic mea-sures to compare investment opportunities worldwide and to assess their relativerisk-reward profile. During the economic life of an asset, oil companies monitorthe revenue generated by it to verify that they have covered the capital investmentand expenditures and that the return on capital is consistent with the risk associ-ated with the particular asset and with the strategic objectives of the corporation.
■ Host governments are interested in evaluating whether a fiscal system responds to itsintended objectives. To do so, at a project level host governments use economic andsystem measures to assess whether the benefits—financial and social—derived fromthe project are consistent with its risk level and with the objectives of the government’ssector policy. At a country level host governments monitor the impact of the revenueflow generated by the oil sector as a whole on the key macro-economic indicators(mainly inflation, GDP growth, balance of payments).25
Economic and fiscal systems measures are project-specific quantities that vary withnumerous system parameters unique to the project (including, but not limited to, the size
17
25. In practice, governments in resource rich developing countries often suffer from capacity con-straints that limit their ability to set up and implement rigorous monitoring systems.

and quality of discoveries,26 the development and operational plan of the operator, the coststructure; the financing costs, discounts or premia for the particular crude oil stream27), aswell as non-project specific variables (such as crude oil prices, inflation, currency exchangerates, local and global economic conditions, and regulatory changes). Hydrocarbon price,development cost, technological improvements, demand-supply relations, country risk,and the corporate strategy, all impact investment planning. Hence the accurate com-putation of the economic and fiscal system measures associated with a field largelydepends on the reliability of the assumptions.28 In effect, only at the end of a field’s eco-nomic life, when all revenue, cost, royalty and tax data are known, can the profitabilityand the division of profits between the host government and the investors be reliablydetermined. In practice, due to their commercial sensitivity, cash flow and cost data arevery rarely made public.
Various economic indicators are used to assess the performance of a project. The mostcommon are the net present value of the project’s cash flow (NPV),29 the internal rate of return(IRR),30 and the profitability ratio (PR).31 The NPV provides an evaluation of the project’snet worth to the investor in absolute terms, while the IRR and the PR are relative measuresused to rank projects for capital budgeting. Economic values are not intended to be inter-preted on a standalone basis, but should be used in conjunction with other system mea-sures and decision parameters. A combination of indicators is usually necessary to adequatelyevaluate a contract’s economic performance.32
18 World Bank Working Paper
26. A detailed and realistic field description is the first and most important estimate that must be made:the size, shape, productive zones, fault blocks, drive mechanisms, etc. of the reservoir must be estimatedwith as much accuracy as possible since they determine the capacity of the structure and the number andlocation of wells. Various techniques (such as geologic conditions at reservoir level and decline curveanalysis) are available to estimate production rates. However, forecast production is only used as a guide-line since investment activity can dramatically alter the form of the production curve as well as recover-able reserves.
27. See R.Bacon and S.Tordo, Crude oil price differentials, October 2005.28. It is important to underscore that the project’s stage of development impacts the accuracy of the
estimates and the uncertainty associated with the economic outcome of the field. On average, initial costand production estimates may be over or under estimated by 25–50 percent compared with actual num-bers; conceptual development plan estimates are normally more accurate (plus or minus 15–25 percent—Minerals Management Service, March 2004).
29. The NPV is the present value of expected future cash flow of a project. The discount rate shouldbe a function of the riskiness of the estimated cash flows. In reality, companies often use a “hurdle rate”which represents the minimum return that the particular company is willing to accept in order for it toinvest in the project. Each company has a unique risk-reward profile, hence uses a specific discount rate.The choice of what discount factor to use is an important decision for companies evaluating projects sinceselecting a high rate may result in “missing” good investment opportunities, while selecting a low rate mayexpose the firm to unprofitable or risky investments (see Allen and Seba 1993; Deluca 2003; Ehrhardt 1994).
30. The IRR measures the relative attractiveness of a project. In general terms, projects that presenthigher IRR should be preferred. Due to its limitations the IRR is normally used in conjunction with otherprofitability indices. For an in depth discussion of the IRR and of other commonly used financial mea-sures of profitability see Brealey and Myers (1991).
31. The PR is calculated as the ratio between the NPV of the sum of project’s cash flow and total capitalinvested in the project to the NPV of the total capital invested in the project. It measures the profitability perdollar invested and is used by companies to compare projects around the world.
32. For an extensive description of project evaluation and project financing techniques, see inter alia,Brealey and Myers (1991), Dougherty (1985), Ehrhardt (1994), Finnerty (1996), Mian (2002), and Woods(1993).
One indicator frequently referred to in sector literature is the division of profitsbetween companies and government (the “take”). The take is a fiscal statistic as opposed toan economic measure. Because the take does not provide a direct indication of the econo-mic performance of a field, it generally matters more to the host government than to the oilcompanies.
The take is often a negotiated quantity that depends upon the strength, knowledge,experience, and bargaining position of the oil company and host government, the percep-tion of the risk associated with the field development at the time the contract was written,and the availability of opportunities worldwide.
Unlike economic measures, which are generally well-established, general confusion sur-rounds the application and interpretation of take.33 In this paper, the government take isdefined as the government’s percentage of pre-tax project net cash flow adjusted to take intoaccount any form of government participation. The government take can be calculated indiscounted or undiscounted value.34
The take statistics for a given country offer a first frame of reference to assess whether ornot the fiscal terms applicable to a contract under negotiation are in line with those that alreadyexist in that country (Johnston 2003), or as benchmark to determine the competitiveness of acountry’s fiscal terms.35 However, comparing the take of different projects and/or differentcountries is a very difficult and often misleading exercise because:
■ Calculating the take at project level requires: (i) ex-ante, the ability to forecast theexpected cash flow for the project. As noted above, estimating the cash flow of aprospective project is highly uncertain, and even under the best conditions, is basedon incomplete and often unobservable information; (ii) ex-post, the availability ofinformation that is normally proprietary and not publicly known;
■ The same limitations apply to the calculation of the take at country level. In addition,in a given country numerous vintages of contracts are normally in force at any one
Fiscal Systems for Hydrocarbons 19
33. For more details see Johnston, Van Meurs and Seck, Smith, Wood, Allen and Seba, Barrows, andKemp.
34. Like companies, each host government has a unique risk-reward profile/discount rate. The hostgovernment does value money in the same way as companies do. However, the host government’sexpected benefits should be discounted using the social discount rate. This reflects society’s preferencesfor allocating the use of resources over time. A higher rate will attribute more weight to benefits to thecurrent generation than to future generations. The calculation of the parameters that are necessary todetermine the social discount rate involves a certain degree of value judgment. In addition, countries mayhave considerably different social discount rates. See Evans (2006) for a brief analysis of social discountsrates in the European Union.
35. Sector literature conventionally compares countries’ fiscal systems on the basis of the governmenttake. One use of take statistics is to calculate the possible range of the “take” for various countries usingcommon sets of assumptions and use the result as general indicators of the relative attractiveness/efficiency of those country’s fiscal systems (see for example Johnston and van Meurs). Alternatively, anattempt could me made to adjust the values that determine the take to local conditions (see the take sta-tistics of WoodMackenzie). Before the oil shocks of 1974 and 1979, a 50 percent government take wasconsidered a fair value but after the creation of OPEC, companies began to accept some erosion of theirshare of profits (Rutledge and Wright 1998). A study carried out by Petroconsultants in 1995 showed thatthe government take in more than 90 percent of the 110 countries examined ranged from 55 to 75 percent.Other studies have shown similar results (Johnston 1994b; Kemp 1987; Van Meurs and Seck 1995; Van Meursand Seck 1997).

time;36 countries typically use more than one arrangement; and contracts are oftenrenegotiated as political and economic conditions change, or as better informationbecomes available.37
■ In industry statistics the government take is usually determined on the basis of the-oretical price and cost assumptions. As noted above, the actual government takecan be quite different from the theoretical average.
■ The take is inconsistent with the economic measures mentioned above, since it isfrequently calculated and reported on an undiscounted basis. There can be a signif-icant difference in the level of take depending on the manner in which the cash flowelements are discounted. For example the discounted take is normally much higherthan the undiscounted one for regressive front-loaded systems.38
■ As the government take is made up of different elements, more or less regressive, therisk-profile, hence the attractiveness to investors, of two fiscal regimes that presentthe same percentage government take can be dramatically different.39
■ The government take does not capture the spill over effects of oil and gas projectson the economy at large.40
Using economic measures like the profitability index or the return on investment is alsodifficult as each government and each company has a unique risk-reward profile, and henceuses a specific discount rate. This of course provides the scope for negotiating contract andfiscal terms. Nevertheless, and keeping in mind the limitations expressed above, a compar-ison of various countries’ fiscal systems on the basis of the government take, the effectiveroyalty rate,41 and the percentage of government participation is shown in Appendix B.
20 World Bank Working Paper
36. When “model” contracts are available, these are normally used as a starting point for negotiation,and the final negotiated fiscal terms are not normally disclosed or released to the public.
37. According to a study conducted by the Minerals Management Service in March 2004, each year alicensing round is launched in 25–50 countries; new model contracts or fiscal regimes are introduced inapproximately 20 countries; and tax laws are revised by many countries during their annual budgetaryprocess.
38. It is important to note that given the cash flow profile typical of oil and gas projects, an undis-counted take can be quite misleading as it would underestimate the effective government take and over-estimate the effective company take.
39. The government take indicates how much of the available cash flow the government takes, but nothow it takes it (D. Johnston). In addition, the take does not adequately capture the effect of, inter alia,ring-fencing provisions, reserve/lifting entitlements, and work program provisions.
40. The economic impact of industrial hyperactivity in the United Kingdom sector of the North Seawas a direct result of the “lenient” terms of the 1990s (Johnston 2001).
41. The effective royalty rate (ERR) is defined as the minimum share of revenue (or production) thatthe host government might expect to receive in any given accounting period from royalties and its shareof profit oil. The ERR normally excludes the effects of government participation. If the contract or con-cession agreement has no cost recovery limit and no royalty, the host government may receive nothing ina given accounting period. This can happen even with profitable fields in the early years of productionwhen exploration and development costs are being recovered. The world average ERR for concessionarysystems is around 10 percent, whilst for PSCs it is closer to 30 percent (Johnston 2003).

CHAPTER 7
Designing Petroleum Fiscal Systems
Issues to be Considered
The host government’s ultimate objective should be to design a flexible fiscal systemthat favors the investing companies’ and the government’s mutual interests by pro-viding an equitable arrangement for both the highly profitable and the less profitable
discoveries. Examples of these systems can be found all around the world: approximately 25 percent of the petro-states have some vintage of contract with R-Factor or RoR-basedparameters, and the vast majority use production-based sliding scales.42
Decisions on the design of an appropriate fiscal framework can be supported by anunderstanding of how its various components influence decision making and outcomes. Tothis end a simplified43 economic model of four hypothetical petroleum projects was devel-oped to illustrate the difficulties that a country would typically face in designing a suitablefiscal framework for the development of its hydrocarbon resources. In particular, simulationswere conducted to show the effect on project economics of alternative fiscal terms and theirrelative responsiveness to changes in economic conditions. Table 4 summarizes the key pro-ject parameters utilized in our analysis.
21
42. Statistical data provided by D. Johnston, December 2006.43. In modeling the field economics under different fiscal systems, a number of simplifying assumptions
were made. In particular: no distinction was made between intangible and tangible costs; a five year straightline amortization criteria was used for all classes of assets; investment credits (normally cost recoverable andnot tax deductible,) were not considered; abandonment provisions were not included. Where the partici-pation of a national oil company was considered, its share of expenses was carried by the contractors’ groupwithout applying any interest rate. A deterministic approach was used to calculate production levels, costsand prices. Statistical or stochastic methods could have been applied to determine the possible value distri-bution of the project variables, which in turn would have provided valuable information for the design ofthe fiscal system. Because the objective of this paper is not to optimize the fiscal system in a particular coun-try, but merely to show how different fiscal systems respond to changes in economic and project conditions,this approach was not attempted as it would not significantly affect the result of our analysis.

22 World Bank Working Paper
44. When simulating the impact of variations in production levels, the same percentage was appliedthrough out the production horizon (that is, no adjustments were made to the production rate to takeinto account facilities specifications and/or reservoir management needs).
45. Theoretically it is possible to exactly replicate a particular fiscal regime using different combina-tions of fiscal instruments—for example a production sharing contract can be replicated by a combinationof royalties and taxes. Hence the choice between contractual systems and concessionary system mainlydepends on the country’s administrative capacity or on the objectives of its sector policy (Baunsgaard 2001).For this reason, concession agreements were not modeled in this paper as this would not significantly affectthe analysis.
46. The R-Factor was calculated as the ratio between after-tax revenues and total project costs (capitalexpenditure and operating costs). As it is the case for many other system parameters, the definition of R-Factor tends to be country (sometimes contract) specific. Therefore, one should be cautious in compar-ing fiscal parameters among countries/contracts as their effect on project economics can be quite different.
47. See Appendix B, Table 11.48. To simplify the interpretation of the results, only one parameter at a time was allowed to change.
In reality, there are dependency relationships among parameters. The likelihood, magnitude, and timingof changes in technical and economic parameters have different effects on project economics, and on theoverall performance of the system. A stress test was, however, carried out for all fiscal models by calculat-ing the project’s NPV at different discount rates resulting from decreasing the production level and priceby 20 percent and increasing capex and opex by 20 percent.
49. The minimum level of gas price that causes the project’s NPV to become zero.50. This indicator allows companies to compare investments around the world, irrespectively of the
size of the project.51. The operating leverage was calculated as the ratio of the net present value of total cost to the net
present value of gross revenue. Both flows were discounted at 10 percent. The higher the operating lever-age, the more exposed the project profitability is likely to be to a fall in prices.
52. The government take was calculated on an undiscounted and on a discounted basis. To simplifythe comparison with the contractor’s take, all cash flows were discounted at 10 percent. In reality, the gov-ernment’s cash flow should be discounted at the social rate (see note 34 above). This is likely to be lowerthan 10 percent, thus increasing the percentage government take.
53. The Saving Index (SI) is defined as the part of an additional one dollar in profit (arising from aone dollar saving in cost) that accrues to the contractor. It measures the degree to which the contractorwill benefit from a reduction in costs (see Johnston 2003).
Table 4. Key Project Parameters
Parameter Field A Field B Field C Field D
Recoverable Reserves 20 MBO 50.0 MBO 100 MBO 600 MBO
Peak Production 6.0K Bopd 15.0K Bopd 28.5K Bopd 150.7K BopdRate44
Field Life 20 years 20 years 20 years 20 years
Oil Price US35/ Bbl US$35/Bbl US$35/Bbl US$35/Bbl
Total Capital costs US$123 Million US$234 Million US$336 Million US$4,615 Million(Capex)
Full cycle Operating US$4.54/Bbl US$4.24/Bbl US$3.05/Bbl US$2.31/Bblcosts (Opex)
The economics of these hypothetical assets were calculated under PSC.45 Four alternativetypes of sliding scales were modeled: daily production, cumulative production, R-Factor,46 andRoR.47 Their relative performance was assessed by allowing a selected number of fiscal and sys-tem parameters to change.48 The results were measured in terms of break-even price,49 NPVof the project’s cash flow, IRR, PR, net present value per barrel of oil equivalent (NPV/BOE),50
operating leverage,51 percentage government take,52 and saving index [SI]53). These are sum-marized in Table 5. Detailed calculations are shown in Appendix D, Tables 22 to 25.

Table 5. Fiscal System Indices
Field A
Fiscal Fiscal Fiscal Fiscal Model 1 Model 2 Model 3 Model 4
Contractor’s Cash Flow (NPV10%) 70.6 70.6 73.5 79.9
Break-Even Price 18.64 18.64 17.48 17.07
Project’s IRR 26.0% 26.0% 28.2% 29.0%
NPV(10%)/BOE 3.53 3.53 3.67 3.99
PR(10%) 0.60 0.60 0.62 0.68
Operating Leverage (%) 43.2% 43.2% 43.2% 43.2%
Government Take (%) 57.6% 57.6% 55.9% 52.0%
Saving Index (US$) 0.53 0.53 0.52 0.56
Field B
Fiscal Fiscal Fiscal Fiscal Model 1 Model 2 Model 3 Model 4
Contractor’s Cash Flow (NPV10%) 213.7 213.7 212.4 211.0
Break-Even Price 15.05 15.05 14.13 13.79
Project’s IRR 33.4% 33.4% 36.6% 36.4%
NPV(10%)/BOE 4.27 4.27 4.24 4.22
PR(10%) 0.88 0.88 0.88 0.87
Operating Leverage (%) 35.5% 35.5% 35.5% 35.5%
Government Take (%) 54.6% 54.6 54.9% 55.2%
Saving Index (US$) 0.53 0.52 0.49 0.49
Field C
Fiscal Fiscal Fiscal Fiscal Model 1 Model 2 Model 3 Model 4
Contractor’s Cash Flow (NPV10%) 515.3 469.7 456.0 363.4
Break-Even Price 10.56 11.32 10.00 9.62
Project’s IRR 49.7% 49.4% 55.2% 50.4%
NPV(10%)/BOE 5.15 4.70 4.56 3.63
PR(10%) 1.50 1.37 1.33 1.06
Operating Leverage (%) 24.9% 24.9% 24.9% 24.9%
Government Take (%) 53.0% 57.1% 58.4% 66.8%
Saving Index (US$) 0.52 0.47 0.42 0.36
Field D
Fiscal Fiscal Fiscal Fiscal Model 1 Model 2 Model 3 Model 4
Contractor’s Cash Flow (NPV10%) 386.4 (14.4) 1,751.8 2,423.0
Break-Even Price 29.41 35.23 20.30 19.44
Project’s IRR 12.1% 9.9% 19.2% 21.2%
NPV(10%)/BOE 0.64 (0.02) 2.92 4.04
PR(10%) 0.10 (0.00) 0.45 0.62
Operating Leverage (%) 47.4% 47.4% 47.4% 47.4%
Government Take (%) 91.6% 100.3% 61.7% 47.1%
Saving Index (US$) 0.34 0.18 0.51 0.64

Our simplified analysis illustrates that the anticipated size and distribution of pro-duction in a given geological province is a key element in the design of a fiscal system. Thiscan be seen by applying the same fiscal model to different size fields and comparing its per-formance (Appendix D, Tables 22 to 25). Furthermore, for all fiscal models/fields analyzedin this paper, variations in production from the base case level considerably impacted pro-ject economics (plus or minus 30 percent for the smaller size fields, plus or minus 23 per-cent for the medium size field, and plus or minus 43 percent for the large size field54).Similar results were obtained for price variations. Decreases in production and pricesresulted in large percentage variations in project NPV because of the rigidity of capitalinvestment. The higher the project’s operating leverage, the larger the impact of a varia-tion in price or production level. In our models a variation in the level of production hadthe lowest effect on the project’s NPV for Field C (24.9 percent operating leverage), whileField D (47.8 percent operating leverage) was affected the most. These are very importantconsiderations in the design of a fiscal system, as market prices and geological conditionscan be estimated only with a high degree of uncertainty. Therefore, companies undertakingcapital intensive and complex projects (for example deep water or gas projects), or thosein frontier or remote areas, or risk-adverse or smaller companies would logically prefer fis-cal systems that provide a cushion in case of adverse conditions.55 Projects with high oper-ating leverages, all other parameters being equal, are relatively more exposed to the risk oflosses under regressive fiscal regimes (Kretzschmar and Moles 2006). When project financ-ing is involved, a fiscal regime that is less sensitive to variations in project economics willincrease the perception of risk and, ultimately, the average cost of capital and the explo-ration and development thresholds.
Because capital expenditure occurs mainly in the initial phase of a project, variations inits level have a large impact on project economics, especially when a cost recovery limit isimposed and/or the state participating interest is on concessional terms.56 In general terms,higher cost recovery limits allow the contractor to achieve payback of its investment faster.However, when sliding scales are used to determine the percentage of profit oil split (or thetax rate), in some cases higher cost recovery limits may lower the contractor’s full cycle dis-counted cash flow. This would depend on several factors, including the level of saturationof the system, the operating leverage, the discount factor, and the steepness of the slidingscale vis-à-vis the changes in the project IRR. In Appendix E, Graphs 1 to 4 show the effecton project profitability of different levels of cost recovery limit for the fiscal systems mod-eled in this paper.
In designing fiscal systems, it is important to create an alignment between the con-tractors’ and host government’s interests. In this context, creating incentives for cost sav-
24 World Bank Working Paper
54. Because of the misalignment between the project’s daily and cumulative production levels and theproduction thresholds used to calculate the royalty and the profit oil split, the variation in the project’sNPV was much bigger for the large size field under Fiscal Model 1 and 2.
55. The expected average field size and likely development solutions provide valuable information forthe design of fiscal system and/or fiscal incentives even with respect to mature areas.
56. It is worth noting that during primary recovery, only a small percentage of the initial hydrocarbonsin place are produced, typically around ten percent for oil reservoirs. Secondary and tertiary recoverymethods that may be employed once the reservoir primary recovery—natural drive or artificial lift—reaches its limits are quite expensive. Therefore, to avoid leaving technically producible reserves in theground, the fiscal system should not discourage this type of investment.

ings is an important objective. Typically, the contractor would have an incentive to save(especially during the exploration phase). The extent of the benefit depends on the profit-based elements of the fiscal system (for example, profit sharing and taxes). It also dependson the timing of the saving, as the present value of a dollar saved today is higher than thatof a dollar saved tomorrow.57 Table 6 below summarizes the effect of a 20 percent variationin capital expenditure for the fiscal models modeled in this paper. In general terms, fiscalsystems that have a low contractor’s marginal take are more likely to create a lower incen-tive to saving because the majority of the savings will be transferred to the government. Inextreme but rare cases, inefficiencies in the fiscal system may encourage the investor tospend more than it otherwise would.58 To mitigate this type of inefficiency, the host gov-ernment should ensure that thresholds and triggers are not too wide, that is, changes inthresholds corresponds to changes in the project IRR and changes in triggers do not dis-courage savings by capturing the whole of the project upside. This is particularly importantfor complex projects with high capital investment and long implementation periods.
Fiscal Systems for Hydrocarbons 25
57. For this reason the contractor’s actual saving benefit in present value terms is quite likely to differfrom the SI.
58. See Johnston 2003. This is gold plating in its “purest” form. Fiscal Model 4 (and to a lower extentFiscal Model 3) applied to Field C exemplifies the concept.
59. Similar consideration applies to sliding scale royalties and taxes.
Table 6. Contractor’s and Host Government’s NPV Variation
Field A Field B Field C Field D
Contr. Govt. Contr. Govt. Contr. Govt. Contr. Govt.
20% increases in Capex
- Fiscal Model 1 −65% −35% −65% −35% −64% −36% −57% −43%
- Fiscal Model 2 −65% −35% −65% −35% −64% −36% −52% −48%
- Fiscal Model 3 −50% −50% −61% −39% −50% −50% −50% −50%
- Fiscal Model 4 −22% −78% −17% −83% 150% −250% −63% −37%
20% reduction in Capex
- Fiscal Model 1 65% 35% 65% 35% 64% 36% 58% 42%
- Fiscal Model 2 65% 35% 65% 35% 64% 36% 49% 51%
- Fiscal Model 3 44% 56% 11% 89% −18% 118% 54% 46%
- Fiscal Model 4 34% 66% −26% 126% −104% 204% 35% 65%
The choice of trigger rates and thresholds is a key issue for all fiscal models. It is quiteunlikely that a particular set of triggers or thresholds would be able to optimize the gov-ernment take under all possible scenarios. For example, if the thresholds for triggeringhigher profit oil/gas splits are too wide, the system may not efficiently capture the economicupside of a project.59 This can be seen in Appendix F, which shows the effect on govern-ment take and project IRR of applying different daily production thresholds to calculatethe royalty and the profit oil split for Field A.

The comparison of NPV and government take shown in Appendix D illustrates thecomplexities of defining efficient profit oil splits between the host government and theinvestor. In particular:
■ The daily and cumulative production thresholds necessary to trigger higher profitoil splits in favor of the government were never reached when Fiscal Models 1 and 2were applied to Fields A and B, and the percentage profit oil split remained the samefor the economic life of the two fields (see Tables 22 and 23).
■ On the other hand, when applied to Field C, Fiscal Model 2 was able to capturemore revenue for the host government than Fiscal Model 1. This is because underFiscal Model 2, the field reached its second profit sharing and royalty threshold atapproximately 50 percent of total production, while under Fiscal Model 1, the dailyproduction level was only slightly above the first threshold for a short period of time(see Table 23).
■ Because of the high level of capital investment, the application of Fiscal Model 2 toField D made the project uneconomic (see Table 24).
■ There were no significant differences between R-Factor and RoR-based profit splitin the first four years of production and between the seventh and the eleventh yearof production for Field A.60 This is because during these periods, changes in thresh-old in both the R-Factor and the RoR-based models corresponded to changes in theproject’s internal rate of return.
These examples illustrate that in order to capture a suitable share of profit oil the hostgovernment would need to make reasonable assumptions about the size and profile of a typ-ical project, as well as to determine the typical variability in key project parameters. Thiswould allow it to determine a representative distribution of R-factors, RoRs, or other para-meters chosen as thresholds and triggers, and to set appropriate floors and ceilings for suchthresholds and triggers. Unfortunately, historical data, even if determined with reference tospecific geological basins and project locations,61 often do not provide sufficient guidelines.62
Therefore, a certain degree of “art” in defining the thresholds and triggers would still berequired. Anticipating project profitability for a specific asset is a difficult exercise. Imaginehow difficult it would be for a host government to attempt to define profit oil splits that canapply universally to all projects in the country. This is one of the reasons why the profit oilsplit is normally the subject of negotiation.
The majority of existing production sharing contracts (and concession agreements)uses sliding scales based on cumulative or daily production levels. In some cases, differentthresholds and trigger rates apply depending on, for example, the water or well depth. In
26 World Bank Working Paper
60. Similar results were observed with respect to Field B and Field C, where the two fiscal systemsbehaved in exactly the same manner except, respectively, between the fifth and the seventh years and thethird and fifth years of production. On the other hand, the two Fiscal Models behaved quite differentlywhen applied to Field D.
61. In addition, assumptions about the level and volatility of oil price—which are among the mostimportant elements of project profitability—would still to be made.
62. Establishing the fiscal terms for service contracts, concessionary agreements and PSCs for non-exploration assets is less problematic as the risk profile of the asset, and often its likely costs, are sufficientlyknown.

some production sharing contracts the production based profit oil/gas split is furtherlinked to the level of oil/gas prices and/or the R-Factor. Sliding scale terms introduce flex-ibility in fiscal systems. This theoretically allows small and large fields to be developed onequitable terms. In reality, as shown in our simplified models, the neutrality of the systemlargely depends on how the thresholds are defined, and how closely they relate to the prof-itability of the underlying project.
Mathematically, it is always possible to design thresholds and triggers of a sliding scalebased on production levels that match the changes in project economics. Because this canbe done only at the end of the life of any given project and is bound to be different for eachproject, the use of RoR and R-Factor triggers is likely to be more efficient at sharing theproject’s upsides and downsides between the contractor and the host government. Fur-thermore, because of their flexibility, R-factor and the RoR-based models generally have alower break-even price (see Table 7 below), which makes them more attractive to the con-tractors and less risky candidates for project financing.
Fiscal Systems for Hydrocarbons 27
Table 7. Break-Even Price
Fiscal Model 1 Fiscal Model 2 Fiscal Model 3 Fiscal Model 4
Field A 18.64 18.64 17.48 17.07
Field B 15.05 15.05 14.13 13.79
Field C 10.56 11.32 10.00 9.62
Field D 29.41 35.23 20.30 19.44
In Appendix, Graphs 5 to 8 show the sensitivity of government take and project prof-itability to changes in prices for the fiscal systems modeled in this paper. In general terms, pro-duction based sliding scales are more regressive (less neutral to investment decisions) than areR-factor and RoR-based sliding scales, as the split remains the same even if important changesin project economics should occur. On the other hand, these systems are easier to administerand may prove reasonably efficient in sharing the rent between the contractor and the gov-ernment when project uncertainty is low, especially if used in conjunction with price indices.
The impact on project economics of the government’s participation through the NOCdeserves special consideration. If concessional conditions apply to the government back-in interest (if the government does not pay its way in, or pays it only partially) this would haveimplications for the contractor’s NPV.63 Furthermore, because the contractor is allowed torecover expenses (its share and the carried) with a limited or unlimited carry forward,64
this may result in an implied borrowing rate for the host government that is higher than
63. Normally the State/NOC is carried through the exploration phase (rarely through development).Exploration costs may or may not be reimbursed to the contractor. In some cases interest may apply tounrecovered costs. The State/NOC share of participation is normally paid out of production.
64. Usually unrecovered expenses are carried forward to the next fiscal year until they are fully recov-ered (unlimited carry forward) or until they are allowed for recovery (limited carry forward). The carryforward affects both the calculation of profit oil split and of the corporate tax, although the mechanismmay be different.

its marginal borrowing rate. In addition, unrecovered expenses affect the calculation ofR-Factor and RoR, which in turn may affect the level of government revenue when profit oilsplit/taxes are determined on these bases. In these cases, the NOC carried participation maymitigate the effect on a contractor’s NPV of a cost overrun (or improve the benefit to the con-tractors in case of cost savings). This effect and its magnitude would, inter alia, depend on therelationship between project IRR and discount rate, and it would not occur when the projectIRR is lower than the discount rate. Therefore, when a carried interest is involved, the deci-sion to exercise the back-in option, and the consequent use of public resources, needs to beevaluated in light of the overall macro-economic objectives and resource allocation prioritiesof the government. In Appendix G, Table 26 shows the effect of a 30 percent65 participation ofthe NOC carried through exploration.66
Depending on their overall fiscal policy needs, host governments seek different levels offront-loading. To achieve their objectives while maintaining a reasonable level of investmentincentives, it may be necessary to accept a tradeoff between regressive features (royalties, costrecovery limits) and progressive features (RoR, R-Factor based taxes or production sharing).Although progressive regimes are most successful in optimizing the government take undervarying economic conditions, they may increase revenue volatility. Various risk managementstrategies exist to smooth revenue volatility, the costs and benefits of which need to be care-fully considered.67
28 World Bank Working Paper
65. Often the contract provides for the host government to have the option to participate, directly orthrough its NOC, up to a certain percentage participating interest. The percentage participation of theState/NOC affects the project IRR for the contractor. It is important to note that the IRR is one of theparameters used by oil companies to rank their investment opportunities. Companies set a target rate(s)that reflects the project risk and the investor’s corporate profile. All other things being equal, investmentopportunities with an IRR below the target rate are not likely to be considered. Although target rates areunique to each company, a fifteen percent target rate would not be uncommon. This should be taken intoconsideration by the host government in determining its level of participation in any given asset.
66. In all our models, no interest rate was applied to unrecovered expenditure related to the NOCcarry. The NOC and the contractor were assumed to pay the same corporate tax rate. In reality, oftenprofit oil splits are calculated at project level, while corporate taxes are calculated at company level (eachco-venturer pays taxes separately). Furthermore, the existence and extent of ring fencing affects theoverall level of tax receipts.
67. These range from hedging to the use of special reserve funds (SRF). The analysis of the cost and ben-efits of alternative risk management strategies is beyond the scope of this paper. In general terms, policy mak-ers will be reluctant to take the political risks of a hedging program. Therefore the creation of an SRF maybe preferred, especially if the government is able to implement a stable long-range fiscal plan designed to cre-ate and preserve a SRF’s balance at such a level that it can be used to effectively insure the state against rev-enue fluctuations. If, given the expected level of revenue and the spending needs of the country, a SRF fundmay not be able to provide such insurance, a hedging program may need to be considered.

CHAPTER 8
Conclusion
Countries compete with each other to attract foreign investment to develop theirnatural resources. To achieve this objective, they must assess their position in theglobal marketplace and evaluate their particular situation, boundary conditions,
concerns and objectives. In evaluating options to encourage oil exploration and productionactivities, host governments should focus on measures that: (i) materially improve the eco-nomics and/or reduce the investment risk, (ii) involve low compliance and administrationcosts; (iii) address market deficiencies; (iv) minimize distortionary effects; and (v) are con-sistent with the country’s macro-fiscal policy and with local development objectives.
Although not all countries have made the same legal and regulatory choices, nearly allhave established sector specific legislation and regulation in line with their constitution andwith the rest of the country’s body of laws. One advantage of this approach is its trans-parency and its objectivity: by establishing the boundary conditions for the award of petro-leum rights and defining the authority and procedures for such award, system inefficienciesand the scope for discretional behavior are greatly reduced. Whether contractual or con-cessionary systems are used, key elements considered by potential investors in comparinginvestment opportunities include clarity and simplicity of terms; objectivity of rules andtheir enforcement; and neutrality, equity, efficiency, and stability of fiscal terms.
The fiscal regime, especially when complemented by broader sector reforms, has beenused by many countries to convert government policy into economic signals to the marketand influence investment decisions. Depending on its overall fiscal policy needs, the hostgovernment may seek different levels of front-loading at different points in time. In orderto achieve its objectives while maintaining a reasonable level of investment incentives, thegovernment would need to seek a tradeoff between regressive features (royalties, cost recov-ery limits, exploration tax) and progressive features (RoR, R-Factor-based taxes, or pro-duction sharing).
29

One of the key challenges of fiscal policy is develop a system that is able to allocaterisks equitably. To meet this challenge, policy makers need to take into account the diver-gent interests of companies and governments. As risks can differ substantially for differ-ent projects and countries and over time, a fiscal regime that provides optimal outcomesunder all circumstances is not likely to be developed. Although this may justify a case bycase approach, this would hardly be efficient given the usually large number of projects andthe often limited administrative capacity of the host government. It is therefore desirableto build enough flexibility into a system to allow for automatic adjustments to unforeseenchanges and to minimize the need and cost of negotiations and/or renegotiations. Intu-itively, this would imply the optimization of fiscal revenue at the country level as opposedto the optimization of fiscal revenue at the project level.
Many petroleum fiscal systems around the world exhibit some form of flexibility. Veryfew of them effectively and efficiently target the economic rent, i.e. are neutral to investmentdecisions. Fiscal systems that use sliding scales based on daily or cumulative production tar-gets are insensitive to changes in prices and costs. So in a dynamic environment like the onethat characterizes the oil industry, these systems are more likely to produce a misalignmentof interests between the host government and the investors, as the recent surge in contractsrenegotiations suggests. On the other hand, these systems are relatively easy to administerand may prove reasonably efficient in sharing the rent between the contractor and the gov-ernment when project uncertainty is low, especially if used in conjunction with price indices.
R-Factor and RoR-based fiscal systems lower the project specific risk by introducingflexibility in the fiscal package to suit the profitability of the particular project. Because oftheir flexibility, these types of arrangement are more likely to encourage the developmentof marginal fields, or of complex projects with a long lead time for implementation. Inaddition, the use of R-factor and RoR-based systems normally lowers the break-even priceof a project. This in turn makes these projects more attractive to the contractors and lessrisky as candidates for project financing.
The choice of trigger rates and thresholds is a key issue for all fiscal systems. It is quiteunlikely that a particular set of triggers or thresholds would be able to optimize the govern-ment take under all possible scenarios. In order to define relevant thresholds and triggers,the host government would need to make reasonable assumptions about the size and profileof a typical project, as well as to determine the typical variability in key project parameters.This would allow it to determine a representative distribution of R-factors, or RoRs, or otherparameters chosen as thresholds and triggers, and to set appropriate floors and ceilings forsuch thresholds and triggers. The efficiency and neutrality of the fiscal system largely dependson how closely triggers and thresholds relate to the profitability of the underlying projects.In general terms, wide thresholds may not efficiently capture the project rent, and steep trig-ger rates may have distortive effects on investment decisions.
The issue of government participation (the back-in option) in oil and gas explorationand production activities deserves special consideration. Nearly half of the countries aroundthe world allow some form of participation through the NOC, the oil minister, or other gov-ernment entity. Countries that use PSCs are more likely to use government participation asmeans of rent extraction. Governments that allow participation may or may not reimburseexploration costs to the contractor. Those who do not, normally allow the contractor torecover expenses (its share and the “carried”) with a limited or unlimited carry forward.
30 World Bank Working Paper

From a purely financial standpoint, this has implications for the contractor’s NPV and IRR.In some cases, the carry may result in an implied borrowing rate for the government thatis higher than its marginal borrowing rate. Un-recovered expenses affect the calculation ofR-Factor and RoR, which in turn may affect the level of government revenue when profitoil split/taxes are determined on these bases. Therefore, when a carried interest is involved,the decision to exercise the back-in option, and the consequent use of public resources,needs to be evaluated in light of the overall macroeconomic objectives and resource allo-cation priorities of the government.
Even when a flexible petroleum fiscal regime is established, the host governmentwould still need to regularly assess its performance and to adjust the relevant parametersas needed so that the fiscal regime applicable to future projects reflects changes in marketconditions, government policy, and geological and country risks. Finally host governmentswould need to periodically re-assess the impact of their petroleum fiscal system on theoverall macroeconomic framework to ensure it encourages the efficient and effective useof resources.
Fiscal Systems for Hydrocarbons 31


APPENDIXES
33

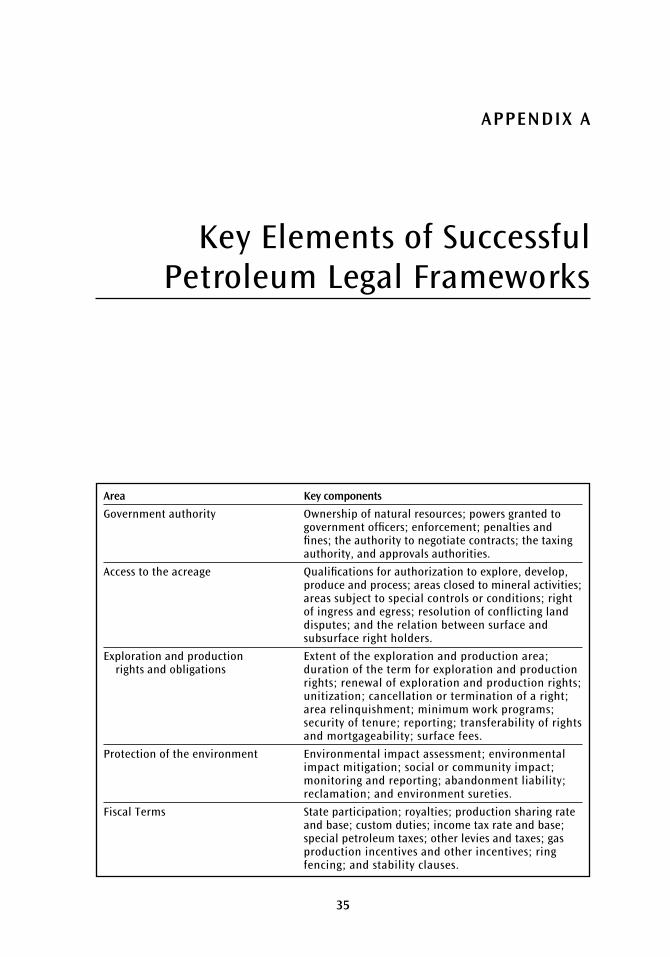
Area
Government authority
Access to the acreage
Exploration and production rights and obligations
Protection of the environment
Fiscal Terms
Key components
Ownership of natural resources; powers granted togovernment officers; enforcement; penalties andfines; the authority to negotiate contracts; the taxingauthority, and approvals authorities.
Qualifications for authorization to explore, develop,produce and process; areas closed to mineral activities;areas subject to special controls or conditions; rightof ingress and egress; resolution of conflicting landdisputes; and the relation between surface and subsurface right holders.
Extent of the exploration and production area; duration of the term for exploration and productionrights; renewal of exploration and production rights;unitization; cancellation or termination of a right;area relinquishment; minimum work programs;security of tenure; reporting; transferability of rightsand mortgageability; surface fees.
Environmental impact assessment; environmentalimpact mitigation; social or community impact;monitoring and reporting; abandonment liability;reclamation; and environment sureties.
State participation; royalties; production sharing rateand base; custom duties; income tax rate and base;special petroleum taxes; other levies and taxes; gasproduction incentives and other incentives; ringfencing; and stability clauses.
APPENDIX A
Key Elements of SuccessfulPetroleum Legal Frameworks
35


APPENDIX B
Tax and Non-Tax Components of Petroleum Fiscal Systems
37
Table 8. Royalties
How do they work?
• Royalties have historically been the most common method used by governments to gain revenue from the exploitation of the nation’s mineral endowment.
• Royalties are based on either the volume (“unit” or “specific” royalty) or the value (“ad valorem”royalty) of production or export.68
• Unit royalties impose burdens that vary in inverse relation to changes in market price, whilead valorem royalties vary in direct relation to price for any given level of production or sale.
• In the petroleum industry, royalties are typically calculated on a net-back basis:. the pricebase for royalty calculation is adjusted from the point of export to the wellhead by deductingtransportation and other marketing costs.
Advantages and Disadvantages to Host Governments
• Royalties are attractive to governments because they ensure an upfront revenue stream assoon as production starts.
• As they are attached to production or sales, they can be estimated with a reasonable degreeof predictability.
• They are comparatively easy to calculate, collect, and monitor.
• Royalties are a regressive form of taxation.69 High levels of royalties distort investment decisions and may encourage uneconomic choices. To mitigate their regressiveness, somecountries apply sliding scale royalties based on production levels or sales values, waterdepth or well depths, or R-factors.
(continued )

38 World Bank Working Paper
Table 8. Royalties (Continued )
Effect on Investment Decisions
• Royalties have a tendency to distort the levels of recovery, although this effect is relevantonly when the royalty is the most important part of the tax rent and when important differ-ences in quality occur in crude oil or gas produced from a given contract area. In particular:
– Unit royalties reduce the effective price by the same nominal amount each year. Since thenet present value of the royalty decreases over time, investors will have an incentive toprefer future production over current production when future prices are expected toincrease. In addition, a royalty imposed on the volume of production or sales may encour-age the investor to delay the production or sale (subject to technical considerations) of thelighter, sweeter crudes or higher heating content gas if the discounted value of futureprices is expected to increase.
– Ad valorem royalties reduce the discounted price of crude oil or gas by the same percentagein each year. Therefore, if the prices are expected to rise in real terms, investors wouldprefer increasing production (subject to technical considerations) in the present.
• As royalties are payable whether or not the project is profitable, they can constitute a majordeterrent to investment.
• By increasing the economic cut-off rate, royalties reduce the economic life of a project.70
68Some countries link the royalty rate to parameters like average daily production, oil price,water depth, field location, depth of reservoir, and crude oil quality.69For a detailed description of royalty practice in various countries, see Otto (1995).70The impact of this is to leave in the ground hydrocarbons that would otherwise be produced.
Table 9. Ring Fencing
How do they work?
• Ring-fencing is an industry-specific feature. This refers to the delineation of taxable entities.While corporate income tax normally applies at company level, in the petroleum sector thetaxable entity is often the contract area or the individual project. When ring fencing appliesat contract area or project level, income derived from one area/one project cannot be offsetagainst losses from another area/project. Another type of ring fencing separates upstreamfrom downstream operations. Usually all costs associated with a given block or license mustbe recovered from revenue generated within that block: the block is ring fenced. However,some countries allow exploration costs to cross the fence. 71
Advantages and Disadvantages to Host Governments
• The objective of ring fencing is to protect the level of current tax revenue and, to someextent, level the playing field by treating newcomers and existing investors equally. The dis-advantage of ring fencing is that it does not incentivize exploration and investment activi-ties. However, by allowing costs to cross the fence, the host government may end upsubsidizing unsuccessful exploration.
• Some countries allow the consolidation of upstream, transportation and processing activi-ties, and an array of arrangements is used for LNG projects, which involve various degrees ofconsolidation. Other countries have preferred to maintain the integrity of their tax systemsand to provide similar level of incentives through the definition of transfer prices orthrough other form of incentive.
Effect on Investment Decisions
• The relaxation of ring fencing can provide a strong financial incentive to investors, espe-cially those who have existing production or are in a tax paying position. The existence of acost recovery limit may enhance the importance of this type of incentive.
71In New Zealand, a 100 percent deduction is given for exploration expenditure in the year in whichit is incurred; development expenditure is allowed as a deduction over 7 years from the date ofexpenditure for offshore wells, and any losses arising are not ring fenced either to permits, fields,or even the trade. That is, losses can be offset against any New Zealand income of the company orgroup of companies.

Fiscal Systems for Hydrocarbons 39
Table 10. Corporate Income Tax
How do they work?
• Some countries include the petroleum industry within the standard corporate income taxregime, although they may use a higher tax rate to capture more rent.72 Under this method,taxes are only due when annual revenue exceeds some measure of costs and allowances.Therefore, the key elements of this tax form are the definition of taxable income and therate applied to it.73 In their traditional formulation (a fixed tax rate) corporate taxes arerelatively regressive, as their burden in percentage terms remains the same at differentlevels of profitability.
• To ensure that the host government shares the upside if a project becomes very profitable,more and more countries have adopted progressive income tax rates. This is done byusing stepped tax rates linked to parameters like the crude oil price, the volume of production, the sales value, and so on. These are “add-on” to conventional proportionalincome tax.
• In some countries the investor’s income tax is paid by the government out of its share ofproduction.
Advantages and Disadvantages to Host Governments
• Because corporate income taxes are well defined in the country’s tax code, their assessment,collection, and monitoring can be more easily accommodated within the country’s existingsystems, thus lowering the government’s administrative burden.
• Progressive income taxes tie the level of taxation to parameters that are linked to the levelor activity or the price of crude oil or gas. This allows the host government to partake in theproject’s upsides when economic conditions are more favorable.
Effect on Investment Decisions
• The parameters normally used to determine the progressive rates of income tax are notnecessarily fully correlated with the investors’ return on investment. Hence this type ofcorporate tax may not be neutral for investment decisions.
• In countries where the tax is paid by the government (or the NOC) on behalf of the contractor, consideration should be given to structuring the tax so that they can betreated as if paid directly by the contractor for home country tax credit purposes. As the contractor is not affected by changes in tax rates, these types of agreements are generally quite stable.
72As petroleum companies operate on a multi- and/or cross-national level, it is important that thehost government introduce safeguards to avoid profits being transferred to jurisdictions with lowercorporate tax rate (for example, by imposing restrictions on deductible interests or inter-companycharges, or requiring arms-lengths transactions).73In defining the applicable rate, government should be mindful that home nation treatment of foreign earnings is ultimately of importance to investors. Rates that are too low merely transfer tax revenue to the treasury of the investors’ home countries. Therefore, if incentivesare to be provided, adjustments in the definition of taxable income may prove more effective.See Thomas A. Gresik, April 2001.

40 World Bank Working Paper
Table 11. Resource Rent Tax
How do they work?
• Resource rent taxes tie taxation more directly to the project’s profitability. In its pure form,taxes are deferred until all expenditures have been recovered and the project has yieldeda predefined target return. Then a very high marginal tax is applied to all subsequentoperating revenue. Basically, the project is granted a tax holiday compared with conventionaltax regimes in anticipation of exceptionally high governmental returns over time. There aretwo main systems:
– R-Factor based systems, which are linked to the payback of an investment (the ratio ofcumulative after tax74 receipts to cumulative expenditures—capital expenditure andoperating costs),75 and
– Rate of Return (RoR) based systems, which are linked to the project’s return on investment(hence they take into consideration the time value of money and apply when a targetinternal rate of return has been achieved76).
Some countries have adopted a stepped resource rent tax schedule with incremental bracketsto smooth the shift to the higher tax rates.
• In some countries, the investors’ income tax is paid by the government out of its share ofproduction.
Advantages and Disadvantages to Host Governments
• The main advantage of a resource rent tax is its neutrality77 (at least in theory78). The dis-advantage is that it only provides income to the government when the target payback or rate of return is reached. This can be avoided by combining the resource rent tax with aroyalty and/or a normal corporate income tax. The key issue then becomes that of definingan efficient target rate. This is a complex issue as it depends on the specific characteristicsof the project, as well as exogenous conditions. Resource rent taxes are comparatively moredifficult to assess and monitor. Therefore, the administrative cost of maintaining this systemlargely depends on the capacity of the host government.
Effect on Investment Decisions
• Resource rent taxes are relatively neutral to investment decisions. This depends on howclose the target rate is to the investor’s discount rate, which in turn reflects the project riskand the investor’s corporate profile.
74In some countries pre-tax values are used to calculate the R-Factors. Examples can be found inColombia, Malaysia (R/C index), and India (Investment Multiple post NELP V contracts).75The R-Factor is calculated in each accounting period. Once a threshold is crossed, the new taxrate will apply to the next accounting period. The cash flows used in determining the R-Factor donot take into consideration the time value of money (they are undiscounted). In some royalty andtax arrangements, a stepped corporate income tax rate is determined on the basis of a range ofR-Factor values (as, for example, in Chad). In some cases the R-Factor is used to determine theroyalty rate (as, for example, in Tunisia). In some Production Sharing Contracts, the R-Factor isused to trigger the percentage of the government’s share of profit oil (as, for example, in Qatar).76In RoR-based systems net annual cash flows are compounded at the target RoR rate and carriedforward until the cumulative amount becomes positive. When the investor has recovered theinitial investment plus the target rate, the tax kicks in. Theoretically the target RoR rate shouldrepresent the minimum rate to encourage investment.77The neutrality of a tax can be assessed by its impact on the resource allocation. With respect tothe investing company, a tax is neutral when it leaves the pre-tax ranking of possible investmentoutcomes equal to the post-tax ranking. With respect to a particular industry, a tax is neutralwhen it does not divert investments to or from that industry.78This depends on how close the target rate is to the investor’s discount rate. The Brown taxlevied on the investor’s cash flow is the most neutral form of taxation, as it provides for subsidieswhen the project cash flow is negative and captures the excess rent when the cash flow is positive.In practice, this tax has never been applied in its purest form, although some countries do providesubsidies to corporations, and these have an effect similar to the Brown tax. For a discussion ofthe economic efficiency of resource taxation policy, see Garnaut and Clunies Ross (1975).

Fiscal Systems for Hydrocarbons 41
Table 12. Import and Export Duties
How do they work?
• Import duties apply to all material and equipment imported in a country. In the past, thesewere used to provide protection for locally produced goods.
• Almost all countries have some sort of trade duty system, but in the oil industry import dutieshave had a limited use as fiscal tools (local content provisions have largely substituted the useof import duties to protect local industries).
• The majority of countries provide exemptions from import duties on material and equipmentdestined to oil and gas operations. In some cases, the exemption is granted throughout theduration of the relevant Production Sharing Contract or Concession Agreement; in others, itis limited to the exploration and development phase.79 Some countries provide a blanketexemption; others limit the exemption to a specific list of materials and equipment. Exemp-tions for temporary import of equipment are the general practice in all producing countries.
• Because export duties distort the price of export and domestic supplies, they are normallynot levied on oil and gas.80
Advantages and Disadvantages to Host Governments
• For host governments, import duties provide a source of revenue from the very beginning ofproject operations. On the other hand, because of the nature of administering such duties,lower level government officers often have to classify the goods. This may create delays inprocessing the goods and may increase the potential for rent-seeking behavior.
• The use of lists of exempted material and equipment often increases the customs authority’sadministrative burden.
• Because equipment and material originally imported for use in one project area may beused in other project areas, the grant of exemptions based on the destination to a particularproject area often generates inefficiencies.
Effect on Investment Decisions
• Given the very substantial import needs during the exploration and development phase of aproject, the payment of import duties on material and equipment has a direct impact onproject economics by reducing the net present value of the project and increasing its riskprofile. For this reason, the existence of custom duties exemptions, at least in the earlystages of a project, is of great value to investors.
79However, the administration of a mixed system can prove very difficult and expensive.80Russia is among the notable exceptions.
Table 13. Value Added Tax
How do they work?
• Value Added Tax is normally levied on a destination basis, i.e. imports are taxed and exportsare zero rated. For this reason, oil and gas projects would normally be in a tax credit position81.
• The majority of producing countries exempt or negate the effect of Value Added Tax on projectsthat export. This is done by providing some sort of credit, refund, exemption, drawbacks ordeferrals at least during the initial phases of a project and/or to at least some type of purchases.
Advantages and Disadvantages to Host Governments
• Depending on the choice of system (whether outright exemption or some form of refund,credit, drawback or deferral) the administration of Value Added Tax for oil and gas projectscan be quite complex. In particular, if the capacity is not in place to administer a refund-based system, a sector specific exemption or an exemption limited to certain specializedinputs used exclusively in the oil and gas industry may be more efficient.
(continued )

42 World Bank Working Paper
Table 13. Value Added Tax (Continued )
Effect on Investment Decisions
• Value Added Tax has approximately the same effect on the investor’s cash flow/return oninvestment as import duties. For this reasons, fiscal systems that provide exemptions inrespect of at least specialized inputs are preferred by investors.
81This occurs in cases where production (that is zero-rated for VAT purposes) is only marginallysold in the local market. In these cases, the oil company would find itself in a continuous creditposition, claiming refunds on VAT paid on purchase of goods and services.
Table 14. Surface Taxes
How do they work?
• Surface fees are generally paid annually on the basis of the size of the property under lease.Different fees normally apply for exploration and production acreage. Surface fees are set ata nominal amount. Their aim is to discourage investors from holding on to acreage withoutexploring it.
Advantages and Disadvantages to Host Governments
• Surface fees are easy to calculate, collect and monitor. They have the advantage of providinga source of revenue, albeit limited, during each phase of a project life. When a governmentupstream agency exists, surface fees are often collected by the agency that uses the revenueflow to cover its administrative costs.
Effect on Investment Decisions
• Given their limited amount, surface fees do not present any particular disadvantage to investors.
Table 15. Bonuses
How do they work?
• Bonuses are commonly paid by the investing company upon signature of an exploration andproduction agreement. In some cases, bonuses may be paid upon discovery, declarationof commerciality, commissioning of facilities, start of production, and/or reaching targetproduction levels (daily or cumulative).
• Bonuses affect the project risk by increasing the exploration and development economicthresholds. To compensate for the risk, higher bonuses are balanced by lower royalties,taxes, production sharing, and/or government shares.
Advantages and Disadvantages to Host Governments
• Bonuses are easy to administer and provide an early form of revenue. The maximum levelof a bonus is very much dependent on the overall fiscal terms, the characteristics of theasset, the country political risk, and the risk profile of the targeted investors.
Effect on Investment Decisions
• High signature bonuses may discourage risk-adverse investors, especially when the politicalrisk is perceived to be high, or when there is a high level of geological uncertainty.
• Commerciality bonuses are also sensitive, as they increase the economic cut-off rate of a project.

Fiscal Systems for Hydrocarbons 43
Table 16. Government Participation
How do they work?
• Many PSCs provide an option for the host government (or the NOC) to participate in develop-ment projects. The government’s participation can take several forms. Participation maybe acquired as “working interest”, that is, on the same terms as might be available toother joint ventures partners.82 This may occur from the outset of a project (very rare);more often, the government may reserve the right to back into the project at some stage(normally at field development or production).83 The right may be acquired on concessionalterms or on favorable terms.84 The most common way consists of acquiring a carried interest:the government pays for its share out of future earnings of the project. In some countries,the government backs in without repaying the investor for the expenses borne and/or therisk taken during the exploration phase. The government may exercise its rights to participatein a project directly or through a state owned enterprise.
Advantages and Disadvantages to Host Governments
• Unless non-economic reasons (to increase the sense of ownership, to facilitate transfer of tech-nology, to increase the control over field development decisions) motivate a host governmentto participate directly in a project, it is not at all demonstrated that direct governmentparticipation provides benefits not otherwise available from conventional taxes.85
• Besides the cost and risks associated with equity participation, as well as other considerationsrelated to the allocation of a country’s resources, there may be a conflict of interest betweenthe government as equity holder and its role as regulator overseeing the environmental andsocial impact of a project.
• As government participation represents a cost to investors, the higher the percentageparticipation, the lower other fiscal terms.
Effect on Investment Decisions
• Government participation on concessional terms reduces the cash flow and increases therisk profile of the investment.
• In case the cash calls86 on governments are paid out of production, the investors are leftwith the burden of raising the entire financing.
• In some cases government direct participation in development activities may lead to suboptimalinvestment levels. Many investors regard the government participating option as a deterrent.87
82The working-interest owner bears the costs of exploration, development, and operation of anoil and gas asset and, in return, is entitled to a share of the production of that asset. Royaltyrights, net profit interest rights, rights in production payments, and the like do not constituteworking interests because they are not burdened with the responsibility to bear exploration,development and operating expenses. Likewise, contract rights to extract or share in oil and gas,or in the profits from extraction, without liability to share in the costs of production, do not constitute working interests.83In the majority of cases, the contractor bears the costs and risks of exploration. If a discoveryis made, the host government/NOC has the option to “back-in” for, or up to, a set percentageparticipating interest. Normally, the government participating interest is a working interestcarried through the exploration phase.84For example, exploration costs may or may not be reimbursed by the government; if reimbursed,interest that takes into account the time value of money/risk factor may or may not be applied.85In some cases the risks and costs of direct participation are such that the host governmentwould be better off solely taxing and regulating the project.86To cover operating and investment costs the operator issues cash calls to each joint ventureparticipant.87Operating and technical committees’ decision making processes may become less efficient. Inaddition, government participation reduces the percentage of reserves that can be booked by theinternational oil companies.

Table 17. Cost Recovery Limit88
How do they work?
• In many countries production sharing contracts (and sometimes concessions agreements)provide for limits on the percentage of crude oil production that can be used for costrecovery.89 After deduction of royalties, a percentage of the remaining revenue is used to recover costs. If costs exceed the cost recovery limit, the difference is carried forward forrecovery in subsequent periods.90 Most production sharing contracts allow for unlimitedcarry forward. Not all costs are recoverable for the purpose of cost recovery.91 The relevantaccounting rules are generally set in the contract or in the petroleum law.
Advantages and Disadvantages to Host Governments
• The cost recovery limit ensures that in each accounting period the government will have ashare of production. Cost recovery limits are less regressive than royalties. From an adminis-trative standpoint, it is more difficult to monitor cost recovery limits than royalties.
Effect on Investment Decisions
• In PSCs that have a cost recovery limit, this would normally range between 40-60 percent(Johnston 1994). Cost recovery limits have an effect on a project’s return on investmentsimilar to a royalty. Low cost recovery limits can be quite discouraging for the developmentof marginal fields.
88Cost recovery is a concept commonly applicable to contractual arrangements.89Concessionary systems normally do not have a cost recovery limit.90If recoverable costs are below the cost recovery limit in some countries, excess cost oil goesdirectly to the government (see for example Egypt and Syria).91Normally, cost recovery includes operating costs, expensed capital costs, depreciation anddepletion allowance, interest on financing, investment uplift, abandonment cost fund, andunrecovered costs carried over from previous years, but there are exceptions.
Table 18. Profit Oil Split92
How do they work?
• In production sharing contracts profit oil (or profit gas) is the revenue that remains after deduc-tion of royalty and cost recovery.93 In most cases the profit oil is split according to a sliding scaledefined on the basis of agreed parameters (these may include average daily production,cumulative volume of production, crude oil prices, value of production, R-Factor, and RoR).
• The profit oil (or profit gas) split between the host government and the investor is oftennegotiable.94
Advantages and Disadvantages to Host Governments
• Sliding scale profit oil splits are flexible arrangements that allow the government to provide asuitable fiscal package to a particular project without changing the overall fiscal framework.
• There appears to be a preference among governments for sliding scale profit oil based onproduction rates. Although these are easier to calculate than sliding scale profit oil based onR-factors or RoR, they are insensitive to changes in the price of crude oil and natural gas.
Effect on Investment Decisions
• Sliding scale profit oil split, especially if linked to R-Factors or, even better, to the return oninvestment, are favorably considered by investors as they lower the project specific risk byintroducing flexibility in the fiscal package to suit the actual profitability of the particularproject. Because of their flexibility, these types of arrangement are less likely to discouragethe development of marginal fields.
92Profit oil applies to contractual systems.93This concept corresponds to the taxable income in concessionary systems and to the service feein service contracts. The difference is linked to the ownership of hydrocarbons (at the deliverypoint in production sharing contracts, at wellhead in concessionary systems. In pure servicecontracts all production belongs to the government).94Approximately 80 percent of the profit oil split around the world has a sliding scale of somesort (D. Johnston).

Table 19. Foreign Exchange Controls
How do they work?
• Normally, investors are allowed to hold foreign exchange accounts offshore where they canearn hard currency based interest. They can receive and make payments related to the project directly offshore without the obligation to repatriate the proceeds in the country ofoperation. Conversion to local currency is normally limited to the amount needed to coverdomestic expenditure obligations, including tax payments.
Advantages and Disadvantages to Host Governments
• There are no particular disadvantages to government that apply limited foreign exchangecontrols, as controls over the convertibility of currencies have become less dominant than inthe past. To satisfy statistical needs, companies are normally asked to report all currencymovements to the central bank. To guarantee domestic expenditure obligations, performancebonds and similar guarantees are equally effective and less costly to investors. In countriesthat apply strict foreign exchange regulations, petroleum contracts normally grant exemptionsto oil and gas companies. This is because oil and gas normally is sold on international markets,and the proceeds of sale are often pledged as security for repayment of project loans.
Effect on Investment Decisions
• In cases where investors are required to surrender their foreign currency to the central bankat the time of export and repurchase the same at official rates to satisfy domestic projectobligations, the spread between buying and selling rates (assuming no other restriction)increases the cost of doing business. Restrictive foreign currency regulations contribute toincreasing the perception of sovereign risk, thus impacting a project’s net present value.
Table 20. Environmental Taxes and Bonds, and Other Performance Bonds
How do they work?
• Environment protection is one area in which many governments have started to imposegreater restrictions on investors’ freedom to operate. In some case, investors are asked topost performance bonds as security to comply with abandonment obligations. In othercases, environmental taxes are imposed. Insurance policies to cover environmental dam-ages are also a normal requirement. The costs associated with the protection of environ-ment are normally considered part of the cost of operations and are tax deductible. In somecases, penalties and the cost of remedial actions associated with damages in excess of thosepermitted by environmental regulations are not tax deductible.
• In the petroleum sector, bonds indemnify authorities against the investors’ failure to comply withcontractual obligations or the terms of the concession. This safeguards the government againsttechnical and financial failure and premature or unplanned project termination. The value of thebond is normally reduced in proportion to the value of the outstanding obligations. In some cases,holding company guarantees are used in addition to or instead of performance bonds.
Advantages and Disadvantages to Host Governments
• Direct taxation of environmental damages may be conceptually good for correcting divergencebetween private and social costs. However, it is quite complex to implement. In defining thetax treatment of environmental conservation and remediation, policy makers need to avoidpenalizing responsible operators. This is generally done by allowing the amortization ofenvironmental mitigation structures and equipment over their useful life and the deductionof current environmental expenses for tax calculation purposes.
• Under an ideal bonding regime, the financial risk is shifted from the government to theinvestor. In case of default, funds necessary to complete contractual obligations would bepromptly available, which makes it possible to avoid complicated and costly legal processes.
Effect on Investment Decisions
• The tax treatment of environmental obligations is of great importance to investors. Theability to deduct the cost of environmental compliance for tax calculation purposes lowersthe costs of compliance.
• Performance bonds have been greatly standardized and do not present particular problemsto investors. The cost of a bond will depend on the guarantees the financial institution imposeson or is willing to accept from the investors. Those guarantees are, in turn, a function of thecountry and project risks and of the investor’s standing and of the competitiveness of thechosen financial market.

46 World Bank Working Paper
Table 21. Local Content Obligations
How do they work?
• Local content obligations cover areas such as training requirement, local employment quotas,and the purchase of local goods and services. The objective of training obligations is tofacilitate the transfer of know-how from the investor to the host government/country. A specified number of government officials are seconded to certain departments in theinvestor’s organization for a set period of time, in some case with the dual purpose of train-ing and oversight of operations. In addition, funds are provided each year by the investor tocover the government’s training costs (these are normally between US$50–200,000 per yeardepending on the phase of development of the asset). Training and secondment costs arenormally cost recoverable and/or tax deductible. Local employment quotas are fairly com-mon in developing countries and are used to facilitate the creation of domestic employment.Requirements for the use of local goods and services are standard practice in developingcountries.95 Investors are normally asked to purchase the goods and services needed for theirproject locally if their quality is comparable with imported goods and services and their priceis not higher than a percentage set in the contract (normally 10 percent).
Advantages and Disadvantages to Host Governments
• Local content obligations allow the government to achieve a diversity of policy objectives,from transfer of technology and know how to strengthening of local industries and creationof local employment. However, governments should be mindful of the need to avoidincreasing inflationary pressure by allowing or imposing excessive salary scales or promotingexcessive mark-ups for local goods and services. In addition, given the international natureof the oil business and the fact that oil companies generally operate in more than one country,when deciding the level of secondments, consideration should be given to the absorptioncapacity of the investor’s organization (for example, small companies may not be able toaccommodate a large number of government trainees).
Effect on Investment Decisions
• Many countries impose some form of local content obligations, and investors have developedprocedures and systems to fulfill such requirements. Strict local content obligations normallyincrease the cost of operations and, in some cases, lower the company’s efficiency. Ultimately,part of the cost is transferred to the host government through the sharing mechanism incontracts and through taxation.
95Emphasis on local content has sharply increased over the past few years. In some countries,contractual obligations have been shored up with aggressive local content legislation (see forexample Angola, Equatorial Guinea, and Nigeria).

APPENDIX C
Government Take
47
US OCSUKNew Zealand Falkland Islands ArgentinaUS OCSSouth Africa TrinidadMongoliaPhilippines Pakistan Offshore
AustraliaEcuador Pakistan II Cambodia Gabon MoroccoPeru Mozambique Azerbaijan AIOC
Congo Z. MalaysiaAngolaColombia Yemen Late 1990sIndonesia 3rd Gen
Egypt OffshoreAzerbaijanEDPSA
Russia Sakhalin II Timor Gap ZOCA
NorwayEgypt Onshore Myanmar early 1990sQatar RDPSA
Nigeria Shelf
70% 50%
70% 50%90% 80% 60% 40%
Royalty/Tax System
PSC
Service Agreement
R “R” Factor
Rate of Return Feature ROR
ROR
R
Government Take [Oil]
40%60%80%
ROR
Deepwater
EffectiveRoyalty Rate %
Gvt. Participation%
Deepwater
Shallow
ROR
Frontier
Deepwater
0 0 5 9 14.6 16.7 2.4 25+ 30 13.5 4 0 25 12.5 22 22 10 23 19 0 12.5 13 7.5 8 31 5 40
0 6 0 30 38 46 16-20 18
Libya EPSA IV Jan., 2005
0 0 0 0 0 0 20 0-25 0 0 0 0 0 20 0 10 25 0 0 10 20 15 20 30
12.5 10 0 50 0 0 30
0 15 0
100% 30%
R
Source: D. Johnston, Course Workbook, Libya Licensing Round, August 2006.


APPENDIX D
Economic Impact ofAlternative Fiscal Parameters
49

Table 22. Economic Impact of Alternative Fiscal Parameters—Field A
10.0% 12.5% 15.0% (@ 10%) (@ 10%) (@ 10%) (@ 10%)10.0% 12.5% 15.0% 10.0% 12.5% 15.0% 10.0% 12.5% 15.0%Production (MBO) 20Price ($/Bbl) 35
Capex ($ Million) 123 Opex ($/Bbl) 4.54
18.64 20.67 22.88 18.64 20.67 22.88 17.48 19.18 21.32 17.07 18.75 20.59
Sensitivities:
Prod. +20% 96.1 72.0 53.4 30.6% 55.7% 96.1 72.0 53.4 30.6% 55.7% 96.9 74.8 57.3 33.4% 55.3% 100.5 77.1 58.8 33.3% 53.6%-20% 45.1 29.7 18.0 20.9% 61.2% 45.1 29.7 18.0 20.9% 61.2% 49.1 33.9 22.1 22.6% 57.7% 58.5 41.1 27.7 23.9% 49.6%
Price +20% 99.8 75.1 55.9 31.2% 55.4% 99.8 75.1 55.9 31.2% 55.4% 98.7 76.4 58.8 33.9% 55.9% 104.6 80.5 61.6 34.0% 53.3%-20% 41.3 26.6 15.5 20.1% 62.1% 41.3 26.6 15.5 20.1% 62.1% 46.5 31.7 20.3 22.0% 57.4% 55.5 38.5 25.5 23.2% 49.1%
Capex +20% 59.5 40.2 25.5 21.9% 60.2% 59.5 40.2 25.5 21.9% 60.2% 64.9 45.7 30.9 23.8% 56.6% 76.2 54.5 37.7 25.1% 49.0%-20% 81.7 61.5 45.9 31.4% 55.5% 81.7 61.5 45.9 31.4% 55.5% 80.9 62.7 48.3 34.2% 55.9% 85.6 66.0 50.6 34.3% 53.3%
Opex +20% 66.9 47.8 33.2 25.3% 58.0% 66.9 47.8 33.2 25.3% 58.0% 73.4 54.2 39.4 27.8% 54.0% 75.6 56.1 40.9 28.2% 52.5%-20% 74.3 53.9 38.3 26.7% 57.2% 74.3 53.9 38.3 26.7% 57.2% 75.3 56.4 41.6 28.8% 56.6% 79.3 59.2 43.6 29.1% 54.3%
Corp. Tax 25% C/R Limit 60% Corp. Tax 25% C/R Limit 60% Corp. Tax in lieu C/R Limit 60% C. Tax 25% C/R Limit 60%
NOC 0% NOC 0% NOC 0% NOC 0%
Royalty Royalty Royalty Royalty
0 < D/Pro 25 30% 3% 0 < C/Pro < 50 30% 3% R/F < 1 10% 3% RoR < 20% 10% 3%
25 < D/Pro 50 45% 6% 50 < C/Pro < 150 45% 6% 1 < R/F < 1.5 25% 6% 20% < RoR < 25% 25% 6%
50 < D/Pro 75 60% 8% 150 < C/Pro < 250 60% 8% 1.5 < R/F < 2 40% 8% 25% < RoR < 35% 40% 8%
75 < D/Pro 100 75% 10% 250 < C/Pro < 300 75% 10% 2 < R/F < 2.5 55% 10% 35% < RoR < 50% 55% 10%
100 < D/Pro 90% 12% 300 < C/Pro 90% 12% 2.5 < R/F < 3 70% 12% 50% < RoR < 65% 70% 12%
3 < R/F 85% 14% 65% < RoR 85% 14%
stress test NPV(10) 5.9 NPV(15) (12.2) NPV(10) 5.9 NPV(15) (12.2) NPV(10) 13.9 NPV(15) (6.3) NPV(10) 17.4 NPV(15) (4.4)
P/O SplitP/O Split P/O Split P/O Split
- - -
Price limit ($/Bbl)
52.0%NOC’s - - - - - - - -
79.9 59.6 43.9 29.0% 54.7 40.0 28.2%
55.9% -
35.7 26.0%
57.6%
73.5 26.0%
57.6%
70.6 50.9 Investor’s 70.6 50.9 35.7
($ Million) ($ Million) ($ Million) ($ Million)Govt. Take
Investor’s NPVInvestor’s NPVIRR IRR
Govt. Take
RoR
Field AInvestor’s NPV
IRRGovt.Take
Investor’s NPVIRR
Govt. Take
Production Sharing based on: R-Factor
Fiscal Model No. 4Fiscal Model No. 3
Cumulative Production
Fiscal Model No. 2
Daily Production
Fiscal Model No. 1

Table 23. Economic Impact of Alternative Fiscal Parameters—Field B
10.0% 12.5% 15.0% (@ 10%) 10.0% 12.5% 15.0% (@ 10%) 10.0% 12.5% 15.0% (@ 10%) 10.0% 12.5% 15.0% (@ 10%)Production (MBO) 50 Price ($/Bbl) 35
Capex ($ Million) 234 Opex ($/Bbl) 4.24
15.05 16.54 18.22 15.05 16.54 18.21 14.13 15.39 16.96 13.79 15.07 16.46
Sensitivities:
Prod. +20% 278.1 215.8 167.5 38.8% 53.5% 272.0 211.8 164.8 38.8% 54.5% 254.9 202.4 160.7 41.4% 57.4% 245.7 194.6 154.1 40.7% 58.9%-20% 149.4 109.2 78.3 27.5% 56.6% 149.4 109.2 78.3 27.5% 56.6% 151.5 114.2 85.0 29.8% 56.0% 159.3 119.8 89.0 30.1% 53.7%
Price +20% 286.8 222.9 173.4 39.4% 53.3% 286.7 222.9 173.4 39.4% 53.3% 257.9 205.6 164.0 42.1% 58.0% 246.8 195.6 155.1 41.0% 59.8%-20% 140.7 102.0 72.4 26.7% 57.1% 140.6 102.0 72.4 26.7% 57.1% 147.8 110.6 81.5 29.1% 54.9% 149.8 111.9 82.3 29.1% 54.3%
Capex +20% 192.4 142.0 103.2 28.6% 56.1% 192.4 142.0 103.2 28.6% 56.1% 192.5 146.4 110.2 31.0% 56.1% 205.6 155.9 117.1 31.4% 53.1%-20% 235.0 183.0 142.6 39.9% 53.3% 235.0 183.0 142.6 39.9% 53.3% 216.0 172.1 137.2 42.7% 57.1% 202.5 160.8 127.7 41.5% 59.8%
Opex +20% 205.0 155.4 117.0 32.7% 54.9% 205.0 155.3 117.0 32.7% 54.9% 203.4 158.6 123.1 35.7% 55.2% 205.3 159.8 123.8 35.7% 54.8%-20% 222.4 169.6 128.8 34.2% 54.4% 222.4 169.6 128.8 34.2% 54.4% 212.8 166.4 129.7 36.7% 56.4% 211.4 165.0 128.4 36.5% 56.6%
Corp. Tax 25% C/R Limit 60% Corp. Tax 25% C/R Limit 60% Corp. Tax 25% C/R Limit 60% C. Tax 25% C/R Limit 60%
NOC 0% NOC 0% NOC 0% NOC 0%
Royalty Royalty Royalty Royalty
0 < D/Pro 25 30% 3% 0 < C/Pro < 50 30% 3% R/F < 1 10% 3% RoR < 20% 10% 3%
25 < D/Pro 50 45% 6% 50 < C/Pro < 150 45% 6% 1 < R/F < 1.5 25% 6% 20% < RoR < 25% 25% 6%
50 < D/Pro 75 60% 8% 150 < C/Pro < 250 60% 8% 1.5 < R/F < 2 40% 8% 25% < RoR < 35% 40% 8%
75 < D/Pro 100 75% 10% 250 < C/Pro < 300 75% 10% 2 < R/F < 2.5 55% 10% 35% < RoR < 50% 55% 10%
100 < D/Pro 90% 12% 300 < C/Pro 90% 12% 2.5 < R/F < 3 70% 12% 50% < RoR < 65% 70% 12%
3 < R/F 85% 14% 65% < RoR 85% 14%
stress test NPV(10) 61.8 NPV(15) 12.5 NPV(10) 61.8 NPV(15) 12.5 NPV(10) 74.8 NPV(15) 23.5 NPV(10) 95.6 NPV(15) 35.1
IRRGovt. Take
P/O Split
211.0 164.8 128.3 36.4%
P/O Split P/O Split P/O Split
- - - -
Price limit ($/Bbl)
55.2%NOC’s - - - - - - -
166.1 129.4 36.6%
54.9% -
122.9 33.4%
54.6%
212.4 33.4%
54.6%
213.7 162.5 Investor’s 213.7 162.5 122.9
($ Million) ($ Million) ($ Million) ($ Million)Govt. Take
Investor’s NPV Investor’s NPV IRR
RoR
Field BInvestor’s NPV
IRRGovt. Take
Investor’s NPV IRR
Govt. Take
Production Sharing based on: Daily Production Cumulative Production R-Factor
Fiscal Model No. 1 Fiscal Model No. 2 Fiscal Model No. 3 Fiscal Model No. 4

Table 24. Economic Impact of Alternative Fiscal Parameters—Field C
10.0% 12.5% 15.0% (@ 10%) 10.0% 12.5% 15.0% (@ 10%) 10.0% 12.5% 15.0% (@ 10%) 10.0% 12.5% 15.0% (@ 10%)
Production (MBO) 100 Price ($/Bbl) 35
Capex ($ Million) 336 Opex ($/Bbl) 3.05
10.56 11.49 12.55 11.32 11.83 12.95 10.00 10.66 11.54 9.62 10.44 11.31
Sensitivities:
Prod. +20% 629.3 502.4 403.7 55.7% 53.8% 578.2 465.9 377.5 56.5% 57.5% 531.5 439.0 364.2 62.6% 60.9% 374.0 309.3 256.6 55.7% 72.5%-20% 389.1 304.1 238.2 42.0% 53.2% 361.2 283.7 223.1 41.6% 56.5% 346.4 278.4 224.1 45.5% 58.3% 339.1 270.7 216.5 44.5% 59.2%
Price +20% 660.2 528.6 426.1 57.7% 52.3% 604.7 487.8 395.8 57.7% 56.3% 529.8 438.6 364.7 63.3% 61.7% 382.1 316.3 262.6 56.5% 72.4%-20% 370.3 288.4 224.9 40.7% 54.1% 334.6 262.0 205.3 40.2% 58.5% 357.0 285.3 228.4 45.0% 55.8% 327.5 260.9 208.2 43.6% 59.4%
Capex +20% 486.2 380.6 298.8 43.0% 53.7% 440.4 346.9 273.8 42.6% 58.1% 433.0 349.8 283.1 47.3% 58.8% 432.0 346.1 278.0 46.3% 58.9%-20% 544.4 436.4 352.1 58.6% 52.3% 498.9 402.9 327.3 58.6% 56.3% 447.8 370.5 307.9 64.4% 60.8% 315.8 261.8 217.7 57.5% 72.3%
Opex +20% 502.8 398.3 317.0 49.0% 53.1% 458.1 365.3 292.5 48.7% 57.3% 444.6 363.6 298.4 54.4% 58.5% 355.1 290.9 238.8 50.5% 66.9%-20% 527.7 418.7 334.0 50.3% 52.9% 481.2 384.5 308.6 50.1% 57.0% 443.5 363.4 298.9 55.3% 60.4% 357.0 292.4 239.9 50.8% 68.1%
Corp. Tax 25 C/R Limit 60% Corp. Tax 25% C/R Limit 60% Corp. Tax 25% C/R Limit 60% C. Tax 25% C/R Limit 60%
NOC 0% NOC 0% NOC 0% NOC 0%
Royalty Royalty Royalty Royalty
0 < D/Pro 25 30% 3% 0 < C/Pro < 50 30% 3% R/F < 1 10% 3% RoR < 20% 10%
25 < D/Pro 50 45% 6% 50 < C/Pro < 150 45% 6% 1 < R/F < 1.5 25% 6% 20% < RoR < 25% 25%
50 < D/Pro 75 60% 8% 150 < C/Pro < 250 60% 8% 1.5 < R/F < 2 40% 8% 25% < RoR < 35% 40%
75 < D/Pro 100 75% 10% 250 < C/Pro < 300 75% 10% 2 < R/F < 2.5 55% 10% 35% < RoR < 50% 55%
100 < D/Pro 90% 12% 300 < C/Pro 90% 12% 2.5 < R/F < 3 70% 12% 50% < RoR < 65% 70%
3 < R/F 85% 14% 65% < RoR 85%
3%
6%
8%
10%
12%
14%
stress test NPV(10) (48.5) NPV(15) (82.2) NPV(10) 211.0 NPV(15) 111.3 NPV(10) 242.0 NPV(15) 137.1 NPV(10) 247.6 NPV(15) 139.6
P/O SplitP/O Split P/O Split P/O Split
- - -
Price limit ($/Bbl)
66.8%NOC’s - - - - - - - -
363.4 296.8 242.9 50.4% 373.3 306.7 55.2%
58.4% -
300.6 49.4%
57.1%
456.0 49.7%
53.0%
469.7 374.9 Investor’s 515.3 408.5 325.5
($ Million) ($ Million) ($ Million) ($ Million)Govt. Take
Investor’s NPV Investor’s NPV IRR IRR
Govt. Take
RoR
Field CInvestor’s NPV
IRRGovt. Take
Investor’s NPV IRR
Govt. Take
Production Sharing based on: Daily Production Cumulative Production R-FactorFiscal Model No. 1 Fiscal Model No. 2 Fiscal Model No. 3 Fiscal Model No. 4

Table 25. Economic Impact of Alternative Fiscal Parameters—Field D
10.0% 12.5% 15.0% (@ 10%) 10.0% 12.5% 15.0% (@ 10%) 10.0% 12.5% 15.0% (@ 10%) 10.0% 12.5% 15.0% (@ 10%)
Production (MBO) 600 Price ($/Bbl) 35
Capex ($ Million) 4,615 Opex ($/Bbl) 2.31
29.41 36.35 44.38 35.23 41.02 47.12 20.30 23.76 27.65 19.44 22.36 25.55
Sensitivities:
Prod. +20% 606.7 106.3 (269.5) 13.1% 90.3% 237.7 (99.4) (365.4) 11.7% 96.2% 2,461.6 1,721.8 1,140.1 22.7% 60.5% 3,277.7 2,347.1 1,624.1 24.8% 47.4%-20% 93.6 (316.7) (623.0) 10.5% 96.8% (265.8) (548.3) (766.9) 8.1% 109.1% 1,014.3 474.8 59.8 15.4% 65.4% 1,455.4 805.5 310.3 17.0% 50.3%
Price +20% 853.0 305.8 (106.0) 14.3% 86.5% 417.8 52.2 (237.1) 12.9% 93.4% 2,497.1 1,749.9 1,162.7 22.8% 60.4% 3,325.0 2,383.8 1,653.0 24.9% 47.3%-20% (109.8) (482.4) (759.6) 9.4% 103.9% (430.2) (684.2) (880.1) 6.8% 115.1% 974.0 443.2 34.6 15.2% 65.8% 1,402.4 764.6 278.3 16.8% 50.8%
Capex +20% 8.6 (462.6) (813.7) 10.0% 99.8% (428.7) (742.8) (985.9) 7.4% 111.1% 1,386.9 716.5 198.9 16.2% 63.9% 1,963.6 1,147.1 524.0 17.8% 48.9%-20% 747.4 299.2 (38.7) 14.7% 85.9% 407.2 105.2 (134.2) 13.5% 92.3% 2,144.5 1,525.6 1,038.3 23.7% 59.6% 2,676.9 1,934.8 1,355.6 25.3% 49.6%
Opex +20% 358.5 (93.8) (433.3) 11.9% 92.0% (27.5) (331.8) (570.3) 9.8% 100.6% 1,714.5 1,082.2 588.5 19.1% 61.9% 2,374.0 1,585.6 976.6 21.1% 47.2%-20% 414.4 (52.1) (401.6) 12.2% 91.1% (1.3) (310.2) (552.2) 10.0% 100.0% 1,789.2 1,141.3 635.9 19.4% 61.6% 2,472.1 1,661.7 1,036.5 21.4% 46.9%
Corp. Tax 25 C/R Limit 60% Corp. Tax 25% C/R Limit 60% Corp. Tax 25% C/R Limit 60% C.Tax 25% C/R Limit 60%
NOC 0% NOC 0% NOC 0% NOC 0%
Royalty Royalty Royalty Royalty
0 < D/Pro 25 30% 3% 0 < C/Pro < 50 30% 3% R/F < 1 10% 3% RoR < 5% 10% 3%
25 < D/Pro 50 45% 6% 50 < C/Pro < 150 45% 6% 1 < R/F < 1.5 25% 6% 5% < RoR < 15% 30% 6%
50 < D/Pro 75 60% 8% 150 < C/Pro < 250 60% 8% 1.5 < R/F < 2 40% 8% 15% < RoR < 25% 45% 8%
75 < D/Pro 100 75% 10% 250 < C/Pro < 300 75% 10% 2 < R/F < 2.5 55% 10% 25% < RoR < 35% 60% 10%
100 < D/Pro 90% 12% 300 < C/Pro 90% 12% 2.5 < R/F < 3 70% 12% 35% < RoR < 45% 75% 12%
3 < R/F 85% 14% 45% < RoR 90% 14%
stress test NPV(10) (1,012.0) NPV(15) (1,571.7) NPV(10) (1,092.7) NPV(15) (1,556.0) NPV(10) (216.4) NPV(15) (973.3) NPV(10) (87.8) NPV(15) (904.4)
P/O SplitP/O Split P/O Split P/O Split
- - -
Price limit ($/Bbl)
47.1%NOC’s - - - - - - - -
2,423.0 1,623.6 1,006.6 21.2% 1,111.7 612.2 19.2%
61.7% -
(561.2) 9.9%
100.3%
1,751.8 12.1%
91.6%
(14.4) (321.0)Investor’s 386.4 (72.9) (417.5)
($ Million) ($ Million) ($ Million) ($ Million)Govt. Take
Investor’s NPV Investor’s NPV IRR IRR
Govt. Take
RoR
Field DInvestor’s NPV
IRRGovt. Take
Investor’s NPV IRR
Govt. Take
Production Sharing based on: Daily Production Cumulative Production R-FactorFiscal Model No. 1 Fiscal Model No. 2 Fiscal Model No. 3 Fiscal Model No. 4


APPENDIX E
Government Take and ProjectIRR at Different Levels of Cost Recovery Limit
55

56W
orld Bank Working Paper
Graph 1. Government Take and Project IRR at Different Levels of Cost Recovery Limit—Field A
Field AGovernment Take and Project IRR at Different Cost Recovery Limit
Fiscal Model 4
0.0%
10.0%
20.0%
30.0%
40.0%
50.0%
60.0%
10% 20% 30% 40% 50% 60% 70% 80% 90% 100%
Cost Recovery Limit
Per
cent
age
Gov
ernm
ent T
ake
68.0
70.0
72.0
74.0
76.0
78.0
80.0
82.0
Con
trac
tor’
s C
ash
Flow
(NP
V 1
0%)
IRR Govt Take NPV
Field AGovernment Take and Project IRR at Different Cost Recovery Limit
Fiscal Model 3
0.0%
10.0%
20.0%
30.0%
40.0%
50.0%
60.0%
70.0%
10% 20% 30% 40% 50% 60% 70% 80% 90% 100%
Cost Recovery Limit
Per
cent
age
Gov
ernm
ent T
ake
66.0
67.0
68.0
69.0
70.0
71.0
72.0
73.0
74.0
75.0
Con
trac
tor’
s C
ash
Flow
(NP
V 1
0%)
IRR Govt Take NPV
Field AGovernment Take and Project IRR at Different Cost Recovery Limit
Fiscal Model 1
0.0%
10.0%
20.0%
30.0%
40.0%
50.0%
60.0%
70.0%
80.0%
10% 20% 30% 40% 50% 60% 70% 80% 90% 100%
Cost Recovery Limit
Per
cent
age
Gov
ernm
ent T
ake
-
10.0
20.0
30.0
40.0
50.0
60.0
70.0
80.0
Con
trac
tor'
s C
ash
Flow
(NP
V 1
0%)
IRR Govt Take NPV
Field AGovernment Take and Project IRR at Different Cost Recovery Limit
Fiscal Model 2
0.0%
10.0%
20.0%
30.0%
40.0%
50.0%
60.0%
70.0%
80.0%
10% 20% 30% 40% 50% 60% 70% 80% 90% 100%
Cost Recovery Limit
Per
cent
age
Gov
ernm
ent T
ake
-
10.0
20.0
30.0
40.0
50.0
60.0
70.0
80.0
Con
trac
tor’
s C
ash
Flow
(NP
V 1
0%)
IRR Govt Take NPV

Fiscal Systems for H
ydrocarbons57
Graph 2. Government Take and Project IRR at Different Levels of Cost Recovery Limit—Field B
Field BGovernment Take and Project IRR at Different Cost Recovery Limit
Fiscal Model 1
0.0%
10.0%
20.0%
30.0%
40.0%
50.0%
60.0%
70.0%
10% 20% 30% 40% 50% 60% 70% 80% 90% 100%
Cost Recovery Limit
Per
cen
tag
eG
ove
rnm
ent
Tak
e
165.0
170.0
175.0
180.0
185.0
190.0
195.0
200.0
205.0
210.0
215.0
220.0
Co
ntr
acto
r’s
Cas
hF
low
(N
PV
10%
)
IRR Govt Take NPV
Field BGovernment Take and Project IRR at Different Cost Recovery Limit
Fiscal Model 2
0.0%
10.0%
20.0%
30.0%
40.0%
50.0%
60.0%
70.0%
10% 30%20% 40% 50% 60% 70% 80% 90% 100%
Cost Recovery Limit
Per
cen
tag
eG
ove
rnm
ent
Tak
e
165.0
170.0
175.0
180.0
185.0
190.0
195.0
200.0
205.0
210.0
215.0
220.0
Co
ntr
acto
r’s
Cas
hF
low
(N
PV
10%
)
IRR Govt Take NPV
Field BGovernment Take and Project IRR at Different Cost Recovery Limit
Fiscal Model 4
0.0%
10.0%
20.0%
30.0%
40.0%
50.0%
60.0%
70.0%
10% 20% 30% 40% 50% 60% 80%70% 90% 100%
Cost Recovery Limit
Per
cen
tag
eG
ove
rnm
ent
Tak
e
194.0
196.0
198.0
200.0
202.0
204.0
206.0
208.0
210.0
212.0
214.0
216.0
Co
ntr
acto
r’s
Cas
hF
low
(N
PV
10%
)
IRR Govt Take NPV
Field BGovernment Take and Project IRR at Different Cost Recovery Limit
Fiscal Model 3
0.0%
10.0%
20.0%
30.0%
40.0%
50.0%
60.0%
70.0%
10% 20% 30% 40% 50% 60% 70% 80% 90% 100%
Cost Recovery Limit
Per
cen
tag
eG
ove
rnm
ent
Tak
e
180.0
185.0
190.0
195.0
200.0
205.0
210.0
215.0
220.0
Co
ntr
acto
r’s
Cas
hF
low
(N
PV
10%
)
IRR Govt Take NPV

58W
orld Bank Working Paper
Graph 3. Government Take and Project IRR at Different Levels of Cost Recovery Limit—Field C
Note: The combined effect of royalties and cost recovery limit may produce a Government Take above 100 percent. In these cases, the graphs conventionally showa Government Take of 101 percent.
Field CGovernment Take and Project IRR at Different Cost Recovery Limit
Fiscal Model 3
50.0%
52.0%
54.0%
56.0%
58.0%
60.0%
62.0%
Cost Recovery Limit
Per
cent
age
Gov
ernm
ent T
ake
410.0
420.0
430.0
440.0
450.0
460.0
470.0
Con
trac
tor’
s C
ash
Flow
(NP
V 1
0%)
IRR Govt Take NPV
Field CGovernment Take and Project IRR at Different Cost Recovery Limit
Fiscal Model 4
0.0%
10.0%
20.0%
30.0%
40.0%
50.0%
60.0%
70.0%
80.0%
Cost Recovery Limit
Per
cent
age
Gov
ernm
ent T
ake
340.0
350.0
360.0
370.0
380.0
390.0
400.0
Con
trac
tor’
s C
ash
Flow
(NP
V 1
0%)
IRR Govt Take NPV
Field CGovernment Take and Project IRR at Different Cost Recovery Limit
Fiscal Model 2
0.0%
10.0%
20.0%
30.0%
40.0%
50.0%
60.0%
70.0%
Cost Recovery Limit
Per
cent
age
Gov
ernm
ent T
ake
410.0
420.0
430.0
440.0
450.0
460.0
470.0
480.0
Con
trac
tor’
s C
ash
Flow
(NP
V 1
0%)
IRR Govt Take NPV
Field CGovernment Take and Project IRR at Different Cost Recovery Limit
Fiscal Model 1
42.0%
44.0%
46.0%
48.0%
50.0%
52.0%
54.0%
56.0%
58.0%
10% 20% 50%40%30% 60% 90%80%70% 100% 10% 20% 50%40%30% 60% 90%80%70% 100%
10% 20% 50%40%30% 60% 90%80%70% 100%10% 20% 50%40%30% 60% 90%80%70% 100%
Cost Recovery Limit
Per
cent
age
Gov
ernm
ent T
ake
460.0
470.0
480.0
490.0
500.0
510.0
520.0
Con
trac
tor’
s C
ash
Flow
(NP
V 1
0%)
IRR Govt Take NPV

Fiscal Systems for H
ydrocarbons59
Graph 4. Government Take and Project IRR at Different Levels of Cost Recovery Limit—Field D
Note: The combined effect of royalties and cost recovery limit may produce a government take above 100 percent. In these cases, the graphs conventionally show agovernment take of 101 percent.
Field DGovernment Take and Project IRR at Different Cost Recovery Limit
Fiscal Model 3
0.0%
10.0%
20.0%
30.0%
40.0%
50.0%
60.0%
70.0%
Cost Recovery Limit
Per
cent
age
Gov
ernm
ent T
ake
1,550.0
1,600.0
1,650.0
1,700.0
1,750.0
1,800.0
1,850.0
Con
trac
tor’
s C
ash
Flow
(NP
V 1
0%)
IRR Govt Take NPV
Field DGovernment Take and Project IRR at Different Cost Recovery Limit
Fiscal Model 2
0.0%
20.0%
40.0%
60.0%
80.0%
100.0%
120.0%
Cost Recovery Limit
Per
cent
age
Gov
ernm
ent T
ake
(900.0)
(800.0)
(700.0)
(600.0)
(500.0)
(400.0)
(300.0)
(200.0)
(100.0)
-
100.0
Con
trac
tor’
s C
ash
Flow
(NP
V 1
0%)
IRR Govt Take NPV
Field DGovernment Take and Project IRR at Different Cost Recovery Limit
Fiscal Model 1
0.0%
20.0%
40.0%
60.0%
80.0%
100.0%
120.0%
10% 20% 30% 40% 70%60%50% 80% 90% 100% 10% 20% 30% 40% 70%60%50% 80% 90% 100%
10% 20% 30% 40% 70%60%50% 80% 90% 100%10% 20% 30% 40% 70%60%50% 80% 90% 100%
Cost Recovery Limit
Per
cent
age
Gov
ernm
ent T
ake
(800.0)
(600.0)
(400.0)
(200.0)
-
200.0
400.0
600.0
Con
trac
tor’
s C
ash
Flow
(NP
V 1
0%)
IRR Govt Take NPV
Field DGovernment Take and Project IRR at Different Cost Recovery Limit
Fiscal Model 4
0.0%
10.0%
20.0%
30.0%
40.0%
50.0%
60.0%
70.0%
Cost Recovery Limit
Per
cent
age
Gov
ernm
ent T
ake
2,240.0
2,260.0
2,280.0
2,300.0
2,320.0
2,340.0
2,360.0
2,380.0
2,400.0
2,420.0
2,440.0
Con
trac
tor’
s C
ash
Flow
(NP
V 1
0%)
IRR Govt Take NPV


APPENDIX F
Field A, Fiscal Model 1Alternative Triggers
61

10.0% 12.5% 15.0% (@ 10%) 10.0% 12.5% 15.0% (@ 10%) 10.0% 12.5% 15.0% (@ 10%)
C. Tax 25% C/R Limit 60% C. Tax 25% C/R Limi 60% C. Tax 25% C/R Lim 60%
NOC 0% NOC 0% NOC 0%
Royalty Royalty Royalty
RoR < 20% 10% 3% RoR < 5% 10% 3% RoR < 5% 10% 3%
20% < RoR < 25% 25% 6% 5% < RoR < 25% 25% 6% 5% < RoR < 10% 25%
25% < RoR < 35% 40% 8% 25% < RoR < 45% 40% 8% 10% < RoR < 15% 40%
35% < RoR < 50% 55% 10% 45% < RoR < 65% 55% 10% 15% < RoR < 20% 55%
50% < RoR < 65% 70% 12% 65% < RoR < 85% 70% 12% 20% < RoR < 25% 70%
65% < RoR 85% 14% 85% < RoR 85% 14% 25% < RoR 85%
6%
6%
10%
12%
14%
55.2 40.1
Govt. TakeIRR IRR
($ Million)
Govt.Take
Investor’s NPV ($ Million)
31.2 21.5 28.0% 55.2% 23.8% 74.0% 79.9 59.6 43.3 74.5 52.0% 43.9
Fiscal Model 1 Fiscal Model 1/A Fiscal Model 1/B
Investor’s NPV ($ Million)
IRRInvestor’s NPV
Govt. Take
29.0%
P/O Split P/O Split P/O Split
Field AGovernment Take and Project IRR at Different Price Levels
Fiscal Model 1
0.0%
20.0%
40.0%
60.0%
80.0%
100.0%
120.0%
15 20 25 30 35 40 45 50 55 60
Price (US$/Bbl)
Per
cen
tag
eG
ove
rnm
ent
Tak
e
0.0%
5.0%
10.0%
15.0%
20.0%
25.0%
30.0%
35.0%
40.0%
45.0%
50.0%
Per
cen
tag
e IR
R
Government Take Project’s IRR
Field AGovernment Take and Project IRR at Different Price Levels
Fiscal Model 1/B
0.0%
20.0%
40.0%
60.0%
80.0%
100.0%
120.0%
15 20 25 30 35 40 45 50 55 60
Price (US$/Bbl)
Per
cen
tag
eG
ove
rnm
ent
Tak
e
0.0%
5.0%
10.0%
15.0%
20.0%
25.0%
30.0%
35.0%
40.0%
Per
cen
tag
e IR
R
Government Take Project’s IRR
Field AGovernment Take and Project IRR at Different Price Levels
Fiscal Model 1/A
0.0%
20.0%
40.0%
60.0%
80.0%
100.0%
120.0%
15 20 25 30 35 40 45 50 55 60
Price (US$/Bbl)
Per
cen
tag
eG
ove
rnm
ent
Tak
e
0.0%
5.0%
10.0%
15.0%
20.0%
25.0%
30.0%
35.0%
40.0%
45.0%
50.0%
Per
cen
tag
e IR
R
Government Take Project’s IRR
.shparg eseht ni nwohs sledomlacsif eht gnomayravtilps lio tiforp dna seitlayor gnitaluclac rof sdlohserht eht ylnO :etoN

APPENDIX G
Government Take and ProjectIRR at Different Price Levels
63

64W
orld Bank Working Paper
Graph 5. Government Take and Project IRR at Different Price Levels—Field A
Note: The combined effect of royalties and cost recovery limit may produce a government take above 100 percent. In these cases, the graphs conventionally showa government take of 101 percent.
Field AGovernment Take and Project IRR at Different Price Levels
Fiscal Model 1
0.0%
20.0%
40.0%
60.0%
80.0%
100.0%
120.0%
15 20 25 30 35 40 45 50 55 60
Price (US$/Bbl)
Per
cen
tag
eG
ove
rnm
ent
Tak
e
0.0%
5.0%
10.0%
15.0%
20.0%
25.0%
30.0%
35.0%
40.0%
45.0%
Per
cen
tag
e IR
R
Government Take Project’s IRR
Field AGovernment Take and Project IRR at Different Price Levels
Fiscal Model 3
0.0%
20.0%
40.0%
60.0%
80.0%
100.0%
120.0%
15 20 25 30 35 40 45 50 55 60
Price (US$/Bbl)
Per
cen
tag
eG
ove
rnm
ent
Tak
e
0.0%
5.0%
10.0%
15.0%
20.0%
25.0%
30.0%
35.0%
40.0%
50.0%
45.0%
Per
cen
tag
e IR
R
Government Take Project’s IRR
Field AGovernment Take and Project IRR at Different Price Levels
Fiscal Model 2
0.0%
20.0%
40.0%
60.0%
80.0%
100.0%
120.0%
15 20 25 30 35 40 45 50 55 60
Price (US$/Bbl)
Per
cen
tag
eG
ove
rnm
ent
Tak
e
0.0%
5.0%
10.0%
15.0%
20.0%
25.0%
30.0%
35.0%
40.0%
45.0%
Per
cen
tag
e IR
R
Government Take Project’s IRR
Field AGovernment Take and Project IRR at Different Price Levels
Fiscal Model 4
0.0%
20.0%
40.0%
60.0%
80.0%
100.0%
120.0%
15 20 25 30 35 40 45 50 55 60
Price (US$/Bbl)
Per
cen
tag
eG
ove
rnm
ent
Tak
e0.0%
5.0%
10.0%
15.0%
20.0%
25.0%
30.0%
35.0%
40.0%
50.0%
45.0%
Per
cen
tag
e IR
R
Government Take Project’s IRR

Fiscal Systems for H
ydrocarbons65
Graph 6. Government Take and Project IRR at Different Price Levels—Field B
Note: The combined effect of royalties and cost recovery limit may produce a government take above 100 percent. In these cases, the graphs conventionally showa government take of 101 percent.
Field BGovernment Take and Project IRR at Different Price Levels
Fiscal Model 1
0.0%
20.0%
40.0%
60.0%
80.0%
100.0%
120.0%
13 20 25 30 35 40 45 50 55 60
Price (US$/Bbl)
Per
cen
tag
eG
ove
rnm
ent
Tak
e
0.0%
10.0%
20.0%
50.0%
30.0%
60.0%
40.0%
Per
cen
tag
e IR
R
Government Take Project’s IRR
Field BGovernment Take and Project IRR at Different Price Levels
Fiscal Model 3
0.0%
20.0%
40.0%
60.0%
80.0%
100.0%
120.0%
13 20 25 30 35 40 45 50 55 60
Price (US$/Bbl)
Per
cen
tag
eG
ove
rnm
ent
Tak
e
0.0%
10.0%
20.0%
50.0%
30.0%
60.0%
40.0%P
erce
nta
ge
IRR
Government Take Project’s IRR
Field BGovernment Take and Project IRR at Different Price Levels
Fiscal Model 2
0.0%
20.0%
40.0%
60.0%
80.0%
100.0%
120.0%
13 20 25 30 35 40 45 50 55 60
Price (US$/Bbl)
Per
cen
tag
eG
ove
rnm
ent
Tak
e
0.0%
10.0%
20.0%
50.0%
30.0%
60.0%
40.0%
Per
cen
tag
e IR
R
Government Take Project’s IRR
Field BGovernment Take and Project IRR at Different Price Levels
Fiscal Model 4
0.0%
20.0%
40.0%
60.0%
80.0%
100.0%
120.0%
13 20 25 30 35 40 45 50 55 60
Price (US$/Bbl)
Per
cen
tag
eG
ove
rnm
ent
Tak
e
0.0%
10.0%
20.0%
50.0%
30.0%
60.0%
40.0%
Per
cen
tag
e IR
R
Government Take Project’s IRR

66W
orld Bank Working Paper
Graph 7. Government Take and Project IRR at Different Price Levels—Field C
Field CGovernment Take and Project IRR at Different Price Levels
Fiscal Model 1
0.0%
10.0%
20.0%
30.0%
40.0%
50.0%
60.0%
70.0%
15 20 25 30 35 40 45 50 55 60
Price (US$/mmcf)
Per
cen
tag
eG
ove
rnm
ent
Tak
e
0.0%
10.0%
20.0%
50.0%
30.0%
60.0%
70.0%
80.0%
40.0%
Per
cen
tag
e IR
R
Government Take Project’s IRR
Field CGovernment Take and Project IRR at Different Price Levels
Fiscal Model 3
0.0%
30.0%
20.0%
10.0%
40.0%
50.0%
60.0%
70.0%
80.0%
15 20 25 30 35 40 45 50 55 60
Price (US$/mmcf)
Per
cen
tag
eG
ove
rnm
ent
Tak
e
0.0%
40.0%
30.0%
20.0%
10.0%
50.0%
80.0%
60.0%
90.0%
70.0%
Per
cen
tag
e IR
R
Government Take Project’s IRR
Field CGovernment Take and Project IRR at Different Price Levels
Fiscal Model 2
0.0%
10.0%
20.0%
30.0%
40.0%
50.0%
60.0%
70.0%
80.0%
15 20 25 30 35 40 45 50 55 60
Price (US$/mmcf)
Per
cen
tag
eG
ove
rnm
ent
Tak
e
0.0%
10.0%
20.0%
50.0%
30.0%
60.0%
70.0%
80.0%
40.0%
Per
cen
tag
e IR
R
Government Take Project’s IRR
Field CGovernment Take and Project IRR at Different Price Levels
Fiscal Model 4
0.0%
10.0%
20.0%
30.0%
40.0%
50.0%
60.0%
70.0%
80.0%
15 20 25 30 35 40 45 50 55 60
Price (US$/mmcf)
Per
cen
tag
eG
ove
rnm
ent
Tak
e
0.0%
10.0%
20.0%
50.0%
30.0%
60.0%
70.0%
80.0%
40.0%
Per
cen
tag
e IR
R
Government Take Project’s IRR

Fiscal Systems for H
ydrocarbons67
Graph 8. Government Take and Project IRR at Different Price Levels—Field D
Note: The combined effect of royalties and cost recovery limit may produce a government take above 100 percent. In these cases, the graphs conventionally show agovernment take of 101 percent.
Field DGovernment Take and Project IRR at Different Price Levels
Fiscal Model 1
0.0%
20.0%
40.0%
60.0%
80.0%
100.0%
120.0%
15 20 25 30 35 40 45 50
Price (US$/Bbl)
Per
cen
tag
eG
ove
rnm
ent
Tak
e
0.0%
2.0%
4.0%
6.0%
8.0%
10.0%
12.0%
14.0%
16.0%
18.0%
Per
cen
tag
e IR
R
Government Take Project’s IRR
Field DGovernment Take and Project IRR at Different Price Levels
Fiscal Model 3
0.0%
20.0%
40.0%
60.0%
80.0%
100.0%
120.0%
15 20 25 30 35 40 45 50
Price (US$/Bbl)
Per
cen
tag
eG
ove
rnm
ent
Tak
e
0.0%
5.0%
10.0%
15.0%
20.0%
25.0%
30.0%
Per
cen
tag
e IR
R
Government Take Project’s IRR
Field DGovernment Take and Project IRR at Different Price Levels
Fiscal Model 2
0.0%
20.0%
40.0%
60.0%
80.0%
100.0%
120.0%
15 20 25 30 35 40 45 50
Price (US$/Bbl)
Per
cen
tag
eG
ove
rnm
ent
Tak
e
0.0%
2.0%
4.0%
6.0%
8.0%
10.0%
12.0%
14.0%
16.0%
18.0%
Per
cen
tag
e IR
R
Government Take Project’s IRR
Field DGovernment Take and Project IRR at Different Price Levels
Fiscal Model 4
0.0%
20.0%
40.0%
60.0%
80.0%
100.0%
120.0%
15 20 25 30 35 40 45 50
Price (US$/Bbl)
Per
cen
tag
eG
ove
rnm
ent
Tak
e
0.0%
5.0%
10.0%
15.0%
20.0%
25.0%
30.0%
Per
cen
tag
e IR
R
Government Take Project’s IRR


APPENDIX H
Government ParticipatingInterest
69

Table 26. Government Participating Interest—Field A
10.0% 12.5% 15.0% (@ 10%) 10.0% 12.5% 15.0% (@ 10%) 10.0% 12.5% 15.0% (@ 10%) 10.0% 12.5% 15.0% (@ 10%)Production (MBO) 20 Price ($/Bbl) 35
Capex ($ Million) 123 Opex ($/Bbl) 4.54
19.53 21.90 24.50 19.52 21.90 24.50 18.24 20.27 22.98 17.80 19.76 21.91
Sensitivities:
Prod. +20% 64.5 47.3 34.0 27.4% 70.2% 64.5 47.3 34.0 27.4% 70.2% 65.1 49.3 36.8 29.6% 69.9% 67.6 50.9 37.8 29.6% 68.8%-20% 28.7 17.7 9.2 18.8% 75.3% 28.7 17.7 9.2 18.8% 75.3% 31.6 20.6 12.1 20.1% 72.8% 38.1 25.6 16.0 21.4% 67.2%
Price +20% 67.1 49.5 35.8 27.9% 70.0% 67.1 49.5 35.8 27.9% 70.0% 66.4 50.4 37.8 30.0% 70.3% 70.4 53.2 39.8 30.2% 68.5%-20% 26.1 15.5 7.4 18.1% 76.0% 26.1 15.5 7.4 18.1% 76.0% 29.7 19.0 10.8 19.6% 72.7% 36.0 23.8 14.5 20.8% 67.0%
Capex +20% 38.4 24.5 13.9 19.7% 74.3% 38.4 24.5 13.9 19.7% 74.3% 42.2 28.4 17.6 21.2% 71.8% 50.1 34.5 22.4 22.5% 66.5%-20% 54.9 40.5 29.4 28.0% 70.1% 54.9 40.5 29.4 28.0% 70.1% 54.3 41.3 31.1 30.2% 70.4% 57.6 43.6 32.7 30.4% 68.6%
Opex +20% 44.1 30.4 19.9 22.7% 72.3% 44.1 30.4 19.9 22.7% 72.3% 48.6 34.9 24.2 24.8% 69.5% 50.2 36.2 25.3 25.1% 68.5%-20% 49.3 34.7 23.4 23.9% 71.6% 49.3 34.7 23.4 23.9% 71.6% 49.9 36.4 25.7 25.6% 71.2% 52.7 38.4 27.2 25.8% 69.6%
Corp. Tax 25% C/R Limit 60% Corp. Tax 25% C/R Limit 60% Corp. Tax in lieu C/R Limit 60% C. Tax 25% C/R Limit 60%
NOC 30% NOC 30% NOC 30% NOC 30%
Royalty Royalty Royalty Royalty
0 < D/Pro 25 30% 3% 0 < C/Pro < 50 30% 3% R/F < 1 10% 3% RoR < 20% 10% 3%
25 < D/Pro 50 45% 6% 50 < C/Pro < 150 45% 6% 1 < R/F < 1.5 25% 6% 20% < RoR < 25% 25% 6%
50 < D/Pro 75 60% 8% 150 < C/Pro < 250 60% 8% 1.5 < R/F < 2 40% 8% 25% < RoR < 35% 40% 8%
75 < D/Pro 100 75% 10% 250 < C/Pro < 300 75% 10% 2 < R/F < 2.5 55% 10% 35% < RoR < 50% 55% 10%
100 < D/Pro 90% 12% 300 < C/Pro 90% 12% 2.5 < R/F < 3 70% 12% 50% < RoR < 65% 70% 12%
3 < R/F 85% 14% 65% < RoR 85% 14%
stress test NPV(10) 0.7 NPV(15) (12.8) NPV(10) 0.7 NPV(15) (12.8) NPV(10) 6.3 NPV(15) (8.6) NPV(10) 8.8 NPV(15) (7.3)
P/O Split
(2) NOC is carried throughout the exploration phase. No interest is applied to the carry.
(1)The % Government Take includes the NOC's share of benefits. P/O Split P/O Split P/O Split
26.7 21.0 16.5
Price limit ($/Bbl)
68.1%NOC's 23.9 18.3 14.1 24 18 14 24.8 19.5
53.1 38.7 27.4 25.8% 35.2 24.6 25.1%
70.8% 15.3
21.7 23.3%
72.0%
48.7 23.3%
72.0%
46.7 32.5 Investor's 46.7 32.5 21.7
($ Million) ($ Million) ($ Million) ($ Million)Govt. Take
Investor's NPV IRR
Govt. Take
RoR
Field AInvestor's NPV
IRRGovt. Take
Investor's NPV IRR
Govt. Take
Investor's NPV IRR
Production Sharing based on: Daily Production Cumulative Production R-FactorFiscal Model No. 1/NOC Fiscal Model No. 2/NOC Fiscal Model No. 3/NOC Fiscal Model No. 4/NOC

Bibliography
Allen, F.H., and R.D. Seba. 1993. Economics of Worldwide Petroleum Production. Tulsa,Okla.: Oil and Gas Consultants International (OGCI), Inc.
Anderson, O.L. 1998. “Royalty valuation: Should royalty obligations be determined intrin-sically, theoretically, or realistically?” Natural Resources Law Journal. 37:611.
Barrows, G.H. 1993. Worldwide Concession Contracts and Petroleum Legislation. Tulsa,Okla.: PennWell Books.
Barrows, G.H. 1994. World Fiscal System for Oil. Calgary, Alberta: Van Meurs & Ass. Ltd.,Calgary.
Baunsgaard T. 2001. A premier on Mineral Taxation. IMF working paper, WP/01/139.Boudreaux, D.O., D.R. Ward, P. Boudreaux, and S.P. Ward. 1991. “An inquiry into the cap-
ital budgeting process and analytical procedures utilized by firms in the oil and gasextraction industry.” Petroleum Accounting and Financial Management Journal p. 24–34.
Brealey, R.A. and S.C. Myers. 1991. Principles of Corporate Finance. New York: McGraw-Hill.Bunter, M.A.G. 2002. The Promotion and Licensing of Petroleum Prospective Acreage. The
Haque: Kluiwer Law International.Davis, J.M., Ossowski, R., Fedelino, A. 2003. Fiscal Policy Formulation and Implementation
in Oil-Producing Countries. Washington, D.C.: International Monetary Fund.Deloitte. 2005. Oil and Gas Survey, 2004–2005. Prepared for the Aberdeen and Grampian
Chamber of Commerce. http://www.agcc.co.uk/policyDougherty, E.L. 1985. “Guidelines for proper application of four commonly used investment
criteria.” Proceedings of the Society of Petroleum Engineers Hydrocarbon Economics andEvaluation Symposium, Dallas, TX, SPE Paper 13770.
Ehrhardt, M.C. 1994. The Search for Value: Measuring the Company’s Cost of Capital.Boston, Mass.: Harvard Business School Press.
71

Evans, D.J. 2006. Social Discount Rates for the European Union. Working Paper no. 2006-20.Milan: Universita’ degli studi di Milano.
Gallun, R.A., C.J. Wright, L.M. Nichols, and J.W. Stevenson. 2001. Fundamentals of Oil &Gas Accounting. Tulsa, Okla.: PennWell Books.
Garnaut, R., and A. Clunies Ross. 1975. “Uncertainty, risk aversion and the taxing of naturalresource projects.” Economic Journal 85(2):272–87.
Gresik, Thomas A. 2001. “The Taxing Task of Taxing Transnationals.” Working Paper 284.Johnston, D. 1993. “Thinking of going international?” Petroleum Accounting and Financial
Management Journal 13(2):84–103.———. 1994a. “Global petroleum fiscal systems compared by contractor take.” Oil and
Gas Journal 92(50):47–50.———. 1994b. International Petroleum Fiscal Systems and Production Sharing Contracts.
Tulsa, Okla.: PennWell Books.———. 2000. “Current developments in production sharing contracts and international
petroleum concerns: Economic modeling/auditing: Art or science?” PetroleumAccounting and Financial Management Journal 19(3):120–138.
———. 2002. “Current developments in production sharing contracts and internationalconcerns: Retrospective government take—not a perfect statistic.” Petroleum Account-ing and Financial Management Journal 21(2):101–08.
———. 2003. International Exploration Economics, Risk, and Contract Analysis. Tulsa,Okla.: PennWell Books.
Kaiser, M.J., and A.G. Pulsipher. 2004. Fiscal System Analysis: Concessionary and Contrac-tual Systems Used in Offshore Petroleum Arrangements. Minerals Management Service,U.S. Department of the Interior.
Kemp A. 1987a. “Economic considerations in the taxation of petroleum exploitation.”In K. Khan, ed., Petroleum Resources and Development Economic, Legal and Policy Issuesfor Developing Countries.
———. 1987b. Petroleum Rent Collection Around the World. Halifax, Nova Scotia: TheInstitute for Research on Public Policy.
———. 1996. Pros and Cons of Royalty. Oxford Energy Forum.Kretzschmar, G.L., and P. Moles. 2006. The Impact of Tax Shocks and Oil Price Volatility on
Risk: A Study of North Sea Oilfield Projects. W.P. 06.01, University of Edinburgh.Kumar, R. 1991. “Taxation for a cyclical industry.” Resources Policy No. 2:133–48.McPherson, C.P, and K. Palmer. 1984. “New Approaches to Profit Sharing in Developing
Countries.” Oil & Gas Journal, June 25.Mian, M.A. 2002. Project Economics and Decision Analysis, Vol. 1: Deterministic Models.
Tulsa, Okla.: PennWell Books.Otto, J.M. 1995. “Legal Approaches to Assessing Mineral Royalties.” Taxation of Mineral
Enterprises. Londong: Graham & Trotman.Rapp, W.J., B.L. Litvak, G.P. Kokolis, and B. Wang. 1999. “Utilizing discounted government
take analysis for comparison of international oil and gas E&P fiscal regimes.” Proceedingsof the Society of Petroleum Engineers Hydrocarbon Economics and Evaluation Symposium,Dallas, TX, March 20–23. Society of Petroleum Engineers Paper 52958.
Rutledge, I., and P. Wright. 1998. “Profitability and taxation: Analyzing the distribution ofrewards between company and country.” Energy Policy 26(10):795–812.
72 World Bank Working Paper
Seba, R.D. 1987. “The only investment selection criterion you will ever need.” Proceedingsof the Society of Petroleum Engineers Hydrocarbon Economics and Evaluation Symposium,Dallas, TX, March 2–3, SPE Paper 16310.
Smith, D. 1993. “Methodologies for comparing fiscal systems.” Petroleum Accounting andFinancial Management Journal 13(2):76–83.
———. 1987. “True government take (TGT): A measurement of fiscal terms.” Proceedingsof the Society of Petroleum Engineers Hydrocarbon Economics and Evaluation Symposium,Dallas, TX, March 2–3. SPE Paper 16308.
Stevens, P. 2003. “Resource impact: curse or blessing? A literature survey.” The Journal ofEnergy Literature 9(1):3–42.
Thompson, R.S., and J.D. Wright. 1984. Oil Property Evaluation. Golden, Colo.: Thompson-Wright Associates.
Van Meurs, A.P. 1971. Petroleum Economics and Offshore Mining Legislation. Amsterdam:Elsevier Publishing Company.
Van Meurs, A.P., and A. Seck. 1995. “Governments cut takes to compete as world acreagedemand falls.” Oil and Gas Journal 93(17):78–82.
———. 1997. “Government takes decline as nations diversify terms to attract investment.”Oil and Gas Journal 95(21):35–40.
Wood, D.A. 1990a. “Appraisal of economic performance of global exploration contracts.”Oil and Gas Journal 88(44):48–52.
———. 1990b. “Appraisal of 20 global exploration contracts locates key variables thataffect profit levels.” Oil and Gas Journal 88(45):50–53.
———. 1993. “Economic performance of rate of return driven international petroleumproduction contracts.” Petroleum Accounting and Financial Management Journal13(2):84–103.
Fiscal Systems for Hydrocarbons 73

Eco-AuditEnvironmental Benefits Statement
The World Bank is committed to preserving Endangered Forests and natural resources. Weprint World Bank Working Papers and Country Studies on 100 percent postconsumer recy-cled paper, processed chlorine free. The World Bank has formally agreed to follow the rec-ommended standards for paper usage set by Green Press Initiative—a nonprofit programsupporting publishers in using fiber that is not sourced from Endangered Forests. For moreinformation, visit www.greenpressinitiative.org.
In 2006, the printing of these books on recycled paper saved the following:
Trees*
203*40” in height and6-8” in diameter
Total Energy
141 mil.BTUs
Net Greenhouse Gases
17,498Pounds CO2 Equivalent
Water
73,944Gallons
Solid Waste
9,544Pounds


THE WORLD BANK1818 H Street, NW
Washington, DC 20433 USA
Telephone: 202 473-1000
Internet: www.worldbank.org
E-mail: [email protected]
ISBN 978-0-8213-7266-1
Fiscal Systems for Hydrocarbons is part of the World Bank
Working Paper series. These papers are published to com-
municate the results of the Bank’s ongoing research and to
stimulate public discussion.
Although host governments and investors may share one
common objective—the desire for projects to
generate high levels of revenue—their other goals are not
entirely aligned. Host governments aim to maximize rent for
their country over time, while achieving other development
and socioeconomic objectives. Investors’ aim is to ensure
that the return on investment is consistent with the risk
associated with the project, and with their corporations’
strategic objectives. To reconcile these often conflicting
objectives, more and more countries rely on transparent
institutional arrangements and flexible, neutral fiscal
regimes. This paper examines the key elements of the legal
and fiscal frameworks utilized in the petroleum sector and
aims to outline desirable features that should be considered
in the design of fiscal policy with the objective of optimizing
the host government’s benefits, taking into account the
effect this would have on the private sector’s
investment.
World Bank Working Papers are available individually or on
standing order. Also available online through the World
Bank e-Library (www.worldbank.org/elibrary).
SKU 17266