Embed Size (px)
Citation preview

FISCAL YEAR MARCH 2022SECOND QUARTER FINANCIAL RESULTS
2
Fiscal Year March 2022 First Half Results
Fiscal Year March 2022 Full Year Forecast
Progress of Medium-Term Management Plan
Presentation Outline
3
Fiscal Year March 2022
First Half Results

4
FY March 2022
1st 2nd 1st Prior Year FY March 2020
(Thousand units) Quarter Quarter Half 1st Half 1st Half
Global sales volume
Japan 28 32 60 -14 -19% -39 -39%
North America 138 111 249 +64 +35% +46 +23%
Europe 55 51 106 +25 +30% -30 -22%
China 47 42 89 -28 -24% -20 -18%
Other Markets 86 71 156 +35 +29% -28 -15%
Total 353 307 660 +82 +14% -70 -10%
USA 106 84 190 +54 +40% +53 +38%
Australia 33 23 56 +16 +40% +5 +10%
ASEAN 19 13 32 -3 -8% -24 -44%
Change from
% % %
FY March 2022 First Half Global Sales Volume
In response to production constraints caused by the semiconductor shortage, conducted efficient operations through lean inventory management, prioritizing supply to the U.S. and other markets with strong sales

5
1st 2nd 1st FY March 2020
(Billion Yen) Quarter Quarter Half 1st Half
Net sales 803.4 692.5 1,495.9 +380.1 +34% -210.7 -12%
Operating profit 26.1 13.6 39.7 +92.6 - +13.9 +54%
Ordinary profit 26.5 7.4 33.9 +87.2 - -0.1 0%
Profit before tax 25.4 10.5 35.9 +111.1 - +3.2 +10%
Net income 11.4 12.5 23.9 +116.9 - +7.3 +44%
Operating ROS 3.2 2.0 2.7 +7.4 +1.2
EPS (Yen) 18.1 19.8 37.9 +185.6 +11.5
Exchange rate (Yen)
US Dollar 110 110 110 +3 +1
Euro 132 130 131 +10 +9
(Thousand units)
261 220 481 +112 +31% -141 -23%Consolidated wholesales
FY March 2022 Change from
Prior Year
1st Half
pts pts% %%
FY March 2022 First Half Financial Metrics
*Net income indicates net income attributable to owners of the parent
Net sales declined vs FY March 2020 mainly due to wholesale reduction from production cut, but profit increased as we continued efforts to improve variable profit and fixed cost efficiency

6
-52.9
-20.5
+ 107.8
+ 24.7
-23.9
+ 4.5 39.7
Change from Prior Year +92.6
(Billion Yen)
Transferred to extraordinary loss in FY March 2021
Volume & Mix
Foreign Exchange Cost
Improvement Fixed cost, Other
· Increase in wholesales volume by +112,000 units
· Effects of curbed marketing expenses, improved per-unit profit, etc. by approx. +¥50 billion
Includes impact of hikes in raw material prices and semiconductor costs of approx. -¥40.0 billion
USDEURCADAUDGBPOther
-0.1+5.7+4.8+7.6+2.3+4.4
· Continued fixed cost reduction and efficiency improvement such as advertisement cost and overhead cost
FY March 2021
First Half
FY March 2022
First Half
FY March 2022 First Half Operating Profit Change (vs FY March 2021 First Half)

7
25.8
-70.0
-43.6
+ 20.8
+ 33.8
+ 19.0
+ 53.9 39.7
Change from FY March 2020 +13.9
Strengthening of Profit Structure
by +¥106.7 billion
Decrease in wholesales volume by -141,000 units
(Billion Yen)
FY March 2020
First Half
Volume
Raw Materials/Semi-
conductor Foreign Exchange
Sales Improvement
(Marketingexpenses, etc.)
Cost Improvement
Fixed cost, Other
FY March 2022
First Half
FY March 2022 First Half vs. FY March 2020 First Half (Deterioration and Improvement Factors)
Deterioration by -¥113.6 billion due to external
environment
• Despite the negative impact of reduced volume due to production cuts and hikes in the price of raw materials and the cost of semiconductors, profit increased through improvements in sales quality, costs improvement, and fixed costs efficiency improvement

8
Fiscal Year March 2022
Full Year Forecast

9
FY March 2022 Global Sales Volume
Change from
FY March 2022 Prior
Year FY March
2020 May
Forecast
(Thousand units) 1st Half 2nd Half Full Year Full Year Full Year Full Year
Global sales volume
Japan 60 109 168 -8 -34 -26
North America 249 189 438 +35 +41 +24
Europe 106 87 193 +15 -70 -31
China 89 131 220 -8 +8 -40
Other Markets 156 136 292 -9 -53 -24
Total 660 651 1,311 +24 -108 -98+2% -8% -7%
USA 190 142 332 +37 +57 +33
Australia 56 45 101 +9 +11 +7
ASEAN 32 38 70 -17 -33 -29

10
Change from
FY March 2022 Prior Year
FY March
2020
May
Forecast
(Billion Yen) 1st Half 2nd Half Full Year Full Year Full Year Full Year
Net sales 1,495.9 1,704.1 3,200.0 +317.9 -230.3 -200.0
Operating profit 39.7 25.3 65.0 +56.2 +21.4 0.0
Ordinary profit 33.9 27.1 61.0 +32.7 +7.9 +6.0
Profit before tax 35.9 23.1 59.0 +56.8 +9.7 +10.0
Net income 23.9 17.1 41.0 +72.7 +28.9 +6.0
Operating ROS 2.7 1.5 2.0 +1.7 +0.7 +0.1
EPS (Yen) 37.9 27.2 65.1 +115.4 +45.8 +9.5
Exchange rate (Yen)
US Dollar 110 112 111 +5 +2 +2
Euro 131 131 131 +7 +10 +2
(Thousand units)
Consolidated wholesales 481 550 1,030 +41 -202 -105
+4% -16% -9%
% ptspts pts% %
FY March 2022 Financial Metrics
*Net income indicates net income attributable to owners of the parent

11
8.8
-20.5
+112.5
-20.0
+39.9
-60.6
+4.9 65.0
USDEURCADAUDGBPOther
-1.1+10.3+10.0+10.2
+5.6+4.9
FY March 2022 Full Year Operating Profit Change (vs FY March 2021 Full Year)
Business Risks
FY March 2021
· Increase in wholesales volume by +41,000 units
· Curbed marketing expenses, improved sales mix
· Investment for growth ex. US plant
· Continued fixed cost reduction/efficiency improvement
Includes impact of hikes in raw material prices and semiconductor costs of approx. -¥94.0 billion
(Billion Yen)
Transferred to extraordinary loss in FY March 2021
Volume & Mix
Foreign Exchange Cost
Improvement
Fixed cost, Other
Change from prior year +56.2
FY March 2022

12
65.0
-50.0
-20.0
-31.3
+6.4
+87.8 +4.2
+2.9 65.0
• The extent of deterioration due to external environment, such as reduced volume due to production cuts and hikes in the price of raw materials and the cost of semiconductors, will expand
• Promote efforts to strengthen profit structure such as sales quality improvements and fixed cost efficiency improvements
FY March 2022 Full Year vs. May ForecastDeterioration and Improvement Factors
November Forecast
Business Risks
May Forecast
(Billion Yen)
Volume
Raw Materials/Semi-
conductor
Foreign Exchange
Sales Improvement
(Marketingexpenses, etc.)
Cost Improvement
Fixed cost, Other
Strengthening of Profit Structure
by +¥94.9 billion
Deterioration by -¥101.3 billion
due to external environment
Change from May Forecast 0.0
Decrease in wholesales volume by -105,000 units
13
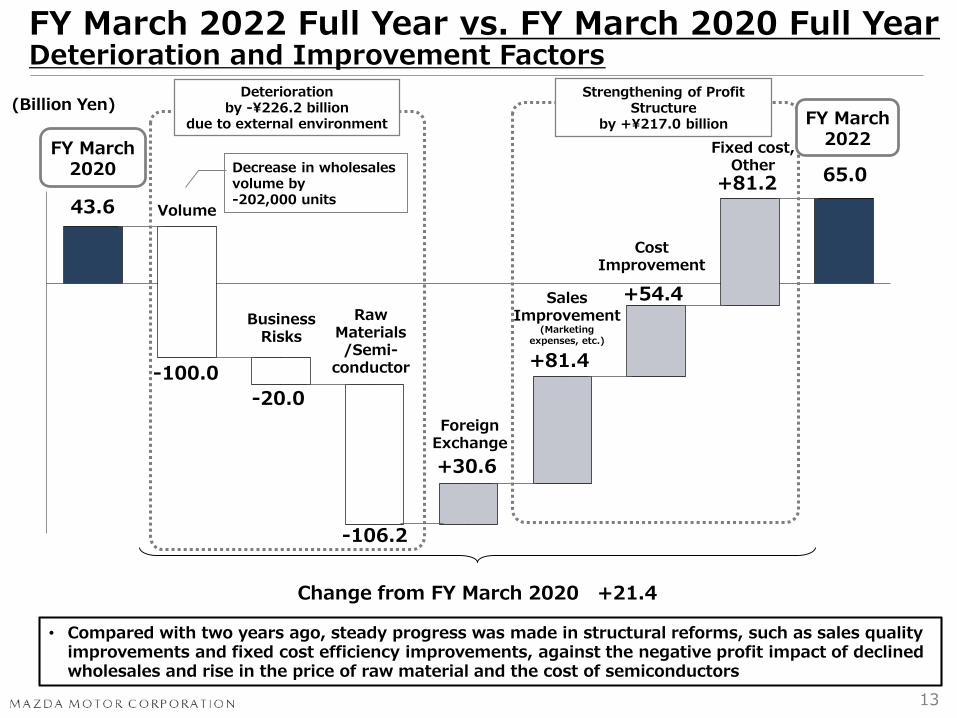
43.6
-100.0
-20.0
-106.2
+30.6
+81.4
+54.4
+81.2 65.0
(Billion Yen)
FY March 2020
FY March 2022 Full Year vs. FY March 2020 Full YearDeterioration and Improvement Factors
FY March 2022
Business Risks
Volume
Raw Materials/Semi-
conductor
Foreign Exchange
Sales Improvement
(Marketingexpenses, etc.)
Cost Improvement
Fixed cost, Other
Strengthening of Profit Structure
by +¥217.0 billion
Decrease in wholesales volume by -202,000 units
Deteriorationby -¥226.2 billion
due to external environment
• Compared with two years ago, steady progress was made in structural reforms, such as sales quality improvements and fixed cost efficiency improvements, against the negative profit impact of declined wholesales and rise in the price of raw material and the cost of semiconductors
Change from FY March 2020 +21.4
14
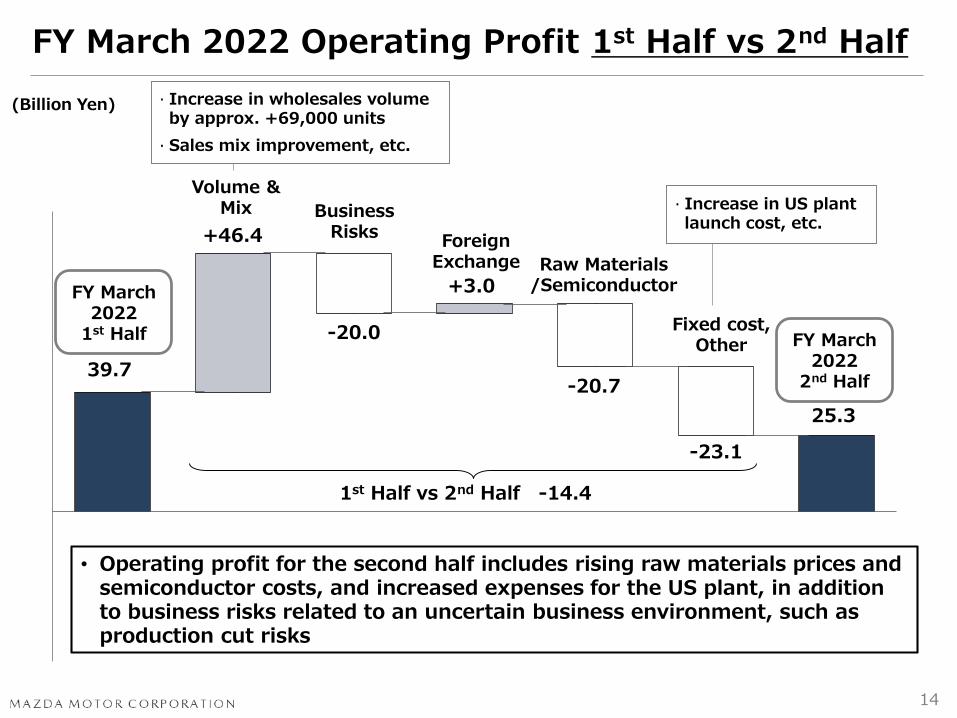
39.7
+46.4
-20.0
+3.0
-20.7
-23.1
25.3
· Increase in US plant launch cost, etc.
· Increase in wholesales volume by approx. +69,000 units
· Sales mix improvement, etc.
FY March 2022 Operating Profit 1st Half vs 2nd Half
Business Risks
(Billion Yen)
Volume & Mix
Foreign Exchange Raw Materials
/Semiconductor
Fixed cost, Other
FY March 2022
1st Half FY March 2022
2nd Half
• Operating profit for the second half includes rising raw materials prices and semiconductor costs, and increased expenses for the US plant, in addition to business risks related to an uncertain business environment, such as production cut risks
1st Half vs 2nd Half -14.4

15
7.018.8
6.5 11.3
-7.6
20.9
40.826.1
13.6
-45.3
FY March 2021 FY March 2022FY March 2020
1Q 2Q 3Q 4Q 1Q 2Q 3Q 4Q 1Q 2Q
Break-even volume1 mil. units line(annualized)
(Billion yen)
Operating profit
Continue strengthening efforts to improve variable profit and fixed
costs efficiency
With progress in strengthening profit structure, break-even
volume remained below annualized volume of 1 million units
(wholesale basis)
Strengthening Profit Structure amid Reduced Production

16
Progress of Medium-Term Management Plan

17
FY March 2020
FY March 2022
Volume
ForeignExchange
Cost Improvement
Fixed Cost/ Others
Business Risks
RawMaterials/
Semiconductor
Sales Improvement
(Marketingexpenses, etc.)
COVID-19 Pandemic &
Semiconductor Supply Shortage
Structural Reform &
Improvements
Structural Reform / Improvements
Impact of COVID Pandemic and Semiconductor
Supply Shortage
Outlook of This Fiscal Year

18
Progress of Medium-Term Management Plan … 5 Key Priorities
1. Investment to elevate brand value
• Monotsukuri ①Product and Technology Improvement
②Evolution of Monotsukuri Innovation
• Customer Experience ①US
②China
2. Curb expenses that depreciate brand value
3. Accelerate fixed cost/cost reduction to lower break-even volume
4. Investment in areas where we need to catch up and start investment in new areas
5. Enhance alliances (CASE, new partnership)

19
Building Block Concept = Establishing Technological Assets
Product and Technology Improvement(1)
SKYACTIV MULTI-SOLUTION ARCHITECTURE
PHASE 1
PHASE 2
SmallGroup
LargeGroup
SKYACTIV-X BEV
Straight 6 PHEV MHEV 48V
RE Multiple Electrification Technology
SKYACTIV-DRIVE/MT SKYACTIV-BODY/CHASSISSKYACTIV-G/D
SKYACTIV ARCHITECTURE dedicated to Internal Combustion Engines

20
EV-dedicated Architecture = Investment in Next Technology Assets
Product and Technology Improvement (2)
PHASE 3
PHASE 1
PHASE 2
SKYACTIV EV ARCHITECTURE
SmallGroup
LargeGroup
SKYACTIV-X BEV
Straight 6 PHEV MHEV 48V
RE Multiple Electrification Technology
SKYACTIV MULTI-SOLUTION ARCHITECTURE
SKYACTIV ARCHITECTURE dedicated to Internal Combustion Engines

21
Monotsukuri Innovation
= Co-creation of Efficiency in Development and Production
Evolution of Monotsukuri Innovation(1)
Efficient and flexible production to build multiple models on the same line
Production R&D
Flexible Production Concept
Common Architecture Concept
Bundled Product Planning

22
Evolution of Assets in the Production Process
= Implementation of DX
Vertical launch of body shop lines that utilize “Digital Twins”
Progress of Monotsukuri Innovation(2)

23
Accumulation of Production Process Assets
= AI/DX and Expansion of MBD
MBD
AI
DX
Evolution of Monotsukuri Innovation(3)
Production R&D
Flexible Production Concept
Common Architecture Concept
Bundled Product Planning
24
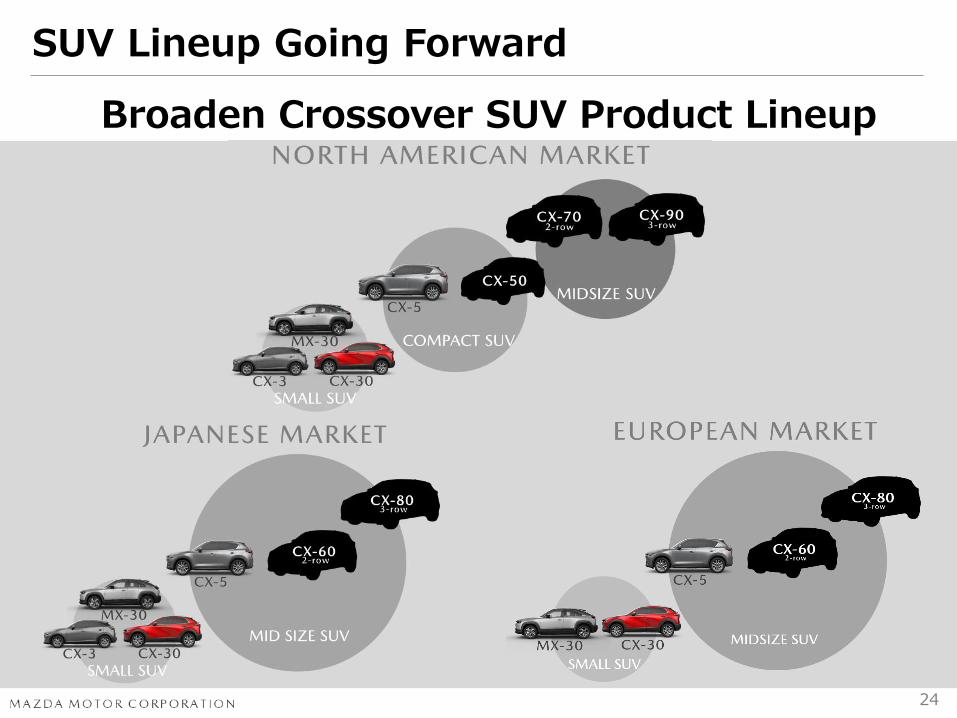
Broaden Crossover SUV Product Lineup
SUV Lineup Going Forward

25
Multi-solution Architecture = Source of Profit
PHASE 1
PHASE 2
PHASE 3
2025 2030
Large Group
Small Group
5 New SUV Models
2022
Importance of Multi-Solution
SKYACTIV EV ARCHITECTURE
SKYACTIV MULTI-SOLUTION ARCHITECTURE
SKYACTIV ARCHITECTURE dedicated to Internal Combustion Engine

26
Network Reform
Sales Finance
Marketing Transformation
Completed investmenton the foundation for growth
※Edited by Mazda based on JD Power’s CSI study results.
Bond with Customer
Relationship of trust with dealers
Progress on Customer Experience ・・・ USA(1)

27
Product Range Expansion: CX-50 CX-70 CX-90
Progress on Customer Experience ・・・ USA(2)
28
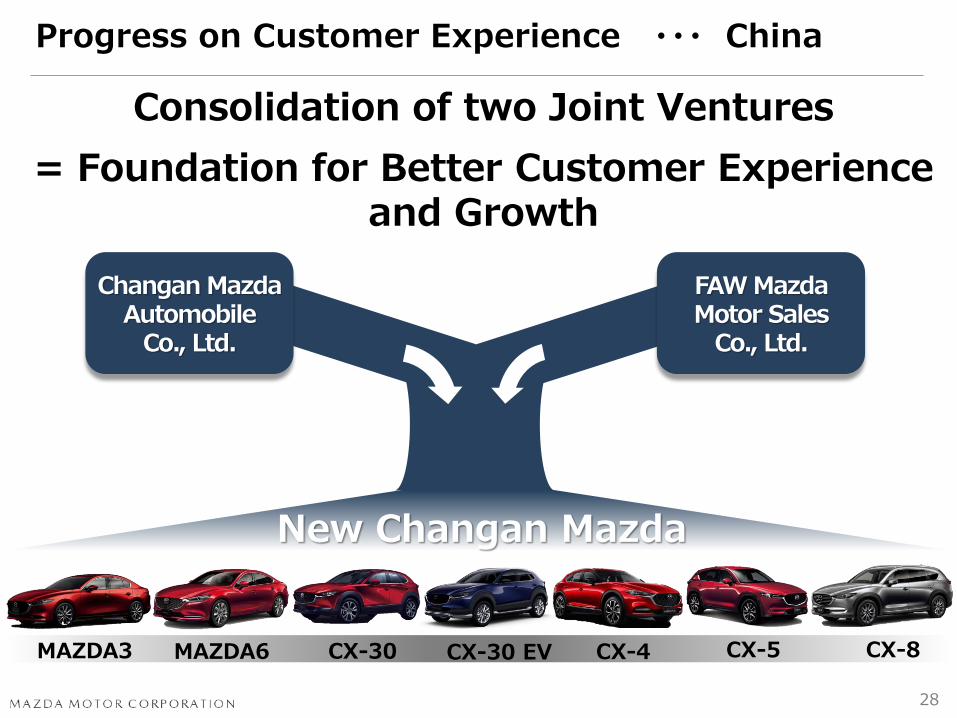
Consolidation of two Joint Ventures
= Foundation for Better Customer Experienceand Growth
MAZDA6 CX-5CX-30 CX-8CX-4MAZDA3 CX-30 EV
Changan Mazda Automobile
Co., Ltd.
FAW Mazda Motor Sales
Co., Ltd.
New Changan Mazda
Progress on Customer Experience ・・・ China

29

30
Appendix

31
FY March 2021 FY March 2022 Change from
(Billion Yen) Full Year First Half Prior FY End
Cash Flow
- From Operating activities
- From Investing activities
- Free Cash Flow
Cash and Cash Equivalents
Interest-bearing Debt
Net Cash
Total Assets
Equity
-78.9 --62.0
120.1 -37.0
738.8 +75.1813.9
41.2 --25.0
+1
-17.1 -28.8-45.9
42Equity Ratio 41
755.9 859.8 +103.9
2,876.3
1,204.0
2,917.4
1,181.7
-41.1
+22.3
①百万円単位で
pts%%
Cash Flow and Net Cash

32
74
60
3.6%
2.9%
FY March 2021 FY March 2022
-19%
Japan
First Half Sales Volume & Market Share
(Thousand units)
60,000 units sold, down 19% year on year
Total market share declined 0.7 points year on year to 2.9%, while registered vehicle market share decreased 1.1 points to 3.5%
Sales volume declined from the prior year due to vehicle supply shortage related to reduced production
Started new service to update diesel engine control program.Its strong and exhilarating acceleration has been well received
Started free web membership service called “Club Mazda”

33
136
190
49
59 185
249 2.0%
2.4%
FY March 2021 FY March 2022
+35%
North America
First Half Sales Volume & US Market Share
(Thousand units)
Canada
& Others
USA
249,000 units sold, up 35% year on year
USA: 190,000 units, up 40% year on year
- Achieved record high sales since 1995 in the first half. Market share increased 0.5 points year on year to 2.4%
- Prioritized production of profitable and hot-selling models, while efficient and high turnover ratio sales continued
- Reduced marketing expenses in accordance with market trends and supply status and improved per-unit profit
Canada: 37,000 units, up 23% year on year
Mexico: 20,000 units, up 11% year on year

34
71 93
11
13 82
106 1.1%
1.3%
FY March 2021 FY March 2022
+30%
Europe
First Half Sales Volume & Market Share
(Thousand units)
Europe(Excl.
Russia)
Russia
106,000 units sold, up 30% year on year
Market share increased 0.2 points year on year to 1.3%
Sales volume increased as market demand recovered from the prior year
Germany: 24,000 units sold, up 27% year on year
UK: 17,000 units sold, up 43%year on year
Russia: 13,000 units sold, up 23% year on year

35
117
89
0.9%
0.7%
FY March 2021 FY March 2022
-24%
China
First Half Sales Volume & Market Share
(Thousand units)
89,000 units sold, down 24% year on year
Market share declined 0.1 point year on year to 0.7%
Sales of main models like CX-4 and CX-5 decreased year on year
Sales of the highest volume model Mazda3 remained strong
Sales of CX-30 EV, jointly developed with local partners, started in September

36
34 32
40 56
47
69 121
156
9.7%10.1%
FY March 2021 FY March 2022
+29%
Other Markets
156,000 units sold, up 29% year on year
Australia: 56,000 units sold, up 40% year on year
⁃ Market share rose 0.4 points year on year to 10.1%
⁃ Sales of crossover SUVs like CX-5/CX-8/CX-30 and BT-50 increased, achieving market share increase
ASEAN: 32,000 units sold, down 8% year on year
⁃ July-September sales sharply dropped due to lockdown
⁃ Thailand: 15,000 units, down 6%year on year
⁃ Vietnam: 7,000 units, down 27%year on year
First Half Sales Volume & Australia Market Share
(Thousand units)
Others
Australia
ASEAN

37
137.9214.0 211.6
303.5
197.9 171.1
109.2
283.3 326.4
309.0
303.4277.3
69.6
123.5
151.3
145.7
153.5
126.9
60.0
118.3
154.4
164.4
148.6
117.2
376.7
739.1
843.7
922.6
803.4
692.5
1Q
FY March 2021
2Q 3Q 4Q
FY March 2022
1Q 2Q
Net Sales by Geographic Area
(Billion Yen)
Japan
NorthAmerica
Europe
Other

38
282.3
615.2
721.4789.4
681.2
573.043.4
58.9
61.4
65.3
66.7
59.8
51.0
65.0
60.9
67.9
55.5
59.7
376.7
739.1
843.7
922.6
803.4
692.5
1Q
FY March 2021
2Q 3Q 4Q
FY March 2022
1Q 2Q
(Billion Yen)
Vehicles / Parts for Overseas Production
Parts
Other
Net Sales by Product

39
+34%+30%
+4%
0%
50%
Total Volume & Mix Foreign Exchange
DomesticOverseas
0%+29%
Net Sales Change (6 Months)
FY March 2022 First Half vs. FY March 2021 First Half
FY March 2022 1,495.9FY March 2021 1,115.8
(Billion Yen)

40
-6%
-10%
+4%
-25%
0%
25%
Total Volume & Mix Foreign Exchange
DomesticOverseas
-5%-5%
Net Sales Change (3 Months)
FY March 2022 Second Quarter vs. FY March 2021 Second Quarter
FY March 2022 692.5FY March 2021 739.1
(Billion Yen)

41
Second Quarter Change from
FY March FY March
(Billion Yen) 2021 2022 Prior Year
Net sales 739.1 692.5 -46.6 -6%
Operating profit -7.6 13.6 +21.2 -
Ordinary profit -11.5 7.4 +18.9 -
Profit before tax -12.4 10.5 +22.9 -
Net income -26.3 12.5 +38.8 -
Operating ROS -1.0 2.0 +3.0
EPS (Yen) -41.8 19.8 +61.6
Exchange rate (Yen)
US Dollar 106 110 +4
Euro 124 130 +6
255 220 -35 -14%Consolidated wholesales
(Thousand units)
pts% %
FY March 2022 Financial Metrics (3 Months)
*Net income indicates net income attributable to owners of the parent
42
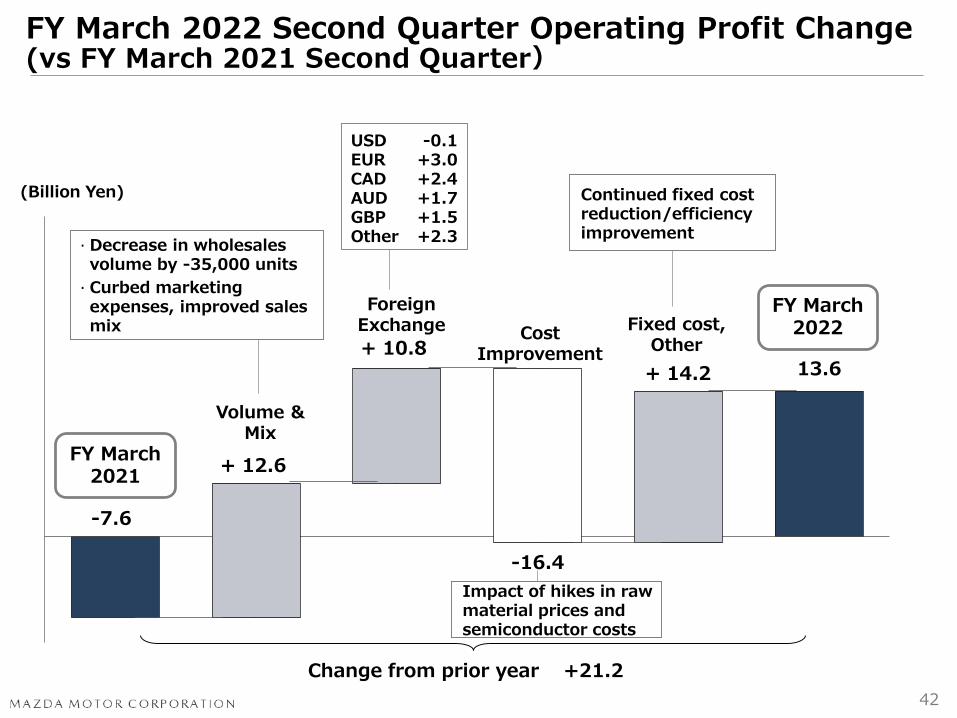
-7.6
+ 12.6
+ 10.8
-16.4
+ 14.2 13.6
Change from prior year +21.2
Volume & Mix
Foreign Exchange Cost
Improvement
Continued fixed cost reduction/efficiency improvement
FY March 2022 Second Quarter Operating Profit Change(vs FY March 2021 Second Quarter)
FY March 2021
Fixed cost, Other
(Billion Yen)
FY March 2022
Impact of hikes in raw material prices and semiconductor costs
· Decrease in wholesales volume by -35,000 units
· Curbed marketing expenses, improved sales mix
USDEURCADAUDGBPOther
-0.1+3.0+2.4+1.7+1.5+2.3

43
FY March 2022 Consolidated Wholesales
FY March 2022
May
Forecast
(Thousand units)
1st
Quarter 2nd
Quarter 1st
Half 2nd
Half Full
Year 1st
Half 2nd
Half Full
Year
Full
Year
Consolidated wholesales
Japan 38 31 69 93 162 -4 0 -4 -23
North America 101 88 190 209 399 +48 -23 +25 -12
Europe 50 41 90 83 173 +24 -23 +1 -48
Other Markets 72 60 132 165 296 +44 -26 +18 -22
Total 261 220 481 550 1,030 +112 -72 +41 -105+31% -12% +4% -9%
USA 77 72 149 154 303 +42 -11 +31 +3
Prior Year
Change from
*Regarding consolidated wholesales, in accordance with the application of the “Accounting Standard for Revenue Recognition”, etc. effective from the beginning of the first quarter of FY March 2022, domestic dealers’ sales recognition of new car has been changed to one that recognizes revenue at the time of the delivery to customers.

44
Change from
FY March 2022 Prior Year
May
Forecast
(Yen)
1st
Half
2nd
Half
Full
Year
1st
Half
2nd
Half
Full
Year
Full
Year
US Dollar 110 112 111 +3 +7 +5 +2
Euro 131 131 131 +10 +5 +7 +2
Canadian Dollar 88 89 89 +10 +7 +8 +3
Australian Dollar 83 82 82 +9 +3 +6 -2
British Pound 152 153 153 +17 +11 +14 +2
Exchange Rates

45
36.1
57.1
45.1 44.0
62.7 68.4
93.0
150.0
89.8 93.0
127.4 136.0
2021 2022
1H
Full Year
2021 2022 2021 2022
Key Data
(Billion Yen)
Capital Expenditure
Depreciation Cost
R&D Cost
FY March

46
Dividend Payment
15 15 15 15 1510
1520 20 20 20
151
10
30
35 35 35 35
0
15
2014 2015 2016 2017 2018 2019 2020 2021 2022
Trend of dividends per share
Interim dividends
Year-end dividends
PlanResults up to now
Note) A share consolidation was implemented on common stock with a ratio of five shares to one on August 1, 2014.Dividends per share represent actual amounts applicable to the respective years
FY March

47
Improvement of Variable Marketing Costs
Residual value improvement and
trade cycle reinforcement
Network reform and margin policy
Thorough dealer training
Lean inventory management CY18 CY19 CY20 CY21
Residual Value (%)
USA
Canada
Variable Marketing Cost per Revenue (%: Average of All Models)
FY18 FY19 FY20 FY21
Japan
FY18 FY19 FY20 FY21
USA
FY18 FY19 FY20 FY21
Europe
FY18 FY19 FY20 FY21
Australia

48
Reduction of Fixed Marketing Costs
Accelerating personal communication methods and digitization
Improving royalty through trade cycle management
FY18 FY19 FY20 FY21
通期
Japan
FY18 FY19 FY20 FY21
通期
USA
FY18 FY19 FY20 FY21
通期
Europe
FY18 FY19 FY20 FY21
通期
Australia
Fixed Marketing Cost per Revenue (%: Average of all models)
FY21 FY21 FY21 FY21

49
Improvement of Per-unit Revenue
Improvement of sales mix of crossover models and high grade models
Gradual price increase for individual carlines
2.2
2.4
2.5
2.7
2.8
3.0
3.2
FY18 FY19 FY20 FY21
通期
Japan
24
26
28
30
32
34
36
FY18 FY19 FY20 FY21
通期
USA
18
20
22
24
26
28
30
32
FY18 FY19 FY20 FY21
通期
Europe
24
26
28
30
32
34
36
FY18 FY19 FY20 FY21
通期
Australia(mil Yen) (K USD) (K EUR) (K AUD)
Revenue per Unit
FY21 FY21 FY21 FY21

50
Improvement of Inventory Turnover
Visualizing production, sales and inventory
Appropriately allocating vehicles according to dealer stock status in the US
FY18末 FY19末 FY20末 FY21 上期末
USA
ポート在庫台数 ディーラー在庫台数
FY18末 FY19末 FY20末 FY21 上期末
Australia
ポート在庫台数 ディーラー在庫台数
Port / Dealer Stock
Port Stock Dealer Stock Port Stock Dealer Stock
FY18 End
FY19 End
FY20 End 1st Half End
FY21 FY18 End
FY19 End
FY20 End 1st Half End
FY21

51
The projections and future strategies shown in this presentation are based on various uncertainties including, but not limited to, the conditions of the world economy in the future, the trend of the automotive industry and the risk of exchange-rate fluctuations. So, please be aware that Mazda's actual performance may differ substantially from the projections.
If you are interested in investing in Mazda, you are requested to make a final investment decision at your own risk, taking the foregoing into consideration.Please note that neither Mazda nor any third party providing information shall be responsible for any damage you may suffer due to investment in Mazda based on the information shown in this presentation.
Disclaimer