Embed Size (px)
Citation preview

*Osamu Tamaru, Toshihiro Watanabe, Hideo Takahara (NRIFE, FRA),
Kazushi Miyashita, Nobuo Kimura, Yasuzumi Fujimori (Hokkaido Univ.)
and Teisuke Miura (Hokkaido Industrial Technology Center)
“Moving at high vessel speed” causes to
1. be able to operate their jigging operation for longer time
2. be able to operate their jigging operation at better fishing grounds
4. increase the fuel cost at the moving process
3. increase the catch of squid
Does it maximize fishery income?
Fishery income fluctuation due to changing vessel speed from the harbor to the fishing ground, in the Japanese squid jigging fishery

Japanese coastal squid jigging fishery
Mainly catch Japanese common squid (Todarodes pacificus)
Vessel size: 5 – 19 GT
High powered fish lamps
Automatic jigger machines
Fishing ground is so far from a harbor (20 – 40 km)
2 – 3 fishermen / ship
High fuel consumption in comparison to other fishery

Social situation
Many fishermen have been in financial trouble because of rising fuel price and falling fish prices (Baba, 2008)
People make a risky choice when they are in bad situations (Kahneman and Lovallo, 1993)
1st principal component(Squid price)
2nd principal component(Fuel price)
2nd oil crisis
Before and after2nd oil crisis
Bubble economy
Deflation
3rd oil crisis
(Tamaru et al., in press)

Blue Red
Daniel Kahneman (Winner of the Nobel Prize in Economics)
・ people make a choice which they only think that is optimal
・ they make an risky choice when they are in bad situations
A. Regardless of color, you get 10,000$
B. Only Blue, you get 20,000 $ Expected value = 10,000$
Almost of all people chosed “A”
Question 1
The Prospect Theory 1

Almost of all who chosed “A” in the question 1, chosed “B”
If you are into someone for $ 20,000…
People don’t make a choice as only high expected value
Many Japanese coastal squid jigging fishermen might make a risky choice at their own fisheries management
1. Moving to far fishing ground
2. Using high power fishing lamps 3. Moving at high speed
Question 2
The Prospect Theory 2
e.g.
A. Regardless of color, you get 10,000$
B. Only Blue, you get 20,000 $
Blue Red
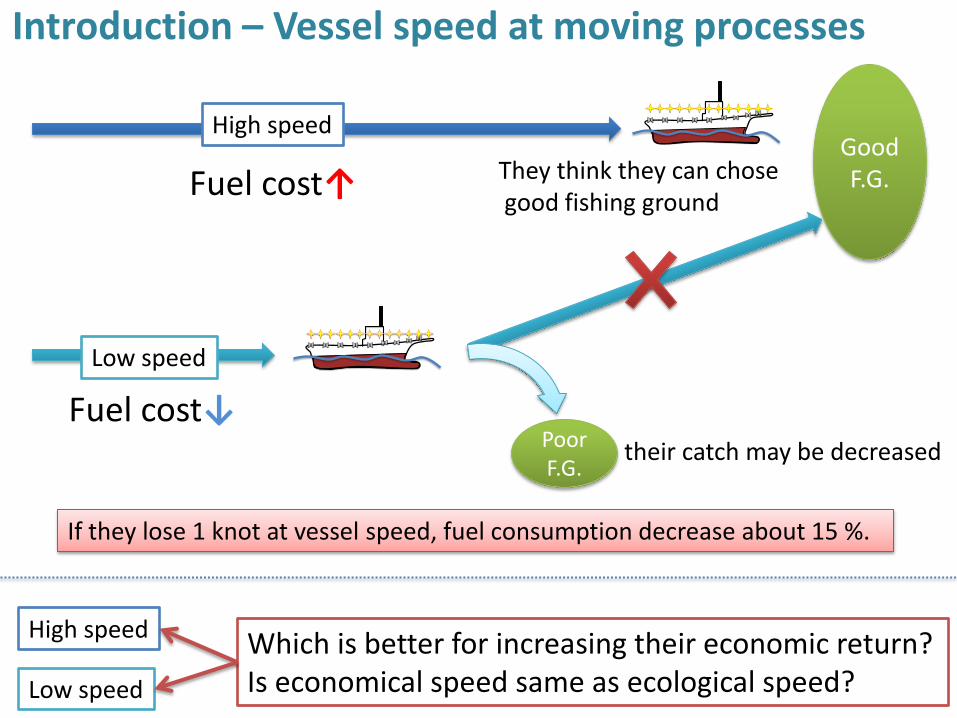
Good F.G.
Fuel cost↓
Fuel cost↑ They think they can chose good fishing ground
their catch may be decreased Poor F.G.
High speed
Low speed
If they lose 1 knot at vessel speed, fuel consumption decrease about 15 %.
Introduction – Vessel speed at moving processes
High speed
Low speed
Which is better for increasing their economic return? Is economical speed same as ecological speed?

Social situation also changes
Surveying real income in all social situations and operating conditions is not feasible
To clarify fishery income fluctuation due to changing vessel speed from the harbor to the fishing ground, in the Japanese coastal squid jigging fishery
We used the Fishery Income Simulation Model (Tamaru et al., in press)
Purposes of this study
Fishing condition change from hour to hour
To clarify economical vessel speed, when fuel price changes
Why use simulation model?

y = -3.3333x + 2666.7
0
500
1000
1500
2000
2500
3000
0 100 200 300 400
Good Catch
Poor Catch
Regular Catch
Very Poor Catch
Regular Catch: 2,333 (¥/case)
Poor Catch: 2,000 (¥/case)
Very Poor Catch: 1,500 (¥/case)
Good Catch: 2,500 (¥/case)
Un
it p
rice
of
fre
sh s
qu
id (
JPY/
case
)
(case)
y = 0.0131x3.658
R² = 0.9952
0.0
20.0
40.0
60.0
80.0
100.0
120.0
140.0
160.0
180.0
0 2 4 6 8 10 12 14
Vessel speed (kt)
Fue
l co
nsu
mp
tio
n (L
ite
r/h
)
Fishery Income Simulation Model
E = P – O
P = C·r
O = F + M + W
F = f·R
f = mm·d + ho·mo
E: Income (JPY)
P: Price of catch (JPY)
O: Total cost (JPY)
C: Amount of catch (case)
r: Unit price of squid (JPY/case)
F: Fuel cost (JPY)
f: Total fuel consumption (L)
M: Employment cost (JPY)
R: Unit price of fuel (JPY/L)
mm: Mileage of vessel (km/L)

19GT Fishing Ground
Harbor
Distance: 40km Duration: 14 hours Vessel speed: 8 – 13 kt
Setting condition
We estimated fishery income in each catch condition.
Catch condition: Very poor (50 cases) Poor (100 cases) Regular (200 cases) Good (350 cases)
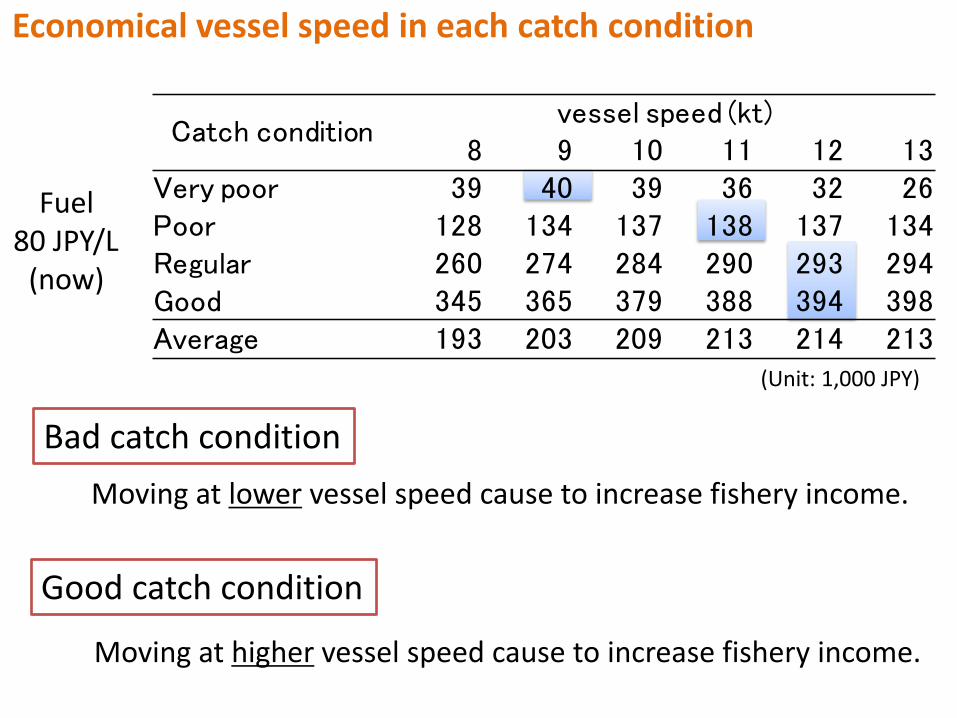
Economical vessel speed in each catch condition
Fuel 80 JPY/L
(now)
Catch conditionvessel speed (kt)
8 9 10 11 12 13Very poor 39 40 39 36 32 26 Poor 128 134 137 138 137 134 Regular 260 274 284 290 293 294 Good 345 365 379 388 394 398 Average 193 203 209 213 214 213
Catch conditionvessel speed (kt)
8 9 10 11 12 13Very poor 28 27 24 20 14 7 Poor 117 121 123 122 119 114 Regular 249 261 269 274 275 274 Good 334 352 364 372 377 378 Average 182 190 195 197 196 193
Catch conditionvessel speed (kt)
8 9 10 11 12 13Very poor 17 15 10 4 -4 -13 Poor 106 109 109 106 101 94 Regular 238 249 255 258 258 254 Good 323 340 350 357 359 358 Average 171 178 181 181 179 173
(Unit: 1,000 JPY)
Bad catch condition
Good catch condition
Moving at lower vessel speed cause to increase fishery income.
Moving at higher vessel speed cause to increase fishery income.

Discussion
4. What should we do for constructing efficient system of coastal squid jigging fishery ?
2. Fishermen can’t predict expected catch of squid before they depart from a harbor.
Does estimating the economical vessel speed in each catch condition have meaninglessness?
3. Economical vessel speed is the same as ecological vessel speed?
Before the 3rd oil crisis (80 JPY/L) ·······moved at 12 – 13 kt
At the 3rd oil crisis (120 JPY/L) ············decreased to 10 kt
After the 3rd oil crisis (80 JPY/L) ········ keep moving at 10 kt
1. Do fishermen select economical speed in each fuel price level?

Decreasing their vessel speed to 10 kt at the 3rd oil crisis is the economical choice
1. Do fishermen select economical vessel speed?
Keeping their vessel speed at 10 kt now is not economical choice
160
170
180
190
200
210
220
8 9 10 11 12 13
Fuel: 80 JPY/L (now)
100 JPY/L
120 JPY/L (3rd oil crisis)
Economical speed
Vessel speed (kt)
Fish
ery
inco
me
(Un
it: 1
,00
0 J
PY)

0
50
100
150
200
250
300
350
Mar Apr May Jun Jul Oct Dec Nov
11
120 JPY/L
CP
UE
(cas
e/d
ay/s
hip
)
8
9kt 13kt
9
80 JPY/L now
Good
Regular
Poor
Very poor
2. Estimating economical speed is meaninglessness?
100 JPY/L 8 10 13
12
13 12
9 8
10
12 11
13
Vessel speed (kt)
High
Low
Good
By selecting vessel speed in each season, fishermen will increase their fishery income.

If fishermen increase vessel speed from 10 kt to 13 kt, fuel consumption and emission of exhausted CO2 increase 40%
0
200
400
600
800
1,000
1,200
8 9 10 11 12 13
Squid jigging
MovingFu
el c
on
sum
pti
on
(L)
Vessel speed (kt)
3. Vessel speed and fuel consumption
40%
From the view of sustainable fishery, increasing speed is not better way
By extending the duration of the operation, fishermen might increase their fishery income, and might decrease fuel consumption and emission of exhausted CO2 gas.

3. Moving at 10kt and extend duration 1 hour
80 JPY/Liter
100 JPY/Liter
120 JPY/Liter
(Unit: 1,000 JPY)
Catch conditionvessel speed (kt)
8 9 10 11 12 13 10 kt, extend
Very poor 39 40 39 36 32 26 46
Poor 128 134 137 138 137 134 154
Regular 260 274 284 290 293 294 316
Good 345 365 379 388 394 398 420
Average 193 203 209 213 214 213 234
Catch conditionvessel speed (kt)
8 9 10 11 12 13 10 kt, extend
Very poor 28 27 24 20 14 7 31
Poor 117 121 123 122 119 114 139
Regular 249 261 269 274 275 274 301
Good 334 352 364 372 377 378 405
Average 182 190 195 197 196 193 219
Catch conditionvessel speed (kt)
8 9 10 11 12 13 10 kt, extend
Very poor 17 15 10 4 -4 -13 16
Poor 106 109 109 106 101 94 124
Regular 238 249 255 258 258 254 286
Good 323 340 350 357 359 358 390
Average 171 178 181 181 179 173 204
At almost of all situations, by extending duration of operation 1 hour for moving at 10 kt, fishermen will increase their fishery income.

4. What should we do?
Fishermen will increase their fishery income and will decrease fuel consumption and emission of exhausted CO2 gas.
Fishing ground High speed
Low speed
Now, few fishing port have departure time restriction
Fishermen tend to move at high vessel speed
Departure time restriction
Start jigging time restriction
We should to change from departure time restriction to start jigging operation time restriction
3 P.M.
3 P.M. 3:30 P.M.
5 P.M.
5 P.M. Fishing ground
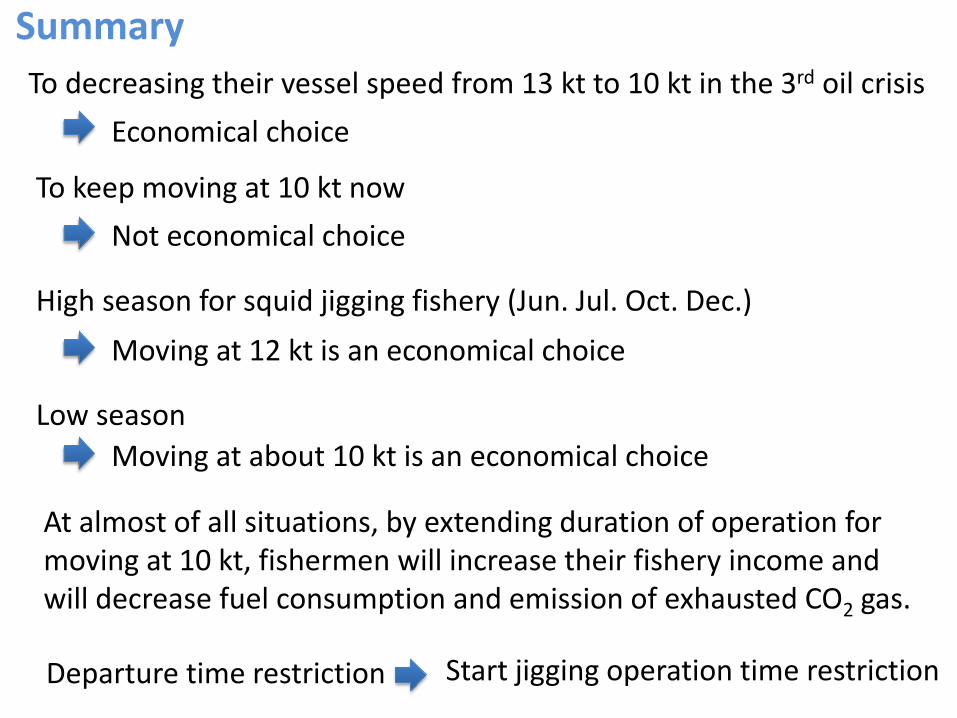
Summary
High season for squid jigging fishery (Jun. Jul. Oct. Dec.)
Low season
To decreasing their vessel speed from 13 kt to 10 kt in the 3rd oil crisis
At almost of all situations, by extending duration of operation for moving at 10 kt, fishermen will increase their fishery income and will decrease fuel consumption and emission of exhausted CO2 gas.
Departure time restriction Start jigging operation time restriction
To keep moving at 10 kt now
Economical choice
Not economical choice
Moving at 12 kt is an economical choice
Moving at about 10 kt is an economical choice

Thank you for your attention
Todarodes pacificus