Embed Size (px)
Citation preview

Fishery selection on Alaskan sockeye salmon and potential changes in size at maturity
Neala KendallTom Quinn
School of Aquatic and Fishery SciencesUniversity of Washington
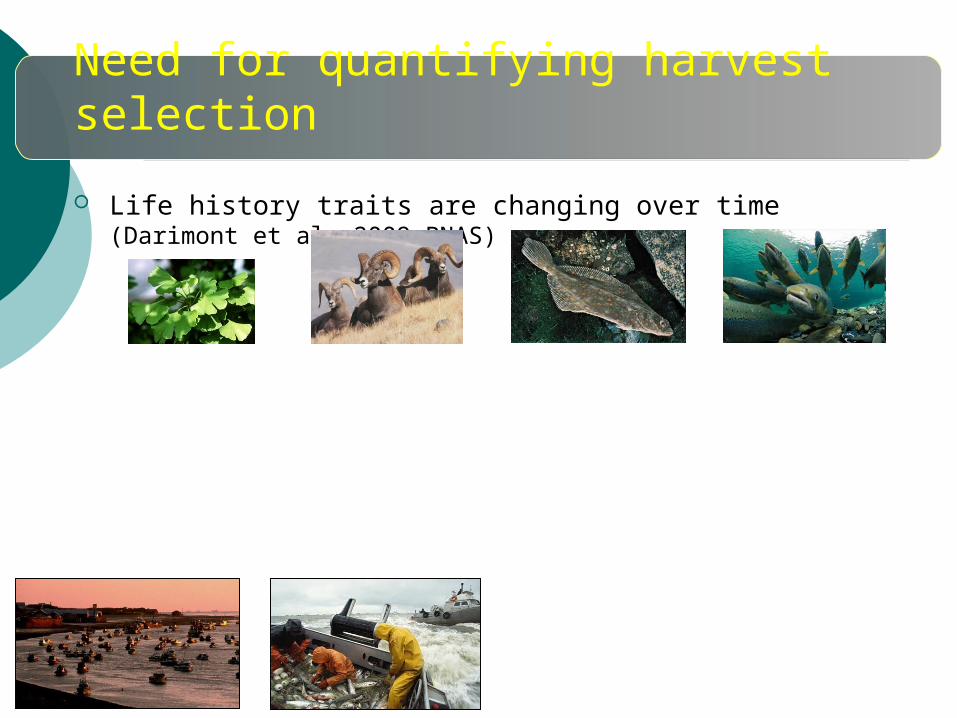
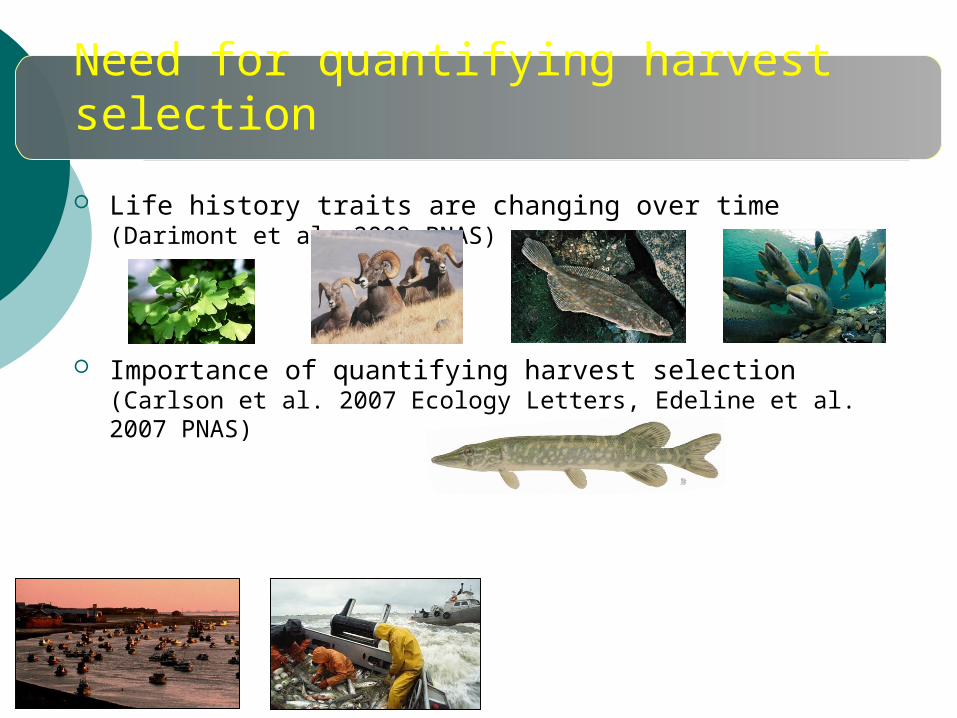
Need for quantifying harvest selection
Life history traits are changing over time (Darimont et al. 2009 PNAS)
Need for quantifying harvest selection
Life history traits are changing over time (Darimont et al. 2009 PNAS)
Importance of quantifying harvest selection (Carlson et al. 2007 Ecology Letters, Edeline et al. 2007 PNAS)
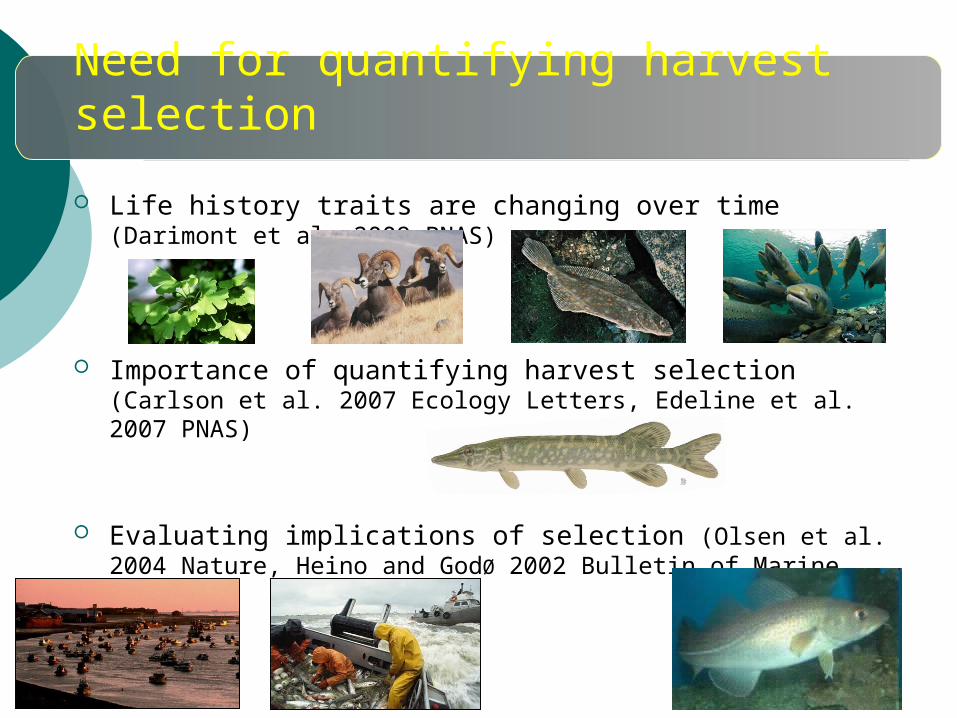
Need for quantifying harvest selection
Life history traits are changing over time (Darimont et al. 2009 PNAS)
Importance of quantifying harvest selection (Carlson et al. 2007 Ecology Letters, Edeline et al. 2007 PNAS)
Evaluating implications of selection (Olsen et al. 2004 Nature, Heino and GodØ 2002 Bulletin of Marine Science)
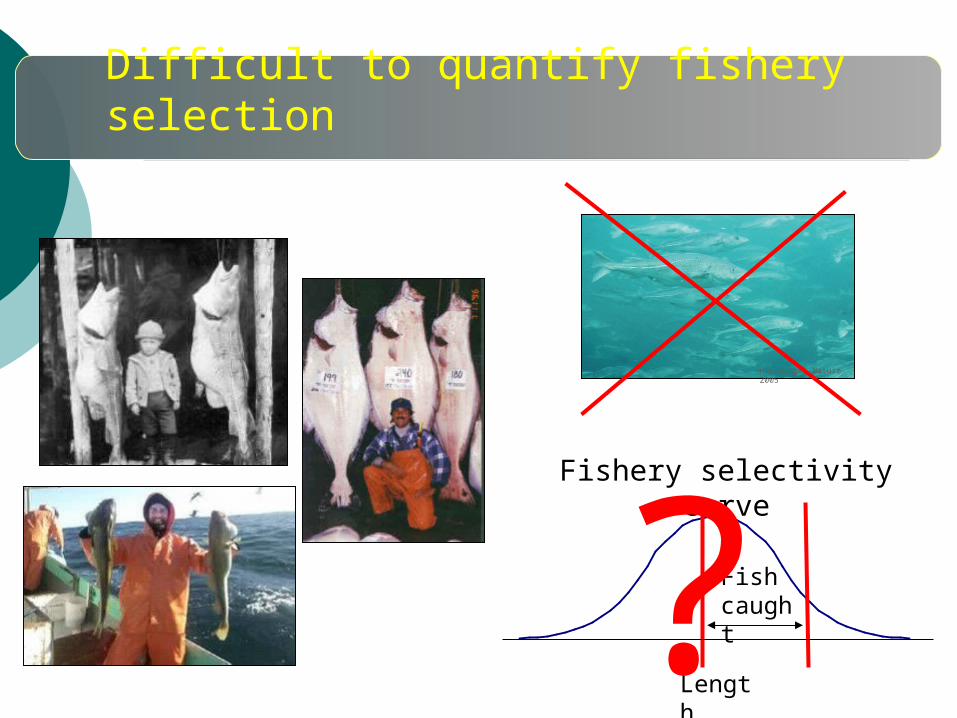
Difficult to quantify fishery selection
Hutchings, Nature 2005
Fish caught
Length
Fishery selectivity curve
?
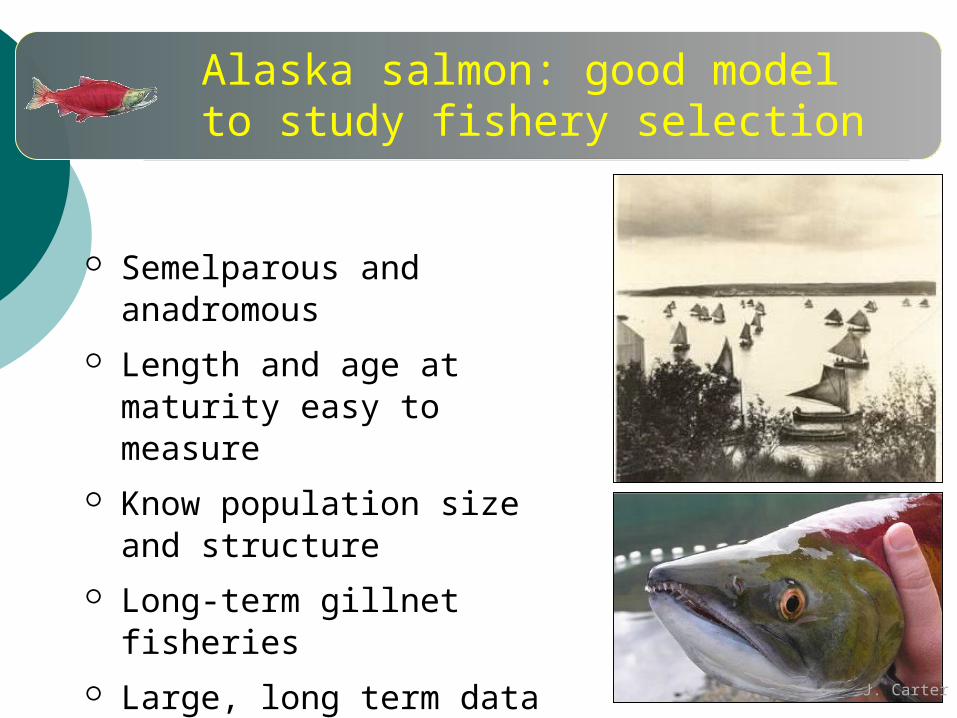
Alaska salmon: good model to study fishery selection
Semelparous and anadromous
Length and age at maturity easy to measure
Know population size and structure
Long-term gillnet fisheries Large, long term data set
J. Carter
Research questions
Does fishery selection vary by fish length and sex?
J. Carter
Research questions
Does fishery selection vary by fish length and sex?
Are fish length at age changes over time correlated with fishery selection?
J. Carter
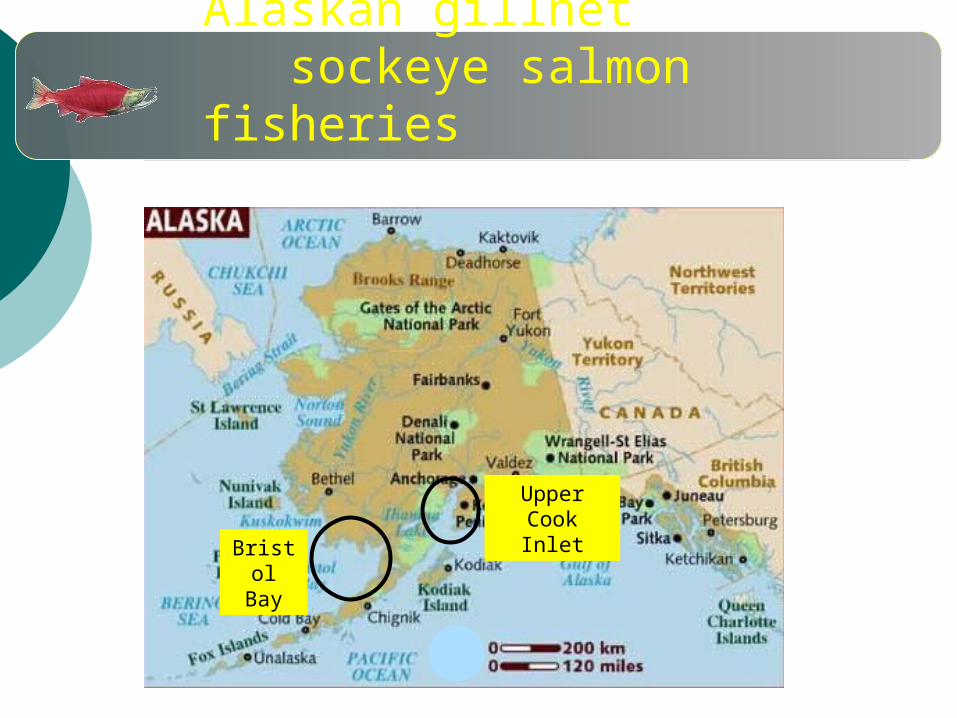
Alaskan gillnet sockeye salmon fisheries
Bristol Bay
Upper Cook Inlet
Methods
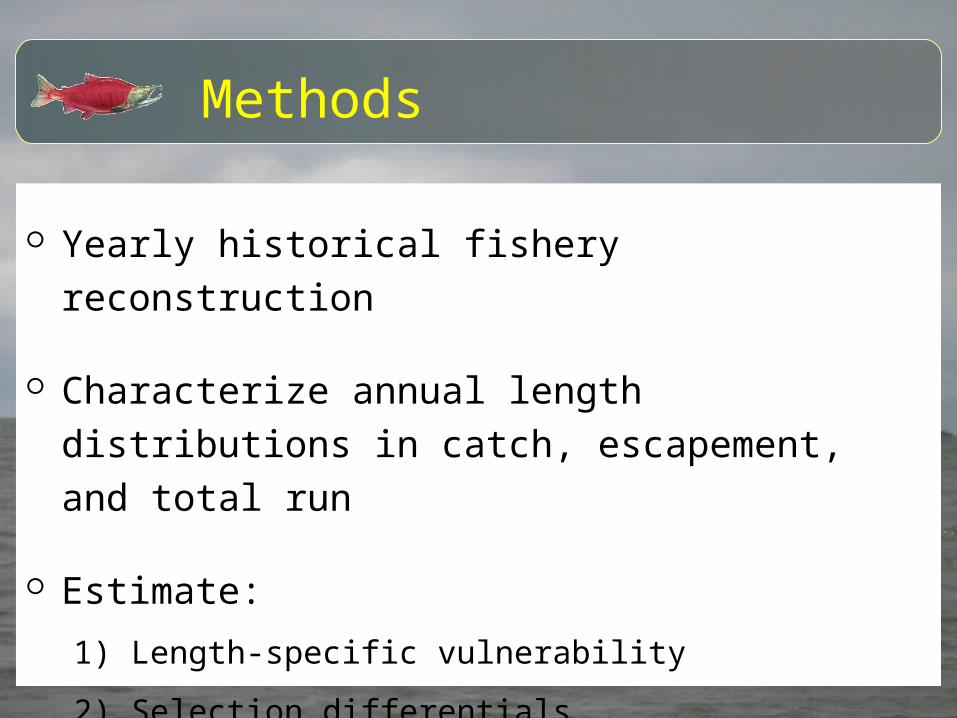
Yearly historical fishery reconstruction
Characterize annual length distributions in catch, escapement, and total run
Estimate:
1) Length-specific vulnerability
2) Selection differentials
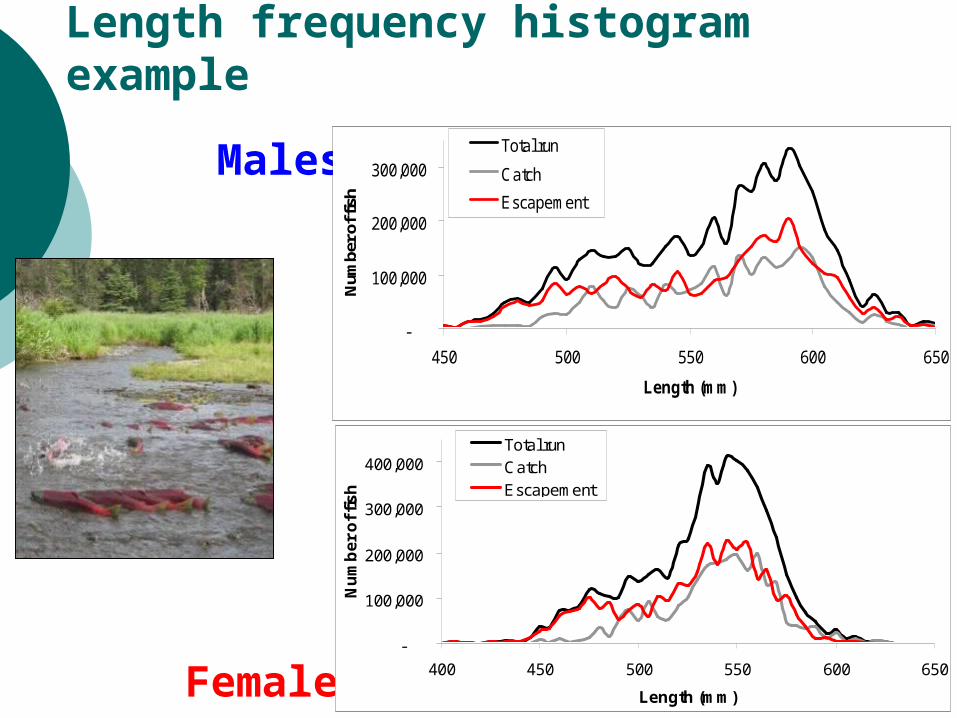
Length frequency histogram example
Females
Males
-
100,000
200,000
300,000
450 500 550 600 650
Length (mm)
Num
ber o
f fis
h
Total run
Catch
Escapement
-
100,000
200,000
300,000
400,000
400 450 500 550 600 650
Length (mm)
Nu
mb
er
of f
ish
Total runCatchEscapement
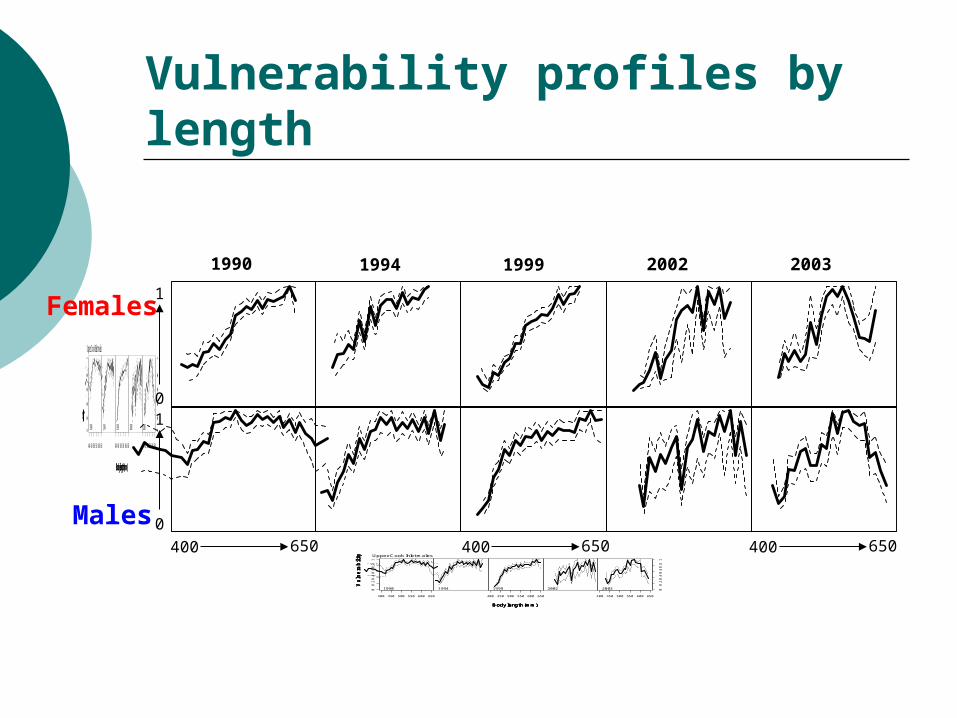
Vulnerability profiles by length
Females
Males
199000
.20
.40
.60
.81
400 450 500 550 600 650
Upper Cook Inlet males
Body length (mm)
Vu
lne
rab
ility
1994
Body length (mm)
Vu
lne
rab
ility
1999
400 450 500 550 600 650
Body length (mm)
Vu
lne
rab
ility
2002
Body length (mm)
Vu
lne
rab
ility
2003 00
.20
.40
.60
.81
400 450 500 550 600 650
Body length (mm)
Vu
lne
rab
ility
199000.2
0.40.6
0.81
400 450 500 550 600 650
Upper Cook Inlet males
Body length (mm)
Vulnerability
1994
Body length (mm)
Vulnerability
1999
400 450 500 550 600 650
Body length (mm)
Vulnerability
2002
Body length (mm)
Vulnerability
2003 00.2
0.40.6
0.81
400 450 500 550 600 650
Body length (mm)
Vulnerability
1990 1994 1999 2002 2003
400 650 400 650 400 6500
10
1
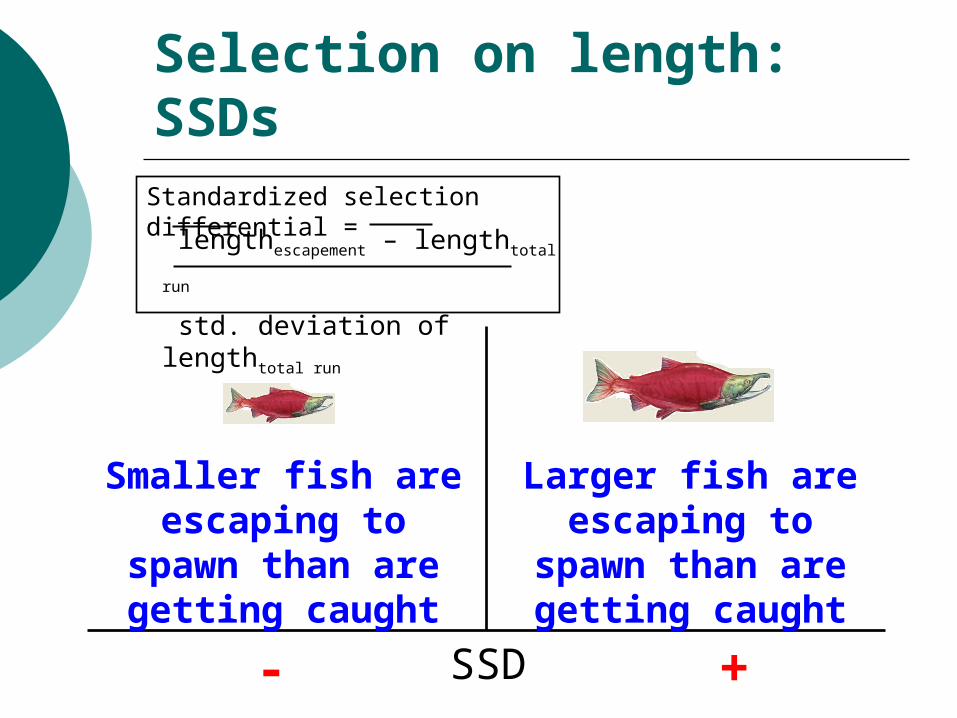
Selection on length: SSDs
SSD
Larger fish are escaping to
spawn than are getting caught
+-
Smaller fish are escaping to
spawn than are getting caught
Standardized selection differential =
lengthescapement – lengthtotal run
std. deviation of lengthtotal run
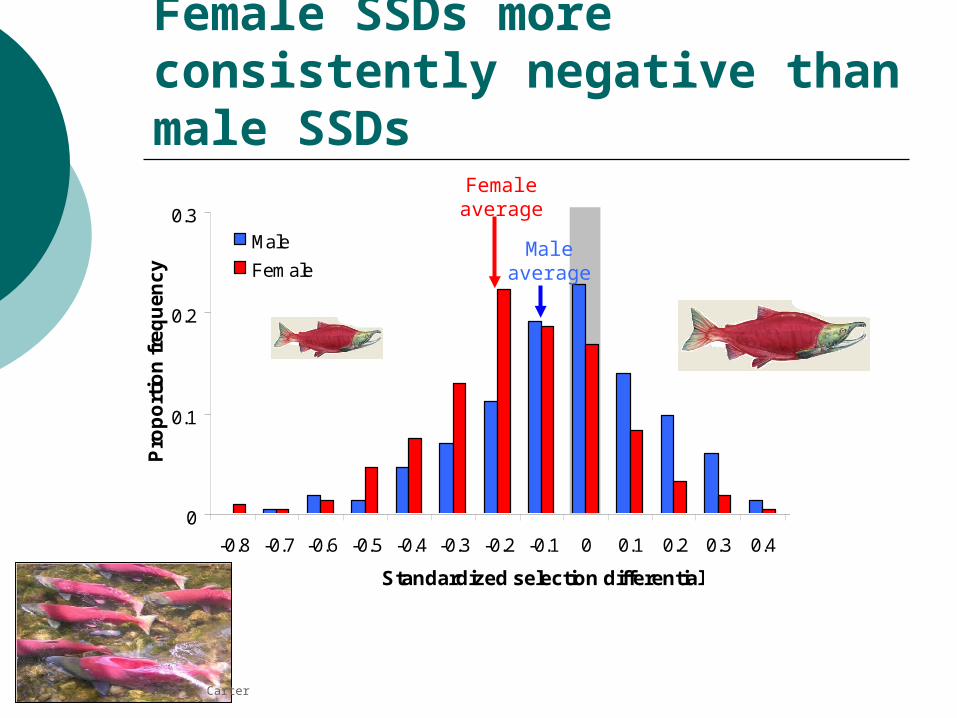
0
0.1
0.2
0.3
-0.8 -0.7 -0.6 -0.5 -0.4 -0.3 -0.2 -0.1 0 0.1 0.2 0.3 0.4 0.5 0.6
Standardized selection differential
Pro
po
rtio
n f
req
ue
nc
y
Male
Female
J. Carter
Female SSDs more consistently negative than male SSDs
Female average
Male average
Fishery selection on Bristol Bay sockeye salmon and length at age changes over time
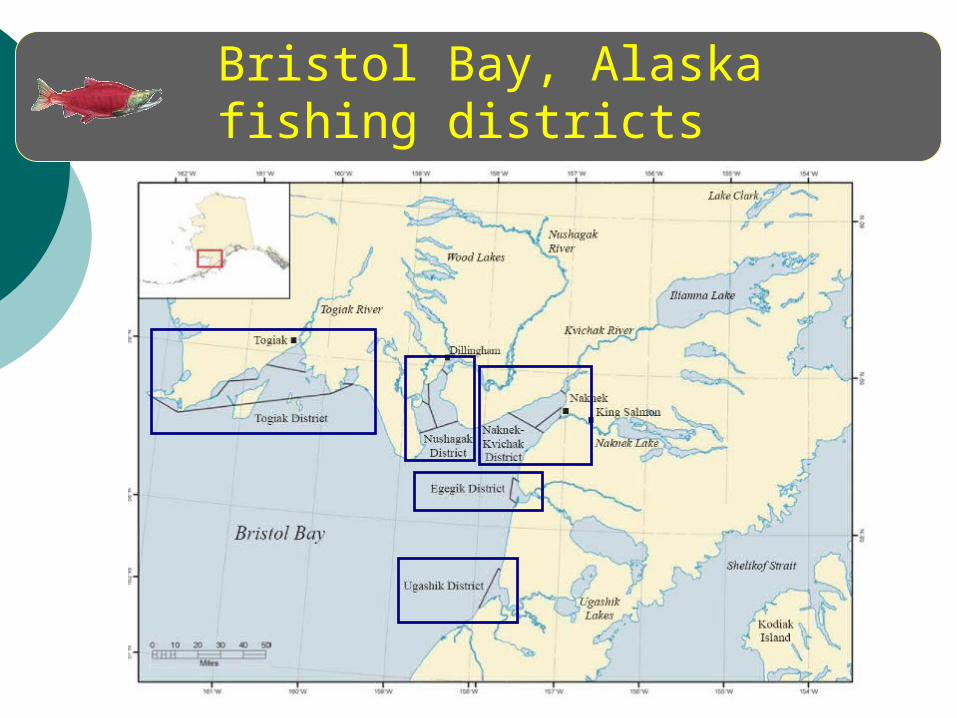
Bristol Bay, Alaska fishing districts
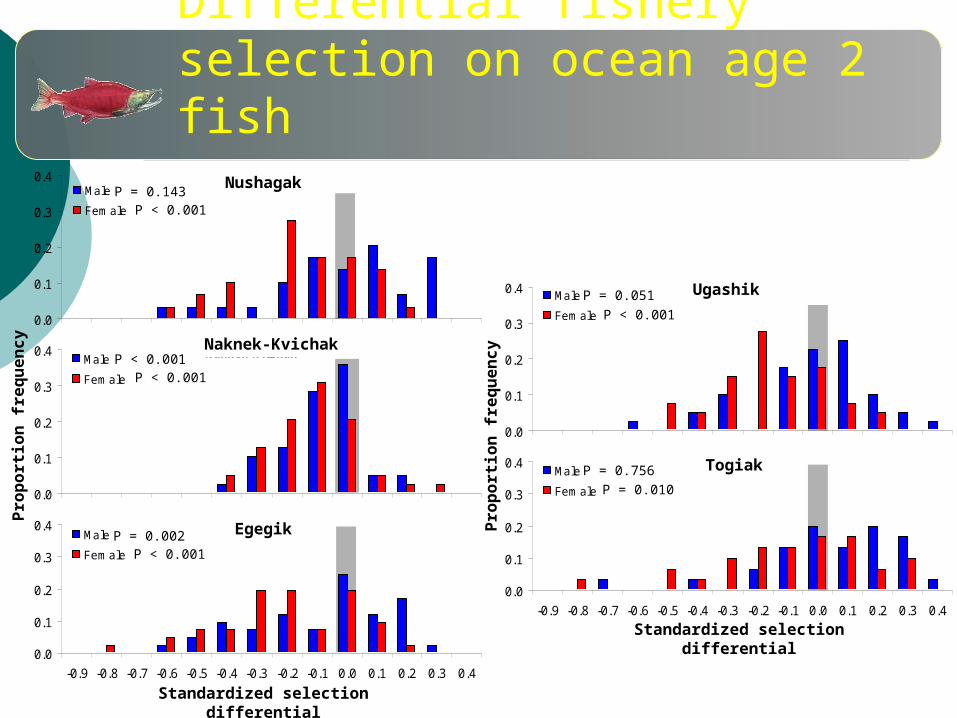
Differential fishery selection on ocean age 2 fish
Pro
po
rtio
n f
req
ue
nc
y
Pro
po
rtio
n f
req
ue
nc
y
Standardized selection differential
Standardized selection differential
Nushagak
0.0
0.1
0.2
0.3
0.4Male
Fem ale
Naknek-Kvichak
0.0
0.1
0.2
0.3
0.4
Egegik
0.0
0.1
0.2
0.3
0.4
-0.9 -0.8 -0.7 -0.6 -0.5 -0.4 -0.3 -0.2 -0.1 0.0 0.1 0.2 0.3 0.4
Ugashik
0.0
0.1
0.2
0.3
0.4
Togiak
0.0
0.1
0.2
0.3
0.4
-0.9 -0.8 -0.7 -0.6 -0.5 -0.4 -0.3 -0.2 -0.1 0.0 0.1 0.2 0.3 0.4
P < 0.001P = 0.143
0.0
0.1
0.2
0.3
0.4Male
Fem ale
0.0
0.1
0.2
0.3
0.4Male
Fem ale
0.0
0.1
0.2
0.3
0.4Male
Fem ale
0.0
0.1
0.2
0.3
0.4Male
Fem ale
P < 0.001P < 0.001
P < 0.001P = 0.002
P < 0.001
P = 0.051
P = 0.010P = 0.756
Nushagak
Naknek-Kvichak
Egegik
Ugashik
Togiak
Nushagak
Naknek-Kvichak
Ugashik
Togiak
1960 1970 1980 1990 2000 2010Year
NushagakMale
Female
Naknek-Kvichak
Egegik
1960 1970 1980 1990 2000 2010Year
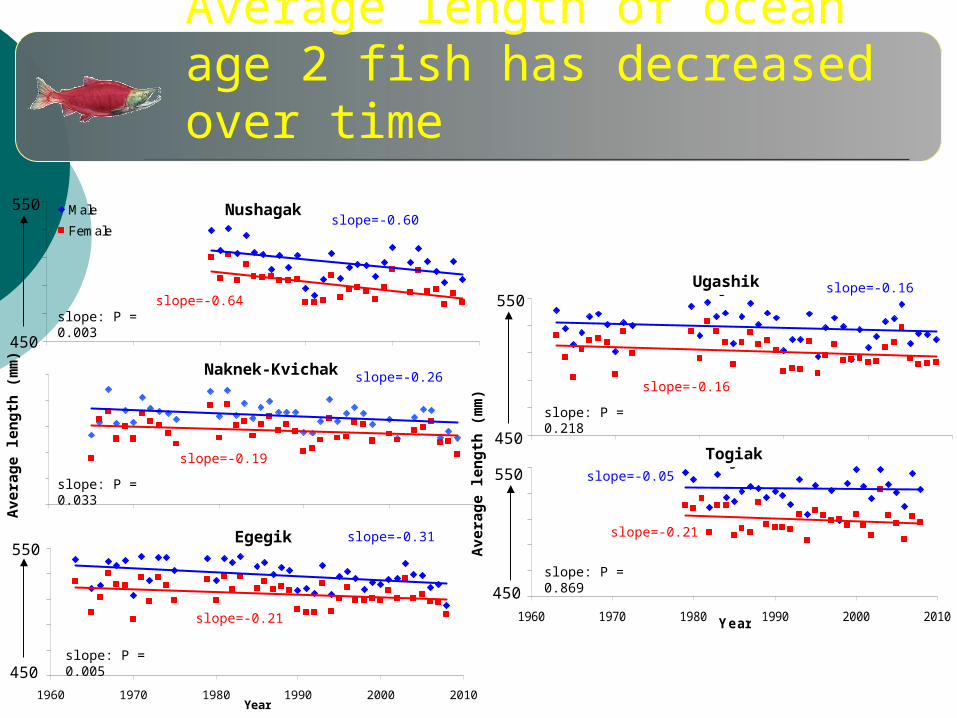
Average length of ocean age 2 fish has decreased over time
Ave
rag
e le
ng
th (
mm
)
slope=-0.60
slope=-0.64
slope=-0.26
slope=-0.31
slope=-0.16
slope=-0.05slope=-0.19
slope=-0.21
slope=-0.16
slope=-0.21
450
550
450
550
Ave
rag
e le
ng
th (
mm
)
450
550
450
550
Egegik
Ugashik
Togiak
Nushagak
Naknek-Kvichak
slope: P = 0.003
slope: P = 0.033
slope: P = 0.005
slope: P = 0.218
slope: P = 0.869
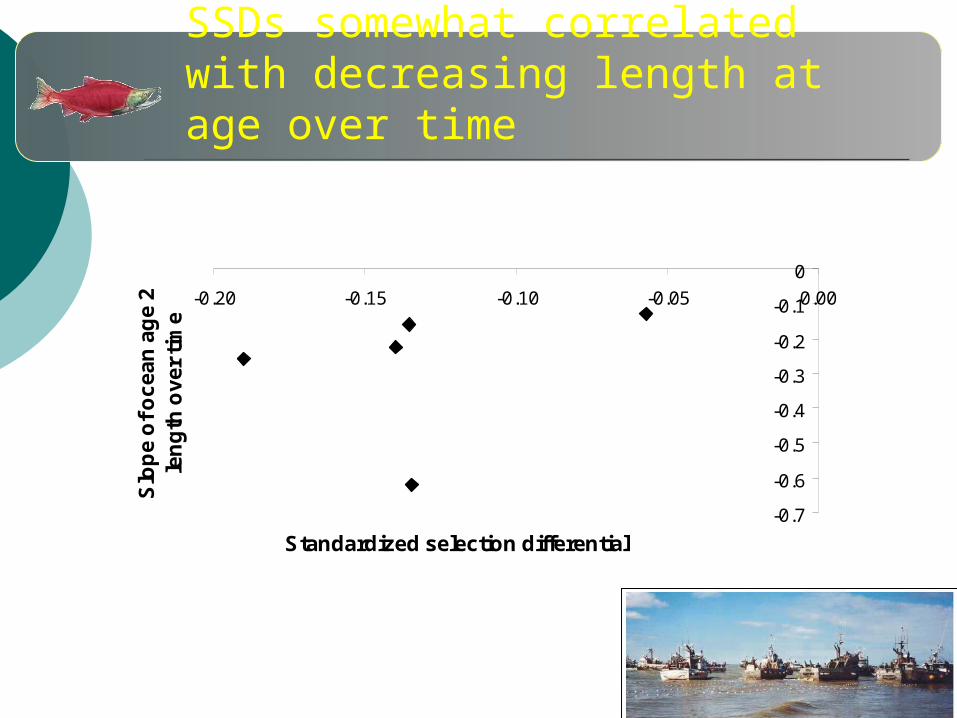
SSDs somewhat correlated with decreasing length at age over time
-0.7
-0.6
-0.5
-0.4
-0.3
-0.2
-0.1
0
-0.20 -0.15 -0.10 -0.05 0.00
Standardized selection differential
Slo
pe
of
oc
ea
n a
ge
2
len
gth
ov
er
tim
e
Conclusions
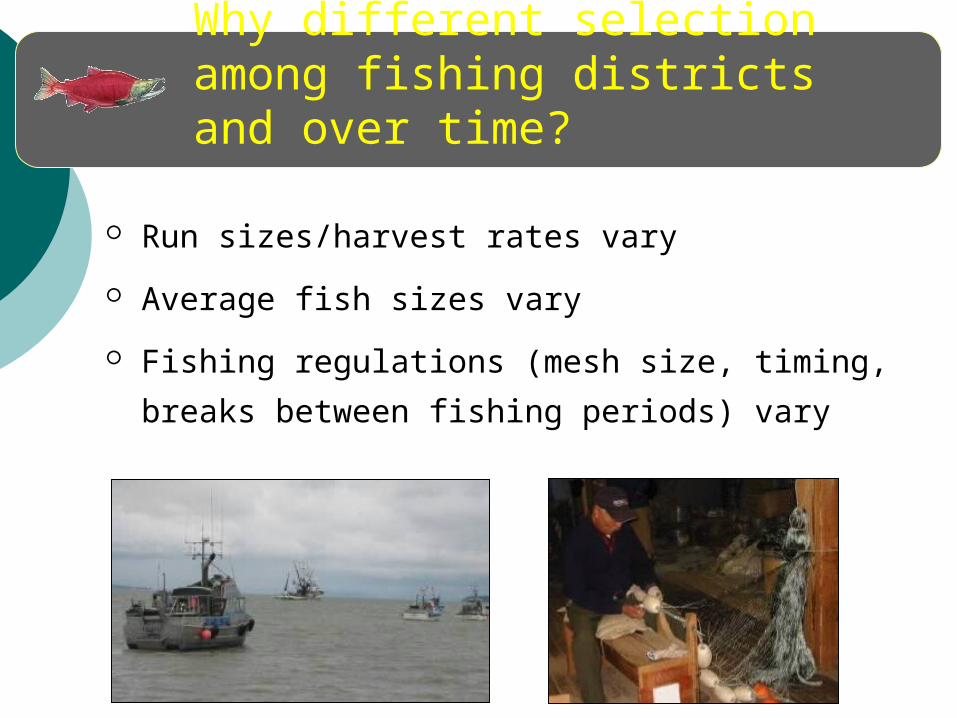
Run sizes/harvest rates vary
Average fish sizes vary
Fishing regulations (mesh size, timing, breaks
between fishing periods) vary
Conclusions
Why different selection among fishing districts and over time?
Conclusions
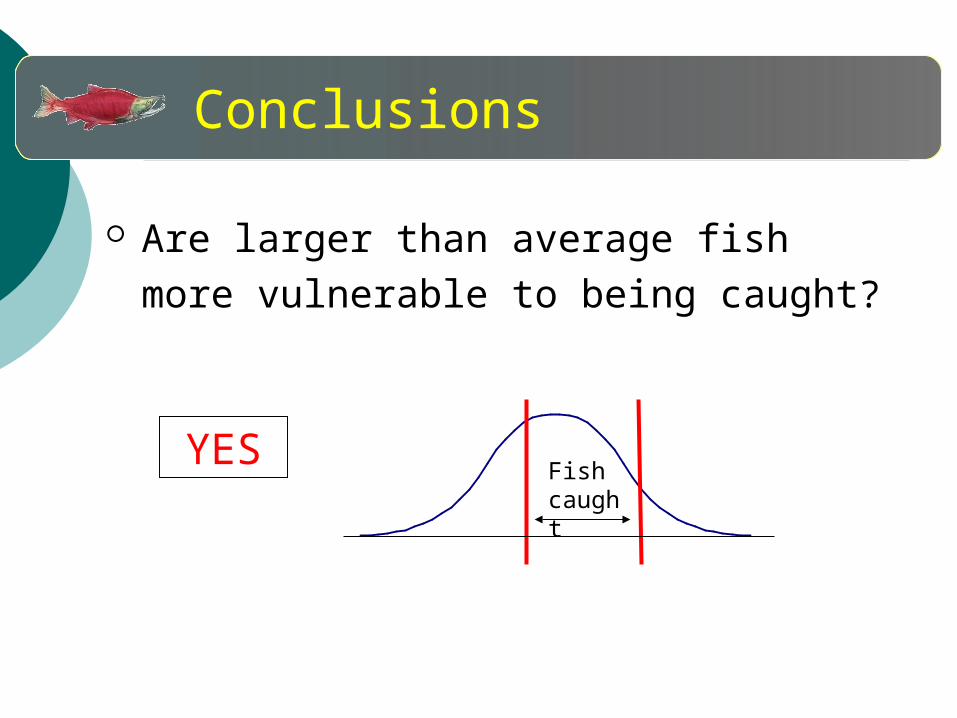
Are larger than average fish more vulnerable to being caught?
YESFish caught
ConclusionsConclusions
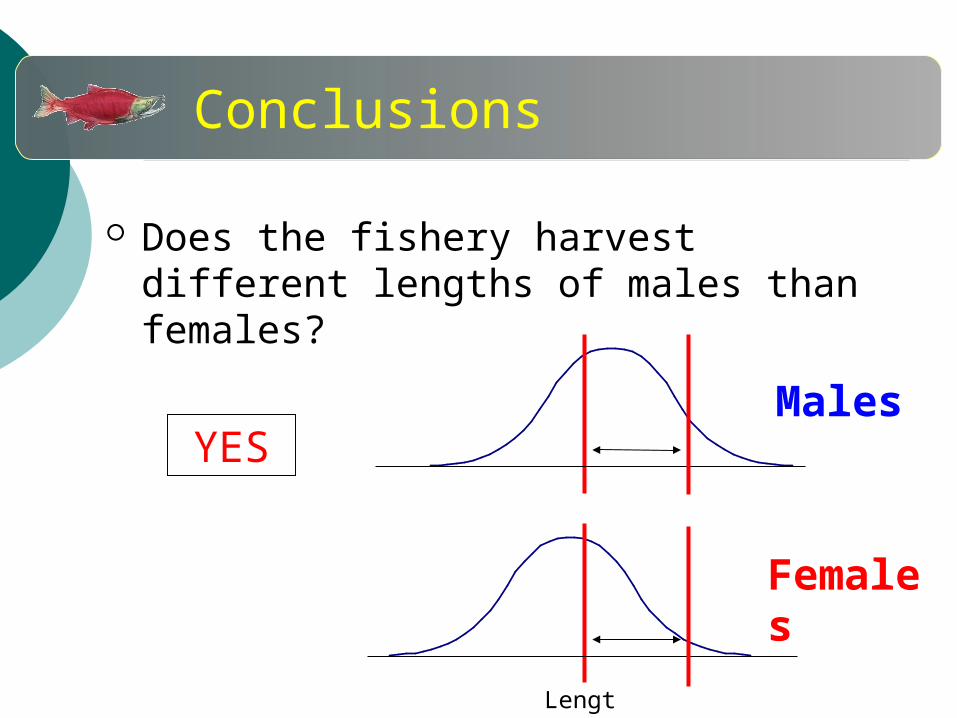
Males
Does the fishery harvest different lengths of males than females?
YES
Length
Females
Conclusions

Are fish length at age changes over time correlated with fishery selection?
YES…Fishing districts that
harvest larger fish show a greater decline in fish length at age over time
Conclusions
Other factors, such as ocean temperature and competition, also affect
growth
But…
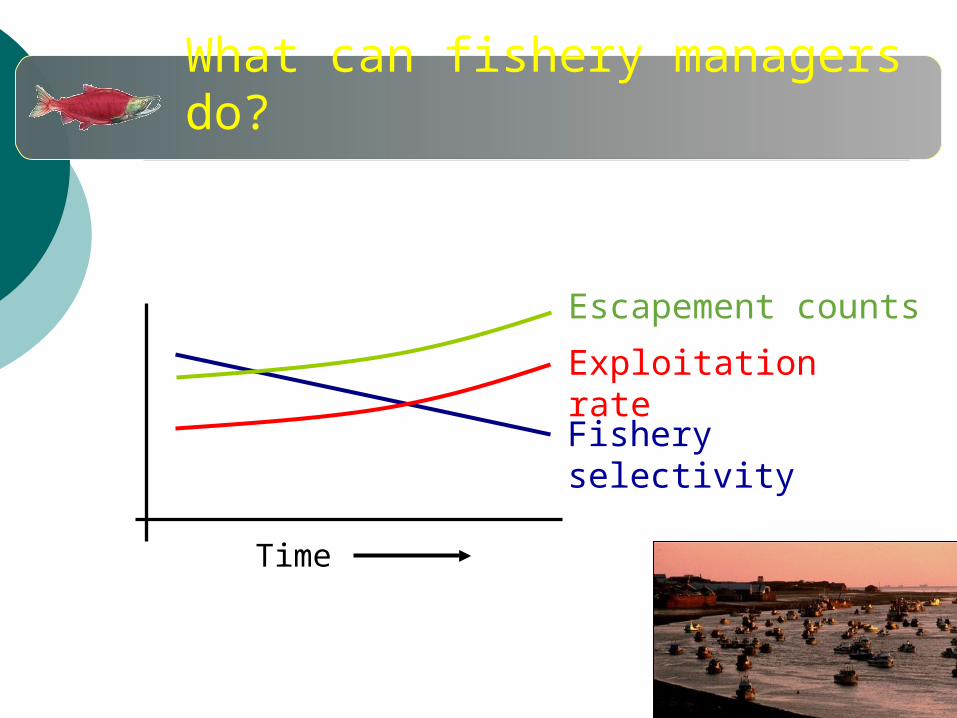
What can fishery managers do?
Time
Exploitation rate
Fishery selectivity
Escapement counts

Create quantitative genetics models to understand impacts of fishery selection and environmental factors on length at age at maturation
Calculate maturation reaction norms for spawning populations to understand potential genetic changes associated with fishery selection
Using estimated selectivities, model ideal length and age at maturity under different harvest scenarios
J. Bennis J. Carter
Future work
J. BennisJ. Bennis
Tim Baker and Fred West, ADFG
Mark Willette and Terri Tobias, ADFG
Jeff Hard, NOAA Fisheries
Alaska Salmon Program, UW
Funding: School of Aquatic and Fishery Sciences
Alaska Sustainable Salmon Fund
National Science Foundation
Gordon and Betty Moore Foundation
Acknowledgements

Ugashik
0.0
0.1
0.2
0.3
0.4
Togiak
0.0
0.1
0.2
0.3
0.4
-0.4 -0.3 -0.2 -0.1 0.0 0.1 0.2 0.3 0.4 0.5 0.6
Nushagak
0.0
0.1
0.2
0.3
0.4Male
Female
Naknek-Kvichak
0.0
0.1
0.2
0.3
0.4
Egegik
0.0
0.1
0.2
0.3
0.4
-0.4 -0.3 -0.2 -0.1 0.0 0.1 0.2 0.3 0.4 0.5 0.6
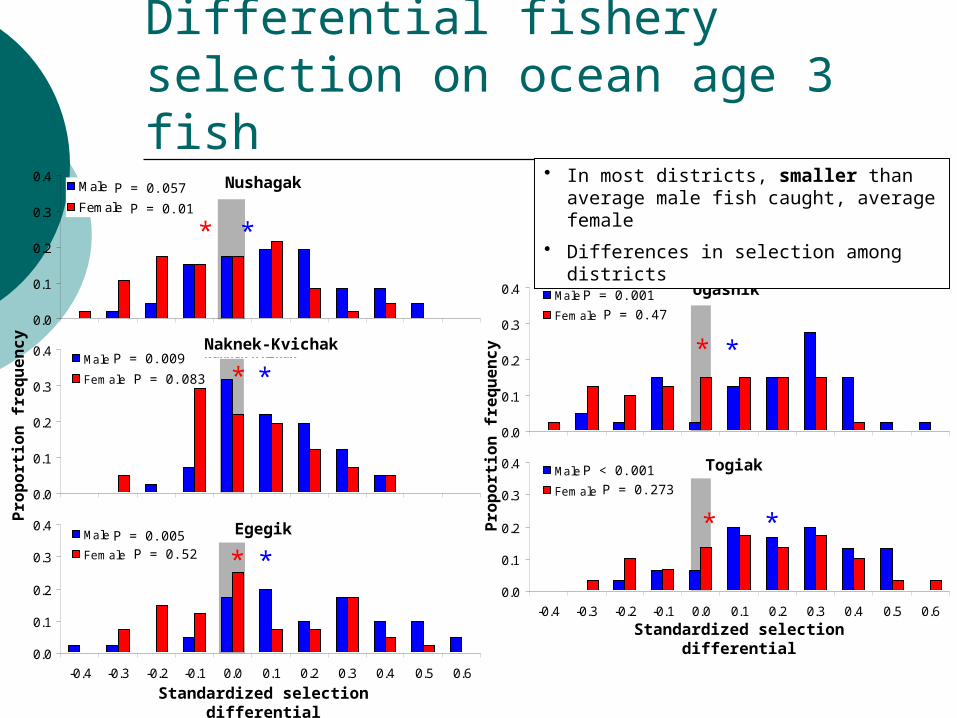
Differential fishery selection on ocean age 3 fish
Pro
po
rtio
n f
req
ue
nc
y
Pro
po
rtio
n f
req
ue
nc
y
Standardized selection differential
Standardized selection differential
P = 0.01
P = 0.057
0.0
0.1
0.2
0.3
0.4Male
Fem ale
0.0
0.1
0.2
0.3
0.4Male
Fem ale
0.0
0.1
0.2
0.3
0.4Male
Fem ale
0.0
0.1
0.2
0.3
0.4Male
Fem ale
P = 0.083
P = 0.009
P = 0.52P = 0.005
P = 0.47
P = 0.001
P = 0.273P < 0.001
Nushagak
Naknek-Kvichak
Egegik
Ugashik
Togiak
Nushagak
Naknek-Kvichak
• In most districts, smaller than average male fish caught, average female
• Differences in selection among districts
*
**
*
**
**
*
*
Ugashik
Togiak
1960 1970 1980 1990 2000 2010Year
Nushagak Male
Female
Naknek-Kvichak
Egegik
1960 1970 1980 1990 2000 2010Year
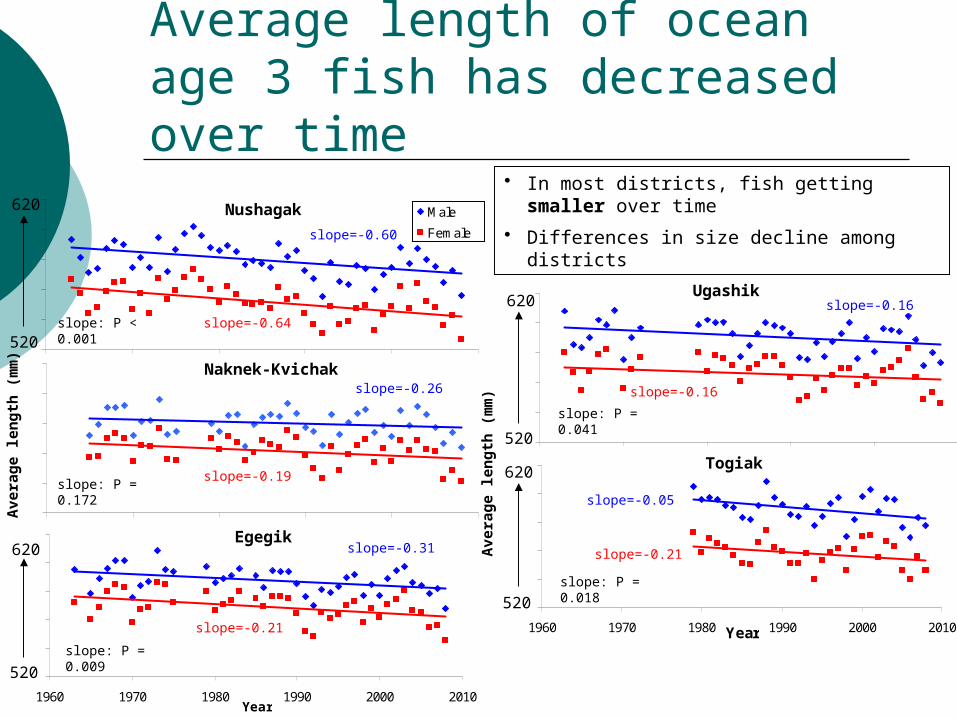
Average length of ocean age 3 fish has decreased over time
Ave
rag
e le
ng
th (
mm
)
slope=-0.60
slope=-0.64
slope=-0.26
slope=-0.31
slope=-0.16
slope=-0.05
slope=-0.19
slope=-0.21
slope=-0.16
slope=-0.21
520
620
520
620
Ave
rag
e le
ng
th (
mm
)
520
620
520
620
Egegik
Ugashik
Togiak
Nushagak
Naknek-Kvichak
slope: P < 0.001
slope: P = 0.172
slope: P = 0.009
slope: P = 0.041
slope: P = 0.018
• In most districts, fish getting smaller over time
• Differences in size decline among districts
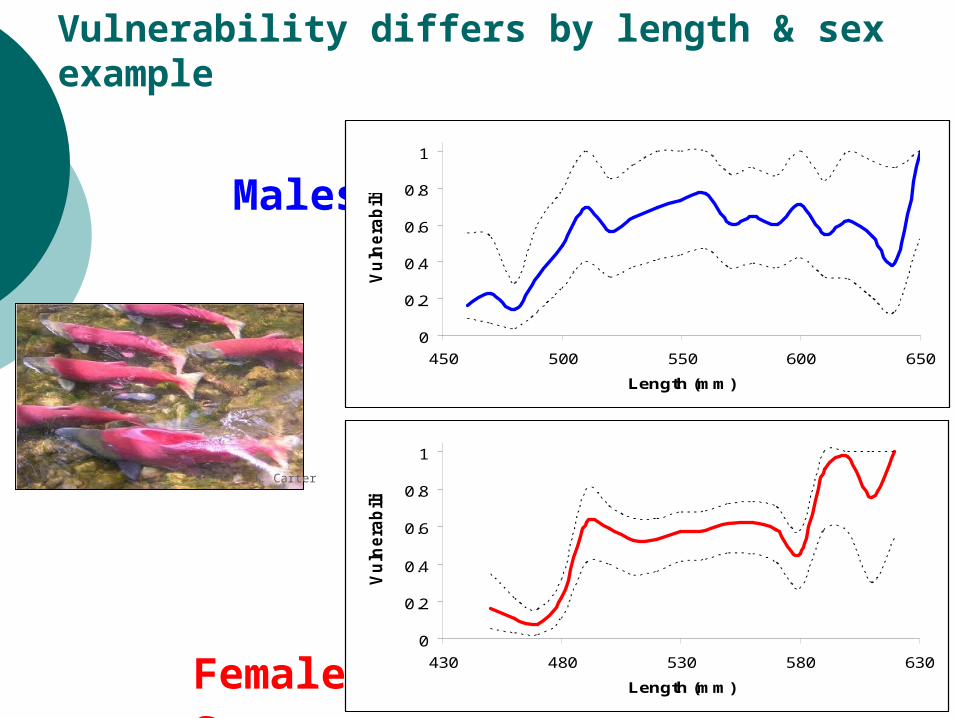
Vulnerability differs by length & sex example
Females
J. Carter
Males
0
0.2
0.4
0.6
0.8
1
450 500 550 600 650
Length (mm)V
uln
era
bilit
y
0
0.2
0.4
0.6
0.8
1
430 480 530 580 630
Length (mm)
Vu
lne
rab
ilit
y
0
0.2
0.4
0.6
0.8
1
Vu
lne
rab
ility
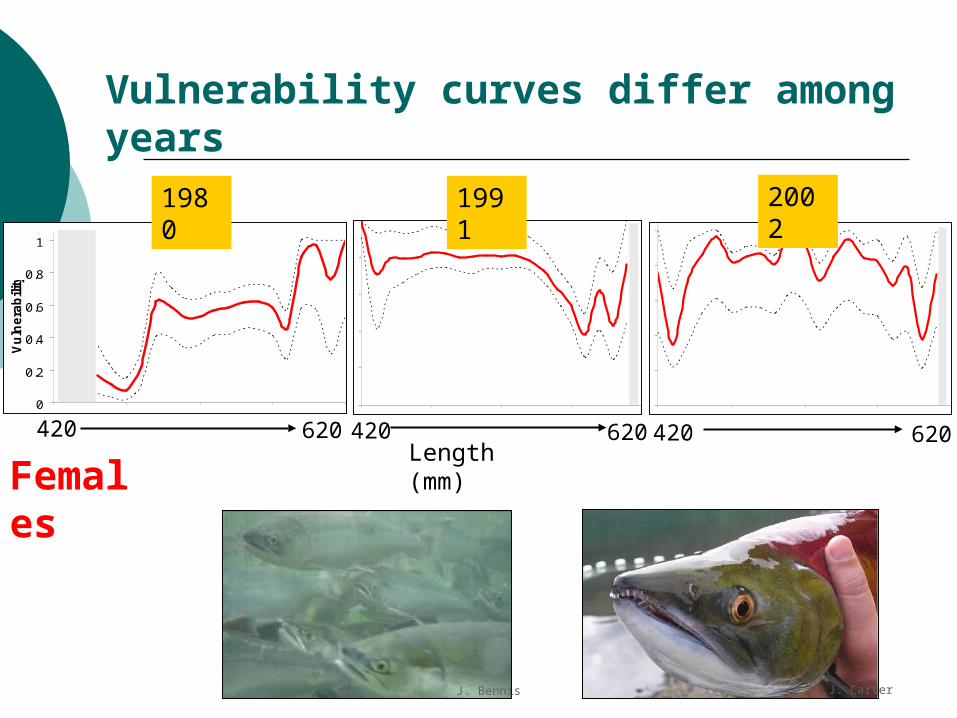
Females
Vulnerability curves differ among years
J. Bennis
Length (mm)
1980 1991 2002
420 620420 620 420 620
J. Carter