Embed Size (px)
Citation preview

Munich Personal RePEc Archive
Fishing for litter: A cost-benefit analysis
of how to abate ocean pollution
King, Peter
University of Bath
5 September 2018
Online at https://mpra.ub.uni-muenchen.de/92298/
MPRA Paper No. 92298, posted 15 Mar 2019 17:24 UTC

See discussions, stats, and author profiles for this publication at: https://www.researchgate.net/publication/327440884
Fishing for litter: A cost-benefit analysis of how to abate ocean pollution
Thesis · September 2018
DOI: 10.13140/RG.2.2.23877.29927
CITATIONS
0READS
354
1 author:
Some of the authors of this publication are also working on these related projects:
How to design an algorithm in MATLAB to solve a Bayesian signalling game in equilibrium. View project
MRes Dissertation View project
Peter King
University of Bath
5 PUBLICATIONS 0 CITATIONS
SEE PROFILE
All content following this page was uploaded by Peter King on 05 September 2018.
The user has requested enhancement of the downloaded file.
Department of Economics
Faculty of Humanities and Social Sciences
Dissertation for the Degree of
MRes Economics
Fishing for litter:
A cost-benefit analysis of how to abate ocean pollution.
Peter King
September 2018

Faculty of Humanities and Social Sciences
Any student found to have cheated or plagiarised in assessment will be penalised. The Board of
Examiners for Programmes will determine the nature and severity of the penalty but this may mean
failure of the unit concerned or a part of the degree, with no provision for reassessment or retrieval
of that failure. Proven cases of plagiarism or cheating can also lead to disciplinary proceedings as
indicated in University Regulation 7.
I am aware of the guidelines on plagiarism: this coursework is the product of my own work.
Name: Peter King
Signed: ……………………………………………………………….
Degree: MRes Economics
Supervisor: Dr Alistair Hunt
Word Count: 14,808 Date: 05/09/2018
This dissertation may be available for consultation within the University Library and may
be photocopied or lent to other libraries for the purposes of consultation.
Copyright of this dissertation rests with the author. No quotation from the dissertation and no
information derived from it may be published without the prior written permission of the author.

Fishing for litter: A cost-benefit analysis of how to abate
ocean pollution
Peter King.
Department of Economics, University of Bath
ES50064 MRes Dissertation
Sub Questions:
• Is it financially viable to recover marine debris?
• Is it economically viable to recover marine debris?
• Can adjusted unit value transfer be used to estimate the damages of marine debris?
Abstract
Marine plastics inflict annual damages of nearly $2bn on the marine economy.These damages may now be mitigated by a novel scheme that proposes torecover marine plastics. While a range of uses exist for recovered marineplastics; this research finds that none are profitable. While not financiallyviable, the scheme is found to be economically viable given the significantdamages from marine plastics on the marine economy. Implications from thisresearch for the future of pollution abatement are remarked upon.
Keywords: Cost-benefit analysis, recycling, marine plastics.JEL classification: D26, H23, Q58
Email address: [email protected] (Peter King.)

Introduction
The 620% rise in plastic production since 1975 has been accompanied byan increased volume of plastics in the world’s oceans (Jambeck et al., 2005).Indeed, of the estimated 6.4 million tonnes of marine debris that enter theoceans annually, between 60 and 80% is believed to be plastic (Derraik, 2002).Once in the ocean, marine plastics inflict adverse effects on both marine life,via ingestion, entanglement and leached chemicals (Azzarello and Van-Vleet,1987), and the marine economy, via damaged vessels, lost fishing and reducedtourism (Jambeck et al., 2005). While there is some ambiguity about howfatal plastics are to marine life, there is considerable support for the viewthat marine plastic inflicts significant damages on a range of sectors in themarine economy (McIlgorm, Campbell and Rule, 2011). Therefore, to abatethe damages caused by the growth in plastic production, some method ofrecovering marine plastics must be sought.
To recover marine plastics, a variety of methods have been proposed.The most notable of these was devised by a new start-up, called ‘The OceanCleanup’ (‘TOC’), that developed a novel technology that purports to be ableto recover floating marine plastics. The technology essentially uses a boom,deployed across the North Pacific, to force marine plastics to converge andaccumulate in the area of the boom. The boom may then recover floatingplastics and store them, ready for transport to shore. Once ashore, recoveredmarine plastics may be used in a manner of ways, such as generating oil(pyrolysis), electricity (waste-to-energy) or new plastics (recycling) and TOCbelieves that these uses may be profitable. However, this research fails tosupport this assertion and instead notes that the low market prices of oil,electricity and plastics cannot support the high operating costs of this scheme.
While the operating costs exceed the revenues, the economic benefitsalso exceed the costs. This suggests a duality in the viability of TOC wherebythe scheme is shown to be economically but not financially viable. Thisresult was found by conducting a cost-benefit analysis (CBA) of the scheme.CBA was used first to determine financial viability and then extended toexplore economic viability. To determine financial viability, the expenses wereupdated from a prior feasibility study on TOC and then compared to revenuesestimated using market prices. To determine economic viability, these costsand benefits were augmented by a calculation of the avoided damages frommarine debris. To estimate marine debris damages, previous estimates of
4

marine debris damages were subject to adjusted unit value-transfer. Thistechnique has been commonly used to ascertain valuations where primarydata is not available or previous estimates are inexact (Brouwer and Spaninks,1999). Additionally, once adjusted, new values were discounted and subjectto sensitivity analysis to increase the accuracy and validity of the estimates.The estimates produced can be summarised by a ratio of financial costs torevenues of 1:24, implying the scheme is not financially viable, and a ratio ofeconomic costs to benefits of 1:2, implying the scheme is economically viable.The implications of this duality are explored with regards to suitable fundingmodels.
This research is organised as follows. Firstly, a review of the literaturesuggests uncertainty about the effects of marine debris and how to possiblymitigate them and the TOC scheme was selected to mitigate them. To examineTOC’s financial and economic viability, an appropriate method was designedgiven the restrictions of no primary data and scarcity of secondary data. Thismethod was implemented in the results section which details the financial andeconomic costs and benefits of the scheme. Finally, comment was made on thelimitations and implications of this research.
5

Literature Review
This section explores the literature on the effects, control, types anduses of marine debris. Marine debris may enter the oceans either as industrialeffluent (Roberts and Spence, 1976), mismanaged consumer waste (Azzarelloand Van-Vleet, 1987), or from dumping at sea (Hammer, Kraak and Parsons,2012). Once in the ocean, there are three main effects of marine debris onmarine life; ingestion, entanglement and leaching. Additionally, there are threemain effects of marine debris on the marine economy; damage to vessels, lostfish stocks, and reduced tourism (McIlgorm, Campbell and Rule (2011), Mouat,Lozano and Bateson (2010)). However, there is considerable uncertainty inthe literature regarding the magnitude of these effects. This section, therefore,reviews the literature in this area. This review is then expanded to review theliterature in the related areas of how to control and use marine debris.
Effects of marine debris
Ingestion.
This section discusses the effects of marine debris on marine life. Themost well-known danger is that of ingestion. For marine life that mistakesmarine plastics for their typical diet, there are two significant dangers ofingestion. Firstly, large items may occlude both respiratory and digestivetracts leading to starvation or asphyxiation. However, the likelihood of thisdanger is low as a majority of marine plastics are small industrial pellets orfragment at sea and so cannot cause such harm at the reduced size (Karlssonet al. (2018), Robards, Piatt and Wohl (1995)). The second danger is, however,more fatal. Once ingested, plastics are digested exceptionally slowly whichcan leach toxic chemicals into the body. However, this effect is uncertain asthere is insufficient evidence thus far to corroborate this suggestion (Azzarelloand Van-Vleet, 1987). Additionally, decade-long surveys by Moser and Lee(1992) and Robards, Piatt and Wohl (1995) both failed to report any adversehealth issues from ingestion. While these two studies only observed seabirds,a wide-ranging survey undertaken by Azzarello and Van-Vleet (1987) reportedthe following conclusion:
6

“Although many of these potential hazards lie in the realm ofconjecture, we believe that it is important to work toward preven-tion or prediction of these problems before the actual effects havebeen realised.” (Azzarello and Van-Vleet, 1987, p. 301)
While the fatality of ingestion is ambiguous, the frequency and volumeof plastics ingested is more certain. Moser and Lee (1992) produced strongevidence for this as they reported on the same population of seabirds in1969-77 and 1978-85, and found that the frequency of ingestion had risen by30% and the volume of plastics ingested had risen 80%. This evidence wasfurther corroborated by Robards, Piatt and Wohl (1995) who also reporteda statistically significant increase in both frequency and volume of ingestedplastics between 1968-77. Additionally, Robards, Piatt and Wohl (1995) noteda significant difference in the likelihood of seabirds ingesting marine plasticsin the Atlantic and the Pacific which implies that the increasing danger ofingesting marine plastics has grown inconsistently across the worlds oceans.Robards, Piatt and Wohl (1995) attributed this increasing but inconsistentdanger of ingestion to an increase in the frequency and volume of marine plasticsin the ocean. Jambeck et al. (2005) noted this growth as being consistentwith the trends in global plastic production. Therefore, the increasing rate ofingestion is clearly linked to the increasing concentration of marine plastics(Lebreton et al., 2018). This implies support for a scheme that would reducethe concentration of marine plastics and therefore reverse the current increasingtrends of ingestion.
Entanglement.
Another danger from marine debris is that of entanglement. Onceentangled, marine life may suffer either strangulation or starvation. Unlikethe dangers from ingestion, these effects have been commonly observed asthe rates of species suffering from entanglement (40%) is notably higher thanthose suffering from ingestion (30%) (Allsopp et al., 2007). While it is unlikelythat a majority of marine plastics will entangle marine life due to fragmentedsize, there are more types of marine debris than plastic. Specifically, discardedfishing gear, or ghost nets, are a common type of marine debris that areresponsible for a majority of marine life suffering entanglement. Ghost netswere initially designed to entangle marine life and continue to do so whendiscarded (Henderson, 2001). They are discarded either accidentally or dumpedafter losing economic value. This loss of economic value suggests that recovering
7

ghost nets cannot be profitable. Therefore it is unlikely that ghost nets wouldbe recovered by the private sector which would have reduced entanglement.However, as previously noted, there is a significant loss to marine life caused byentanglement which suggests recovery of them is warranted. This dichotomybetween damages and viability is explored in greater depth later.
Leaching.
A final notable danger from marine debris on marine life is that of leachingchemicals. Once exposed to a range of factors including weathering, oxidationand UV radiation, marine plastics have been observed to leach chemicals. Thechemicals leached may be part of their design, such as dyes or fire-retardants,or may be adsorbed from the water. In highly concentrated areas of marinedebris, chemicals now banned for their toxicity, such as PCB and DDT (Harse,2011), may still be present and may be adsorbed by new marine debris in thearea. Once adsorbed and then leached, the dangers of reduced water qualityand ingesting marine plastics are exacerbated. Once ingested, the process ofdigestion implies plastics beginning to leach contaminants which are likelyto induce significant health risks. These health risks may be transmittedthrough the food chain. However, with only 30% of species ingesting plastics,this effect is likely to be limited (Allsopp et al., 2007) and even then thereis little supporting evidence for the existence of this effect (Azzarello andVan-Vleet, 1987). Additionally, the dangers from reduced water quality maystill abound although significant health effects of reduced water quality due tomarine pollution have not yet been reported. However, this is tempered bythe observation from Harse (2011) that:
“No fish-monger on earth could sell you a certified-organic wild-caught fish” (Harse, 2011, p. 341)
Therefore, the leaching of plastics in the ocean is a threat to marinelife. However, it is potentially possible to mitigate this threat. It should benoted that while only 15% of marine debris floats, 80% of that is plastic ofwhich 90% is the necessary type to float in water (Sudhakar et al. (2007),Derraik (2002)). Therefore it is fair to suggest that a majority of plasticsfloat. Floating plastics are more easily recovered by mitigation schemes suchas TOC. However, as they float, they are also more exposed to the range ofconditions that degrade them significantly enough to start leaching chemicals.Therefore the scheme is most likely to recover those plastics that are most at
8

risk of or have already begun, leaching chemicals. Furthermore, Sudhakar et al.(2007) noted that plastics might retain a degree of economic value even whensignificantly degraded and therefore it is possible that it may be financiallyas well as economically viable to recover floating plastics (Hammer, Kraakand Parsons, 2012). The implications of this finding from the literature arediscussed more fully later, but for now, a discussion of the dangers of marinedebris on the marine economy is merited.
Damages to economy.
The discussion above has made it eminently clear that there is a rangeof threats from marine debris to marine life. These effects also inflict damageson the marine economy. Specifically, the problems of ingestion, entanglementand leaching effectively reduce fish stocks which therefore reduce the catch andrevenue of the fishing economy (Azzarello and Van-Vleet, 1987). These lossesare so severe that Mouat, Lozano and Bateson (2010) reported that the Scottishfishing fleet lost an estimated 5% of their total annual revenue to marine debris.While the Scottish fishing fleet faces marine debris in the Atlantic Ocean,and the North Sea so is more exposed to these effects, their experience is notatypical with Takehama (1990) reporting damages to the Japanese fishing fleetalso in the millions of dollars. Whether this was comparable to the 5% ofannual revenue figure is unclear, but the finding of significant damages frommarine debris is consistent.
Further dangers to the marine economy were evident from Mouat, Lozanoand Bateson (2010) and McIlgorm, Campbell and Rule (2011) who bothreported that a range of sectors suffered from marine debris including fishing,as discussed above, but also vessels and tourism. Specifically, the most frequentdamage suffered was that on equipment and vessels while the most significantdamage was the estimated losses suffered by the tourism industry. Lost tourismrevenues represent a significant cost to coastal populations despite their limitedexposure to marine debris as only 15% of marine debris washing ashore asbeach debris (Derraik, 2002). Once ashore, beach debris reduces aestheticvalue of an area imposing a cost in lost revenue. The cost was so significantthat just a 25% reduction in beach debris was predicted to yield approximately$30mn in benefits to the local area. While the magnitude of this effect maybe disputed as their results were based on the very popular Orange CountyUSA area, the finding that marine debris reduces tourism is a common one inthe literature (Mouat, Lozano and Bateson, 2010). Therefore it is clear that
9

marine debris imposes significant costs on a range of sectors in the marineeconomy. Specifically, losses to fishing and tourism highlight the significanteconomic impacts of marine debris.
The discussion above has outlined the various adverse effects of marinedebris on both marine life and economy. This implies that it is necessary torecover marine debris to mitigate these damages. The following discussionreviews the literature on plausible methods of mitigating marine debris.
Control of marine debris
Legislation.
Efforts to legislate marine debris have thus far been ineffective in partdue to the challenges of the international nature of marine debris and thelink to economic growth. As economic growth is accompanied by increasedproduction and waste, there is an active link between economic growth andmarine debris which dissuades developing countries from regulation who areloathed to sacrifice economic growth in favour of environmental protection(Jambeck et al., 2005). Furthermore, the challenges of international coopera-tion and enforcement have hampered previous efforts. The effect of this wasthat current legislation has ineffectively focused on the input rather than thestock of marine debris (Amos, 1993). An illustrative example is MARPOLAnnex V, the International Convention for the Prevention of Pollution fromShips, which came into force in 1989 and regulated the dumping of waste fromships at sea. However, the effect of this regulation has not been uniformlyacclaimed in the literature. Henderson (2001) found no statistically significantdifference in entanglement rates from 1987-1996 despite the legislation begin-ning in 1989. Henderson (2001) studied Hawaiian monk seals which reside onHawaiian Islands which are proximate to where TOC will deploy. However,two limitations to their study exist. Firstly, they did not observe any fish,whales, or birds in their study as other entanglement studies have done (Laist,1997). Secondly, they did not cover entanglement rates at sea. This is crucialas the frequency of illegal dumping is higher at sea, and so their sample hada priori limited exposure to entanglements. However, this was a purposivesample selection as the use of an island based sample is instructive both forquantifying the risks to land-based life from marine debris and also as thejustification for the clean up of beaches. However, their finding of no significantdifference in entanglement rates pre and post-legislation is evidence of somesuccess. As entanglement rates have risen sharply, commensurate with the
10

growth in plastic production and marine debris (Jambeck et al., 2005), findingno increased rate of entanglement could suggest that the legislation had somesmall effect as entanglement rates should have risen if there was indeed noeffect (Laist, 1997). Therefore there is insufficient evidence to conclude thatthis legislation had any significant effect on illegal dumping of marine debrisand resultant entanglement rates and losses of marine life.
Beaches.
Beach cleanups, volunteer efforts to recover beach debris, have thus farproved to be the most popular method of recovering marine debris (The OceanCleanup, 2014). Beach debris reduces the aesthetic value of an area, reducingtourism, and reduces the quality of the beach, reducing health (Leggett et al.,2014). The effect on tourism is significant despite beach debris representingonly 15% of total (Derraik, 2002). Therefore, controlling beach debris can becharacterised as an investment in the local economy (Leggett et al., 2014). Thereturn on this investment is significant with Leggett et al. (2014) estimatingthat a 25% reduction in beach debris in Orange County USA would yield a$32.2 million benefit to the local economy. However, the cost of achieving sucha reduction is uncertain. With volunteers, the recovery cost per kilogram ofwaste recovered can be incredibly low which suggests that it may be profitableto run such schemes. Profitability here refers to both the sale of recoveredplastics and in increased or maintained tourist revenues. This suggests anessential difference between financial and economic viability which is exploredfurther later. However, such cleanups are also slow, laborious and require asignificant amount of manpower to make the clean up worthwhile. Therefore,it is unlikely that a labour force sufficient to cover the sheer scale of coastlineaffected may be consistently found unless they are paid which increases thecosts of running the operation. Paid efforts are familiar with local authoritiesin the UK reporting the expenditure of more than $35,000 annually to keepareas clear of beach debris (Mouat, Lozano and Bateson, 2010). However, theefficiency of this method is debatable. Specifically, Leggett et al. (2014) notedthat within three months, there had been a 50% return to the original levelof beach debris which implies repeated expense while the source of debris isunaffected. Furthermore, beach debris represents only 15% of the total stockthus suggesting a limited impact from beach cleanups. Finally, this methodabates damages to tourism more strongly than any other sector, despite othersectors, such as fishing and shipping, also significantly being affected by marinedebris. This suggests that it is not a practical solution to the more significant
11

problem of marine debris.
Drones.
To mitigate the damages of marine debris via recovery of marine plasticsat sea, several proposals have been made. One of the most innovative of thesesuggests using autonomous drones. The drone concept proposes using severalsmall vessels remotely or automatically salvaging marine plastics and thenreturning to a set drop-off location afterwards. The main advantage of thisscheme is flexibility in targeting recovery efforts (The Ocean Cleanup, 2014).Possession of a small fleet of drones allows more heavily concentrated areas orareas of higher risk to be specifically targeted. The possibility of respondingto localised events, such as the millions of tonnes of debris washed out by thetsunami in Japan (Jambeck et al., 2005), also arises. Another considerableadvantage to the drone concept is the notion of autonomy. As drones maybe automatic and solar panel fuelled, they require a low degree of humaninteraction, reducing operating costs. However, several drawbacks persist.Firstly, design and repairs to such a fleet could prove both challenging andcostly if the drones frequently break or overload in the notoriously challengingconditions in the ocean such as strong currents and highly concentrated areasof marine debris. Furthermore, each drone would have to recover a certainamount of plastic per operation for it to be profitable and therefore a tensionarises between the operational limits of remote control, the battery capacity,and the profitable level of operation. These criticisms are also compoundedby considerable uncertainty regarding the questions of how large should eachdrone be, how should each drone capture only marine plastics and where andhow would each drone return to after cleaning an area. So despite the futuristicnature of this suggestion, it is fraught with challenges (The Ocean Cleanup,2014).
12
Vessels.
Discarding the drone concept as insufficiently specified leaves two furthernoteworthy options. Either large manned vessels or use of passive systems.The former has been labelled as fishing for litter (KIMO, 2014). Operated inthe North Sea by KIMO, this scheme pays fisherman for marine debris theyrecover as part of their regular fishing activities (KIMO, 2014). Indeed, with86% of fishing vessels reporting marine debris contaminated bycatch (Mouat,Lozano and Bateson, 2010), this is likely to be a popular scheme in the fishingindustry. Indeed the preliminary trial evidence is also supportive of the scheme,although this was found only on a small-scale trial which had governmentalsupport (KIMO, 2014). Governmental support for this scheme is warranted bythe fact that it has shown, thus far, that it is effective at recovering all kindsof marine debris, including the low financial but high economic value ghostnets. These may not always be plastic or have resale value, and so revenuesfrom them are likely to be inefficiently low. Additionally, with average costsof just under $2.54 per kilo of waste collected (The Ocean Cleanup (2014),KIMO (2014)), inefficiently low revenues for the scheme predicate the schemebeing financially infeasible. However, the high damages suffered from marinelife becoming entangled in ghost nets suggests that recovering them maybe at least economically viable if not financially (Azzarello and Van-Vleet,1987). To adapt to this duality, there is some suggestion that governmentscould support the scheme by hypothecating some new revenue stream towardsfunding such a scheme. A new revenue stream could hypothetically be frommarket-based instruments for control of marine plastics which would be anexample of environmentally proactive policy (Dikgang, 2012). While this istheoretically possible, a more likely degree of government support would beaiding the scheme in managing recovered marine debris. Specifically, existingwaste management infrastructure, particularly waste-to-energy plants (DEFRA,2014), could theoretically accept marine debris as well as municipal waste.This would provide a specific, consistent use for recovered marine debris.
It is, however, uncertain whether this scheme is viable. Specifically, threesevere disadvantages persist for the scheme. Firstly, recovery of plastics ismuch more challenging for regular fishing activities given that a majority ofplastics, 70% (Derraik, 2002), sink and are therefore irrecoverable (Derraik,2002). Secondly, fish has an established market while recovered marine debrisdoes not which is a disincentive to fishing for them. Even among the uses for
13

recovered plastics, there is also a high degree of uncertainty regarding theirmarket value due to the effect of degradation at sea reducing their suitabilityfor a range of economic uses (Sudhakar et al., 2007). Thirdly, calculations byKIMO (2014) reveal that the total catch of all the fishing for litter trials istoo low to have any significant impact on the amounts of marine debris inthe ocean. Therefore, the fishing for litter scheme does have some merit asbeing economically viable although it is too small a scale and too costly tobe financially viable. The small-scale relegates its applicability to the broaderproblem of marine debris. This finding leaves one viable option for clean up,the design of a passive system which may passively recover marine plastics.
The Ocean Cleanup.
The TOC scheme is one such passive system which is the focus of thisresearch. The TOC project suggests the construction, essentially, of a large-scale boom which passively sits in an area of highly concentrated marine debris.Once there, floating plastics are forced to converge to a single point where theyare then recovered and stored. Infrequently, a manned ship would recover thestored debris and transport it to land for marketing. Predictably, the mainchallenges to this scheme are in the technical design of such a boom. Assumingthis can be surmounted, indeed reports consequent to the feasibility studysuggest that this is a valid assumption (The Ocean Cleanup, 2014), then thescheme’s central costs would be the transportation of recovered waste from theboom to a land-based site. This suggests that TOC could operate at muchlower cost and much larger scale than the previously discussed alternatives.
However, there are some notable disadvantages. Firstly, TOC proposedonly recovering floating plastics which restricts the recovery efforts to the 15%of marine debris that floats (Derraik, 2002). While this ignores the 70% ofmarine debris that sinks, it is likely a profitable move as the higher valueplastics are those that typically float (The Ocean Cleanup, 2014). Therefore,a drawback to the scheme is that it will have a limited effect on the 70% ofmarine debris that sinks which implies that the scheme will have a limitedeffect in mitigating the economic impacts of marine debris (Derraik, 2002).However, this is addressed by stating that floating plastics are those most likelyto be ingested as they are easier to see for marine life when at the surface, andalso most likely to leach chemicals as there are stronger degradation factors onthe surface (Azzarello and Van-Vleet (1987), Harse (2011)). This suggests thatwhile only 15% of debris may be recovered, this represents the most dangerous
14

proportion of marine debris. It should also be noted that 15% of marine debristhat may be recovered by TOC may not necessarily be plastics. This impliesthat some method of sorting is required as recovered plastics must be examinedfor their suitability for the market. Specifically, pyrolysis and recycling requirelow levels of degradation while waste-to-energy and landfill have much lowerrequirements (Sudhakar et al., 2007). Furthermore, contaminants and by-catchmust further be eradicated from recovered marine debris to ensure maximumyield and profit from the recovery of marine debris. Such checks on recoveredmarine debris increase the costs of the scheme. Given these costs and theuncertain costs of the necessary research and design for the scheme, the costof recovery is likely to be significant using TOC which casts doubt on theprofitability of recovering marine plastics.
Types of marine debris
With regards to the profitability of recovering marine plastics, it isinstructive to explore the types of marine debris that might be recovered.Within the 60-80% of marine debris that is estimated to be plastic (Derraik,2002), three categories of plastics emerge; floating and recyclable, floating andunrecyclable, and sinking. While only 15% of marine debris floats (Robards,Piatt and Wohl, 1995), this category is comprised of the most commonlyproduced plastics, Polyethylene (‘PE’), polypropylene (‘PP’) and polystyrene(‘PS’). With regards to the frequency of these plastics, sample evidence suggeststhat 90% of marine plastics are polyethylene (‘PE’), distantly followed bypolypropylene (‘PP’) (Karlsson et al., 2018). The source of these plastics areboth industrial, with Karlsson et al. (2018) noting that billions of PE pelletsmight be found in industrial effluent, and commercial, with Kothari, Tyagiand Pathak (2010), noting that all three types are commonly used for goodspackaging. Regardless of the source, once these plastics enter the ocean, theyfloat and thus pose a threat to seabirds and fish via ingestion. However, as theyfloat, this threat may be more easily mitigated as floating plastics are moreaccessible to observe and recover. Recovery of these plastics is essential as PE,PP and PS are all suitable for recycling alongside pyrolysis and waste-to-energyuses which suggests a degree of profitability to their recovery (Psomopoulos,Bourka and Themelis, 2009). This further implies that management of thesemay be integrated easily into existing waste management infrastructure. Thisis discussed in greater detail later, but for now, it suffices to note that theseplastics are the most common, the most valuable, and the most recoverable.
15
The second category of marine plastics is predominantly polyvinyl chlo-ride (‘PVC’, often used in construction). PVC floats in water similarly to PEalthough has lower financial value. Specifically, The Ocean Cleanup (2014)reports that there are limitations to PVC’s viability for pyrolysis and thelow number of times it may be recycled. This implies that it has a lowerfinancial value than the first group. This lower financial value is compoundedby the need to ascertain the value of recovered PVC which would require someform of screening which adds to the cost of recovery (The Ocean Cleanup,2014). This higher cost and lower value compared to the first group impliesreduced financial viability to its recovery. However, this distinction is notpractical as with both PE and PVC floating it is not feasible to recover onlythe valuable PE at the expense of the dubiously valued PVC. Additionally, asPVC has been observed to leach chemicals more quickly than other plastics,there is added impetus to its recovery (Sudhakar et al., 2007). The degradationimplies reduced financial value to its recovery although the increased damagesthreatened by degraded plastics imply an increased economic necessity of itsrecovery. Indeed this dichotomy between financial and economic viability is acritical theme in this research. To summarise, PVC is less financially viable torecover but is more economically viable (The Ocean Cleanup, 2014).
Finally, a third group of marine plastics exist which mainly includesPolyurethane (‘PU’). PU sinks in water and cannot be used for either pyrolysisor recycling. The lack of commercial use for PU implies little to no financialvalue. This low value has the effect of disincentivising the necessary develop-ments required for the scheme to be able to recover sunk plastics given thedepth of the Pacific (The Ocean Cleanup, 2014). Finally, it should be notedthat while sunk plastics are less exposed to degradation, they are more likelyto inflict damages on lower level marine life, so it is at least, somewhat econom-ically sensible to recover such plastics. In conclusion, sunk plastics, while rare,are unlikely to be recovered due to low cost and technical limitations. Thisconcludes the discussion of marine plastic types although it is now necessaryto discuss the proportion of marine debris which comes not from plastics butghost nets.
A sizeable proportion of marine debris is not, however, plastic as detailedabove, but discarded fishing gear, referred to previously as ghost nets (Hammer,Kraak and Parsons, 2012). The discussion on legislation of marine debris hasalready discussed how ghost nets are dumped at sea due to low economic value
16

(Henderson, 2001). Once they have lost value, fishing vessels, in particular,may dump or lose ghost nets, which represents an abundant source of marinedebris (Marsden Jacob, 2009a). Indeed the volume of ghost nets in the oceanhas increased recently with a growth in the fishing industry (Amos (1993),Johnson (1994)). The impacts of ghost nets on the marine economy are toentangle all manner of marine life which devastates fish stocks. Fish in highlyconcentrated areas of marine debris are effectively being fished by ghost netswithout any fishing activity occurring. These dangers are exacerbated byghost nets transporting invasive or dangerous species across layers of the watercolumn (Derraik, 2002). However, this has not yet been observed on a largescale (Azzarello and Van-Vleet, 1987). Finally, these dangers are compoundedby the estimated 50-year lifespan of ghost nets and the lack of incentive torecover these nets. This is because as the material degrades the nets arenot worth keeping for vessels which then dump them at sea. Therefore it isunlikely that any financial value may be realised from recovering ghost nets,implying that cleanup efforts are unlikely to address this issue (Marsden Jacob(2009a), Hammer, Kraak and Parsons (2012), Henderson (2001), Azzarello andVan-Vleet (1987)).
This review has so far explored a range of impacts from marine debris, arange of mitigating options and the range of debris to be found. What remainsto be discussed is the range of uses for recovered marine debris once recovered.
Uses for marine debris
Pyrolysis.
The first main use for marine debris is pyrolysis, the process of turningplastics into oils. Pyrolysis transforms recovered plastics into crude oil for use,sale or refinement. The decision to use, sell or refine the oil is dependent on thecomparison of refinement costs to oil prices. Oil prices are notoriously volatilehowever which introduces a significant degree of uncertainty for this. Furtheruncertainty arises about the viability of using pyrolysis for marine debris as notall types and quality of marine debris are suitable for pyrolysis. While the mostcommon PE, PP and PS types are usually acceptable, this is provided that theynot be significantly degraded, else they must be discarded introducing a loss(Sudhakar et al., 2007). Furthermore, the more infrequently recovered PVC isnot typically accepted for pyrolysis nor is non-plastic marine debris such asghost nets, which physically cannot be used for pyrolysis but are responsiblefor the majority of losses of marine life to entanglement, (The Ocean Cleanup,
17

2014). This illustrates that pyrolysis is only a valid option for plastics andnot other types of marine debris which would else have to be landfilled andtherefore this is a less efficient use for recovered debris. Furthermore, theserestrictions reduce the effective yield from recovery which reduces estimatedprofits (Fivga and Dimitriou, 2018). Another factor that reduces profits is ascarcity of such plants. As pyrolysis can only be used for plastics, there are fewpyrolysis plants available, and therefore there is limited scope for integratingmarine debris management with existing waste management infrastructure(Psomopoulos, Bourka and Themelis, 2009). This scarcity of plants may alsoincrease the costs of recovery if debris requires transportation to more efficientplants and more profitable markets. To conclude, there is a significant degreeof uncertainty regarding the viability of using pyrolysis for recovered marinedebris.
Waste-To-Energy.
A similar but less restrictive option to pyrolysis is called Waste-To-Energy(WTE) which proposes that recovered plastics be incinerated to generate elec-tricity for use and sale. WTE is preferred to pyrolysis as a higher amount ofrecovered marine debris could be used in a WTE plant than a comparable py-rolysis plant. This is because the pyrolysis equivalent may only use sufficientlynon-degraded plastics whereas WTE may accept nearly all types of waste(DEFRA, 2014). Furthermore, as WTE plants are currently integrated intothe waste management infrastructure, the addition of marine debris to theseplants would appear to be of negligible difficulty. Such integration is favouredby decision-makers who are spared the expense of constructing new plants.Existing WTE plants also confer power generation from waste with is furtherattractive to policymakers. Precisely, once marine debris management is assim-ilated with existing infrastructure, it represents a greener source of local powergeneration once integrated into the existing system. While this is an attractiveoption as there are fewer restrictions on what debris is accepted and marinedebris may be easily integrated into existing infrastructure, several issues withits viability arise. Firstly, transport costs would be higher than other optionsas very few WTE plants currently exist (Kothari, Tyagi and Pathak, 2010),especially when compared to the more common recycling plants (DEFRA,2014). Secondly, the volatile price of electricity is a significant concern for theviability of using WTE. As the electricity price is strongly related to a rangeof factors including spare capacity on the grid, and the localised demand atdifferent times of the day (Psomopoulos, Bourka and Themelis, 2009), there is
18

uncertainty about whether there will be a consistent price level. Thirdly, thecombustion of marine debris could lead to emissions of noxious gases. Policymakers have feared that these would have reduced health in areas proximateto WTE plants and firms have feared that these would have an associatedemissions trading cost (Kothari, Tyagi and Pathak, 2010). These factors havefurther led to a scarcity of WTE plants. However, these fears are unfoundedas evidence suggests that WTE emissions are 60% lower than using fossil fuels.Specifically, converting one tonne of municipal waste into electricity, generatingapproximately 600 kilowatt hours (KwH), is cleaner than generating the sameamount of electricity using a barrel of oil. For relevance to this research,municipal waste is assumed to be consistent with marine debris (Lebretonet al. (2018), Psomopoulos, Bourka and Themelis (2009)). Therefore, theemissions problem, while having been a major issue against the constructionof more WTE plants (DEFRA, 2014), is of low concern. Finally, an argumentagainst the introduction of marine debris to WTE plants is the infrequentcollection of marine debris from passive system The Ocean Cleanup (2014)scheme which suggests WTE plants inefficiently sitting idle. Therefore, whilea clean generation of power and integration with existing infrastructure areadvantages of using WTE, the low and volatile electricity price is a significantfactor in suggesting that WTE not be currently a financially viable plan forthe use of recovered marine debris from TOC.
Recycling.
Recycling is an attractive option for recovered marine plastics as itimproves the lifespan of plastics and therefore is an efficient use of existingresources. Notably, manufacturers may prefer to use recycled plastics in theirprocesses to reduce effluent which implies that recycling is an environmentallyfriendly option (Bohm et al., 2010). However, a range of factors indicatesthat recycling is not a financially viable use for plastics. Firstly, recyclinglike pyrolysis only applies to plastics which reduces the effective yield andintroduces a cost in sorting debris. Indeed, WRAP (2012) reported significantcosts in sorting, preparing and preprocessing debris before it is recycled whicheffectively reduces the profitability of recycling. The profitability of recycling isalso hindered by the fact that the pricing of recycled plastics varies significantlywith type and condition (Psomopoulos, Bourka and Themelis, 2009). Thecondition of recycled plastics is critical as the effect of degradation of marineplastics is to reduce the number of times they may be recycled and their yieldfrom recycling (Bohm et al., 2010). However, in a sample of marine plastics, the
19

observed level of degradation was not sufficient enough to eliminate recyclingof those plastics, implying that this problem is limited (Lebreton et al., 2018).While the degraded quality of plastics was observed, they did not appear tobe severe enough to reduce usability. However, for marine plastics that arenot collected and remain marine debris for extended amounts of time, thenthere is a higher probability that such degradation effects reduce the usabilityand thus the financial viability of collecting such plastics.
A discussion of recycling is incomplete without addressing the interestingdifference between recycling plastics for sale to manufacturers and recyclingplastics into products for sale to consumers. Wholesale to manufacturers isan attractive prospect as TOC would only have to sell recovered plastics to arecycling plant and then the costs of converting, marketing and transportingthe final plastics are owned by the plant. In essence, this option is far simplerand reduces the workload and uncertainty associated with the design andmarketing of products (WRAP, 2012). However, if TOC wishes to earn higherrevenues, then it may brave the more uncertain consumer market and createproducts from recycled marine debris (WRAP, 2009). This avenue requiresthat the products be priced at a profitable level. Specifically, it requires thepublic degree of support for environmentally friendly causes be sufficientlystrong as to inflate the prices to a level whereby the high costs of recoveringplastic from the ocean are met. There is some, albeit weakly related, supportingevidence for this in Dikgang (2012) who reported increased willingness to payin consumers for environmentally friendly products. While the likely costsand prices for each scenario are discussed more fully in the results section;it is possible to note here that recycling is not likely to be a profitable usefor recovered marine plastics unless consumers pay a considerable premium(Bohm et al., 2010).
This section has reviewed the literature on marine debris in four mainsections the effects, control, types and uses of marine debris. Starting withthe review of the effects of marine debris, this section revealed some ambiguityabout the fatality of the effects of marine debris on marine life. This contrastedwith the unambiguous damages suffered by different sectors of the marineeconomy, notably including fishing and tourism (Mouat, Lozano and Bateson,2010). Given these damages, this review then examined the potential means ofcontrolling marine debris. This section concluded by suggesting that the amongthe suitable designs, TOC stands out as low operating cost and high capacity
20

(The Ocean Cleanup, 2014) and is thus the most appropriate choice of schemefor further examination. However, this finding was conditional on the types anduses of marine debris recovered by TOC. The types of marine debris were mainlydiscussed with regards to the 60-80% that is believed to be plastic (Derraik,2002). However, the significant non-plastic proportion, mainly, discarded fishinggear, was also discussed. This section raised the notion of a duality between thefinancial viability of recovering valuable plastics, and the economic viability ofrecovering debris that inflicts significant damages to marine life and economy.This duality was further evidenced by the final section which discussed theuses for recovered marine debris. Only WTE plants could make use of all typesand conditions of recovered marine debris although this was associated withvolatile electricity prices and a scarcity of plants. This scarcity was similarfor pyrolysis plants which are very restrictive in what debris they will acceptalthough their resultant oil is undoubtedly a valuable use for the recovereddebris. Another potentially valuable use for recovered marine debris would berecycling although this applies only to plastics. Recycling suggests that marinedebris may be integrated into existing waste-management infrastructure whichreduces costs to TOC. However, recycling poses a challenging choice betweenselling recycled plastics wholesale or commercially (WRAP, 2012) althoughit is not clear whether either is profitable. Indeed, the financial and indeedeconomic viability of recovering and marketing recovered debris using TOC isuncertain and therefore the following section discusses the design of a suitablemethodology to assess this.
21

Table 1: Summary of literature review:
This table summarises the impacts and uses of marine debris as described in the literature.Seminal sources include: Mouat, Lozano and Bateson (2010), Leggett et al. (2014), DEFRA(2014), Psomopoulos, Bourka and Themelis (2009), Fivga and Dimitriou (2018), Kothari,Tyagi and Pathak (2010), McIlgorm, Campbell and Rule (2011).
Impact Description FrequencyEnvironmental
Ingestion Marine life may ingest floating plastics mistaken for typical diet 30% of marine lifeEntanglement Marine life may become entangled in discarded fishing gear 40% of marine life
Leaching Leaching of toxic contaminants when plastics degrade UnknownTransportation Invasive species could be transported by floating debris Unknown
EconomicLost fish stock The above impacts all reduce fish stock 86% of fishing vessels suffered reduced catch
Reduced tourism Washed ashore debris deters tourists Magnitude varies by location although consistently significantDamaged vessels One incident per vessel per year on average Rescue costs in the UK ranged from $1.07-2.71mn annually
Loss of non-use value Loss of debris free areas Value varies with area and valuation methodReduced water quality Leaching of chemicals and concentrations of marine debris Not currently assessed
Costs of clean upsRecovery of marine debris at sea by TOC
Recovery of beach debris onshore
TOC: $0.97-5.03 per kgFishing for litter: $2.24 per kg
Beach cleanups: $50,710 annual average
Cost to installations Damaged equipment at harbours and ports e8,000 per harbour per year in UKUse
PyrolysisThe oil may be further refined, sold or used
Transformation of plastics to crude oilPrices range from $ 0.42-0.98 per kgCost between $0.039-1.14 per kg
Waste-To-Energyfor generating electricityCombustion of all debris
One tonne of debris generates $0.102 worth of electricityCosts not stated.
RecyclingB2C: Pay PRF for recycling then sell final product
B2B: Sell to PRFB2C: $0.09 profit per kgB2B: $0.21 profit per kg
22
Methodology
The review of the literature suggested a dichotomy between the financialand economic viability of recovering marine debris. The following sectiondiscusses plausible methods of assessing both the financial and economicviability of TOC. To do this, a cost-benefit analysis was undertaken, and thedata for this was assessed using value-transfer.
CBA.
This section evaluates the merit to using CBA for this research. Todefine, CBA is a technique used to assess the economic efficiency of a proposal.Economic efficiency implies that the benefits of operating a proposed schemeexceed the costs. Benefits and costs may, however, be defined in two ways,financial and economic. Financial costs and benefits refer merely to theprivate expenses and revenues of a proposal. Economic costs and benefits,however, refer more widely to the social costs and benefits, i.e. the impactson society of a proposal. Specifically, economic costs and benefits includewelfare issues, non-use and aesthetic values and health impacts among otheritems which are not included in the purely financial costs and benefits (Vatnand Bromley, 1994). This apparent difference between the two notions ofeconomic efficiency was addressed in this research by assessing both thefinancial and economic viability of TOC. Assessing both was advantageousas the policy implications from each notion of viability are wide-ranging. Forinstance, a finding of financial viability could precipitate new private sectorinvolvement in pollution abatement. Alternatively, a finding of economicviability would suggest a different funding source such as governmental, charityor crowdfunding. Therefore, this research assessed both financial and economicviability. Indeed there are an array of similar examples in the literature,especially in the area of environmental economics (Costanza, 2007). However,the validity of assessing both types of viability is not without controversy.
While determining the viability of a scheme by comparing all the possiblecosts and benefits is theoretically sensible, it is a technique not without itsdeficiencies. One of the most notable opponents of the method, Ackerman andHeinzerling (2002), refined their critique into the pithy summation:
23
“Cost-benefit analysis cannot overcome its fatal flaw: it is com-pletely reliant on the impossible attempt to price the priceless valuesof life, health, nature, and the future” (Ackerman and Heinzerling,2002, p. 1533).
This criticism has three critical elements, pricing the priceless, valuinglife and welfare, and valuing the future. Firstly, pricing the priceless refers tothe potentially erroneous comparison of market and non-market values. Whilemarket values are both spatially and temporally sensitive and therefore arevolatile, they are also readily accessible which is analytically convenient. Thisconvenience contrasts with non-market values which also vary strongly withtime and location, but also with participant, elicitation method and object.Given this greater variability in non-market values, it is not surprising thatcomparison of non-market values with market ones is a notable criticism fromAckerman, Heinzerling and Massey (2005). Indeed, this issue of valuing non-market items is one that consistently surfaces in the related literature (Vatnand Bromley, 1994). This was corroborated by Ackerman and Heinzerling(2002) who noted that the various methods of eliciting non-market values do notproduce estimates that are sufficiently accurate as to be included in a CBA andstill be regarded as valid. This perceived inaccuracy stems from the problemsof valuing items in a survey or experiment as opposed to market values, aneffect referred to as hypothetical bias (Johnston et al., 2015). This critiquewas mitigated in this research by implementing adjusted unit value-transfer toensure the accuracy of the final estimates, rather than relying on potentiallyquestionable methods used in the original studies.
The second critique from Ackerman and Heinzerling (2002) was to disputethe focus on utility maximisation in CBA decision rules. Whereas maximisingexpected utility and using a utilitarian decision rule, the greatest good forthe greatest number, is analytically convenient, it fails to incorporate anysense of equity and morality. Instead, Ackerman, Heinzerling and Massey(2005) suggested that incorporating distributional or welfare impacts wouldbe an improvement. These impacts have high importance in environmentaleconomics as natural resources have benefits for wider society yet may still beexploited if only private costs are considered. An example of such an erroneousfinding, suggested by Ackerman and Heinzerling (2002), was the study whichfound that the government should promote smoking as it was a cost-effectiveway to reduce health expenditure. This finding failed to consider any welfare
24

issues accompanying the value of life and health, and thus the valuationswere too low leading to an erroneous judgement. Therefore, Ackerman andHeinzerling (2002) argued that CBA could not be a valid method if it failedto adequately consider impacts on society. This critique is compounded bythe difficulties in estimating welfare impacts as evaluation of these non-marketnotions is also the basis of the very first critique Ackerman and Heinzerling(2002) made. To address this quandary, this research aimed to incorporate theimpacts of marine debris wherever possible in the CBA. However, as originaldata could not be collected, previous estimates for each of the effects had tobe relied upon to satisfy this critique which implies a degree of inaccuracy invaluing welfare impacts of marine debris in this research.
Finally, Ackerman and Heinzerling (2002) critiqued the valuing of thefuture via the use of Net Present Value (NPV). Net Present Value (NPV) is atechnique which discounts and then aggregates all the values throughout thelifetime of a scheme to allow them to be comparable with present values. Presentvalues cannot correctly be compared with future values for two reasons. Firstly,there is increased uncertainty about long-running schemes which requires futurevalues to be higher to account for this uncertainty. Secondly, agents are stronglypresently biased and thus weight present values more highly compared to futureones (Frederick, Loewenstein and O’donoghue, 2002). The solution to thesetwo issues is to compare present values with NPV where NPV is calculated bydiscounting all the costs and benefits in the lifespan of a project (Costanza,2007). In this context, discount rates refer to how strongly immediate valuesare preferred to future ones. Specifically, a higher discount rate implies thatfuture values must be much larger than present values for agents to disregardtheir present bias and prefer future values. Correspondingly, lower discountingimplies a greater willingness to wait for delayed values (Zhuang et al., 2007).Given the differences that magnitudes of discounting make, the correct choiceof discount rate in this research is crucial. Using too low a discount rate wascriticised by (Ackerman, Heinzerling and Massey, 2005, 1533) as “improperlytrivialising the future”. This research avoided trivialising the future withinappropriate discounting by consulting the literature for appropriate choice ofdiscount rates. However, this was complicated by selecting different discountrates for the financial and economic effects. This research opted to use alower discount rate for the economic impacts of 3.5% compared to the 5% forthe financial impacts. The 3.5% discount rate for the economic impacts wasselected Zhuang et al. (2007) explicitly suggesting that a lower discount rate
25

should be chosen for economic impacts than financial ones. An explanationfor this is that economic impacts have a longer duration than financial onesas they may accrue more slowly and thus must be discounted at a lower rate,and thus 3.5% appears to be a sensible choice (Costanza (2007), Zhuang et al.(2007)).
Moving to the discounting of the financial values, this choice of discountrate had to be both higher than that used for economic impacts and had to bejustified in the literature. 5% was chosen for the financial impacts to representbank lending rates for the representative period and sum. Indeed, many bankswere observed to be charging loans at ∼ 4% margin over the central bank rateswhich would imply support for a figure in the 4-5% range. Further justificationfor the selection of 5% was that in their review, Zhuang et al. (2007) reportedthat discount rates between 2-8% had been commonly used. More specifically,Costanza (2007) corroborated this by using a 5% discount rate alongside a3% discount rate in their discounting of marine benefits. So while the specificdiscount rates are justified, further criticism of using discounting is assuminga constant discount rate across time rather than accounting for diminishingpreferences over time. As time periods pass, present bias weakens, so agentsare more willing to wait for delayed values. Thus discount rates have oftenbeen observed to not be linear in time, such as the constant use of 3.5% foreach of the ten years, but instead, either exponential or hyperbolic whichwould imply a diminishing discount rate for each additional year of the scheme(Frederick, Loewenstein and O’donoghue, 2002). However, as TOC is relativelyshort run, ten years compared to 30-50+ of some projects (Costanza, 2007),the strength of diminishing discounting is not likely to be a strong one and thusa constant discount rate is a valid assumption to make for this research. Tosummarise, the financial impacts of TOC were discounted at 5% annually andthe economic impacts at 3.5% annually to reflect present bias and differencesbetween economic and financial impacts.
The above section concluded that it is valid to use CBA in this researchprovided that appropriate measures be taken to ensure the validity of theestimates used. This section discusses how appropriate steps were taken toensure the validity of the estimates. To assess the financial viability wasrelatively straightforward. Firstly, data on the anticipated expenses of thescheme are sought. These were readily available from The Ocean Cleanup (2014)although required adjustment for accuracy. Following this, it was necessary to
26

find data on the anticipated revenues of the scheme. Yields and costs wereavailable from the literature and prices were available from the market, and thefull range of sources allowed a weighted average to be estimated thus increasingthe accuracy of the estimates (Fivga and Dimitriou (2018), DEFRA (2014),Bohm et al. (2010), 2WG (2018), WRAP (2018)). Finally, the estimates werethen compared in NPV terms to incorporate suitable discounting.
The above section has endorsed the use of CBA. The following sectiondiscusses the measures used to gather data for use in this CBA. As primarydata was unavailable, this research followed the examples of Costanza (2007),Johnson (1994) and Brouwer and Spaninks (1999), in gathering all previousrelevant estimates of the impacts of marine debris in a meta-analysis. However,this meta-analysis suffered from small sample size due to a scarcity of literature.Therefore, the purpose of the meta-analysis was to identify estimates thatmay be suitable for value-transfer. Indeed, Brouwer et al. (1999) suggestedthat combining a meta-analysis with an appropriate form of value transfer is a‘second-best’ approach when compared to collecting primary data valuations.However, without primary data available, meta-analysis combined with value-transfer was chosen as a method to estimate values for use in the CBA.
Meta-analysis.
Meta-analysis collates prior estimates to synthesise new ones. Typically,this would require including a large number of studies in a meta-analysis toimprove the accuracy of the final estimates by addressing shortcomings in eachstudy. However, this research is in a novel area with a scarcity of literature, sohere the best-practice use of meta-analysis was not to synthesise estimates butto indicate seminal studies for value-transfer (Costanza, 2007). Therefore, themeta-analysis in this research was limited to a small sample size which implieda high degree of reliance on fewer estimates, as opposed to taking advantage ofseveral independent estimates as in a typical meta-analysis. To compensate forthis low sample size, this research adhered to Brouwer et al. (1999) guidelinesfor the best practice of conducting a meta-analysis. Specifically, Brouweret al. (1999) suggested that to ensure accuracy, meta-analysis can, and in thisresearch should be combined with value transfer, the process of translatingprevious estimates into being relevant to a new scenario (Costanza, 2007). Thevalidity and use of value-transfer is discussed next, although here it suffices tonote that the purpose of meta-analysis in this research was to identify studies
27

for suitable for value-transfer, rather than for synthesising all the estimates astypically used (Brouwer and Spaninks, 1999).
Value-transfer.
Value-transfer is a core part of this research as it allows values to beestimated for use in the CBA despite an absence of data on social and welfareimpacts, unavailability of primary data, and the age of the original estimates.For reference, value-transfer in this context may be defined as:
“Transposing monetary, environmental values estimated at onesite (study site) through economic valuation techniques to another(policy site)” (Brouwer and Spaninks, 1999).
Value-transfer may be undertaken using a variety of techniques althoughthis research mainly focussed on the technique of adjusted unit value-transfer.Adjusted unit value-transfer refers to adjusting the units in a method so thatthe transposing of estimates from one policy site to another is reflective ofdifferences and changes in the original and new study sites (Brouwer et al.,1999). The original policy site was the Asia-Pacific (APEC) region in 2008where annual losses were estimated at $1.25bn using McIlgorm, Campbell andRule (2011) method. To transpose these estimates into being relevant to theAPEC region, 2018 requires adjusting McIlgorm, Campbell and Rule (2011)method to reflect the increased size and activity of the marine economy since2008 (Hammer, Kraak and Parsons, 2012) and also to reflect the increasedfrequency and value of marine debris in the APEC region since 2008 (Jambecket al., 2005). Therefore, the adjustments in this research were upwards revisionsof McIlgorm, Campbell and Rule (2011) method to reflect the likelihood ofhigher damages. Moreover, upwards revisions of the economic impacts onthe marine economy are advisable as a means to incorporating the absenceof valuations regarding the social and broader economic impacts of marinedebris. Therefore to mitigate their absence, an upwards adjustment of the unitsimproves the accuracy of the estimates used in the CBA. While the specificadjustments made are detailed in the results section, the following discussionexamines the validity of using adjusted unit value-transfer to estimate valuesfor use in a CBA.
Value transfer is a convenient although contentious method. Value-transfer was hailed in Costanza (2007) as a convenient and cost-effective
28

method of value elicitation where a primary data collection, which is typicallyregarded as the ‘first-best’ solution (Brouwer and Spaninks, 1999), is notpossible. Indeed, this technique has support as several previous empiricalestimates in the field of environmental valuation have combined meta-analysisand value-transfer to estimate values for use in a CBA (Brouwer et al., 1999).However, despite the popularity of the method, Brouwer et al. (1999) noted aseries of criticisms. In particular, they cast doubt on the validity of estimatesfrom value-transfer as efforts to validate generated estimates have thus farfailed. This doubt may be further exacerbated where value-transfer is appliedto elicited non-market values. As discussed above, non-market values arevulnerable to criticism, notably by Ackerman, Heinzerling and Massey (2005),as the requisite methods of elicitation are prone to hypothetical bias (Johnstonet al., 2015) which implies that the final values to be adjusted are inaccurateeven before the inaccurate process of value transfer. This potential transfererror is cause to doubt the validity of value transferred estimates.
Another critique of value-transfer regards the assertion that if the origi-nal and new sites are not sufficiently homogeneous then the applicable value-transfer method should be adjusted unit otherwise transfer errors and inaccu-rate estimates arise (Brouwer and Spaninks, 1999). In this research, adjustedunit value transfer was used as there are considerable differences in the APECregions 2008 and 2018 (Jambeck et al., 2005). Adjusting previous estimatesappears to be a crude manipulation of original estimates into being relevant tocurrent estimates, and this problem is further compounded by lack of guid-ance in how to adjusted units. Thus, it may often appear that adjustmentsare arbitrarily decided. Indeed, this is why many researchers have favouredmore complex value-transfer methods, such as benefit-transfer. However, thisresearch is constrained by a severe scarcity of previous literature which necessi-tates reliance on McIlgorm, Campbell and Rule (2011) method for estimatingthe damages of marine debris and this was particularly amenable to adjustedunit value-transfer rather than more complex methods. To address the critiqueof arbitrary adjustments, this research endeavoured to justify each adjustmentmade to McIlgorm, Campbell and Rule (2011) method. Furthermore, asMcIlgorm, Campbell and Rule (2011) only estimated the financial impacts ofmarine debris on the marine economy and not the broader social impacts, anyadjustment errors in this research are still likely underestimates of the actualsocial, i.e. economic, impacts of marine debris. Therefore, while debatable, thisresearch implements adjusted unit value-transfer as a practical and justifiable
29

method of generating estimates.
As a final aside regarding the accuracy of the estimates used in the CBA,this research applied sensitivity analysis to the estimation process whereverpossible. This is particularly evident in the results section where rangesof expenses, revenues, costs and benefits are produced rather than singularestimates. The purpose of this, notably in the financial analysis, was toincrease the margins of error in the estimates. As this research relied onvalue-transfer of a single study, it is instructive to consider all possible methodsof increasing accuracy in the conclusions which here implies a need for thissensitivity analysis. The effect of this sensitivity analysis was to add strengthto the findings of financial infeasibility and economic viability, given that theseconclusions are shown to be robust even to severe deviations.
Summary.
To summarise the method adopted in this research, a cost-benefit analysiswas used to assess the financial and economic viability of TOC. To estimatevalues for use in these two CBA’s, a meta-analysis was used to identify whichstudies are most amenable to value-transfer. Indeed, the use of value-transferwas a vital determinant of the validity of the estimates used in the CBA.Specifically, adjusted unit value transfer was used to compensate for theunavailability of primary data and the small sample size for the meta-analysis.Whilst the specific adjustments and their rationale is discussed later, it sufficesto note that the accuracy of the method for eliciting estimates for this the twoCBA’s, one on the financial viability or profitability of TOC, and an expandedversion which determined the economic feasibility of the scheme, was bolsteredby use of adjusted unit value-transfer. This use of adjusted unit value transferallows the valuations used in the expanded CBA to be more reflective of thefull damages of marine debris in the modern APEC region. The followingsection discusses the results from this methodology at length.
30

Results
The following section calculates and analyses the financial and economicviability of TOC. Firstly, the potential profitability of the scheme is exploredbefore the analysis is expanded to incorporate the full economic impacts of thescheme. From this, the scheme is shown to be economically but not financiallyviable.
Financial viability
Costs
This section examines the expenses and revenues involved with operatingTOC. The expenses, predicted from The Ocean Cleanup (2014), were subjectto adjusted unit value-transfer in this research. Following this, the revenuesfrom use of recovered marine debris were also estimated using the currentmarket prices for oil, electricity and plastics. After both expenses and revenueswere calculated in per kilogram (kg) and in Net Present Value (NPV) terms,a determination of the financial viability of the scheme was possible. Thissection concludes by finding that the scheme cannot be profitable with thecurrent high operating expenses and the low market prices for recovered marineplastics.
Regarding the estimated expenses, the costs reported in Tables 2 and3 were adapted from The Ocean Cleanup (2014) with four adjustments. Thefirst adjustment was that the original operating costs were re-estimated tobe variable with capacity instead of assuming a constant operating cost. Theassumption of constant operating cost was determined to not be valid in thisresearch as the category of operating costs included fuel, maintenance and crewcosts, which should theoretically all vary with the amount of plastics recoveredrather than being fixed with capacity. To reflect this change in assumptions,this research adjusted the operating costs to calculate a constant operatingcost per kilogram. This required using the costs from the base scenario, the$5,699,690 (Table 2), divided by the 7,000 tonnes of marine debris recoveredto calculate a constant operating cost per kilogram of $0.814 which was thenextrapolated to greater capacities to estimate all the operating costs, as seenin Table 4. A constant cost per kilogram was chosen to reflect linear economiesof scale in recovering marine debris. While increasing returns to scale couldalso have been assumed, there was no indication in the initial feasibility studyas to the existence or magnitude of such economies. In summary, the firstadjustment was to recalculate the operating costs to be variable.
31

The second cost modification regarded adjusting the deviations used forsensitivity analysis. The original data adopted an 18% decrease in costs forthe best case and a 16% increase for the worst case. This asymmetry wasremoved in this research and instead a uniform 20% deviation was estimatedfor both scenarios. This wider deviation allowed for a wider margin of error tobe calculated along with adding power to the ability of the sensitivity analysis.This controlled for inherent uncertainty in the scheme by suggesting a rangeof values rather than singular estimates.
The third modification to the expenses was the use of discounting. Asdiscussed in the methodology, discounting is an essential technique for compari-son of future values with present ones using the technique of Net Present Value(NPV). Where NPV has been oft used in the literature, a common challengehas been the incorrect choice of discount rate. To avoid this critique, thisresearch adopted different discount rates for the financial and economic effectsand consulted the literature for guidance on the appropriate levels of discount-ing. Specifically, a 5% discount rate was used to calculate the NPV of thefinancial values, to reflect a greater preference for immediate revenues, whereasa 3.5% discount rate was used for the economic impacts which stretch furtherinto the future. Indeed, discounting environmental impacts at a lower ratethan financial impacts is contemporary of the literature (Zhuang et al. (2007),Costanza (2007), Frederick, Loewenstein and O’donoghue (2002)). Therefore,the financial impacts were adjusted for a 5% discount, and the economicimpacts were adjusted using a lower 3.5% discount rate. However, if futureresearchers modify these, it is unlikely to alter the conclusions significantly asevidenced in Table 18.
The fourth and final cost adjustment used in this research was the esti-mation of break-even (B-E) prices. Given the expense adjustments discussedabove, a total cost figure in NPV terms can be calculated. From this, dividingby the total amount of recovered marine debris allows for an expense per kgrecovered to be calculated. Such a figure is instructive for a more straightfor-ward comparison against revenues as they were typically priced in kg terms.Evidence of this was the $4.19 estimate which was calculated by dividingthe NPV of the expenses, the $293mn, by the total amount of marine debrisrecovered, 7,000 tonnes annually. Deviations on this estimate are also reportedin Table 3 for completeness. The following section now details the expenseestimates before estimating a NPV revenue per kg for comparison.
32

Table 2: Annual costs:
This table reports the cost estimates from The Ocean Cleanup (2014) for a single year.While decommissioning was only incurred in the final year it is hear included to spread thecost over the entire duration. No discounting was used here as this is only a single year.However, following results update this.
Category Base cost Best (-20%) Worst (+20%)
Capital expenditure $20,542,008 $16,433,604 $24,650,409
Operating expenditure $5,699,690 $4,559,752 $6,839,628
Decommissioning $1,916,340 $1,533,072 $2,299,608
Total inc. misc costs $36,160,611 $28,928,489 $43,392,729
Cost per kilogram 1 $5.17 $4.13 $6.20
1 Assuming 7,000 tonnes recovered per year
Table 3: Total costs:
This table reports the total cost estimates over the lifetime of TOC. Discounting at 5% wasadopted here to calculate the net present value of the scheme.
Category Base cost Best (-20%) Worst (+20%)
Capital expenditure $205,420,080 $164,336,048 $246,504,096
Operating expenditure $56,996,904 $45,597,524 $68,396,280
Decommissioning $19,163,400 $15,330,720 $22,996,080
Total inc. misc costs $361,606,112 $289,284,896 $433,927,296
NPV 1 $293,183,808 $234,547,040 $351,820,512
Cost per kilogram 2 $4.19 $3.35 $5.03
1 5% discount rate assumed here to exceed the 3.5% used for the economicimpacts. A 10 year lifespan was also assumed following guidance fromThe Ocean Cleanup (2014).
2 The NPV estimates were divided by the estimated 7,000 tonnes recoveredannually. This capacity estimate is later adjusted for sensitivity analysis.
33
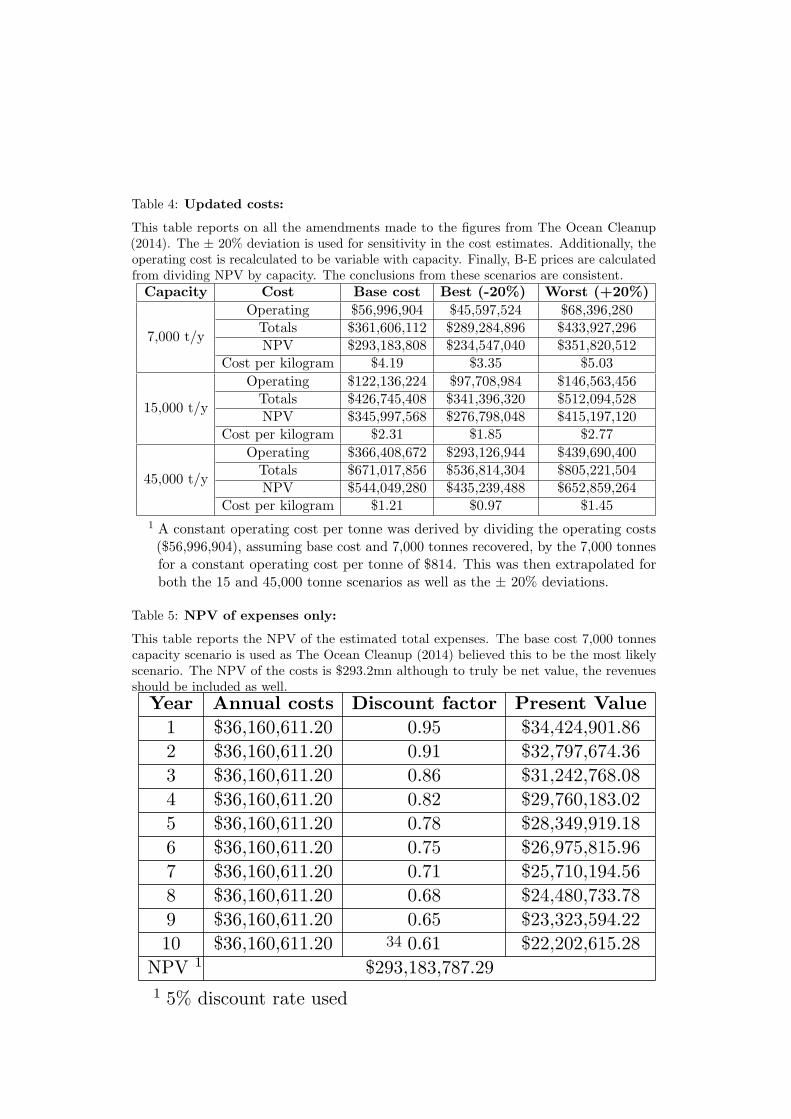
Table 4: Updated costs:
This table reports on all the amendments made to the figures from The Ocean Cleanup(2014). The ± 20% deviation is used for sensitivity in the cost estimates. Additionally, theoperating cost is recalculated to be variable with capacity. Finally, B-E prices are calculatedfrom dividing NPV by capacity. The conclusions from these scenarios are consistent.
Capacity Cost Base cost Best (-20%) Worst (+20%)
7,000 t/y
Operating $56,996,904 $45,597,524 $68,396,280Totals $361,606,112 $289,284,896 $433,927,296NPV $293,183,808 $234,547,040 $351,820,512
Cost per kilogram $4.19 $3.35 $5.03
15,000 t/y
Operating $122,136,224 $97,708,984 $146,563,456Totals $426,745,408 $341,396,320 $512,094,528NPV $345,997,568 $276,798,048 $415,197,120
Cost per kilogram $2.31 $1.85 $2.77
45,000 t/y
Operating $366,408,672 $293,126,944 $439,690,400Totals $671,017,856 $536,814,304 $805,221,504NPV $544,049,280 $435,239,488 $652,859,264
Cost per kilogram $1.21 $0.97 $1.45
1 A constant operating cost per tonne was derived by dividing the operating costs($56,996,904), assuming base cost and 7,000 tonnes recovered, by the 7,000 tonnesfor a constant operating cost per tonne of $814. This was then extrapolated forboth the 15 and 45,000 tonne scenarios as well as the ± 20% deviations.
Table 5: NPV of expenses only:
This table reports the NPV of the estimated total expenses. The base cost 7,000 tonnescapacity scenario is used as The Ocean Cleanup (2014) believed this to be the most likelyscenario. The NPV of the costs is $293.2mn although to truly be net value, the revenuesshould be included as well.
Year Annual costs Discount factor Present Value
1 $36,160,611.20 0.95 $34,424,901.86
2 $36,160,611.20 0.91 $32,797,674.36
3 $36,160,611.20 0.86 $31,242,768.08
4 $36,160,611.20 0.82 $29,760,183.02
5 $36,160,611.20 0.78 $28,349,919.18
6 $36,160,611.20 0.75 $26,975,815.96
7 $36,160,611.20 0.71 $25,710,194.56
8 $36,160,611.20 0.68 $24,480,733.78
9 $36,160,611.20 0.65 $23,323,594.22
10 $36,160,611.20 0.61 $22,202,615.28
NPV 1 $293,183,787.29
1 5% discount rate used
34

Revenues
Crowdfunding.
This section discusses the four possible revenue sources for TOC, assumingtheir technology is useful. The first source of revenue is crowdfunding, and whilethis is not related to output, it has been used by TOC before so it is possiblethat crowdfunding could continue to be used. Crowdfunding has become anincreasingly popular method of fundraising, which mainly operates by askingthe public to donate however much they wish to a scheme. The flexible donationamounts allow for an increased number of donors who may all contribute theirmarginal willingness without any social pressure. Additionally, social mediacampaigns and charity use of crowdfunding has allowed crowdfunding platformsto host a range of sponsoring efforts for charities worldwide with great success.As such, the TOC opted to fund both the feasibility study and initial researchand development for the scheme via a crowdfunding campaign. This campaigncapitalised on strong public support for environmental policies which had beenbolstered by previous such policies, an example of behavioural spillover effects(Dikgang, 2012). Such strong public support was evidenced by the success ofthe campaign that managed to raise $2,154,282 in 100 days. As the campaignonly lasted 100 days, it is however uncertain whether crowdfunding wouldbe a sustainable source of funding for the scheme over the ten-year expectedlifespan. Another challenge to calculating revenue from crowdfunding figuresis the issue of how the results of the first campaign may be amended. Thisresearch uses the same ± 20% deviation as for the costs to estimate sensitivityin the crowdfunded revenue. However, as the campaign only ran for 100 days, itis perhaps erroneous to cite results from that for a full year. Future researchersmay choose to calculate an average daily crowdfunded revenue amount, bydividing $2,154,282 by 100 days, and then extrapolating for as many days asrequired. However, this method faces uncertainty over the duration of thecampaign. If the campaign runs indefinitely or for the full ten years lifetime,there is no guarantee that the daily figure will remain constant over thisextended period. Therefore, this research opted to report the crowdfundedrevenue from the 100 days campaign as estimated funds raised annually forlack of other estimates.
35

Pyrolysis.
Of the three possible uses for recovered marine debris, pyrolysis appearsto possess the highest potential for financial viability. For calculation ofthe potential revenues from pyrolysis, there is a range of plant size andoil types which determine the profitability (Fivga and Dimitriou, 2018). Toapproximately estimate the potential revenues from pyrolysis, this research usedthe average costs (range $0.039-1.14 per kilogram) and the average oil prices($0.60) with zero refinement costs. Following this, Table 9 reports that thehighest possible revenue from pyrolysis, using favourable conditions, predictsan annual revenue of $4.7mn which is less than 15% of the annual costs of thescheme. Precisely, the NPV of using pyrolysis is $15.34mn which represent alittle more than 5% of the NPV of the estimated expenses of operating TOC.This lowly figure was under the most favourable conditions, and with moreexpensive plants and reduced oil prices, this proportion diminishes even further.Therefore, it is clear that pyrolysis is an insufficient source of revenue. Forsufficiency, oil prices per kilogram would have to nearly double and while oilis a volatile commodity, such a favourable increase in prices is unlikely. Suchan increase in oil prices could potentially imply that it is cost-effective to fuelthe scheme by using pyrolysis oil in substitute for market crude oil. However,this is not a financially viable plan as the market prices are significantly lowerthan both the pyrolysis cost and the cost of recovering plastics.
Waste-To-Energy.
The elimination of pyrolysis as a profitable use for recovered marinedebris then leads to a discussion of Waste To Energy (WTE) as an optionfor recovered plastics. However, similarly to pyrolysis, evidence in Table8 suggests that the low price of electricity is not commensurate with theestimated expenses of recovering marine debris and therefore this is not aviable option. The viability was determined by assuming that one tonne ofrecovered marine debris yields 600-kilowatt hours (KwH) of electricity, a yieldjustified by empirical evidence (DEFRA (2014), Psomopoulos, Bourka andThemelis (2009), Kothari, Tyagi and Pathak (2010)). As one tonne generates600KwH, this can be priced using the current market price of $0.12 per kWh.Therefore, one kilogram of marine debris raises $0.072 in revenue using WTE.This low level of revenue is insufficient to support the costs of the scheme whichrange from $0.97-5.03 per kilogram and therefore use of WTE would predictsevere losses, see Table 9 and Figure 1. However, this does not eliminate WTE
36

as an option for recovered marine debris. WTE holds the potential to bestate supported as a relatively clean method of power generation which is notreliant on fossil fuels and instead solves a waste management problem. Whilethere are some concerns about the toxicity of burning recovered, and possiblydegraded, plastics, the electricity from WTE has been observed to contain upto 60% fewer pollutants than that from fossil fuels which confirms WTE as acleaner source of power. Furthermore, WTE is advantageous as there are moreWTE plants than pyrolysis and therefore it is easier to integrate marine debrisinto the existing waste management infrastructure, saving costs when usingWTE (Sudhakar et al. (2007), Psomopoulos, Bourka and Themelis (2009),DEFRA (2014)). However, the volatile but low market price for electricitystrongly implies that WTE is not a financially viable option for recoveredmarine debris.
Recycling.
Following the elimination of pyrolysis and WTE, table 8 then examinedthe profitability of recycling. There are two potential revenue streams forrecycling. Firstly, wholesale recycling (B2B) sells recovered plastics to a PlasticRecovering Facility (PRF) who sell it on to manufacturers (WRAP, 2012).Wholesale is an attractive option for TOC as the costs and risks associatedwith the marketing and sale of products are left to the PRF where TOC wouldonly have to transport plastics and sell them to PRF’s. Selling to PRF’s couldbe done via contracting to ensure certainty or selectively to take advantage ofcompetition between plants and volatile markets. A further advantage to thisstream is that PRF is more common than WTE and pyrolysis plants whichimply easier integration of marine plastics into existing waste management.To estimate the likely prices to be faced in this method, a weighted averageof wholesale market prices was derived used prices from WRAP (2018) andweights from Lebreton et al. (2018) who reported the frequency of plastictypes likely to be recovered by TOC in the APEC region. A weighted priceis a valid approximation of the likely revenues given uncertainty about thetypes of plastics recovered and their market prices. This research estimatedan average price of $0.21 per kg (WRAP, 2012), and the revenues at this priceare insufficient to fund the scheme. This necessitated an examination of thesecond potential revenue stream for recycling, commercial (B2C) recycling.In this method, TOC would pay PRF’s to recycle plastics and then retakeresponsibility for marketing them. This increases uncertainty, risk and thereforecosts on TOC although the higher risk with B2C recycling is also accompanied
37

by a higher reward as the market prices are higher than B2B recycling witha weighted average price of $0.41 per kg. However, the typical PRF fee, forconverting recovered plastics into final products, would be $0.32 per kg leadingto a positive profit of $0.09 per kg which is lower than the $0.21 estimate forB2B recycling (WRAP, 2009). While WRAP (2012) disputed the $0.09 figureand reported that B2C profits could range up to $0.54 per kg, this would stillbe an insufficiently low price. Even assuming that behavioural spillover effects(Dikgang, 2012) incentivise consumers to pay more for recycled products, itis unlikely that sufficiently high prices to make the scheme profitable can beconsistently achieved (The Ocean Cleanup, 2014). Therefore recycling is not afinancially viable option.
38
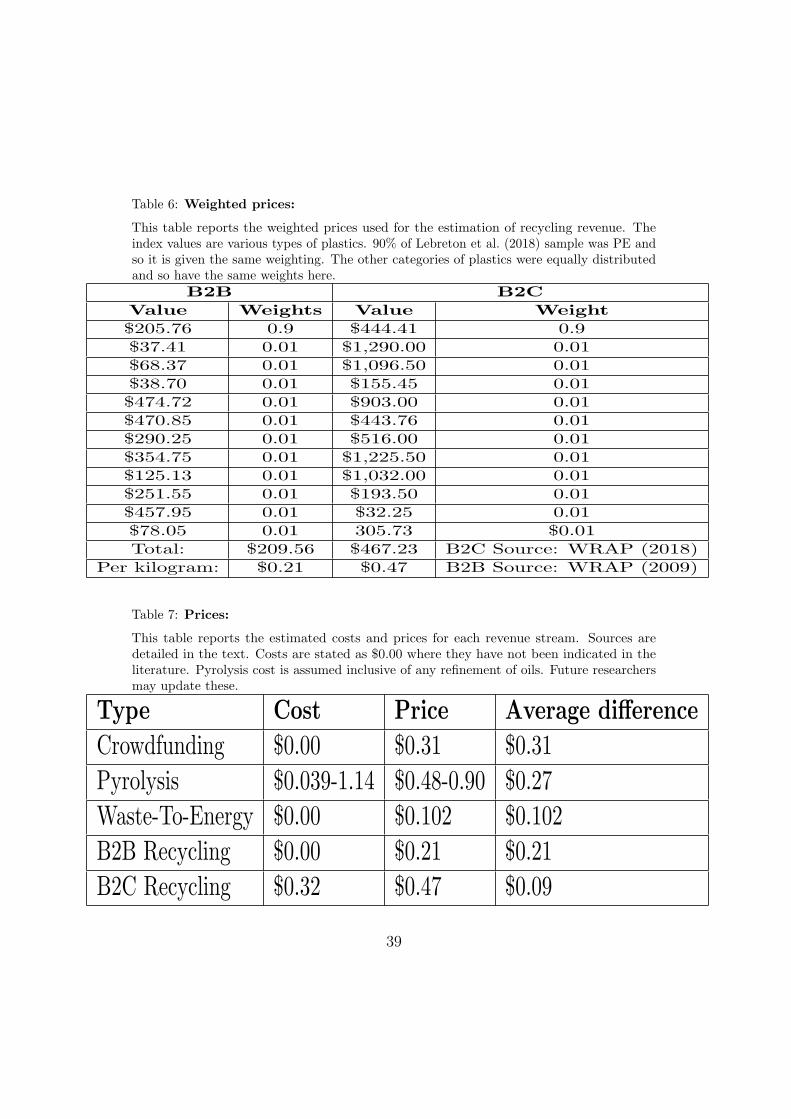
Table 6: Weighted prices:
This table reports the weighted prices used for the estimation of recycling revenue. Theindex values are various types of plastics. 90% of Lebreton et al. (2018) sample was PE andso it is given the same weighting. The other categories of plastics were equally distributedand so have the same weights here.
B2B B2C
Value Weights Value Weight
$205.76 0.9 $444.41 0.9
$37.41 0.01 $1,290.00 0.01
$68.37 0.01 $1,096.50 0.01
$38.70 0.01 $155.45 0.01
$474.72 0.01 $903.00 0.01
$470.85 0.01 $443.76 0.01
$290.25 0.01 $516.00 0.01
$354.75 0.01 $1,225.50 0.01
$125.13 0.01 $1,032.00 0.01
$251.55 0.01 $193.50 0.01
$457.95 0.01 $32.25 0.01
$78.05 0.01 305.73 $0.01
Total: $209.56 $467.23 B2C Source: WRAP (2018)
Per kilogram: $0.21 $0.47 B2B Source: WRAP (2009)
Table 7: Prices:
This table reports the estimated costs and prices for each revenue stream. Sources aredetailed in the text. Costs are stated as $0.00 where they have not been indicated in theliterature. Pyrolysis cost is assumed inclusive of any refinement of oils. Future researchersmay update these.
Type Cost Price Average difference
Crowdfunding $0.00 $0.31 $0.31
Pyrolysis $0.039-1.14 $0.48-0.90 $0.27
Waste-To-Energy $0.00 $0.102 $0.102
B2B Recycling $0.00 $0.21 $0.21
B2C Recycling $0.32 $0.47 $0.09
39

Table 8: Revenues:
This table extends 7 and reports the estimated revenues from each of the possible uses ofrecovered marine debris. Crowdfunding is an uncertain stream so should not be relied upon.Of the remaining uses, pyrolysis appears to be the most profitable although the revenuesare still clearly insufficient to compensate for the high costs of the scheme.
Element Base prices Best prices Worst prices
Crowdfunding ($0.31 per kilogram) $2,154,282 $1,723,426 $2,585,138
Pyrolysis ($0.27 per kilogram) $3,927,000 $4,712,400 $3,141,600
Waste-To-Energy ($0.102 per kilogram) $714,000 $856,800 $571,200
B2B Recycling ($0.21 per kilogram) $1,470,000 $1,764,000 $1,176,000
B2C Recycling ($0.09 per kilogram) $630,000 $756,000 $504,000
Table 9: Revenues:
This table reports the estimated NPV of all the possible revenues from uses of recoveredmarine debris. The range of revenues is $5.1-17.6mn which represents on average, 3.79%of the $293mn NPV of the costs. This overwhelmingly shows that the TOC scheme is notfinancially viable.
Year Crowdfunding Pyrolysis B2B Recycling B2C Recycling WTE1 $2,065,840.00 $1,801,057.07 $1,399,440.00 $599,760.00 $666,400.002 $1,968,190.00 $1,715,923.07 $1,333,290.00 $571,410.00 $634,900.003 $1,874,880.00 $1,634,572.80 $1,270,080.00 $544,320.00 $604,800.004 $1,785,910.00 $1,557,006.27 $1,209,810.00 $518,490.00 $576,100.005 $1,701,280.00 $1,483,223.47 $1,152,480.00 $493,920.00 $548,800.006 $1,618,820.00 $1,411,332.53 $1,096,620.00 $469,980.00 $522,200.007 $1,542,870.00 $1,345,117.20 $1,045,170.00 $447,930.00 $497,700.008 $1,469,090.00 $1,280,793.73 $995,190.00 $426,510.00 $473,900.009 $1,399,650.00 $1,220,254.00 $948,150.00 $406,350.00 $451,500.0010 $1,332,380.00 $1,161,606.13 $902,580.00 $386,820.00 $429,800.00
NPV $17,593,973.04 $15,338,917.57 $11,918,497.86 $5,107,927.66 $5,675,475.17% total 6.00 5.23 4.07 1.74 1.942 5% discount rate used
40

Profitability
This section concludes by rejecting financial viability. Specifically, thetables above suggest that market prices are too low compared to operating costswhich are too high. Therefore, the scheme is not profitable. However, financialviability ipso facto may be criticised as purely considering the financial impactsand not the social impacts of the scheme (Vatn and Bromley, 1994). Therefore,it is instructive to augment the finding of financial infeasibility by conductingan expanded CBA to determine if the scheme is at least economically viable.
Figure 1: Summary of the financial viability analysis. This graph reports the estimated
expenses, revenues and the difference. The overall loss of $282mn, or -$4.03 per kg, rejectsthe notion of financial viability. Indeed, the ratio of revenues to expenses can be simplifiedto 1:24, a stunning indictment of the forecasted lossmaking nature of the TOC scheme.
41

Economic viability
This section assesses the economic viability of TOC. Economic viabilityincludes the financial and the social impacts of marine debris. While thefinancial impacts were valued above, this section aims to value the socialimpacts. There is a range of social impacts of marine debris, such as lossof life, non-use and aesthetic values (Lebreton et al., 2018), but the absenceof valuations of these impacts necessitates the assumption that the primaryeconomic impact of marine debris is the damage to the marine economy(McIlgorm, Campbell and Rule, 2008). To estimate this impact, a meta-analysis was first conducted to identify which prior studies are suitable forvalue-transfer. Adjusted unit value-transfer was then applied to the seminalpapers from the meta-analysis to estimate the economic impacts for use in theCBA to assess economic viability.
Table 10: Meta-analysis:
Sources and valuations used in the meta-analysis. Meta-analysis was used to identify theunique estimates of marine debris in the literature. The seven below are the seminal papersand of these, McIlgorm, Campbell and Rule (2011) and Mouat, Lozano and Bateson (2010)are identified as viable for adjusted unit value-transfer.Study Methodology Valuation Additional calculations
McIlgorm, Campbell and Rule (2011)detailed in text
Designed a novel functionAPEC marine economyAnnual losses of $1.26bn
Tourism: $622mn damagesShipping: $279mn damagesFishing: $364mn damages
By sector:
Kildow and McIlgorm (2010)but on a country, not regional, levelMcIlgorm, Campbell and Rule (2011)
Similar to
Represents on average 2.51% of national GDPAPEC marine economy value: $40.44bn
Not 3% as aboveAverage value of marine economy: 2.5% GDP
Mouat, Lozano and Bateson (2010) Collected original data.
Cost of rescue: e830k-2.2mn annually for UKCost to harbours: e2.4mn py
Cost to fishing: 5% of total revenueCost of clean-up: 37% rise over 10 yearsCost of clean-up: e18mn annually for UK
Estimates from North Sea rather than PacificThese calculations are based on questionnaire
Takehama (1990) Used public dataAlternatively: Y6.6bn in 1985 pricesDamage to vessels: 0.3% of revenue
No indication if the 0.3% rule is up to date
The Ocean Cleanup (2014) Used meta-analysisRefers to world rather than APEC regionCosts of marine plastics: $13bn annually
due to technical challenges restricting dataCosts are likely under-reported
Leggett et al. (2014) Case study of Orange countyA 100% reduction would save $148mn yearly
A 75% reduction leads to benefits of $52mn yearlyA 25% reduction would save $32mn yearly
Did not specify the clean-up costs.50% of beach debris re-appeared within 3 months
Bergmann, Gutow and Klages (2015) Used meta-analysis Foregone tourism valued at e23-29mnbut did not quantify these
They note a range of impacts of marine debris
42

While McIlgorm, Campbell and Rule (2011) function is the most notableestimate from the meta-analysis, it is also instructive to note why this researchmentioned but did not adapt the findings from Mouat, Lozano and Bateson(2010). Noteworthy findings included that 82% of fishing vessels had reportedmarine debris contaminated catch, that 70% of harbours reported damagesfrom marine debris, that marine debris damages were 5% of total annualfishing fleet revenue and that beach clean up costs had risen 37% in ten yearsto more than $50,000 per area. However, as it is not practical to estimatethe number of harbours, fishing vessels or beaches at threat from marinedebris in the APEC region, these figures are less relevant to this research.Furthermore, the data used to assess the damages from the marine debriswas based solely on respondents estimates which suffered from low responserate, an average of one-third of surveys was returned. This low response rateimplies a sample size issue that casts doubt on their estimates. Their estimatesare more thorough than McIlgorm, Campbell and Rule (2011), but less easilyadjusted and replicated and therefore this research chose to adapt McIlgorm,Campbell and Rule (2011) method over Mouat, Lozano and Bateson (2010).
McIlgorm, Campbell and Rule (2011) established a novel function tocalculate the costs of marine debris in the APEC region. Their functionincluded three fundamental units.
Summary of McIlgorm, Campbell and Rule (2011) function:
Step one: Take 3% of GDP as the value of the marine economy
Step two: Take 48% of this figure as vulnerable to marine debris
Step three: Take 0.3% of this figure as annual losses.
The 3% value and the 0.3% estimate are the two units that were adjustedin this research to increase the accuracy of this function.
Firstly, McIlgorm, Campbell and Rule (2011) assumed the marine econ-omy represented on average 3% of national GDP. Secondly, 48% of the abovefigure was taken as the vulnerable marine economy. Finally, 0.3% of the 48%is estimated as annual losses to marine debris. However, before adopting thisfunction in this research, several critiques of the function must be made. Thefirst criticism was that Kildow and McIlgorm (2010) doubted the 3% propor-tion of GDP and instead reported that an average of 2.5% of GDP is a more
43

likely value of the marine economy. Furthermore, some countries specificallyreport the value of their marine economy which makes use of a percentageirrelevant for a minority of countries. Practically, this research reported the3% value for comparison with the original figures, but a band of 2.5-5% wasalso estimated for sensitivity analysis. This band of estimates was justified byKildow and McIlgorm (2010) who reported 2.5% as the average percentagefor the APEC region. However, they also noted that individual countries,China, in particular, had significantly larger marine economies. Therefore, thisresearch opted to use 3% as suggested but also adjusted the units to include2.5% and 5% as lower and upper bounds respectively for sensitivity analysis ofthe values.
Secondly, where the 48% estimate of the vulnerable marine economystems from is unclear, however. Therefore the 48% proportion of the vulnerablemarine debris was not adjusted in this research as inadequate literature existson how to adjust it. This example of unadjusted unit value transfer introducesadditional uncertainty although this mostly unavoidable for this specific unit.The adjustment of the remaining two units should however somewhat mitigatethe transfer error implied by using this proportion unadjusted (Brouwer andSpaninks, 1999).
Third and finally, the 0.3% loss value is a point of significant contention inthe literature. The source of the estimate was Takehama (1990) who observeddamages from marine debris suffered by the Japanese fishing fleet in the 1980’s.Two critiques of this arise. Firstly, applying a localised estimate for Japan tothe entire APEC region is an example of the unadjusted unit value transferBrouwer et al. (1999) criticised as being inaccurate. Secondly, the unadjustedfigure also fails to account for the growth in marine debris since that periodwhich has been unambiguously accompanied by inflated damages to the marineeconomy (Jambeck et al., 2005). Therefore, it is clear that using the 0.3%figure without further qualification or amendment is erroneous. To solve thispotential error, this research used a range of 0.2-0.5%, which is skewed towardshigher estimates. The range of 0.2-0.5% was skewed towards the higher valuesgiven the increased prevalence of marine debris and growth of the marineeconomy (Jambeck et al., 2005). A further justification for adjusting for higherunits is that as estimates from McIlgorm, Campbell and Rule (2011) methodare likely an underestimate of the true economic costs, an upwards revisionwould somewhat mitigate the problem of not incorporating the full social
44

impacts of reduced water quality, lost marine life and negative welfare impactson coastal populations which are not currently valued. Therefore using a higherbound of 0.5% is an attempt to include these impacts. To conclude, McIlgorm,Campbell and Rule (2011) proposed a novel function to calculate the damagesof marine debris but it requires adjusted unit value transfer to be relevant tothis CBA.
This section discusses some necessary critiques of the above method.Despite the convenience of McIlgorm, Campbell and Rule (2011) method, it isinstructive to note that while their estimates purport to represent the entiremarine economy. It is, however, doubtful that this an accurate estimate for eachsector afflicted by marine debris. This is mainly because the estimated damagesrefer to the entire APEC marine economy and not one specific sector and sothe estimates are imprecise. Furthermore, the estimates specifically relate tothe financial losses suffered by the entire marine economy and therefore fails toconsider the social impacts McIlgorm, Campbell and Rule (2008). The socialimpacts include the value of lost and damaged marine life or the loss of non-useand aesthetic value (Costanza, 2007). Nor is the value of reduced water qualityor the disproportionate welfare impacts on the populations who live closest topolluted areas incorporated in their estimates. Therefore, the estimates fromMcIlgorm, Campbell and Rule (2011) method are likely an underestimationof the full economic impacts of marine debris. As valuations of these are notcurrently available from the literature, the estimates from McIlgorm, Campbelland Rule (2011) must suffice. Even by adjusting McIlgorm, Campbell and Rule(2011) upwards to reflect the omitted social impacts, the resulting estimateis likely an underestimate of the true economic costs although it must sufficehere. However, even with the use of underestimates, the economic viabilityof the scheme is assured, and realisation of the true inflated costs would onlyadd credence to this conclusion.
This section discusses the validity of the estimated $465.49mn NPV ofthe TOC scheme. Firstly, the use of NPV required discounting the economicimpacts at 3.5%, compared to the 5% discounting of the financial impacts.While the precise discount rates used can be critiqued as inaccurate or unjusti-fied, the effect of discounting is essentially one of scaling, and so the conclusionsare not significantly different regardless of choice of discount rate, see Table19 for confirmation of this. Another possible critique of this method is thereliance upon the estimated avoided damages which were used to represent the
45

full economic impacts of marine debris. Precisely, the avoided damages werecalculated by taking the total annual value of marine losses, $1.95bn (range:$1.08-5.42bn), and dividing this by amount of marine debris (140,000 tonnes(Lebreton et al., 2018)), for a damage per kilogram estimate, $13.95 (range:$7.75-38.75). This damage per kilogram estimate was then applied to the7,000 tonnes assumed recovered annually. Using this method reported avoideddamages of $97mn annually (range: $54.25mn-$271.25mn). The headlinefigures for this research include the point estimate of the $1.95bn estimate ofannual losses. This estimate was a simple replication of McIlgorm, Campbelland Rule (2011) method. This example of unadjusted unit value transfer hasbeen critiqued as being wildly inaccurate by Brouwer and Spaninks (1999) sothe validity of using it to estimate economic viability in this research is weak.However, this figure is merely estimated for consistency with the previousliterature. Furthermore, a range of estimates using the adjusted unit valuetransfer and sensitivity analysis methods were calculated, and they uniformlyreport the same conclusion, that TOC is economically viable.
46

Table 11: Damage estimates:
This table reports the results from adjusting the units in McIlgorm, Campbell and Rule(2011) method. This leads to the estimated annual losses to the APEC marine economyfrom marine debris, of $1.95bn. This represents a 54.15% increase on the original damageestimates in fewer than 10 years. This is consistent with the increase in plastic productionworldwide (Jambeck et al., 2005). Data for selected countries is also shown to highlight thewidespread damages of marine debris.
Element Value Notes
Total APEC region
Losses = $1.953bnVulnerable value = $650.95bnMarine economy = $1,356.14bnTotal GDP = $45,204.85bn
as in Takehama (1990)0.3% of vulnerable marine economy is estimated as losses
3% of GDP assumed to be marine economy
USA
Lost fishing = $258.5mnLosses = $460.8mn
Vulnerable value = $153.6bnMarine economy = $320bn
Follows Mouat, Lozano and Bateson (2010) methodUses 5% of total fishing revenue as estimate for losses
Uses 1.8% of GDP instead of 3%
Australia
Lost fishing = $82mnLosses = $107.1mn
Vulnerable value = $35.712bnMarine economy = $74.4bn
Marine economy and fishing value sourced from APEC (2018)Uses 4.8% of GDP instead of 3%
ChinaLosses = $1.16bn
Vulnerable value = $385.25bnMarine economy = $802.6bn
Marine economy value interpreted from GDPData on fishing not available
JapanLosses = $189mn
Vulnerable value = $63.12bnMarine economy = $131.49bn
Data on fishing not availableData on marine economy interpreted from GDP
47

Table 12: Omitted estimates:
This table reports some of the valuations not incorporated in McIlgorm, Campbell and Rule(2011) method. While adjusted unit value transfer can be used to approximate the omittedvaluations, it is still worthwhile reporting these areas which are in need of further studyand valuations. The absence of these estimates implies that the $1.95bn figure is likely anunderestimate of the true costs of marine debris. This lends further weight to the conclusionthat TOC is economically but not financially viable.
Category Estimates Proposal
Human healthhas not been assessedfrom leached chemicals
The impact of reduced water quality
and extent of reduced water qualityResearchers must first quantify the effects
Marine life40% suffering from ingestion
40% of species suffering entanglement
to keep the current marine life and area consistentagents Willingness-To-Pay valuations
CV techniques could estimate
Non-use valueareas of highly concentrated marine debris
loss of aesthetic value inThis refers specifically to
Table 13: NPV estimates of the avoided damages:
This table reports the NPV of the estimated damages avoided by operating the TOC scheme.A 3.5% discount rate is assumed, consistent with the Treasury (2018). The resultant figureof $840.5m, combined with the NPV revenues, is almost thrice the NPV of the costs whichimplies economic viability of the scheme.
Year Annual damages Discount factor Present Value
1 $97,650,000 0.97 $94,329,900
2 $97,650,000 0.93 $91,205,100
3 $97,650,000 0.90 $88,080,300
4 $97,650,000 0.87 $85,053,150
5 $97,650,000 0.84 $82,221,300
6 $97,650,000 0.81 $79,487,100
7 $97,650,000 0.79 $76,752,900
8 $97,650,000 0.76 $74,116,350
9 $97,650,000 0.73 $71,675,100
10 $97,650,000 0.71 $69,233,850
NPV 1 $840,540,587.59
1 3.5% discount used instead of 5% for the financial costs.
48

Table 14: Avoided damages:
This table reports the possible adjustments to McIlgorm, Campbell and Rule (2011) method.9 final estimates are produced for the annual value of damages to the APEC marine economy.These range from $1.08-5.42bn or $7.75-38.75 per kilogram of marine debris. These estimatesof debris are later used to calculate the value of damages avoided by operating the TOCscheme.
Units: Estimates:
Marine economy (M.E) value
Total GDP: $45,205bn (APEC, 2018)
3% (Base) $1,356.1455bn
2.5% (Low) $1,130.1212bn
5% (High) $2,260.2425bn
Value of marine economy vulnerable to marine debris
48%$650.95bn (Base)$542.46bn (Low)
$1,084.92bn (High)
Estimated annual losses
0.3% (Base)$1.9528bn (Base)$1.6274bn (Low)$3.2547bn (High)
0.2% (Low)$1.3019bn (Base)$1.0849bn (Low)$2.1698bn (High)
0.5% (High)$3.2547 (Base)$2.7123 (Low)$5.4246 (High)
Low to high ranking of estimates in per kilogram terms
$1.08bn $7.75
$1.30bn $9.30
$1.62bn $11.62
$1.95bn $13.95
$2.16bn $15.50
$2.71bn $19.37
$3.25bn $23.25
$3.25bn $23.25
$5.42bn $38.75
49
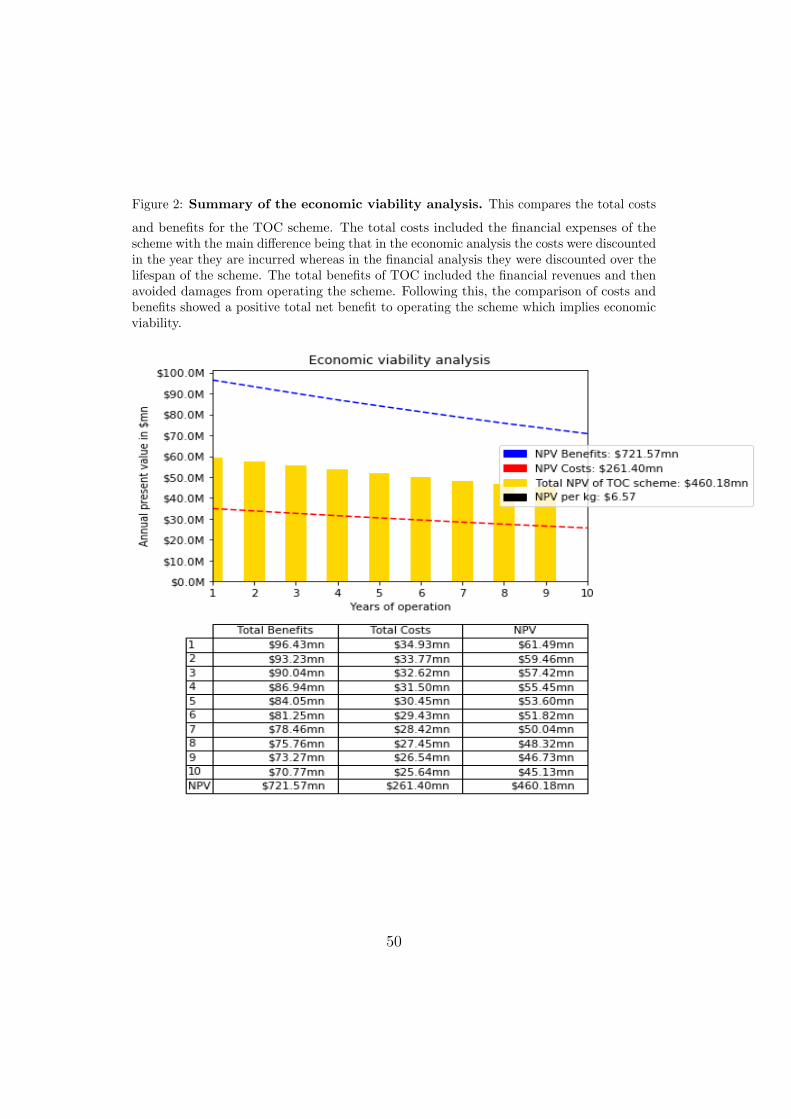
Figure 2: Summary of the economic viability analysis. This compares the total costs
and benefits for the TOC scheme. The total costs included the financial expenses of thescheme with the main difference being that in the economic analysis the costs were discountedin the year they are incurred whereas in the financial analysis they were discounted over thelifespan of the scheme. The total benefits of TOC included the financial revenues and thenavoided damages from operating the scheme. Following this, the comparison of costs andbenefits showed a positive total net benefit to operating the scheme which implies economicviability.
50
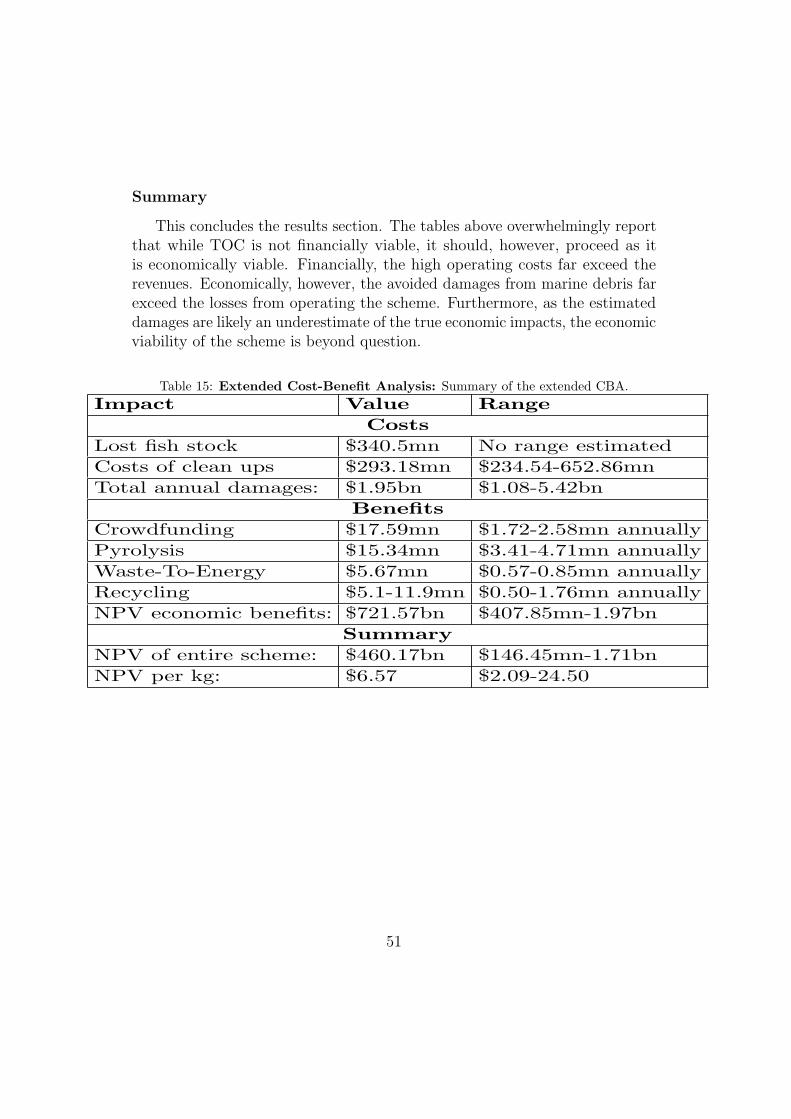
Summary
This concludes the results section. The tables above overwhelmingly reportthat while TOC is not financially viable, it should, however, proceed as itis economically viable. Financially, the high operating costs far exceed therevenues. Economically, however, the avoided damages from marine debris farexceed the losses from operating the scheme. Furthermore, as the estimateddamages are likely an underestimate of the true economic impacts, the economicviability of the scheme is beyond question.
Table 15: Extended Cost-Benefit Analysis: Summary of the extended CBA.
Impact Value Range
Costs
Lost fish stock $340.5mn No range estimated
Costs of clean ups $293.18mn $234.54-652.86mn
Total annual damages: $1.95bn $1.08-5.42bn
Benefits
Crowdfunding $17.59mn $1.72-2.58mn annually
Pyrolysis $15.34mn $3.41-4.71mn annually
Waste-To-Energy $5.67mn $0.57-0.85mn annually
Recycling $5.1-11.9mn $0.50-1.76mn annually
NPV economic benefits: $721.57bn $407.85mn-1.97bn
Summary
NPV of entire scheme: $460.17bn $146.45mn-1.71bn
NPV per kg: $6.57 $2.09-24.50
51

Discussion
Implications.
The implications of this research stem from the duality between thefinancial and economic viability of TOC. While the scheme was not remotelyfinancially viable, the sheer magnitude of damages avoided by operating thescheme implies a degree of economic viability in the scheme. This findingimplies that it is advisable to seek a sufficient source of funding to mitigate thedamages of marine debris. Thus far only crowdfunding has been used. Whileit has been a popular source with nearly 40,000 individual donors, the revenueswere less than 10% of the total annual costs 1. Alternatively, the scheme couldoperate in a way where donors could sponsor the cleanup for a specific priceper kilogram collected, thus directly linking revenue to operations. While thishas not been suggested for TOC, this method has been successful for charities.Finally, either government or third-sector intervention is likely necessary tosupport this scheme. One possible solution would be the marine economyfunding the scheme to mitigate the damages they suffer. Alternatively, themajor industrial, commercial and maritime polluters could also support thescheme if the ‘polluter pays principle’ is adhered to. The precise fundingmechanism is left for future researchers. A final noteworthy implication of thisresearch is the finding that marine debris could relatively easily be integratedinto the existing waste management infrastructure. Regardless of how marinedebris, in particular plastics, are recovered, integration with existing wastemanagement infrastructure should be sought as a cost-effective method ofmanagement. Recycling in particular merits further study as it represents anefficient use of existing resources and where recycled plastics substitute forvirgin plastics, recycling would save fossil fuels and industrial effluent fromthe manufacture of virgin plastics. Therefore, future researchers are advisedto analyse recycling in particular as a cost-effective method of integrating ofwider waste sources, such as marine debris, into existing waste managementinfrastructure.
1The scheme did only run for 100 days to fund the completion of the feasibility study soit is not entirely accurate to suggest that crowdfunding cannot deliver revenue over 10% ofthe annual costs. However, the 10yr lifespan and sizeable anticipated losses suggest thatcrowdfunding cannot be solely relied upon to support this scheme.
52

Limitations.
There are, however, a range of limitations to this study. Firstly, themeta-analysis suffered from small sample size, due to lack of estimates ofthe social impacts of marine debris, and this small sample size leads to astrong reliance on adjusting McIlgorm, Campbell and Rule (2011) method.Furthermore, the adjustment of units in this research could be described asarbitrary. While using a band of estimates and adjusting the units upwardswas justified, future researchers could choose precise adjustments where thisresearch instead estimated ranges. A final noteworthy limitation is the strongreliance on The Ocean Cleanup (2014) despite it being a feasibility studyestimated before the actual expenses of TOC are known. This reduces theaccuracy of the financial viability analysis although the conclusions are likelyconsistent unless the TOC scheme radically changes.
Recommendations.
There are two key recommendations from this research. Firstly, the topicof marine debris requires further attention. Specifically, the scarce literaturecould be augmented by new willingness to pay estimates using contingentvaluation techniques to evaluate the social impacts of marine debris. Secondly,the effects of leached chemicals from plastics on water quality, marine andhuman health require further research.
Conclusion
In conclusion, this research has evaluated the financial and economicviability of a novel scheme to recover marine debris. The TOC scheme proposedrecovering marine plastics and then marketing those for profit. However, noneof the revenue streams was forecast to provide even 10% of the expenses ofrunning the scheme, and thus the finding of profitability is rejected by thisresearch. Evidence for this is provided by the ratio of revenues to costs of1:24 or in NPV terms, an estimated loss of $280.55mn over the lifetime of thescheme, or -$4.01 per kilogram recovered. However, while financial viabilitywas rejected, economic viability was not. The ratio of economic benefitsto costs was 1:2.78, or in NPV terms, a total net benefit of $465.49mn, or$6.65 for every kilogram of marine debris recovered. These conclusions werereached in two separate ways. For the assessment of the financial viability, TheOcean Cleanup (2014) provided estimates of the capital and operating costs.
53
This research amended these in four ways. Firstly, the operating costs werecalculated to be variable with capacity rather than fixed. Secondly, the marginsof error used for sensitivity analysis were widened. Thirdly, discounting wasused. A lower rate, 3.5%, was used for the economic impacts while 5% wasused for the financial impacts. Use of discounting was undertaken to comparevalues throughout time accurately and to allow for calculation of net presentvalues. Finally, break-even prices, or costs per kilogram, were calculated forease of comparison with the revenues. Of the revenues, average market priceswere used wherever possible. Finally, this allowed a comparison of expensesand revenues which overwhelmingly reported that the scheme is not financiallyviable. For the evaluation of economic viability, previous estimates of theeconomic impacts of marine debris were sought. When a scarcity of estimatespresented itself, this research opted to apply adjusted value transfer to aseminal paper’s methodology to allow new estimates. As with the financialviability assessment, discounting and sensitivity analysis were applied foraccuracy and validity. All told, the resultant estimates of the NPV of the TOCscheme are significantly positive which therefore implies the scheme shouldproceed. The estimates used to calculate economic benefits, however, may becritiqued as being underestimates of the true social impacts which could notbe adequately estimated here for data limitations. Regardless, the presenceof an underestimated economic benefit only adds weight to the conclusions ofthis research. With regards to the conclusion that the scheme is economicallybut not financially viable, future researchers must contend with a variety ofsolutions. Crowdfunding support has also been suggested although this isalso likely insufficient to cover the schemes significant expenses. Governmentintervention and application of Coase theorem may also be worthwhile avenuesfor future researchers to explore. For now, it suffices to note that if you gofishing for litter, you better hope the price is right.
54

References:
2018. Available from: https://www.2wglobal.com/news-and-insights/articles/
features/Dramatic-increase-in-fuel-prices/.Ackerman, F. and Heinzerling, L., 2002. Pricing the priceless: cost-benefit analysis of
environmental protection. University of Pennsylvania Law Review, 150.Ackerman, F., Heinzerling, L. and Massey, R., 2005. Applying cost-benefit to past decisions:
Was environmental protection ever a good idea. Admin. L. Rev., 57, p.155.Allsopp, M., Walters, A., Santillo, D. and Johnston, P., 2007. Plastic debris in the world’s
oceans. Greenpeace.Amos, A., 1993. Solid waste pollution on texas beaches: a post marpol annex v study.APEC, 2018. Available from: http://statistics.apec.org/index.php/apec_psu/
index_noflash.Azzarello, M. and Van-Vleet, E., 1987. Marine birds and plastic pollution. Marine Ecology
Progress Series, 37, pp.295–303.Bergmann, M., Gutow, L. and Klages, M., 2015. Marine anthropogenic litter. Springer.Bohm, R., D.H.Folz, T.C.Kinnaman and M.J.Podolsky, 2010. The costs of municipal waste
and recycling waste. Resources, Conservationa and Recycling, 54, pp.864–871.Brouwer, R., Langford, I.H., Bateman, I.J. and Turner, R.K., 1999. A meta-analysis of
wetland contingent valuation studies. Regional Environmental Change, 1(1), pp.47–57.Brouwer, R. and Spaninks, F.A., 1999. The validity of environmental benefits transfer:
further empirical testing. Environmental and resource economics, 14(1), pp.95–117.Costanza, R., 2007. Valuing new jersey’s natural capital: An assessment of the economic
value of the state’s natural resources.DEFRA, 2014. Energy from waste. a guide to the debate.Derraik, J., 2002. The pollution of the marine environment by plastic debris: a review.
Marine pollution bulletin, 44(9), pp.842–852.Dikgang, J., 2012. Analysis of the plastic-bag levy in south africa. Resources Conservation
and Recycling, pp.59–65.Fivga, A. and Dimitriou, I., 2018. Pyrolysis of plastic waste for production of heavy fuel
substitute: A techno-economic assessment. Energy, 149, pp.865–874.Frederick, S., Loewenstein, G. and O’donoghue, T., 2002. Time discounting and time
preference: A critical review. Journal of economic literature, 40(2), pp.351–401.Hammer, J., Kraak, M. and Parsons, J., 2012. Plastics in the marine environment: the dark
side of a modern gift. Reviews of environmental contamination and toxicology, pp.1–44.Harse, G., 2011. Plastic, the great pacific garbage patch, and international misfires at a
cure. UCLA Journal of Environmental Law and Policy, 29, p.331.Henderson, J., 2001. A pre- and post-marpol annex v summary of hawaiian monk seal
entanglements and marine debris accumulation in the northwestern hawaiian islands.Marine Pollution Bulletin, 42, pp.584–589.
Jambeck, J., Geyer, R., Wilcox, C., Siegler, T., Perryman, M., Andrady, A., Narayan, R.and Law, K., 2005. Plastic waste inputs from land into the ocean. Science, 347(6223),pp.768–771.
Johnson, S., 1994. Deposition of trawl web on an alaska beach after implementation ofmarpol annex v legislation. Marine Pollution Bulletin, 28, pp.477–481.
Johnston, R.J., Rolfe, J., Rosenberger, R.S. and Brouwer, R., 2015. Benefit transfer ofenvironmental and resource values, vol. 14. Springer.
55
Karlsson, T.M., Arneborg, L., Brostrom, G., Almroth, B.C., Gipperth, L. and Hassellov,M., 2018. The unaccountability case of plastic pellet pollution. Marine pollution bulletin,129(1), pp.52–60.
Kildow, J. and McIlgorm, A., 2010. The importance of estimating the contribution ofthe oceans to national economies. Marine Policy, 34(3), pp.367 – 374. Available from:http://doi.org/https://doi.org/10.1016/j.marpol.2009.08.006.
KIMO, 2014. Fishing for litter final report 2011-2014.Kothari, R., Tyagi, V. and Pathak, A., 2010. Waste-to-energy: A way from renewable energy
sources to sustainable development. Renewable and Sustainable Energy Reviews, 14(9),pp.3164–3170.
Laist, D.W., 1997. Impacts of marine debris: entanglement of marine life in marine debrisincluding a comprehensive list of species with entanglement and ingestion records. Marinedebris, Springer, pp.99–139.
Lebreton, L., Slat, B., Ferrari, F., Sainte-Rose, B., Aitken, J., R.Marthouse, S.Hajbane,Cunsolo, S., A.Schwarz, Levivier, A. and Noble, K., 2018. Evidence that the great pacificgarbage patch is rapidly accumulating plastic. Scientific reports, 8(1), p.4666.
Leggett, C.G., Scherer, N., Curry, M.S., Bailey, R. and Haab, T.C., 2014. Assessing theeconomic benefits of reductions in marine debris: a pilot study of beach recreation inorange county, california. Industrial Economics, Incorporated.
Marsden Jacob, 2009a. Marine litter: A global challenge.McIlgorm, A., Campbell, H. and Rule, M., 2008. Understanding the economic benefits
and costs of controlling marine debris in the apec region (mrc 02/2007). A report to theAsia-Pacific Economic Cooperation Marine Resource Conservation Working Group bythe National Marine Science Centre (University of New England and Southern CrossUniversity), Coffs Harbour, NSW, Australia, December.
McIlgorm, A., Campbell, H.F. and Rule, M.J., 2011. The economic cost and control of marinedebris damage in the asia-pacific region. Ocean and Coastal Management, 54(9), pp.643 –651. Available from: http://doi.org/https://doi.org/10.1016/j.ocecoaman.2011.05.007.
Moser, M. and Lee, D., 1992. A fourteen-year survey of plastic ingestion by western northatlantic seabirds. Colonial Waterbirds, 15, pp.83–94.
Mouat, J., Lozano, R.L. and Bateson, H., 2010. Economic impacts of marine litter. Kom-munenes Internasjonale Miljøorganisasjon.
Psomopoulos, C., Bourka, A. and Themelis, N.J., 2009. Waste-to-energy: A review of thestatus and benefits in usa. Waste management, 29(5), pp.1718–1724.
Robards, M., Piatt, J. and Wohl, K., 1995. Increasing frequency of plastic particles ingestedby seabirds in the subarctic north pacific. Marine Pollution Bulletin, 30, pp.151–157.
Roberts, M. and Spence, M., 1976. Effluent charges and licenses under uncertainty. Journalof Public Economics, 5, pp.193–208.
Sudhakar, M., Trishul, A., Doble, M., Kumar, K.S., Jahan, S.S., Inbakandan, D., Viduthalai,R., Umadevi, V., Murthy, P.S. and Venkatesan, R., 2007. Biofouling and biodegradationof polyolefins in ocean waters. Polymer Degradation and Stability, 92(9), pp.1743–1752.
Takehama, S., 1990. Estimation of damage to fishing vessels caused by marine debris, basedon insurance statistics. Proceedings of the second international conference on marinedebris. pp.792–809.
The Ocean Cleanup, 2014. How the oceans can clean themselves; a feasibility study.
56
Treasury, H., 2018. The green book: Central government guidance on appraisal andevaluation. 2018. London: HM Treasury.
Vatn, A. and Bromley, D.W., 1994. Choices without prices without apologies. Journal ofenvironmental economics and management, 26(2), pp.129–148.
WRAP, 2009. A financial assessment of recycling mixed plastics in the uk. Avail-able from: http://www.wrap.org.uk/sites/files/wrap/WRAP%20A%20financial%
20assessment%20of%20recycling%20mixed%20plastics%20in%20the%20UK.pdf.WRAP, 2012. Collection and sorting of household rigid plastic packaging. Available from:
http://www.wrap.org.uk/sites/files/wrap/Rigid_Plastics_Guide.pdf.WRAP, 2018. Available from: http://www.wrap.org.uk/content/plastic.Zhuang, J., Liang, Z., Lin, T. and De Guzman, F., 2007. Theory and practice in the choice
of social discount rate for cost-benefit analysis: a survey. ERD working paper series.
Appendix:
Ethics.
Ethical approval for this study required disclosing of the sources used forall the data used in this research, which is also available in the bibliographyand where indicated in text. Dr Eleonora Fichera, the Department ResearchEthics Officer approved the ethics request for this study which was confirmedby Dr Alistair Hunt, supervisor.
Replicability.
All the data used in this research are freely available from the sourcesin the bibliography. Every effort has been taken to ensure calculations areexplained adequately throughout so replication of results should not be achallenge. Differences may occur however if different figures are used for GDP,marine economy, fishing revenue, oil prices, recycled plastic prices, or differentcosts are assumed for the TOC scheme. Typically, upper and lower boundshave been estimated to mitigate this issue.
Variations on estimates in text:
57

Table 16: Economic viability of pyrolysis. An estimation of pyrolysis costs and benefits.
Pyrolysis plant data interpreted from Fivga and Dimitriou (2018). Cost of oil correct at07/2018. Recovery cost assumed to be $5.28 (for 7000t/y with base costs).
Plant capacity (kg/h) 100 1000 10,000 100,000
Pyrolysis cost ($/kg) 1.14 0.34 0.066 0.039
Total cost inc. recovery ($/kg) 6.43 5.63 5.36 5.33
Profit to sale as: residual fuel oil ($0.38/kg) -6.05 -5.25 -4.98 -4.95
Profit to sale as: heavy fuel oil ($0.46/kg) -5.97 -5.17 -4.90 -4.87
Profit to sale as: marine oil ($0.73/kg) -5.70 -4.90 -4.63 -4.60
Table 17: Valuations:
This table reports the complete range of per kilogram estimates. This is done for ease ofreference and completeness in the results. This clearly supports the conclusions from thisresearch.Scenario Price per kg Scenario Price per kg
Costs BenefitsAnnual base cost $5.17 Crowdfunding $0.31Annual best cost $4.13 Pyrolysis $0.27Annual worst cost $6.20 Waste-To-Energy $0.102NPV base 7,000 $4.19 Average Recycling $0.15NPV best 7,000 $3.35 Damages low $7.75NPV worst 7,000 $5.03 Damages low $9.30NPV base 15,000 $2.31 Damages low $11.62NPV best 15,000 $1.85 Damages medium $13.95NPV worst 15,000 $2.77 Damages medium $15.50NPV base 45,000 $1.21 Damages medium $19.37NPV best 45,000 $0.97 Damages high $23.25NPV worst 45,000 $1.45 Damages high $38.75Average cost per kg $3.22 Average benefit per kg $11.69
58

Table 18: Summary of sensitivity analysis: This table reports the range of financial
estimates under each capacity estimate and cost scenario. The finding of no financial viabilityis uniformly found.
Year Expenses Revenues NPV Loss per kg7,000 Base $293,183,787.29 $11,126,958.26 -$282,056,829.03 -$4.037,000 Best $234,547,035.02 $11,126,958.26 -$223,420,076.76 -$3.197,000 Worst $351,820,513.62 $11,126,958.26 -$340,693,555.36 -$4.8715,000 Base $345,997,566.90 $23,843,481.98 -$322,154,084.91 -$2.1515,000 Best $276,798,048.33 $23,843,481.98 -$252,954,566.34 -$1.6915,000 Worst $415,197,111.41 $23,843,481.98 -$391,353,629.43 -$2.6145,000 Base $544,049,311.76 $71,530,445.95 -$472,518,865.81 -$1.0545,000 Best $435,239,464.98 $71,530,445.95 -$363,709,019.03 -$0.8145,000 Worst $652,859,236.38 $71,530,445.95 -$581,328,790.43 -$1.29
Figure 3: Summary of sensitivity analysis This graphs Table 18 to simply show that
the scheme may potentially be financially viable if they recover 45,000 tonnes annually andhave favourable cost estimates. However, Table 18 shows that revenue would also have toraise significantly.
59

Table 19: Summary of discounting effects:
This table reports a range of discount rates applied to the NPV of both the financial andeconomic totals of the TOC scheme. From this it can be seen that discounting makes nomajor difference to the conclusions of economic but not financial viability.
Year 1% 2% 3% 4% 5%
Financial impacts
1 -$34,192,656.36 -$33,505,604.75 -$32,854,713.75 -$32,203,822.75 -$31,552,931.752 -$34,192,656.36 -$33,505,604.75 -$32,854,713.75 -$32,203,822.75 -$31,552,931.753 -$33,926,222.92 -$32,877,565.19 -$31,901,228.69 -$30,961,052.80 -$30,057,037.524 -$33,620,884.11 -$32,282,941.50 -$30,981,159.49 -$29,787,859.32 -$28,630,719.765 -$33,312,800.56 -$31,685,573.05 -$-30,130,666.77 -$28,648,081.71 -$27,273,978.496 -$33,039,505.24 -$31,086,832.24 -$29,242,641.07 -$27,543,092.34 -$25,952,025.457 -$32,762,092.81 -$30,520,134.92 -$28,422,819.47 -$26,506,307.07 -$24,734,437.128 -$32,447,147.39 -$29,915,904.61 -$27,601,625.49 -$25,504,310.04 -$23,551,637.049 -$32,165,617.84 -$29,381,250.77 -$26,813,847.38 -$24,535,728.87 -$22,438,413.4210 -$31,882,715.91 -$28,809,063.96 -$26,060,857.51 -$23,601,935.94 -$21,359,978.05
NPV -$334,786,084.04 -$320,185,121.00 -$306,584,110.43 -$293,899,788.45 -$282,056,829.03
Economic impacts
1 $63,022,794.91 $62,386,201.02 $61,813,266.52 $61,240,332.03 $60,603,738.142 $62,386,201.02 $61,176,672.64 $60,030,803.64 $58,884,934.64 $57,739,065.643 $61,813,266.52 $59,967,144.25 $58,248,340.75 $56,593,196.64 $55,001,711.924 $61,176,672.64 $58,821,275.25 $56,529,537.25 $54,428,777.42 $52,391,676.985 $60,540,078.75 $57,675,406.25 $54,938,052.53 $52,328,017.59 $49,908,960.826 $59,967,144.25 $56,529,537.25 $53,282,908.43 $50,290,917.15 $47,489,904.047 $59,394,209.75 $55,447,327.64 $51,755,083.09 $48,381,135.49 $45,261,825.448 $58,757,615.86 $54,301,458.65 $50,227,257.76 $46,535,013.21 $43,097,406.2210 $57,611,746.86 $52,200,698.82 $47,362,585.27 $43,033,746.83 $39,086,864.72
NPV $577,164,206.37 $525,578,169.86 $480,483,772.40 $441,171,004.28 $406,399,772.68
60
View publication statsView publication stats