Embed Size (px)
Citation preview

Fix ‘n Flip…by the numbers
Tom Ruff
AZREIA
May 14, 2012

In the beginning…
Tracking daily real estate transaction since 1983
Tom RuffDirector or OperationsAZ Bidder, LLC

“One way to think about it is, the longer a household formation stays down the greater the pent-up demand is, and it's like a rubber band — you keep pulling back on it. At some point, when you let it go, it's going to snap back in a very big way. So that's very likely to happen in the housing market. We can debate exactly when it happens, but happen it will.”
- Nariman Behravesh, Chief Economist of forecasting firm, IHS

“Before I tell you what I know…
…let’s go over what I don’t know”
Tom Ruff

Methodology
o Data set: June 1, 2011 thru March 31, 2012
o Flips are defined as properties purchased and resold in within a 6 month window
o SubtletiesNo cost considerationsWholesale model/Deed considerations

“The reports of my death are greatly exaggerated.”
― Mark Twain

DATE FLIPS NORMAL PERCENTAGE
Jun-11 983 10,236 10%
Jul-11 910 8,618 12%
Aug-11 941 9,028 10%
Sep-11 819 8,013 10%
Oct-11 748 7,446 10%
Nov-11 824 7,031 12%
Dec-11 962 7,927 12%
Jan-12 770 6,499 12%
Feb-12 937 7,403 13%
Mar-12 1,133 9,014 13%
TOTAL 9,027 81,215 11%
Short Term Trends Increasing

A deal is a deal wherever you find it!
SALE TYPE COUNT PERCENTAGE
3RD PARTY AUCTION 5926 66%
BANK SALE 962 11%
FANNIE MAE 520 6%
ACTIVE NOTICE 431 5%
SHORT SALE 331 4%
NOT CODED 250 3%
HUD 233 3%
NORMAL SALE 181 2%
FREDDIE MAC 170 3%
VA 17 0.19%
NEW CONSTRUCTION 6 0.07%
Speculators Returning

Standardized Breakdown
SALE TYPE COUNT PERCENTAGE
3RD PARTY AUCTION 5926 65.65
BANK SALE 1904 21.09
SHORT SALE 762 8.44
NORMAL SALE 435 4.82
TOTAL 9027 100

Sales - Median
Sales Type Median Price
Median Sold Difference Increased
Value
Normal Sales $ 70,000 $ 113,600 $ 43,600 59%
Short Sales $ 79,900 $ 120,000 $ 40,100 46%
Bank Sales $ 68,000 $ 109,900 $ 41,900 53%
Third Part Auction $ 107,000 $ 145,000 $ 38,000 39%

Sales Average
TYPE SALEPRICE APRICE DIFFERENCE COUNT INCREASED VALUE
3RD PARTY AUCTION $ 130,173 $ 171,871 $ 41,698 5926 39%
BANK SALE $ 84,211 $ 123,767 $ 39,556 1904 55%
NORMAL SALE $ 110,275 $ 153,920 $ 43,645 435 59%
SHORT SALE $ 106,633 $ 147,517 $ 40,884 762 46%

Flipper’s Target

o Flippers like a sure thing
o Over the last 10 months, “9027 Flips” have accounted for 11.11% of all sales
o 98% have had a positive return
o They know their market
o Time

Time
0 5 10 15 20 25 30 35 40 45 50 55 60 65 70 75 80 85 90 95 1001051101151201251301351401451501551601651701770
50
100
150
200
250
300
350
400
COUNT
TYPE COUNT TIME3RD PARTY AUCTION 5926 66BANK SALE 1904 90NORMAL SALE 435 69SHORT SALE 762 78
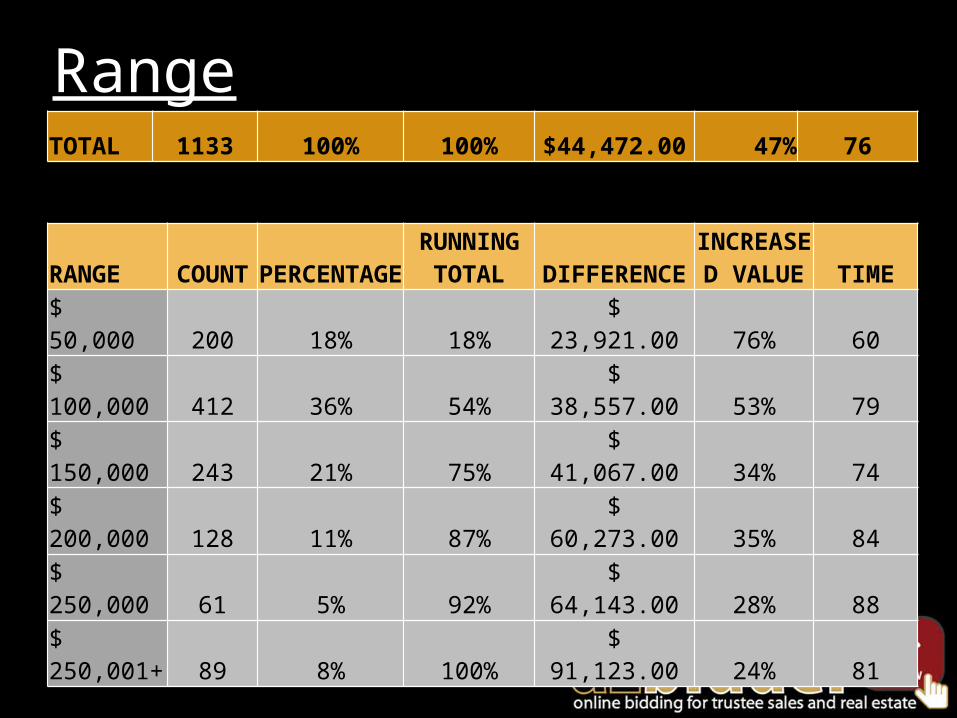
Range
RANGE COUNTPERCENT
AGERUNNING
TOT PROFIT RATIO TIME50000 200 0.1765 0.1765 23921 76% 60100000 412 0.3636 0.5401 38557 53% 79150000 243 0.2145 0.7546 41067 34% 74200000 128 0.113 0.8676 60273 35% 84250000 61 0.0538 0.9214 64143 28% 88250001+ 89 0.0786 1 91123 24% 81TOTAL 1133 1 1 44472 47% 76
RANGE COUNT PERCENTAGERUNNING
TOTAL DIFFERENCEINCREASED
VALUE TIME
$ 50,000 200 18% 18% $ 23,921.00 76% 60
$ 100,000 412 36% 54% $ 38,557.00 53% 79
$ 150,000 243 21% 75% $ 41,067.00 34% 74
$ 200,000 128 11% 87% $ 60,273.00 35% 84
$ 250,000 61 5% 92% $ 64,143.00 28% 88
$ 250,001+ 89 8% 100% $ 91,123.00 24% 81
TOTAL 1133 100% 100% $44,472.00 47% 76

Tidbits: Purchases 93% cash or hard money
On the flip side 65% are financed
The median price paid at auction by flippers is $10,000 higher than the median price of all homes purchased at auction, $107,000 compared to $97,000
April flips were 13% of the normal market
Prices continue to move up in May

Ancient History
Normal Short Bank 3rd Party Auctions
10 Months 30 Days 10 Months 30 Days 10 Months 30 Days 10 Months 30 Days
Average $ 43,645 $ 47,627 $ 40,884 $ 43,887 $ 39,556 $43,845 $ 41,698 $ 44,402
Increased Value 59% 69% 46% 52% 55% 60% 39% 40%

Single Family Residence
Recorded 5/10/2012
TYPE INCREASED
VALUEPURCHASE
PriceSOLD Price
ASSESSED Value DAYS ZIP LOT
SQFT POOL SQ_FT YEARBUILT
NORMAL SALE $ 56,000 $ 129,000 $ 185,000 $ 119,200 49 85023 6550 Y 1637 1997
3RD PARTY AUCTION $ 72,400 $ 47,500 $ 119,900 $ 32,100 71 85035 7728 N 1812 1971
SHORT SALE $ 59,000 $ 53,000 $ 112,000 $ 49,000 34 85037 6508 N 1455 1993
SHORT SALE $104,900 $ 225,000 $ 329,900 $ 203,000 104 85050 6985 Y 1834 1996
3RD PARTY AUCTION $ 91,000 $ 44,000 $ 135,000 $ 59,100 87 85204 7745 N 1224 1970
3RD PARTY AUCTION $ 59,500 $ 97,500 $ 157,000 $ 99,600 86 85205 8481 N 1643 1988
NORMAL SALE $ 80,000 $ 75,000 $ 155,000 $ 87,500 91 85210 8538 N 1244 1976
SHORT SALE $ 57,250 $ 105,000 $ 162,250 $1 09,700 113 85224 7701 Y 1973 1971
BANK SALE $ 67,201 $ 109,699 $ 176,900 $ 122,800 48 85234 8512 Y 1707 1993
NORMAL SALE $ 84,000 $ 155,000 $ 239,000 $ 162,600 65 85254 10676 N 1785 1969
BANK SALE $ 81,750 $ 56,500 $ 138,250 $ 76,800 101 85308 9506 N 1385 1974
3RD PARTY AUCTION $ 57,450 $ 192,500 $249,950 $155,200 56 85340 8627 N 3906 2002

Recorded 5/10/2012
13026 W ALEGRE DR LITCHFIELD PARK, AZ 85340Purchase Price: $192,500Sold Price: $249,950Spread: $57,4503rd Party Auction: 56 Days on Market
4419 E JAEGER PHOENIX AZ 85050Purchase Price: $225,000Sold Price: $329,900Spread: $104,900Short Sale: 104 Days on Market
6507 E ENCANTO ST Purchase Price: $ 97500
Sold Price: $ 157,000Spread: $59,500
3rd Party Auction: 56 Days on

“A deal is a deal is a damn deal.”
- Tom Ruff
Thank you!