Embed Size (px)
Citation preview

MnDOT Flash Flood Vulnerability and Adaptation Assessment Pilot Project
DISTRICT 1 VULNERABILITY ASSESSMENT
NOVEMBER 2014

PAGE 2 MNDOT FLASH FLOOD VULNERABILITY AND ADAPTATION ASSESSMENT PILOT REPORT
This document is part of a series of short reports based on the full Flash Flood Vulnerability and Adaptation Assessment Pilot Project.
This report was developed by the Minnesota Department of Transportation in accordance with a grant from the Federal Highway Administration (FHWA). The statements, findings, conclusions and recommendations are those of the author(s) and do not necessarily reflect the views of FHWA or the U.S. Department of Transportation.
The project was managed by the following staff from the Minnesota Department of Transportation: Bryan Anderson, Sara Dunlap, Marylin Jordahl-Larson, Gregory Pates, Philip Schaffner and Mark SchoenfelderThe full report was prepared by Parsons Brinckerhoff with contributions from Catalysis Adaptation Partners, LLC.

DISTRICT 1 VULNERABILITY ASSESSMENT PAGE 3
SYSTEM-WIDE VULNERABILITY ASSESSMENT - MNDOT DISTRICT 1Introduction
Minnesota’s climate is changing. Extreme precipitation events and associated flooding are becoming more frequent and severe.
Flooding presents a challenge to fulfilling the Minnesota Department of Transportation’s mission to, “Plan, build, operate, and maintain a safe, accessible, efficient, and reliable multimodal transportation system...” When roads become inundated, the safety of motorists can be threatened, efficiency is reduced by the need to take detours, and system reliability is compromised.
This document discusses the system-wide vulnerability assessment in District 1. This assessment was part of a broader pilot project investigating the vulnerability of highway infrastructure to climate change in two of MnDOT’s eight districts. All components of the pilot project are available at www.mndot.gov/climate and are described in the project’s executive summary.
The system-wide vulnerability assessment used the Federal Highway Administration’s Climate Change and Extreme Weather Vulnerability Assessment Framework1 (the “Framework”) as a guide. The Framework is comprised of three primary steps:
1. Define the scope2. Assess vulnerability3. Integrate into decision-making
The first step of the vulnerability assessment, scope definition, involved articulating the objective of the study: to identify MnDOT facilities with the greatest vulnerability to flash flooding so that efforts can be made to prioritize adaptation actions that will increase the system’s resiliency. It also involved discussions on which assets should be included in the study. Section 1 below provides more detail on the specific asset types selected for evaluation.
After the scope had been defined, the next step in the Framework was to assess vulnerability. Section 2 describes how this was done consistent with the definition of vulnerability provided in the Framework report. Section 3 then presents the results of the vulnerability assessment.
Section 1: Selection of Assets
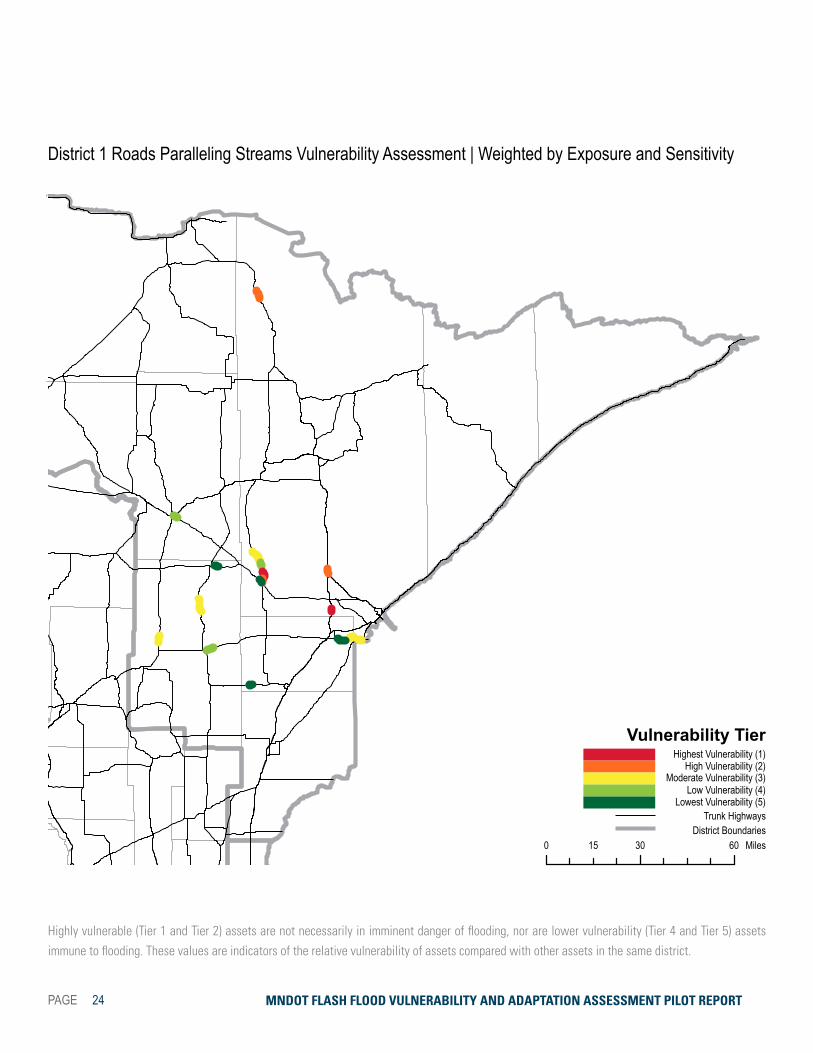
The state’s trunk highway system was the roadway network selected for analysis in each district. The trunk highway system comprises the entirety of the state owned and maintained road infrastructure and includes all interstates, US routes, and signed state roads. Figure 1 shows the trunk highway system in District 1. This study considered 140 bridges, 160 large culverts, 543 pipes, and 18 roads paralleling streams in District 1.https://www.fhwa.dot.gov/environment/climate_change/adaptation/publications_and_tools/vulnerability_assessment_framework/

PAGE 4 MNDOT FLASH FLOOD VULNERABILITY AND ADAPTATION ASSESSMENT PILOT REPORT
Section 2: Methodology
A methodology was developed that balances the need for a detailed assessment of facility performance rooted in engineering principles with the requirement that the assessment be applied en masse to thousands of assets. The approach taken, illustrated in Figure 2, involves developing a series of vulnerability metrics for each asset, combining them mathematically into a single vulnerability score, and ranking and classifying those scores to identify the most vulnerable facilities. The final results show the vulnerability of each asset relative to other assets in the same district. The following sub-sections describe the details of the approach.
Figure 1: District 1 Trunk Highway System

DISTRICT 1 VULNERABILITY ASSESSMENT PAGE 5
Section 2: Methodology
A methodology was developed that balances the need for a detailed assessment of facility performance rooted in engineering principles with the requirement that the assessment be applied en masse to thousands of assets. The approach taken, illustrated in Figure 2, involves developing a series of vulnerability metrics for each asset, combining them mathematically into a single vulnerability score, and ranking and classifying those scores to identify the most vulnerable facilities. The final results show the vulnerability of each asset relative to other assets in the same district. The following sub-sections describe the details of the approach.
VULNERABILITY DEFINITIONThe system-wide vulnerability scoring was conducted in accordance with the definition of vulnerability offered in the Framework document. FHWA defines vulnerability as being comprised of three components:
• Exposure: The degree to which an asset may be affected by a climate stressor.
• Sensitivity: How well an asset impacted by a climate stressor is able to cope with the impacts.
• Adaptive Capacity: How resilient the transportation system as a whole is if the asset were to be taken out of service.
A series of metrics were created to capture each of the three components of vulnerability and are described in detail below.
METRICSEach asset type has a unique set of metrics tailored to the factors important to understanding its vulnerability. For example, scour ratings are important to understanding the sensitivity of bridges to flooding but are not relevant to pipes. Table 1 provides a list of the metrics used for each asset type in the study, a description of each metric, why they were included in the study, and how they were generated. For consistent scoring purposes, the metrics were set up so that higher values are indicative of greater vulnerability.
Figure 2: Approach to Flood Vulnerability Analysis

PAGE 6 MNDOT FLASH FLOOD VULNERABILITY AND ADAPTATION ASSESSMENT PILOT REPORT
Note that there is no metric explicitly capturing exposure to future precipitation changes or flooding. A metric capturing differences in projected future 24-hour precipitation depths within each asset’s drainage area was considered, however, the project’s Climate Advisory Committee felt that any variations in climate model projections across an area as small as a district would not be reliable. Thus, the assessment took a sensitivity based approach to capturing vulnerability asking, “Given what we know about each asset and its environmental setting, what percentage change in the design storm would be required to overtop the roadway?” All other metrics being equal, assets that required less of a change in design flow to overtop were considered more vulnerable to potential increases in precipitation.
Development of the metrics was a large undertaking. While some of the metrics were available directly from MnDOT databases, other metrics required intensive GIS processing to generate. Some of the most important metrics to the analysis (e.g. the percentage change in design flow required for overtopping) were developed with the aid of a hydraulics tool developed as part of this project. The tool draws upon MnDOT databases, LIDAR derived elevation information, current peak flow values obtained from the U.S. Geological Survey’s StreamStats program, and standard hydraulics formulas in order to estimate the percent change in flow required to overtop the facility, stream velocities at peak flows, and other important measures.
!!
!!!!
!
!
!!
!
!
!
!!
!
!
!
#
#
#
#
#
#
#
XXXX
X
X
X
XX
XX
XX
XX
X
X
X
XX
X
XXXXX
XX
XX
X
X
X
X
X
X
X
XX
XXX
X
X
XX
X
X
XX
X
X
X
X
X
XX
XX
XX
MN
1
US
53
I35
MN61
US2
MN
6
US71
MN1
MN6
5
MN23
MN46
MN
38
US
169
MN
73
MN210
MN18
MN27
MN48
MN
47
MN200
MN37
MN70
MN
135
MN217
I35
Saint Louis
Itasca
Lake
Cass
Aitkin
Pine
Cook
Koochiching
Morrison
Carlton
Crow Wing
Beltrami
Kanabec
Mille Lacs
BentonStearns
Lake of the Woods
Isanti Chisago
Hubbard
Hibbing
DuluthCloquet
Hermantown
Virginia
Grand Rapids
InternationalFalls
X Bridge or Culvert Risk Area
# Debris Area
! Shoulder or Slope Failure Area
! Road Overtopping
Trunk Highway
District 1
¹
30 0 3015 Miles
Figure 3: Locations of previous flooding identified by District staff

DISTRICT 1 VULNERABILITY ASSESSMENT PAGE 7
Table 1: Description and Summary of Metrics Used to Quantify Flood Vulnerability
Metric Description Rationale for Inclusion Data Source
Asset Type Applied To
BridgesLarge
CulvertsPipes
Roads Paralleling Streams
Exposure
Stream velocity
The velocity of the stream at peak design flow (50-year storm) or at overtopping flow (if it’s return period is less than 50-years)
Higher velocity flows are capable of producing greater damage to infrastructure
Hydraulic analysis
X X X X
Previous flooding issues
Indicator of whether previous flooding was reported at the facility in the last 20 years
Existing flooding hotspots are known vulnerabilities and a priority for adaptive actions
Work sessions with district staff
X X X X
Belt width1 to span length ratio
The ratio of the maximum stream meander belt width near the structure to the structure’s total span length
Higher ratios are indicative of spans that could be at greater risk of erosion as the stream shifts course over time
GIS analysis & MnDOT databases
X X X
Belt width to floodplain width ratio
The ratio of the maximum stream meander belt width near the segment to the floodplain width at the segment
Higher ratios are indicative of roads that could be at greater risk of erosion as the stream shifts course over time
GIS & hydraulic analyses
X
Percent of total segment length at risk of erosion from the stream channel
The percentage of the roadway segment within 200 ft. of the stream channel
Roads closer to the stream channel are more exposed to erosion during flood events
GIS analysis X
Percent forest land cover in the drainage area
The percentage of forest land cover within the drainage area of each facility.
More woodlands in the drainage area increases the possibility of woody debris getting lodged underneath the facility and causing damage
GIS analysis X X X
Percent of drainage area not covered by lakes and wetlands
The percentage of each facility’s drainage area that is not covered by lakes and wetlands
Fewer lakes and wetlands means less water storage and more runoff and flooding
GIS analysis X X X X
Percent urban land cover in the drainage area
The percentage of each facility’s drainage area that is covered by urbanized land cover
More impervious urban land cover leads to more runoff and flooding
GIS analysis X X X X
1: Belt width refers to the lateral width of stream meanders

PAGE 8 MNDOT FLASH FLOOD VULNERABILITY AND ADAPTATION ASSESSMENT PILOT REPORT
Metric Description Rationale for Inclusion Data Source
Asset Type Applied To
BridgesLarge
CulvertsPipes
Roads Paralleling Streams
Sensetivity
Percent change in peak design flow required for overtopping
The percentage change in the design flow (50-year storm) required to overtop the facility
The smaller the change necessary to overtop the facility, the more sensitive the facility is to increases in flood elevations due to climate change
Hydraulic analysis
X X X X
Pavement condition
The ride quality index value at the sump (lowest point) of the roadway segment
Pavement that is in poor condition is more prone to being uplifted and washed away during flood events
MnDOT databases
X
Scour rating MnDOT scour rating valueBridges that have current scour issues are more prone to damage during flood events
MnDOT databases
X
Substructure condition rating
National Bridge Inventory substructure condition rating
Bridges with substructures that are in poor condition are more prone to damage during flood events
MnDOT databases
X
Channel condition rating
National Bridge Inventory channel condition rating
Facilities with poor channel conditions in the vicinity of the structure are more prone to damage during flood events
MnDOT databases
X X
Culvert condition rating
National Bridge Inventory culvert condition rating
Culverts that are in poor condition are more prone to damage during flood events
MnDOT databases
X
Pipe condition rating
MnDOT pipe condition ratingPipes that are in poor condition are more prone to damage during flood events
MnDOT databases
X
Adaptive Capacity
Average annual daily traffic
The average annual daily traffic using the facility as of the latest available date
Provides an indication of the number of motorists affected if a flood event were to occur
MnDOT databases
X X X X
Heavy commercial average daily traffic
The average daily truck traffic using the facility as of the latest available date
Provides an indication of the disruption to freight flows if a flood event were to occur
MnDOT databases
X X X X
Detour length
The additional travel distance required to bypass the affected facility using approved detour routes2
Provides an indication of system redundancy in the event of a road closure caused by flooding
GIS analysis X X X X
Flow control regime
An indicator of whether the facility is inlet or outlet controlled
Outlet controlled facilities will be more difficult to adapt than inlet controlled facilities
Hydraulic analysis
X X X
2: For the purposes of the analysis, approved detour routes consisted of other trunk roads and paved county and state aid roadways

DISTRICT 1 VULNERABILITY ASSESSMENT PAGE 9
SCORING
Once all the metrics had been calculated, the next step was to combine the information into a single overarching vulnerability score for each asset. Table 2 (page 10) provides an example of how the calculations are made for a hypothetical large culvert and is a useful reference throughout this section. As part of this process, each of the metrics was re-scaled to a common 0 to 100 point scale with 0 assigned to the facility with the lowest (least vulnerable) score for a given metric in that district and 100 assigned to the facility with the highest (most vulnerable) score for that metric in that district. This scaling was done for each of the metrics independently. Categorical metrics were manually assigned scaled values based on input provided by the project’s Technical Advisory Committee (TAC).
After scaling was complete, the project team worked with the TAC to weight each metric so that those metrics perceived as being more important to characterizing vulnerability could be factored more heavily into the final scores. Table 3 (page 11) shows the weights that were employed for each measure. The weights were defined as percentages such that the weights for all of the metrics under a given asset class must add up to 100 within each component of vulnerability (exposure, sensitivity, adaptive capacity). For example, all of the weights for the exposure metrics for bridges must add to 100, all of the weights for the sensitivity metrics for bridges must add to 100, all of the weights for the exposure metrics for pipes must add to 100, etc.
The weights were then multiplied by the value of each metric and combined into a series of interim scores summarizing each asset’s exposure, sensitivity, and adaptive capacity (shown in the light orange shaded cells in Table 2, page 10). Another round of weighting was then undertaken amongst these three interim scores to allow some components of vulnerability to more heavily influence the final asset score than others. After discussions with the TAC, however, it was decided that each vulnerability component should factor equally into the final score for bridges, large culverts, and pipes. Thus, each of the three vulnerability components received an equal weight (33.3 percent) for these assets. For roads paralleling streams, it was decided that exposure should be given the highest weight (43.3 percent) followed by adaptive capacity (33.3 percent) and sensitivity (23.3 percent).
An additional analysis was conducted after the completion of the full report that used only exposure and sensitivity metrics. This analysis better isolates assets that are more at risk of flooding (regardless of role within the network). Appendix B shows how removing traffic volume dependent adaptive capacity considerations affected an asset’s tier (higher tier refers to greater vulnerability).
The final output of the scoring process was an overall vulnerability score for each facility (shown in the dark orange shaded cell in Table 2). These scores are rankable such that one could list, for example, the most to least vulnerable

PAGE 10 MNDOT FLASH FLOOD VULNERABILITY AND ADAPTATION ASSESSMENT PILOT REPORT
bridges in each district. However, given some of the generalizations that were necessary to develop the metrics, there was a concern that the differences between individual scores may not be meaningful and within the margins of error involved in the analysis. Therefore, it was felt that the most appropriate means of presenting the results would be to group assets with similar scores into classes, or tiers, of vulnerability.
Table 2: Example Vulnerability Scoring Process for a Hypothetical Large Culvert
VariableValue for the
Example Asset
Range of Values Across All Assets Scaled Value for the Example Asset (0-100)
Variable Weight ScoreLow High
Sensitivity
% change in design flow required for overtopping
-18.00% -78.00% 2375.00% 98 60% 58.5
Channel condition rating 6 – – 50 15% 7.5
Culvert condition rating 5 – – 50 25% 12.5
Sum of Sensitivity Variable Scores: 78.5
Sensitivity Weight: 33%
Final Sensitivity Score: 25.9
Exposure
Stream velocity 7.01 0.74 37.53 17 20% 3.4
Previous flooding issues 1 0 1 100 35% 35.0
Belt width to span length ratio 3.68 0.32 209.24 2 10% 0.2
% forest land cover in drainage area
1.85% 0.00% 91.23% 2 10% 0.2
% of drainage area not lakes and wetlands
99.91% 97.71% 100.00% 96 10% 9.6
% drainage area urban land cover
4.00% 0.00% 53.52% 7 15% 1.1
Sum of Exposure Variable Scores: 49.5
Exposure Weight: 33%
Final Exposure Score: 16.3
Adaptive Capacity
Average Annual Daily Traffic (AADT)
5,700 90 49,200 11 35% 4.0
Heavy Commercial Average Daily Traffic (HCADT)
610 5 5,900 10 25% 2.6
Detour Length 0.6 -0.37 20 4 35% 1.3
Flow control regime 0 0 1 0 5% 0.0
Sum of Adap. Cap. Variable Scores: 7.8
Adaptive Capacity Weight: 33%
Final Adaptive Capacity Score: 2.6
OVERALL VULNERABILITY SCORE: 45
DISTRICT 1 VULNERABILITY ASSESSMENT PAGE 11
Five tiers of vulnerability were developed:
• Tier 1: Highest vulnerability
• Tier 2: High vulnerability
• Tier 3: Moderate vulnerability
• Tier 4: Low vulnerability
• Tier 5: Lowest vulnerability
The data was classified using the Jenks natural breaks method, which searches for statistical clusters in the data distribution and puts class boundaries around those clusters. The classification was performed using the values for all asset types within the district so that the most vulnerable facilities, regardless of type, showed up as being the most vulnerable. This approach allows for the possibility (unlikely as it is) that all the Tier 1 assets in a district may, for example, be pipes and not other asset types.
Table 3: Weights Assigned by Metric
Metric
Asset Type Applied To
Bridges Large Culverts PipesRoads Paralleling
Streams
Exposure
Stream velocity 20% 20% 20% 10%
Previous flooding issues 35% 35% 35% 30%
Belt width1 to span length ratio 10% 10% 10% –
Belt width to floodplain width ratio – – – 10%
Percent of total segment length at risk of erosion from the stream channel
– – – 25%
Percent forest land cover in the drainage area2 10% 10% 10% –
Percent of drainage area not covered by lakes and wetlands 10% 10% 10% 10%
Percent urban land cover in the drainage area 15% 15% 15% 15%
TOTAL 100% 100% 100% 100%
Sensitivity
Percent change in peak design flow required for overtopping 60% 60% 60% 70%
Pavement condition – – – 30%
Scour rating 25% – – –
Substructure condition rating 5% – – –
Channel condition rating 10% 15% – –
Culvert condition rating – 25% – –
Pipe condition rating – – 40% –
TOTAL 100% 100% 100% 100%
Adaptive Capacity
Average annual daily traffic 35% 35% 35% 35%
Heavy commercial average daily traffic 25% 25% 25% 30%
Detour length 35% 35% 35% 35%
Flow control regime 5% 5% 5% –
TOTAL 100% 100% 100% 100%

PAGE 12 MNDOT FLASH FLOOD VULNERABILITY AND ADAPTATION ASSESSMENT PILOT REPORT
When interpreting the results, it is important to be aware that highly vulnerable (Tier 1 and Tier 2) assets are not in imminent danger of flooding. Nor are lower vulnerability (Tier 4 and Tier 5) assets immune to flooding. Instead, the values should be interpreted as indicators of the relative vulnerability of assets compared with others in the same district (not between the two districts). The decision was made to set the analysis up in this manner for the following reasons:
• Many important aspects of long range and capital planning occur at the district level. It is helpful to have a summary of the greatest vulnerabilities by district to inform these activities.
• In the future, additional districts around the state may have similar vulnerability assessments completed. If the analysis was set up to compare results between districts, new results would need to be generated for all districts based on the updated vulnerability assessments.
If vulnerability assessments are completed for all districts in the future, a separate statewide vulnerability scoring exercise could be conducted to identify which portions of the state have the highest vulnerabilities overall. As an example, these findings could then be used, to allocate more flood adaptation funding to the districts having the highest overall vulnerability levels.
Section 3: Findings
Figures 4 and 5 provide graphs showing the breakdown of asset types within each vulnerability tier in District 1 with and without adaptive capacity considerations, respectively. Bridges and pipes had the greatest proportions of highly vulnerable Tier 1 and Tier 2 assets, although the proportions of most vulnerable assets were fairly comparable across all asset types. Figures 6 and 7 show the same information presented in terms of the number of assets by tier.
Appendix A contains a suite of maps displaying the locations of assets and their vulnerability tiers. Overall, vulnerabilities tend to be highest for facilities along MN 61, following the shoreline of Lake Superior from Duluth to the Canadian border. This roadway has limited redundancy and crosses many high velocity streams that flow from the Superior Uplands into the lake. That said, high vulnerability facilities are located throughout the district. Appendix B contains maps that display vulnerability data when adaptive capacity weights are removed.
Additional Information
More information about the pilot project including case studies and proposed adaptation options can be found at www.mndot.gov/climate.
100%
90%
80%
70%
60%
50%
40%
30%
20%
10%
0%PipesCulvertBridgeRoads Paralleling
StreamsTier 1 Tier 2 Tier 3 Tier 4 Tier 5
100%
90%
80%
70%
60%
50%
40%
30%
20%
10%
0%
Tier 1 Tier 2 Tier 3 Tier 4 Tier 5
PipesCulvertBridgeRoads Paralleling Streams
DISTRICT 1 VULNERABILITY ASSESSMENT PAGE 13
When interpreting the results, it is important to be aware that highly vulnerable (Tier 1 and Tier 2) assets are not in imminent danger of flooding. Nor are lower vulnerability (Tier 4 and Tier 5) assets immune to flooding. Instead, the values should be interpreted as indicators of the relative vulnerability of assets compared with others in the same district (not between the two districts). The decision was made to set the analysis up in this manner for the following reasons:
• Many important aspects of long range and capital planning occur at the district level. It is helpful to have a summary of the greatest vulnerabilities by district to inform these activities.
• In the future, additional districts around the state may have similar vulnerability assessments completed. If the analysis was set up to compare results between districts, new results would need to be generated for all districts based on the updated vulnerability assessments.
If vulnerability assessments are completed for all districts in the future, a separate statewide vulnerability scoring exercise could be conducted to identify which portions of the state have the highest vulnerabilities overall. As an example, these findings could then be used, to allocate more flood adaptation funding to the districts having the highest overall vulnerability levels.
Section 3: Findings
Figures 4 and 5 provide graphs showing the breakdown of asset types within each vulnerability tier in District 1 with and without adaptive capacity considerations, respectively. Bridges and pipes had the greatest proportions of highly vulnerable Tier 1 and Tier 2 assets, although the proportions of most vulnerable assets were fairly comparable across all asset types. Figures 6 and 7 show the same information presented in terms of the number of assets by tier.
Appendix A contains a suite of maps displaying the locations of assets and their vulnerability tiers. Overall, vulnerabilities tend to be highest for facilities along MN 61, following the shoreline of Lake Superior from Duluth to the Canadian border. This roadway has limited redundancy and crosses many high velocity streams that flow from the Superior Uplands into the lake. That said, high vulnerability facilities are located throughout the district. Appendix B contains maps that display vulnerability data when adaptive capacity weights are removed.
Additional Information
More information about the pilot project including case studies and proposed adaptation options can be found at www.mndot.gov/climate.
100%
90%
80%
70%
60%
50%
40%
30%
20%
10%
0%PipesCulvertBridgeRoads Paralleling
StreamsTier 1 Tier 2 Tier 3 Tier 4 Tier 5
100%
90%
80%
70%
60%
50%
40%
30%
20%
10%
0%
Tier 1 Tier 2 Tier 3 Tier 4 Tier 5
PipesCulvertBridgeRoads Paralleling Streams
Figure 4: Vulnerability by Asset Type, District 1
Figure 5: Vulnerability by Asset Type (Exposure & Sensitivity only) District 1

PAGE 14 MNDOT FLASH FLOOD VULNERABILITY AND ADAPTATION ASSESSMENT PILOT REPORT
300
350
400
250
200
150
100
50
0
Pipes Culverts Bridges Roads Paralleling Streams
Tier 1 Tier 2 Tier 3 Tier 4 Tier 5
300
350
400
250
200
150
100
50
0Tier 1 Tier 2 Tier 3 Tier 4 Tier 5
Pipes Culverts Bridges Roads Paralleling Streams
Figure 6: Vulnerability Tiers by Type, District 1
Figure 7: Vulnerability Tiers by Type (Exposure & Sensitivity only) District 1

DISTRICT 1 VULNERABILITY ASSESSMENT PAGE 15
Highly vulnerable (Tier 1 and Tier 2) assets are not necessarily in imminent danger of flooding, nor are lower vulnerability (Tier 4 and Tier 5) assets immune to flooding. These values are indicators of the relative vulnerability of assets compared with other assets in the same district.
!(!(
!(
!(
!(
!(
!( !(!(!(!( !(
!( !(!(
!(!(!(!(
!(!(!(
!(!(!(!(
!(
!(!(
!( !(!(!(!( !(
!(!(!(!(
!(!(!(!(
!(!(!(!( !(!(
!(!(!(
!(!(
!(
!(
!(!(!(
!(
!(
!(!(
!(!(!(!(
!(!(
!(
!(
!(!(!(!(!(
!( !(!( !(!(!(
!(!(!(
!(
!(!( !( !(
!(
!(!(!(!(!(
!(
!(
!(!(
!( !(!(!(!( !(!(!(
!( !(
!(!(
!(!(!(!(!(
!(
!(!(!(
!(
!(!(
!(!(
!(
!(
!(!(!(!(
!(!( !( !(!(!(
!(
!(!(
!(
!(!(
!(
!( !(!(
!(!(!(!(
!(
!(
!(!(!(
!(
!(!(
!(
!(
!(!(!(!(
!(!(!(
!(
!(
!(!(
!(!(!(!(!(!(
!(
!( !(
!(
!(!(!( !(!(!(!(!(
!(!(
!(!(!(!(
!(
!(!(!(
!(
!(!(
!(!(!(
!(
!(!(
!(
!(!(!(
!(!(!(!(!(
!(!(!(!(!(!(
!(!(
!(!(!(!(
!(
!(!(!(!(!(
!(
!(!(
!(!(
!(!(
!(
!(
!(!(
!(!(!( !(!(
!(
!(
!(!( !(
!(!( !(!(!(
!(
!(
!(
!(!(
!(
!(!(!(!(
!( !(
!(
!(!(!(
!(!(!(
!(
!(!(
!(
!(!(
!(!(!(!(!(
!(!(!(
!(!(
!(!( !(!(!(!(!(
!(!(
!(!(
!(!(
!(
!(!( !(!(
!(
!(
!(
!(!(!(
!(!(!(!(!(!(
!(!(
!(!(!(!(!(!(
!(
!(
!(!(
!(!(
!(
!(
!(
!(!(!(!(!(
!(!(!(!(
!(
!(
!(
!(
!(
!(
!(
!(!(!(!(!(
!(
!(
!(
!(
!(
!(
!(!(
!(!(!(!(!(
!(
!(
!(!(!(
!(
!(!(
!( !(!(
!(
!(
!(!(
!(
!(
!(
!(
!(
!(!(!(!(!(!(!(!(!(!(!(!(!(!(
!(
!(
!(!(!(
!(!(
!(
!(!(
!(!(
!(!(!(
!(!(!(!(
!(
!(
!(
!(
!(!(
!(
!(
!(
!(!(!(!(!(!(!(!(
!(!(
!(!(
!(
!(
!(!(!( !(
!(!(!(!(!(!(
!(!(
!(
!(!(!(
!(!(
!(
!(!(!(!(!(!(!(
!(
!(!(!(
!(
!(!(!(!(
!(
!(
!(
!(
!(
!(
!(
!(
!(
!(
!(!(!(
!(
!(!(
!(!(!(!(
!(!(!(!(!(
!(
!(
!(
!(
!(!(
!(!(!(
!(
!(!(!(
!(
!(!(!(!(!(!(!( !(
!(!(
!(!(!(
!(
#*
#*#*
#* #*
#*
#*#*#*
#*
#*
#*#*#*#* #*
#*
#*#* #* #*#*#*#* #*#*#*
#*#*#*#* #*#*#*
#* #*#* #*#*#* #*#* #*#* #*#* #*#*#*
#*#* #*
#*
#*#*
#*#*
#*#*
#*#*
#*
#*
#*#* #*#*#* #*#*
#*#*#*#*#*
#*#*#* #*#*#* #*#* #*#* #*#*
#*
#*#*#* #*#*
#* #*#*#* #*#*
#*#*#*#*
#* #*#*#* #*
#*#* #*#*#* #*#*#*#*
#* #*#*#*
#* #*#*#*#*
#*#*
#*#*
#*#*#*
#*#* #*
#*
#* #*#*#*#*#*#*#*
#*#* #*#* #*#*#*#*
#*#*#*#*
#*#*#*
")")
")") ")")")
")") ")")
")")")
")
")
")")") ")")")")")")
")")")")")")
") ")")
")
")
")
")")") ")
")
") ")
")
")")")")
")")
")")
")")")")
")")")
")")")")
")
")")") ")")
")
") ")
")")
")")
")
")
")") ")")")
")") ")")
")
")")
")")")")")")
") ")")")")")
")") ")")")")
")
")")")
")
")") ")
")
")
")
")
")")")
")
")")
")")") ")
")
")") ") ")
")") ")")
Highest Vulnerability (1)High Vulnerability (2)
Moderate Vulnerability (3)Low Vulnerability (4)
Lowest Vulnerability (5)
Vulnerability Tier
Asset Type
Trunk HighwaysDistrict Boundaries
District 1 Asset Vulnerability Assessment | Weighted by Exposure, Sensitivity & Adaptive Capacity
0 30 6015 Miles
Bridges
Pipes
Culverts
Roads Paralleling Streams
APPENDIX A | ASSET VULNERABILITY (EXPOSURE, SENSITIVITY & ADAPTIVE CAPACITY)

PAGE 16 MNDOT FLASH FLOOD VULNERABILITY AND ADAPTATION ASSESSMENT PILOT REPORT
Highly vulnerable (Tier 1 and Tier 2) assets are not necessarily in imminent danger of flooding, nor are lower vulnerability (Tier 4 and Tier 5) assets immune to flooding. These values are indicators of the relative vulnerability of assets compared with other assets in the same district.
")")
")") ")")")
")") ")")
")")")
")
")
")")") ")")")")")")
")")")")")")
") ")")
")
")
")
")")") ")
")
") ")
")
")")")")
")")
")")
")")")")
")")")
")")")")
")
")")") ")")
")
") ")
")")
")")
")
")
")") ")")")
")") ")")
")
")")
")")")")")")
") ")")")")")
")") ")")")")
")
")")")
")
")") ")
")
")
")
")
")")")
")
")")
")")") ")
")
")") ") ")
")") ")")
Highest Vulnerability (1)High Vulnerability (2)
Moderate Vulnerability (3)Low Vulnerability (4)
Lowest Vulnerability (5)
Vulnerability Tier
Trunk HighwaysDistrict Boundaries
District 1 Bridge Vulnerability Assessment | Weighted by Exposure, Sensitivity & Adaptive Capacity
0 30 6015 Miles

DISTRICT 1 VULNERABILITY ASSESSMENT PAGE 17
Highly vulnerable (Tier 1 and Tier 2) assets are not necessarily in imminent danger of flooding, nor are lower vulnerability (Tier 4 and Tier 5) assets immune to flooding. These values are indicators of the relative vulnerability of assets compared with other assets in the same district.
#*
#*#*
#* #*
#*
#*#*#*
#*
#*
#*#*#*#* #*
#*
#*#* #* #*#*#*#* #*#*#*
#*#*#*#* #*#*#*
#* #*#* #*#*#* #*#* #*#* #*#* #*#*#*
#*#* #*
#*
#*#*
#*#*
#*#*
#*#*
#*
#*
#*#* #*#*#* #*#*
#*#*#*#*#*
#*#*#* #*#*#* #*#* #*#* #*#*
#*
#*#*#* #*#*
#* #*#*#* #*#*
#*#*#*#*
#* #*#*#* #*
#*#* #*#*#* #*#*#*#*
#* #*#*#*
#* #*#*#*#*
#*#*
#*#*
#*#*#*
#*#* #*
#*
#* #*#*#*#*#*#*#*
#*#* #*#* #*#*#*#*
#*#*#*#*
#*#*#*
Highest Vulnerability (1)High Vulnerability (2)
Moderate Vulnerability (3)Low Vulnerability (4)
Lowest Vulnerability (5)
Vulnerability Tier
Trunk HighwaysDistrict Boundaries
District 1 Culvert Vulnerability Assessment | Weighted by Exposure, Sensitivity & Adaptive Capacity
0 30 6015 Miles

PAGE 18 MNDOT FLASH FLOOD VULNERABILITY AND ADAPTATION ASSESSMENT PILOT REPORT
Highly vulnerable (Tier 1 and Tier 2) assets are not necessarily in imminent danger of flooding, nor are lower vulnerability (Tier 4 and Tier 5) assets immune to flooding. These values are indicators of the relative vulnerability of assets compared with other assets in the same district.
!(!(
!(
!(
!(
!(
!( !(!(!(!( !(
!( !(!(
!(!(!(!(
!(!(!(
!(!(!(!(
!(
!(!(
!( !(!(!(!( !(
!(!(!(!(
!(!(!(!(
!(!(!(!( !(!(
!(!(!(
!(!(
!(
!(
!(!(!(
!(
!(
!(!(
!(!(!(!(
!(!(
!(
!(
!(!(!(!(!(
!( !(!( !(!(!(
!(!(!(
!(
!(!( !( !(
!(
!(!(!(!(!(
!(
!(
!(!(
!( !(!(!(!( !(!(!(
!( !(
!(!(
!(!(!(!(!(
!(
!(!(!(
!(
!(!(
!(!(
!(
!(
!(!(!(!(
!(!( !( !(!(!(
!(
!(!(
!(
!(!(
!(
!( !(!(
!(!(!(!(
!(
!(
!(!(!(
!(
!(!(
!(
!(
!(!(!(!(
!(!(!(
!(
!(
!(!(
!(!(!(!(!(!(
!(
!( !(
!(
!(!(!( !(!(!(!(!(
!(!(
!(!(!(!(
!(
!(!(!(
!(
!(!(
!(!(!(
!(
!(!(
!(
!(!(!(
!(!(!(!(!(
!(!(!(!(!(!(
!(!(
!(!(!(!(
!(
!(!(!(!(!(
!(
!(!(
!(!(
!(!(
!(
!(
!(!(
!(!(!( !(!(
!(
!(
!(!( !(
!(!( !(!(!(
!(
!(
!(
!(!(
!(
!(!(!(!(
!( !(
!(
!(!(!(
!(!(!(
!(
!(!(
!(
!(!(
!(!(!(!(!(
!(!(!(
!(!(
!(!( !(!(!(!(!(
!(!(
!(!(
!(!(
!(
!(!( !(!(
!(
!(
!(
!(!(!(
!(!(!(!(!(!(
!(!(
!(!(!(!(!(!(
!(
!(
!(!(
!(!(
!(
!(
!(
!(!(!(!(!(
!(!(!(!(
!(
!(
!(
!(
!(
!(
!(
!(!(!(!(!(
!(
!(
!(
!(
!(
!(
!(!(
!(!(!(!(!(
!(
!(
!(!(!(
!(
!(!(
!( !(!(
!(
!(
!(!(
!(
!(
!(
!(
!(
!(!(!(!(!(!(!(!(!(!(!(!(!(!(
!(
!(
!(!(!(
!(!(
!(
!(!(
!(!(
!(!(!(
!(!(!(!(
!(
!(
!(
!(
!(!(
!(
!(
!(
!(!(!(!(!(!(!(!(
!(!(
!(!(
!(
!(
!(!(!( !(
!(!(!(!(!(!(
!(!(
!(
!(!(!(
!(!(
!(
!(!(!(!(!(!(!(
!(
!(!(!(
!(
!(!(!(!(
!(
!(
!(
!(
!(
!(
!(
!(
!(
!(
!(!(!(
!(
!(!(
!(!(!(!(
!(!(!(!(!(
!(
!(
!(
!(
!(!(
!(!(!(
!(
!(!(!(
!(
!(!(!(!(!(!(!( !(
!(!(
!(!(!(
!(
Highest Vulnerability (1)High Vulnerability (2)
Moderate Vulnerability (3)Low Vulnerability (4)
Lowest Vulnerability (5)
Vulnerability Tier
Trunk HighwaysDistrict Boundaries
District 1 Pipe Vulnerability Assessment | Weighted by Exposure, Sensitivity & Adaptive Capacity
0 30 6015 Miles
DISTRICT 1 VULNERABILITY ASSESSMENT PAGE 19
Highly vulnerable (Tier 1 and Tier 2) assets are not necessarily in imminent danger of flooding, nor are lower vulnerability (Tier 4 and Tier 5) assets immune to flooding. These values are indicators of the relative vulnerability of assets compared with other assets in the same district.
Highest Vulnerability (1)High Vulnerability (2)
Moderate Vulnerability (3)Low Vulnerability (4)
Lowest Vulnerability (5)
Vulnerability Tier
Trunk HighwaysDistrict Boundaries
District 1 Roads Paralleling Streams Vulnerability Assessment | Weighted by Exposure, Sensitivity & Adaptive Capacity
0 30 6015 Miles

PAGE 20 MNDOT FLASH FLOOD VULNERABILITY AND ADAPTATION ASSESSMENT PILOT REPORT
Highly vulnerable (Tier 1 and Tier 2) assets are not necessarily in imminent danger of flooding, nor are lower vulnerability (Tier 4 and Tier 5) assets immune to flooding. These values are indicators of the relative vulnerability of assets compared with other assets in the same district.
")")
")") ")")")
")") ")")
")")")
")
")
")")") ")")")")")")
")")")")")")
") ")")
")
")
")
")")") ")
")
") ")
")
")")")")
")")
")")
")")")")
")")")
")")")")
")
")")") ")")
")
") ")
")")
")")
")
")
")") ")")")
")") ")")
")
")")
")")")")")")
") ")")")")")
")") ")")")")
")
")")")
")
")") ")
")
")
")
")
")")")
")
")")
")")") ")
")
")") ") ")
")") ")")
#*
#*#*
#* #*
#*
#*#*#*
#*
#*
#*#*#*#* #*
#*
#*#* #* #*#*#*#* #*#*#*
#*#*#*#* #*#*#*
#* #*#* #*#*#* #*#* #*#* #*#* #*#*#*
#*#* #*
#*
#*#*
#*#*
#*#*
#*#*
#*
#*
#*#* #*#*#* #*#*
#*#*#*#*#*
#*#*#* #*#*#* #*#* #*#* #*#*
#*
#*#*#* #*#*
#* #*#*#* #*#*
#*#*#*#*
#* #*#*#* #*
#*#* #*#*#* #*#*#*#*
#* #*#*#*
#* #*#*#*#*
#*#*
#*#*
#*#*#*
#*#* #*
#*
#* #*#*#*#*#*#*#*
#*#* #*#* #*#*#*#*
#*#*#*#*
#*#*#*
!(!(
!(
!(
!(
!(
!( !(!(!(!( !(
!( !(!(
!(!(!(!(
!(!(!(
!(!(!(!(
!(
!(!(
!( !(!(!(!( !(
!(!(!(!(
!(!(!(!(
!(!(!(!( !(!(
!(!(!(
!(!(
!(
!(
!(!(!(
!(
!(
!(!(
!(!(!(!(
!(!(
!(
!(
!(!(!(!(!(
!( !(!( !(!(!(
!(!(!(
!(
!(!( !( !(
!(
!(!(!(!(!(
!(
!(
!(!(
!( !(!(!(!( !(!(!(
!( !(
!(!(
!(!(!(!(!(
!(
!(!(!(
!(
!(!(
!(!(
!(
!(
!(!(!(!(
!(!( !( !(!(!(
!(
!(!(
!(
!(!(
!(
!( !(!(
!(!(!(!(
!(
!(
!(!(!(
!(
!(!(
!(
!(
!(!(!(!(
!(!(!(
!(
!(
!(!(
!(!(!(!(!(!(
!(
!( !(
!(
!(!(!( !(!(!(!(!(
!(!(
!(!(!(!(
!(
!(!(!(
!(
!(!(
!(!(!(
!(
!(!(
!(
!(!(!(
!(!(!(!(!(
!(!(!(!(!(!(
!(!(
!(!(!(!(
!(
!(!(!(!(!(
!(
!(!(
!(!(
!(!(
!(
!(
!(!(
!(!(!( !(!(
!(
!(
!(!( !(
!(!( !(!(!(
!(
!(
!(
!(!(
!(
!(!(!(!(
!( !(
!(
!(!(!(
!(!(!(
!(
!(!(
!(
!(!(
!(!(!(!(!(
!(!(!(
!(!(
!(!( !(!(!(!(!(
!(!(
!(!(
!(!(
!(
!(!( !(!(
!(
!(
!(
!(!(!(
!(!(!(!(!(!(
!(!(
!(!(!(!(!(!(
!(
!(
!(!(
!(!(
!(
!(
!(
!(!(!(!(!(
!(!(!(!(
!(
!(
!(
!(
!(
!(
!(
!(!(!(!(!(
!(
!(
!(
!(
!(
!(
!(!(
!(!(!(!(!(
!(
!(
!(!(!(
!(
!(!(
!( !(!(
!(
!(
!(!(
!(
!(
!(
!(
!(
!(!(!(!(!(!(!(!(!(!(!(!(!(!(
!(
!(
!(!(!(
!(!(
!(
!(!(
!(!(
!(!(!(
!(!(!(!(
!(
!(
!(
!(
!(!(
!(
!(
!(
!(!(!(!(!(!(!(!(
!(!(
!(!(
!(
!(
!(!(!( !(
!(!(!(!(!(!(
!(!(
!(
!(!(!(
!(!(
!(
!(!(!(!(!(!(!(
!(
!(!(!(
!(
!(!(!(!(
!(
!(
!(
!(
!(
!(
!(
!(
!(
!(
!(!(!(
!(
!(!(
!(!(!(!(
!(!(!(!(!(
!(
!(
!(
!(
!(!(
!(!(!(
!(
!(!(!(
!(
!(!(!(!(!(!(!( !(
!(!(
!(!(!(
!(
Highest Vulnerability (1)High Vulnerability (2)
Moderate Vulnerability (3)Low Vulnerability (4)
Lowest Vulnerability (5)
Vulnerability Tier
Trunk HighwaysDistrict Boundaries
District 1 Asset Vulnerability Assessment | Weighted by Exposure and Sensitivity
0 30 6015 Miles
Asset TypeBridges
Pipes
Culverts
Roads Paralleling Streams
APPENDIX B | ASSET VULNERABILITY (EXPOSURE & SENSITIVITY)
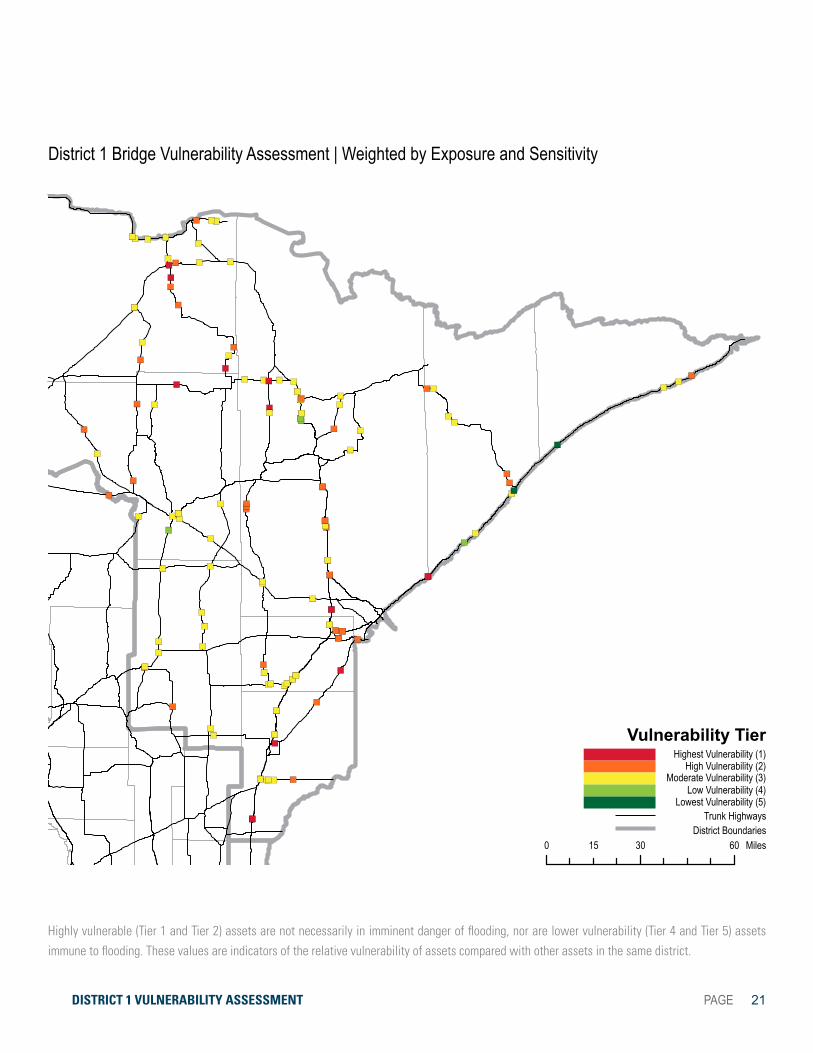
DISTRICT 1 VULNERABILITY ASSESSMENT PAGE 21
Highly vulnerable (Tier 1 and Tier 2) assets are not necessarily in imminent danger of flooding, nor are lower vulnerability (Tier 4 and Tier 5) assets immune to flooding. These values are indicators of the relative vulnerability of assets compared with other assets in the same district.
")")
")") ")")")
")") ")")
")")")
")
")
")")") ")")")")")")
")")")")")")
") ")")
")
")
")
")")") ")
")
") ")
")
")")")")
")")
")")
")")")")
")")")
")")")")
")
")")") ")")
")
") ")
")")
")")
")
")
")") ")")")
")") ")")
")
")")
")")")")")")
") ")")")")")
")") ")")")")
")
")")")
")
")") ")
")
")
")
")
")")")
")
")")
")")") ")
")
")") ") ")
")") ")")
Highest Vulnerability (1)High Vulnerability (2)
Moderate Vulnerability (3)Low Vulnerability (4)
Lowest Vulnerability (5)
Vulnerability Tier
Trunk HighwaysDistrict Boundaries
District 1 Bridge Vulnerability Assessment | Weighted by Exposure and Sensitivity
0 30 6015 Miles

PAGE 22 MNDOT FLASH FLOOD VULNERABILITY AND ADAPTATION ASSESSMENT PILOT REPORT
Highly vulnerable (Tier 1 and Tier 2) assets are not necessarily in imminent danger of flooding, nor are lower vulnerability (Tier 4 and Tier 5) assets immune to flooding. These values are indicators of the relative vulnerability of assets compared with other assets in the same district.
#*
#*#*
#* #*
#*
#*#*#*
#*
#*
#*#*#*#* #*
#*
#*#* #* #*#*#*#* #*#*#*
#*#*#*#* #*#*#*
#* #*#* #*#*#* #*#* #*#* #*#* #*#*#*
#*#* #*
#*
#*#*
#*#*
#*#*
#*#*
#*
#*
#*#* #*#*#* #*#*
#*#*#*#*#*
#*#*#* #*#*#* #*#* #*#* #*#*
#*
#*#*#* #*#*
#* #*#*#* #*#*
#*#*#*#*
#* #*#*#* #*
#*#* #*#*#* #*#*#*#*
#* #*#*#*
#* #*#*#*#*
#*#*
#*#*
#*#*#*
#*#* #*
#*
#* #*#*#*#*#*#*#*
#*#* #*#* #*#*#*#*
#*#*#*#*
#*#*#*
Highest Vulnerability (1)High Vulnerability (2)
Moderate Vulnerability (3)Low Vulnerability (4)
Lowest Vulnerability (5)
Vulnerability Tier
Trunk HighwaysDistrict Boundaries
District 1 Culvert Vulnerability Assessment | Weighted by Exposure and Sensitivity
0 30 6015 Miles

DISTRICT 1 VULNERABILITY ASSESSMENT PAGE 23
Highly vulnerable (Tier 1 and Tier 2) assets are not necessarily in imminent danger of flooding, nor are lower vulnerability (Tier 4 and Tier 5) assets immune to flooding. These values are indicators of the relative vulnerability of assets compared with other assets in the same district.
!(!(
!(
!(
!(
!(
!( !(!(!(!( !(
!( !(!(
!(!(!(!(
!(!(!(
!(!(!(!(
!(
!(!(
!( !(!(!(!( !(
!(!(!(!(
!(!(!(!(
!(!(!(!( !(!(
!(!(!(
!(!(
!(
!(
!(!(!(
!(
!(
!(!(
!(!(!(!(
!(!(
!(
!(
!(!(!(!(!(
!( !(!( !(!(!(
!(!(!(
!(
!(!( !( !(
!(
!(!(!(!(!(
!(
!(
!(!(
!( !(!(!(!( !(!(!(
!( !(
!(!(
!(!(!(!(!(
!(
!(!(!(
!(
!(!(
!(!(
!(
!(
!(!(!(!(
!(!( !( !(!(!(
!(
!(!(
!(
!(!(
!(
!( !(!(
!(!(!(!(
!(
!(
!(!(!(
!(
!(!(
!(
!(
!(!(!(!(
!(!(!(
!(
!(
!(!(
!(!(!(!(!(!(
!(
!( !(
!(
!(!(!( !(!(!(!(!(
!(!(
!(!(!(!(
!(
!(!(!(
!(
!(!(
!(!(!(
!(
!(!(
!(
!(!(!(
!(!(!(!(!(
!(!(!(!(!(!(
!(!(
!(!(!(!(
!(
!(!(!(!(!(
!(
!(!(
!(!(
!(!(
!(
!(
!(!(
!(!(!( !(!(
!(
!(
!(!( !(
!(!( !(!(!(
!(
!(
!(
!(!(
!(
!(!(!(!(
!( !(
!(
!(!(!(
!(!(!(
!(
!(!(
!(
!(!(
!(!(!(!(!(
!(!(!(
!(!(
!(!( !(!(!(!(!(
!(!(
!(!(
!(!(
!(
!(!( !(!(
!(
!(
!(
!(!(!(
!(!(!(!(!(!(
!(!(
!(!(!(!(!(!(
!(
!(
!(!(
!(!(
!(
!(
!(
!(!(!(!(!(
!(!(!(!(
!(
!(
!(
!(
!(
!(
!(
!(!(!(!(!(
!(
!(
!(
!(
!(
!(
!(!(
!(!(!(!(!(
!(
!(
!(!(!(
!(
!(!(
!( !(!(
!(
!(
!(!(
!(
!(
!(
!(
!(
!(!(!(!(!(!(!(!(!(!(!(!(!(!(
!(
!(
!(!(!(
!(!(
!(
!(!(
!(!(
!(!(!(
!(!(!(!(
!(
!(
!(
!(
!(!(
!(
!(
!(
!(!(!(!(!(!(!(!(
!(!(
!(!(
!(
!(
!(!(!( !(
!(!(!(!(!(!(
!(!(
!(
!(!(!(
!(!(
!(
!(!(!(!(!(!(!(
!(
!(!(!(
!(
!(!(!(!(
!(
!(
!(
!(
!(
!(
!(
!(
!(
!(
!(!(!(
!(
!(!(
!(!(!(!(
!(!(!(!(!(
!(
!(
!(
!(
!(!(
!(!(!(
!(
!(!(!(
!(
!(!(!(!(!(!(!( !(
!(!(
!(!(!(
!(
Highest Vulnerability (1)High Vulnerability (2)
Moderate Vulnerability (3)Low Vulnerability (4)
Lowest Vulnerability (5)
Vulnerability Tier
Trunk HighwaysDistrict Boundaries
District 1 Pipe Vulnerability Assessment | Weighted by Exposure and Sensitivity
0 30 6015 Miles
PAGE 24 MNDOT FLASH FLOOD VULNERABILITY AND ADAPTATION ASSESSMENT PILOT REPORT
Highly vulnerable (Tier 1 and Tier 2) assets are not necessarily in imminent danger of flooding, nor are lower vulnerability (Tier 4 and Tier 5) assets immune to flooding. These values are indicators of the relative vulnerability of assets compared with other assets in the same district.
Highest Vulnerability (1)High Vulnerability (2)
Moderate Vulnerability (3)Low Vulnerability (4)
Lowest Vulnerability (5)
Vulnerability Tier
Trunk HighwaysDistrict Boundaries
District 1 Roads Paralleling Streams Vulnerability Assessment | Weighted by Exposure and Sensitivity
0 30 6015 Miles