Embed Size (px)
Citation preview

Flat Lake
Watershed Management Plan
Marshall County, Indiana
June 11, 2003
Prepared by:
708 Roosevelt Road Walkerton, Indiana 46574
574-586-3400
Prepared for:
Poor Handmaids of Jesus Christ P.O. Box 1
Donaldson, Indiana 46513
Flat Lake Watershed Management Plan June 11, 2003 Marshall County, Indiana
TABLE OF CONTENTS Page 1.0 Introduction.................................................................................................................................1
1.1. History of the Watershed Management Plan Development .................................................3 1.2. The Vision ............................................................................................................................4 1.3. Roles and Responsibilities....................................................................................................5
2.0 Watershed Characteristics............................................................................................................5 2.1. Climate..................................................................................................................................5 2.2. Geology and Topography .....................................................................................................6 2.3. Soils ......................................................................................................................................8 2.4. Natural History .....................................................................................................................15 2.5. Natural Communities and Endangered, Threatened, and Rare Species ...............................15 2.6. Hydrological Features...........................................................................................................19 2.7. Early History and Land Use .................................................................................................20 2.8. Land Ownership....................................................................................................................24
3.0 Identified Problems......................................................................................................................26 3.1. Key Reference Documents ...................................................................................................26 3.2. Water Quality Summary .......................................................................................................29 3.3. Sources of Pollutants ............................................................................................................33 3.4. Identified Problems Summary ..............................................................................................34
4.0 Goals and Decisions.....................................................................................................................51 5.0 Measuring Success.......................................................................................................................67 6.0 Future Considerations ..................................................................................................................73 7.0 Literature Cited ............................................................................................................................76
JFNew File #99-04-28L Page i
Flat Lake Watershed Management Plan June 11, 2003 Marshall County, Indiana
LIST OF FIGURES Page
Figure 1. Location map ...................................................................................................................1 Figure 2. Flat Lake watershed .........................................................................................................2 Figure 3. Kankakee River watershed ..............................................................................................3 Figure 4. Topographical relief of the Flat Lake watershed .............................................................7 Figure 5. Highly erodible and potentially highly erodible soils in the Flat Lake watershed ..........10 Figure 6. Tracts of highly erodible land in the Flat Lake Watershed..............................................11 Figure 7. Soil series septic tank absorption field suitability............................................................14 Figure 8. National wetland inventory map......................................................................................17 Figure 9. Hydric soils in the Flat Lake watershed...........................................................................18 Figure 10. Historic sites and structures in the Flat Lake watershed..................................................21 Figure 11. Land use in the Flat Lake watershed................................................................................23 Figure 12. Tracts of land owned by the Indiana Department of Natural Resources (Menominee Wetland Conservation Area) and the Poor Handmaids of Jesus Christ .....25 Figure 13. Flat Lake watershed sampling site locations ...................................................................30 Figure 14. Critical areas targeted for improvement in the Flat Lake watershed ...............................32 Figure 15. Critical row crop agricultural areas in the Flat Lake watershed ......................................34 Figure 16. Potential nutrient impacts in a lake ecosystem ................................................................50 Figure 17. Influence of water clarity in a lake ecosystem.................................................................51 Figure 18. Carlson’s Trophic State Index .........................................................................................70
LIST OF TABLES
Table 1. Monthly rainfall for 2002 as compared to average monthly rainfall ...............................6 Table 2. Highly erodible and potentially highly erodible soil units in the Flat Lake watershed ...9 Table 3. Soil types present in the Flat Lake watershed..................................................................13 Table 4. Acreage and classification of wetland types within the Flat Lake watershed .................16 Table 5. Detailed land use in the Flat Lake watershed ..................................................................24 Table 6. Detailed sampling location information for the Flat Lake watershed..............................29 Table 7. Identified issues affecting Flat Lake ................................................................................37 Table 8. Identified issues affecting Gilbert Lake...........................................................................38 Table 9. Identified issues affecting Flat Lake watershed streams..................................................42 Table 10. Identified issues in the Flat Lake watershed ....................................................................44 Table 11. Identified issues in the Kankakee River Basin ................................................................47 Table 12. Summary of potentially responsible parties, estimated costs, potential funding sources, and time frames for each objective in the Flat Lake watershed action plan.......................................................................................................64
JFNew File #99-08-24L/01 Page ii
Flat Lake Watershed Management Plan June 11, 2003 Marshall County, Indiana
LIST OF APPENDICES Appendix A. Geographic Information System Map Data Sources Appendix B. Flat Lake Watershed Major Stakeholders Appendix C. Endangered, Threatened, and Rare Species Appendix D. Water Quality Assessment Appendix E. Quality Assurance Project Plan Appendix F. Load Retention Spreadsheet Appendix G. Potential Funding Sources Appendix H. Clean Lakes Program Volunteer Monitoring Program Protocol Appendix I. 4-H Biological Control of Purple Loosestrife Monitoring Forms Appendix J. SeaGrant Purple Loosestrife Identification Brochure Appendix K. U.S. Army Corps of Engineers and Indiana Department of Environmental
Management permit applications Appendix L. Action Register
JFNew File #99-08-24L/01 Page iii
Flat Lake Watershed Management Plan June 11, 2003 Marshall County, Indiana
JFNew File #99-08-24L/01 Page iv
LIST OF ACRONYMS
BMPs Best Management Practices CLP Clean Lakes Program CWA Clean Water Act ECBP Eastern Corn Belt Plains EI Eutrophication Index FSA Farm Services Agency FWA Fish and Wildlife Area FQI Floristic Quality Index HEL Highly Erodible Land HUC Hydrologic Unit Code IDEM Indiana Department of Environmental Management IDNR Indiana Department of Natural Resources ISBH Indiana State Board of Health LARE Lake and River Enhancement Program MSL Mean Sea Level NPDES National Pollutant Discharge Elimination System NRCS Natural Resources Conservation Service NWI National Wetland Inventory PHJC Poor Handmaids of Jesus Christ RUSLE Revised Universal Soil Loss Equation STEPL Spreadsheet Tool for the Estimation of Pollutant Load SWCD Soil and Water Conservation District TSI Trophic State Index UWA Unified Watershed Assessment WCA Wetland Conservation Area WRAS Watershed Restoration Action Strategy
FLAT LAKE WATERSHED MANAGEMENT PLAN
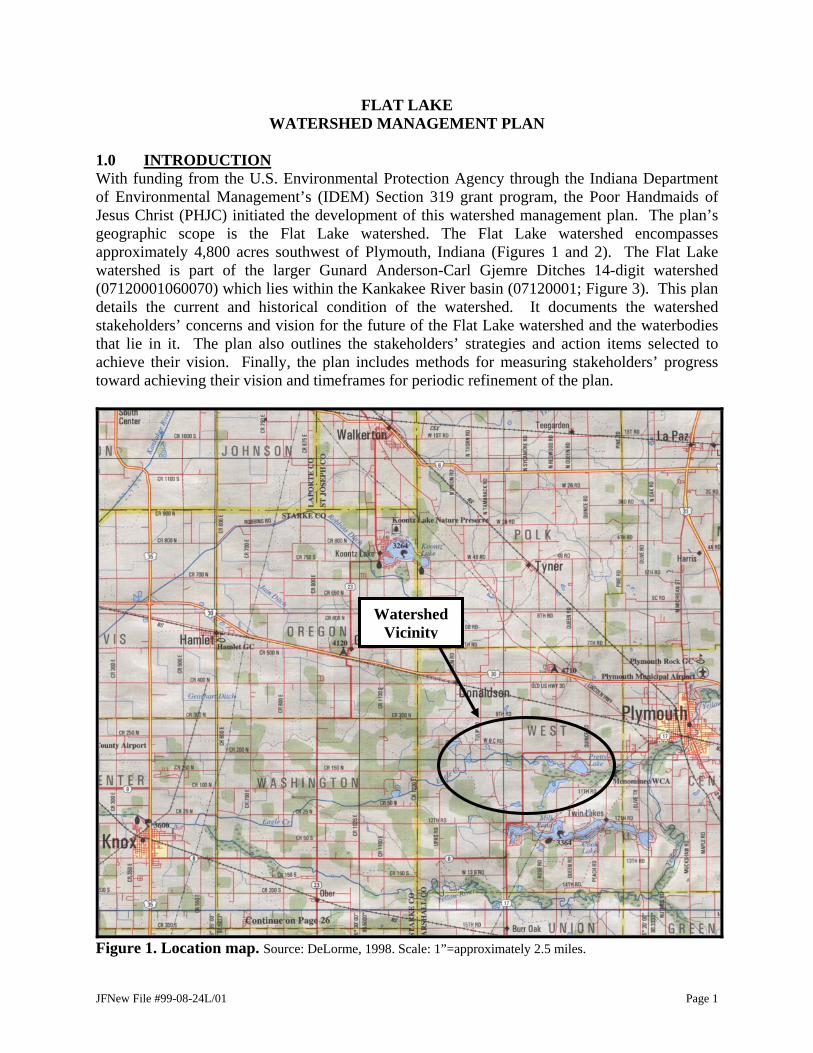
1.0 INTRODUCTION With funding from the U.S. Environmental Protection Agency through the Indiana Department of Environmental Management’s (IDEM) Section 319 grant program, the Poor Handmaids of Jesus Christ (PHJC) initiated the development of this watershed management plan. The plan’s geographic scope is the Flat Lake watershed. The Flat Lake watershed encompasses approximately 4,800 acres southwest of Plymouth, Indiana (Figures 1 and 2). The Flat Lake watershed is part of the larger Gunard Anderson-Carl Gjemre Ditches 14-digit watershed (07120001060070) which lies within the Kankakee River basin (07120001; Figure 3). This plan details the current and historical condition of the watershed. It documents the watershed stakeholders’ concerns and vision for the future of the Flat Lake watershed and the waterbodies that lie in it. The plan also outlines the stakeholders’ strategies and action items selected to achieve their vision. Finally, the plan includes methods for measuring stakeholders’ progress toward achieving their vision and timeframes for periodic refinement of the plan.
Figure 1. Location map. Source: DeLorme,
JFNew File #99-08-24L/01
WatershedVicinity
1998. Scale: 1”=approximately 2.5 miles.
Page 1
Flat Lake Watershed Management Plan June 11, 2003 Marshall County, Indiana
JFNew File #99-08-24L/01 Page 2
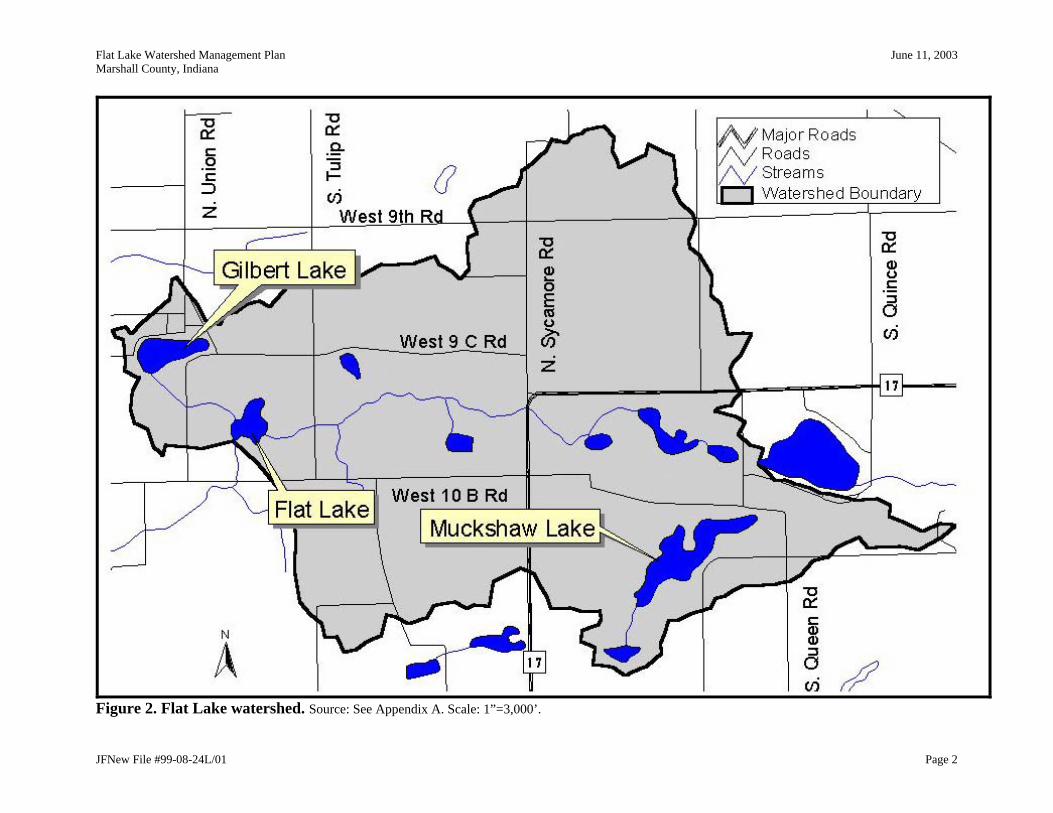
Figure 2. Flat Lake watershed. Source: See Appendix A. Scale: 1”=3,000’.
Flat Lake Watershed Management Plan June 11, 2003 Marshall County, Indiana
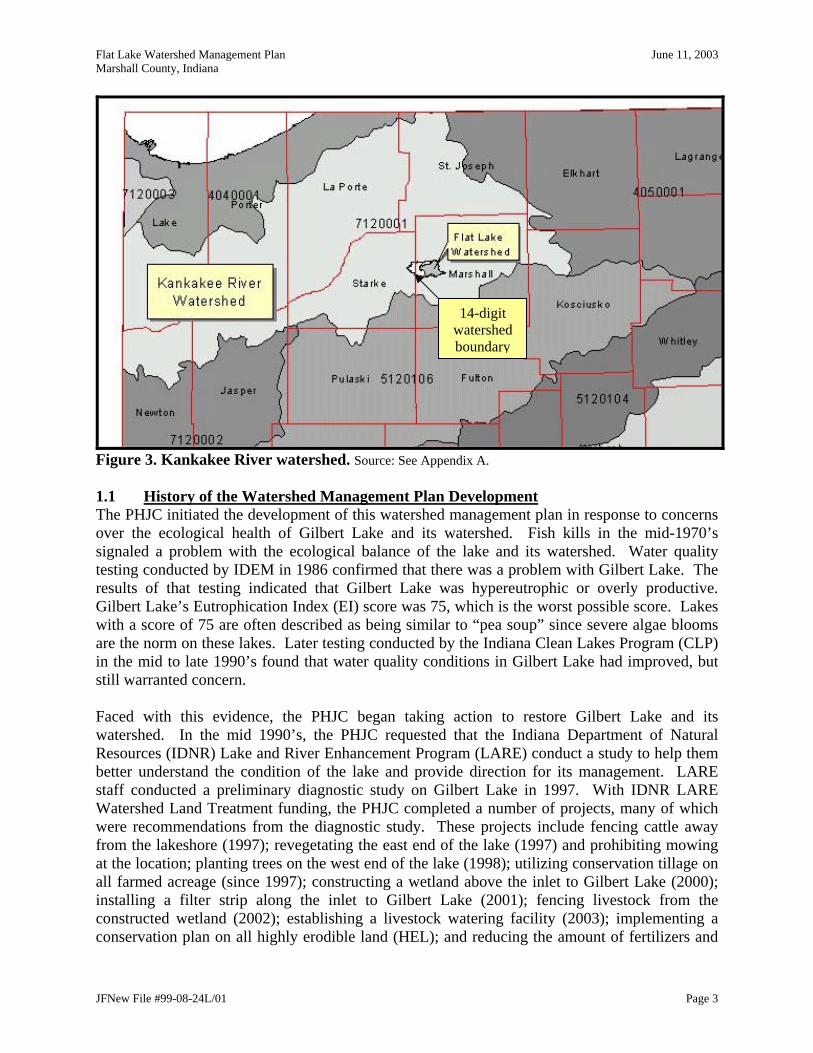
Figure 3. Kankakee River watershed. Source: See Appen 1.1 History of the Watershed Management Plan DThe PHJC initiated the development of this watershed mover the ecological health of Gilbert Lake and its wsignaled a problem with the ecological balance of thetesting conducted by IDEM in 1986 confirmed that therresults of that testing indicated that Gilbert Lake waGilbert Lake’s Eutrophication Index (EI) score was 75, with a score of 75 are often described as being similar are the norm on these lakes. Later testing conducted byin the mid to late 1990’s found that water quality condstill warranted concern. Faced with this evidence, the PHJC began taking watershed. In the mid 1990’s, the PHJC requested Resources (IDNR) Lake and River Enhancement Prograbetter understand the condition of the lake and providstaff conducted a preliminary diagnostic study on GilWatershed Land Treatment funding, the PHJC completwere recommendations from the diagnostic study. Thfrom the lakeshore (1997); revegetating the east end ofat the location; planting trees on the west end of the lakall farmed acreage (since 1997); constructing a wetlaninstalling a filter strip along the inlet to Gilbert Laconstructed wetland (2002); establishing a livestock wconservation plan on all highly erodible land (HEL); a
JFNew File #99-08-24L/01
14-digit watershedboundary
dix A.
evelopment anagement plan in response to concerns
atershed. Fish kills in the mid-1970’s lake and its watershed. Water quality e was a problem with Gilbert Lake. The s hypereutrophic or overly productive. which is the worst possible score. Lakes to “pea soup” since severe algae blooms the Indiana Clean Lakes Program (CLP) itions in Gilbert Lake had improved, but
action to restore Gilbert Lake and its that the Indiana Department of Natural m (LARE) conduct a study to help them e direction for its management. LARE bert Lake in 1997. With IDNR LARE ed a number of projects, many of which ese projects include fencing cattle away the lake (1997) and prohibiting mowing e (1998); utilizing conservation tillage on d above the inlet to Gilbert Lake (2000); ke (2001); fencing livestock from the atering facility (2003); implementing a
nd reducing the amount of fertilizers and
Page 3
Flat Lake Watershed Management Plan June 11, 2003 Marshall County, Indiana
herbicides used on the property. In addition to these Watershed Land Treatment projects, the PHJC also installed a wastewater wetland to treat the waste stream from the Earthworks facility located on the southern edge of Gilbert Lake. With funding from the same program that funded this management plan, the PHJC restored 12 acres of wetland around Gilbert Lake’s outlet stream. This restoration included remeandering the outlet stream and fencing the wetland’s perimeter to protect it from cattle grazing. Finally, the PHJC worked with state regulators to reroute the National Pollutant Discharge Elimination System (NPDES) permitted discharge from the PHJC wastewater lagoon from its original outlet to the lake to the restored wetland to provide additional post-discharge treatment for the wastewater. The PHJC are also currently working with the IDNR Division of Soil Conservation to install a grassed waterway upstream of Gilbert Lake. While the PHJC is active in restoring Gilbert Lake and its watershed, they recognized the direct influence the condition of Gilbert Lake has on Flat Lake. Because of this connection, the PHJC broadened their efforts to include the landscape downstream of Gilbert Lake. The PHJC also recognized the need to include more people in the restoration efforts. This plan represents the collective effort of all the Flat Lake watershed stakeholders to make the watershed an ecologically healthy and attractive part of the landscape. All watershed property owners were invited to participate in development of this plan. Additionally, major stakeholders representing local, state, and federal natural resources agencies, including the IDNR Division of Soil Conservation Resource Specialist, the IDNR Menominee Wetland Conservation Area (WCA) Property Manager, Indiana Department of Environmental Management’s Regional Watershed Coordinator; non-for-profit organizations such as Ducks Unlimited and the Sierra Club; and the local county planner were also invited to participate. (Appendix B contains a list of major stakeholders who are not property owners in the watershed.) Participation the plan’s development was encouraged though the use of quarterly mailings to announce public meetings and summarize the discussion and decisions made at these meetings. The quarterly meetings formed the foundation of the plan’s development. Stakeholders set goals, prioritized goals and decided on a course of action to achieve these goals in these public meetings. 1.2 The Vision Over the course of discussion in the public meetings, some common themes began to emerge. These themes centered around stakeholders’ desire to restore the lakes in the watershed to a condition that closely resembled their natural condition and to involve more people in the restoration process. Stakeholders agreed that these themes were their vision for the watershed. The goals stakeholders list in this document and the action plan designed to achieve these goals reflect their desire to realize this vision for the watershed. Ultimately, the Flat Lake watershed stakeholders hope this vision will serve as a guide for future management of the watershed. The following is the watershed stakeholders’ vision:
The Flat Lake Watershed Stakeholders’ Vision for the Flat Lake Watershed Flat and Gilbert Lakes are moderately productive lakes capable of supporting a healthy,
balanced biotic community and providing an attractive resource for citizens to enjoy. Watershed stakeholders are actively participating in the protection and improvement of the watershed’s
natural resources.
JFNew File #99-08-24L/01 Page 4
Flat Lake Watershed Management Plan June 11, 2003 Marshall County, Indiana
1.3 Roles and Responsibilities Several parties played key roles in the development of the Flat Lake Watershed Management Plan. Collectively, the watershed stakeholders were responsible for the developing, reviewing, and agreeing upon the goals and action plan for the watershed. The PHJC coordinated the plan’s development by hosting public meetings and workshops, writing press releases to advertise events associated with the plan’s development, and reviewing the draft management plan. The PHJC also contracted with an ecological consulting firm, JFNew, to help with the plan’s development. JFNew created a database of watershed stakeholders including all property owners in the watershed, distributed plan information and meeting announcements to all entities in the stakeholder database, facilitated public meetings, and drafted the watershed management plan based on the public meetings. The IDNR Division of Soil Conservation Resource Specialist and IDEM Project Manager provided reviews of the draft plan. The draft plan was also available via an ftp site giving watershed stakeholders the opportunity to review and comment on the draft plan. The PHJC will assume responsibility for updating the plan in the future. 2.0 WATERSHED CHARACTERISTICS 2.1 Climate 2.1.1 Indiana Climate Indiana’s climate can be described as temperate with cold winters and warm summers. The National Climatic Data Center summarizes Indiana weather in its 1976 Climatology of the United States document No. 60. “Imposed on the well known daily and seasonal temperature fluctuations are changes occurring every few days as surges of polar air move southward or tropical air moves northward. These changes are more frequent and pronounced in the winter than in the summer. A winter may be unusually cold or a summer cool if the influence of polar air is persistent. Similarly, a summer may be unusually warm or a winter mild if air of tropical origin predominates. The action between these two air masses of contrasting temperature, humidity, and density fosters the development of low-pressure centers that move generally eastward and frequently pass over or close to the state, resulting in abundant rainfall. These systems are least active in midsummer and during this season frequently pass north of Indiana” (National Climatic Data Center, 1976). Prevailing winds are generally from the southwest, but are more persistent and blow from a northerly direction during the winter months. 2.1.2 Marshall County Climate The climate of Marshall County has the characteristic warm summers and cold and snowy winters described above. Winters in Marshall County typically provide enough precipitation, in the form of snow, to supply the soil with sufficient moisture to minimize drought conditions when the hot summers begin. Winters are cold, averaging 27º F, while summers are warm, averaging 71º F. The highest temperature ever recorded was 109º F on June 20, 1953. Mild drought conditions occur occasionally during the summer when evaporation is highest. Historic data from 1951-1974 suggest that the growing season (defined as days with an air temperature higher than 32º F) in Marshall County is typically 139 days long, although it can last as long as 164 days (Smallwood, 1980). The last day of freezing temperatures in spring usually occurs around May 6, while the first freezing temperature in the fall occurs around October 5 (Smallwood, 1980). During summer, average relative humidity differs greatly over the course of
JFNew File #99-08-24L/01 Page 5

Flat Lake Watershed Management Plan June 11, 2003 Marshall County, Indiana
a day averaging 80 percent at dawn and dropping to an average of 60 percent in mid-afternoon. The average annual precipitation is 38.52 inches. In 2002, nearly 30 inches of precipitation (Table 1) was recorded at Plymouth, Indiana in Marshall County. Rainfall during 2002 was lower than the average precipitation by nearly 8.5 inches. Table 1. Monthly rainfall data for year 2002 as compared to average monthly rainfall. Averages are based on available weather observations taken during the years of 1971-2000.
JAN FEB MAR APR MAY JUN JUL AUG SEPT OCT NOV DEC TOTAL2002 2.72 1.87 3.33 4.82 4.84 3.01 2.00 2.46 1.23 1.68 0.99 1.10 30.05
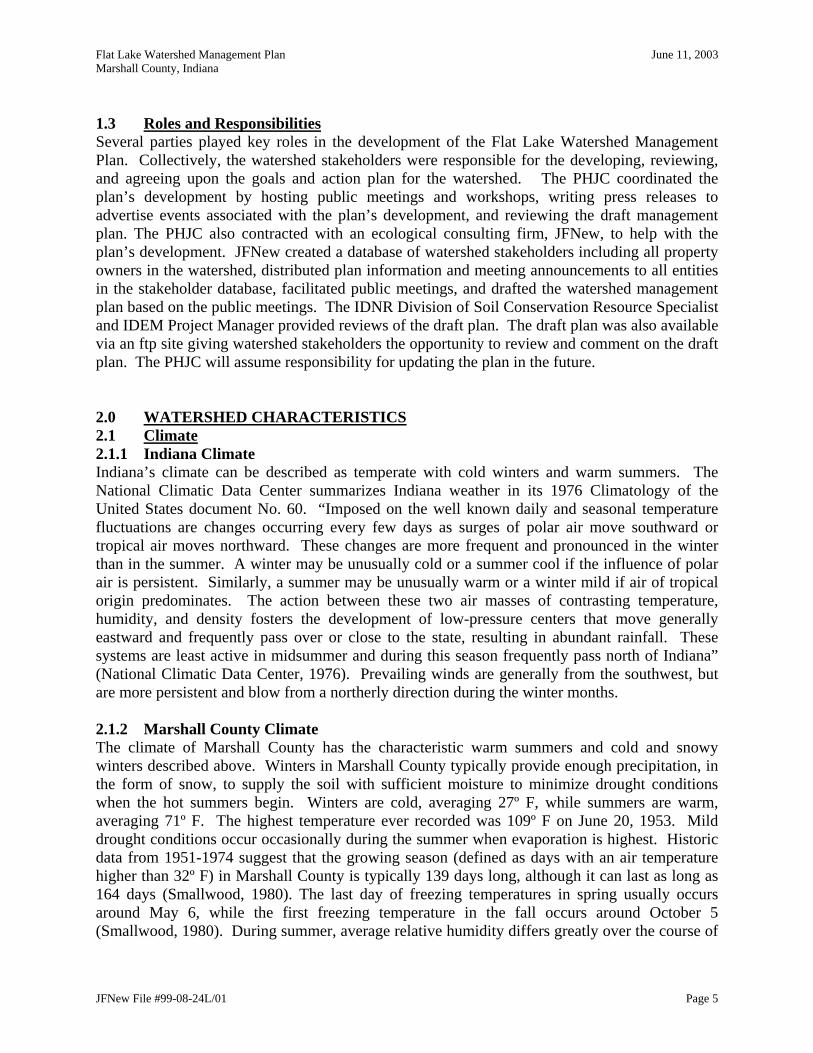
Average 1.92 1.84 2.87 3.87 3.79 4.20 4.10 3.33 3.62 3.02 3.03 2.93 38.52 Source: Purdue Applied Meteorology Group, 2003. 2.2 Geology and Topography The advance and retreat of the glaciers in the last ice age shaped much of the landscape observed in Indiana today. As the glaciers moved, they laid thick till material over much of the northern two thirds of the state. This ground moraine left by the glaciers covers much of the central portion of the state. In the northern portion of the state, end moraines, formed by the layering of till material when the rate of glacial retreat equaled the rate of glacial advance, added topographical relief to the landscape. Several large, distinct end moraines are scattered throughout the northern portion of the state. As the glaciers melted, sand and gravel outwash plains formed along the meltwaters’ drainage path. The Flat Lake watershed lies within the Maxinkuckee Moraine. The Maxinkuckee Moraine is a crescent shaped moraine covering approximately 30 to 40 miles of western Marshall County and portions of western St. Joseph and Fulton Counties. The Maxinkuckee Moraine formed when the Huron-Saginaw Lobe of the last Wisconsian glacier stalled during its last northeasterly retreat (Wayne, 1966). Movement of the Lake Michigan Lobe from the northwest may have influenced the moraine’s formation as well (IDNR, 1990). Much of the Flat Lake watershed exhibits the knob and kettle topography that is characteristic of end moraines. High points (knobs) of over 850 and 840 feet above mean sea level (MSL) exist on the north and south sides of the watershed, respectively (Figure 4). Gilbert and Flat Lakes, which are kettle lakes, occupy low spots in the watershed at 746 and 734 feet above MSL, respectively. As with most watersheds, the steepest slopes exist in the upper watershed. Steep slopes occur around Muckshaw Lake and the unnamed ponds in the eastern inlet’s headwaters. Flat Lake’s eastern inlet possesses a topographical fall of approximately 60 feet over its course. Slopes bordering the northern bank of Flat Lake’s eastern inlet tend to be steeper than the slopes bordering the southern bank, but in general, the inlet possesses a relatively wide valley. Flat Lake’s western inlet drains relatively flat land between Gilbert and Flat Lakes. Historical maps and the hydric soil map suggest that the western inlet was historically wetland rather than a drainage channel.
JFNew File #99-08-24L/01 Page 6
Flat Lake Watershed Management Plan June 11, 2003 Marshall County, Indiana
JFNew File #99-08-24L/01 Page 7
Figure 4. Topographical relief of the Flat Lake watershed. Source: See Appendix A. Scale: 1”=3,000’.
Flat Lake Watershed Management Plan June 11, 2003 Marshall County, Indiana
2.3 Soils The soil types found in Marshall County are a product of the original parent materials deposited by the glaciers that covered this area 12,000 to 15,000 years ago. The main parent materials found in Marshall County are glacial outwash and till, lacustrine material, alluvium, and organic materials that were left as the glaciers receded. The interaction of these parent materials with the physical, chemical, and biological variables found in the area (climate, plant and animal life, time, landscape relief, and the physical and mineralogical composition of the parent material) formed the soils of Marshall County today. Smallwood (1980) maps two soil associations in the Flat Lake watershed: the Riddles-Metea-Wawasee association and the Plainfield-Chelsea-Tyner association. The Riddles-Metea-Wawasee association covers most of the watershed. This soil association is characteristic of morainal areas in Marshall County, such as the Maxinkuckee Moraine. Soils in this association developed from glacial till parent materials. In general, Riddles soils account for approximately 54% of the total soils in the association; Metea soils account for 22%, while Wawasee soils comprise 13% of the soil association. Much of the remaining portion of the soil association consists of hydric soil components lining drainageways. Riddles soils occupy moraine ridges. Metea soils occur on low knolls and sides of moraines. Like Riddles soils, Wawasee soils exist on moraine ridges. Woodlands and forested areas thrive on the Riddles-Metea-Wawasee association; however, the soils’ strong slopes may limit agricultural productivity. As the landscape encompassing the Flat Lake watershed transitions from the morainal formation of the Maxinkuckee Moraine to the outwash plan of the Kankakee River valley, the landscape’s major soil associations transition from soil units consisting of till material to soil units consisting of courser textured materials (sand, gravel). Consistent with this geologic shift, the soil association covering the Flat Lake watershed shifts from a Riddles-Metea-Wawasee association to a Plainfield-Chelsea-Tyner association at the western edge of the watershed. Soils in the Plainfield-Chelsea-Tyner association developed from outwash parent materials. Plainfield soils account for approximately 32% of the total soils in the association; Chelsea soils account for 27%, while Tyner soils comprise 22% of the soil association. The remaining portion of the soil association consists of minor soil components. Plainfield soils occur on flats and knolls of outwash plains. Chelsea soils occupy gently rolling areas of outwash plains, while Tyner soils exist on more level areas of outwash plains. Smallwood (1980) classifies soils in the Plainfield-Chelsea-Tyner association as poor for agricultural production due to problems with slopes and drought. In addition to shaping the type of vegetation that may be established in a certain area, soils, in particular their ability to erode or sustain certain land use practices, can impact the water quality of waterbodies in the watershed. For example, highly erodible soils are, as their name suggests, easily erodible. Soils that erode from the landscape are transported to waterways or waterbodies where they impair water quality and often interfere with recreational uses by forming sediment deltas in the waterbodies. In addition, such soils carry attached nutrients, toxins, and pathogens, which further impair water quality. Soils that are used as septic tank absorption fields deserve special consideration as well. The presence of highly erodible soils and the use of septic fields in the Flat Lake watershed are described in further detail below.
JFNew File #99-08-24L/01 Page 8
Flat Lake Watershed Management Plan June 11, 2003 Marshall County, Indiana
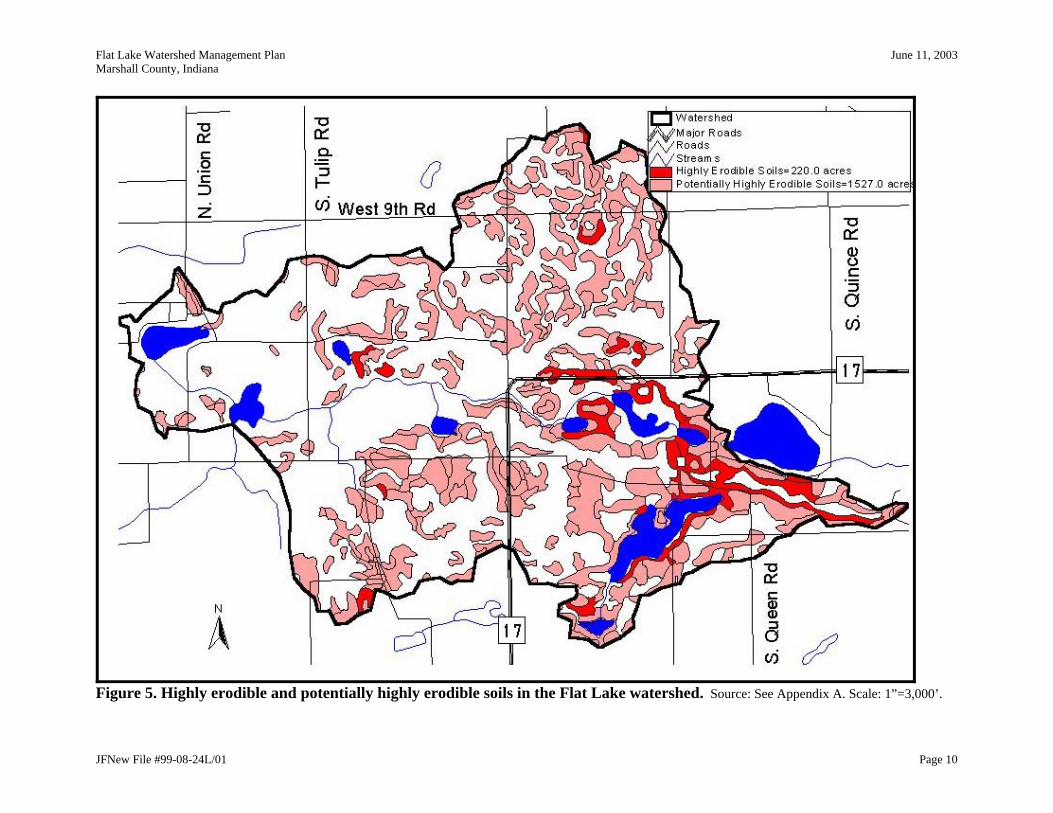
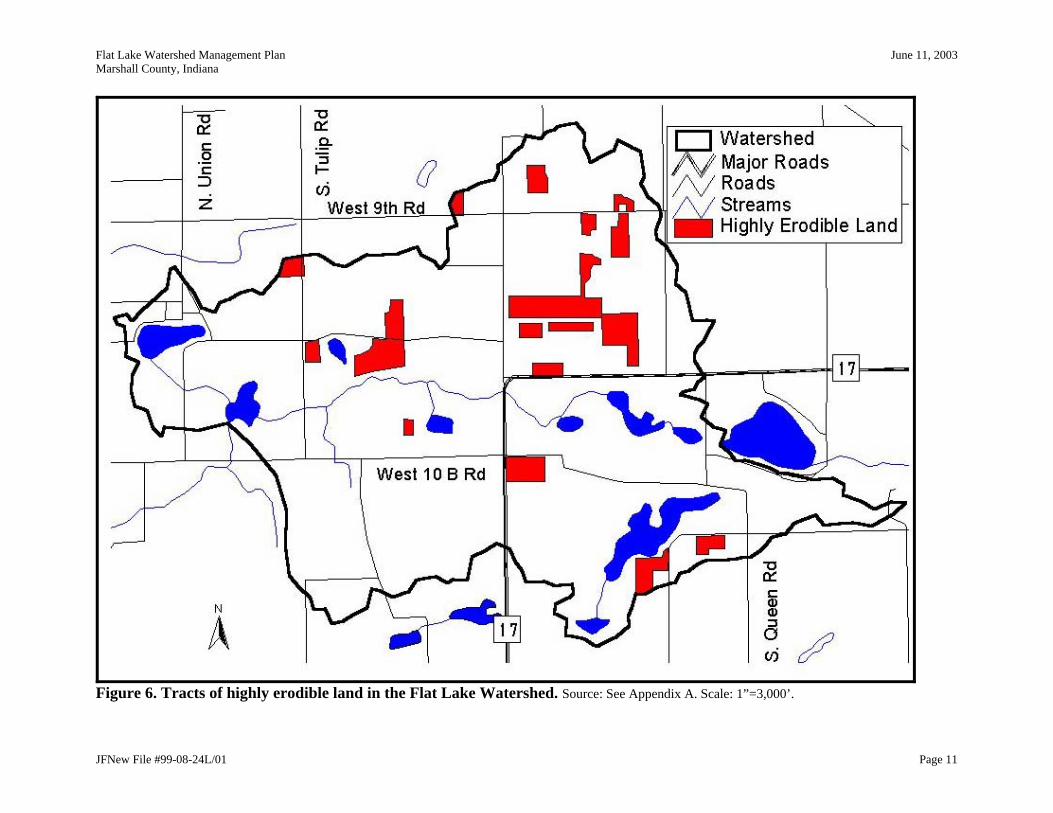
2.3.1 Highly Erodible Soils and Land Different natural resource agencies categorize highly erodible soils and highly erodible land differently. Based on common soil characteristics such as slope and soil texture, the NRCS classifies soil units that are likely to erode from the landscape as highly erodible soils. The NRCS maintains a list of highly erodible soil units for each county. Table 2 lists the soil units in the Flat Lake watershed that the NRCS considers to be highly erodible. The county list or the one provided in Table 2 can be cross referenced with the county soil survey to locate highly erodible soils on the landscape. As Figure 5 indicates, potentially highly erodible soils cover a substantial portion (1,527 acres or nearly 32%) of the Flat Lake watershed. This acreage is spread throughout the watershed. Highly erodible soil exists in approximately 220 acres of the watershed most of which are located in the eastern portion of the watershed north of and around Muckshaw Lake. Table 2. Highly erodible and potentially highly erodible soils units in the Flat Lake watershed. Soil Unit Soil Name Detail Soil Description ChC Chelsea fine sand potentially highly erodible 6 to 12 percent slopes FsB Fox sandy loam potentially highly erodible 2 to 6 percent slopes FsC2 Fox sandy loam potentially highly erodible 6 to 12 percent slopes, eroded MeB Martinsville silt loam potentially highly erodible 2 to 6 percent slopes MeC2 Martinsville loam potentially highly erodible 6 to 12 percent slopes, eroded MgC Metea loamy fine sand potentially highly erodible 2 to 6 percent slopes OsB Oshtemo loamy sand potentially highly erodible 2 to 6 percent slopes OsC Oshtemo loamy sand potentially highly erodible 6 to 12 percent slopes OsD Oshtemo loamy sand highly erodible 12 to 18 percent slopes PsC Plainfield sand potentially highly erodible 3 to 10 percent slopes PsD Plainfield sand potentially highly erodible 12 to 18 percent slopes RsB Riddles sandy loam potentially highly erodible 2 to 6 percent slopes RsD Riddles sandy loam highly erodible 12 to 18 percent slopes RsC2 Riddles sandy loam potentially highly erodible 6 to 12 percent slopes, eroded Source: Marshall County NRCS. Highly Erodible Land (HEL) is a designation used by the Farm Service Agency (FSA). For a field or tract of land to be labeled HEL by the FSA, at least one-third of the parcel must be situated in highly erodible soils. Unlike the soil survey, these fields must be field checked to ensure the accuracy of the mapped soils types. Farm fields mapped as HEL are required to file a conservation plan with the FSA in order to maintain eligibility for any financial assistance from the U.S. Department of Agriculture. Figure 6 shows the location of HEL fields in the Flat Lake watershed. HEL comprises approximately 6% of the Flat Lake watershed (302 acres); much of this land is located in the northern portion of the watershed.
JFNew File #99-08-24L/01 Page 9
Flat Lake Watershed Management Plan June 11, 2003 Marshall County, Indiana
JFNew File #99-08-24L/01 Page 10
Figure 5. Highly erodible and potentially highly erodible soils in the Flat Lake watershed. Source: See Appendix A. Scale: 1”=3,000’.
Flat Lake Watershed Management Plan June 11, 2003 Marshall County, Indiana
JFNew File #99-08-24L/01 Page 11
Figure 6. Tracts of highly erodible land in the Flat Lake Watershed. Source: See Appendix A. Scale: 1”=3,000’.
Flat Lake Watershed Management Plan June 11, 2003 Marshall County, Indiana
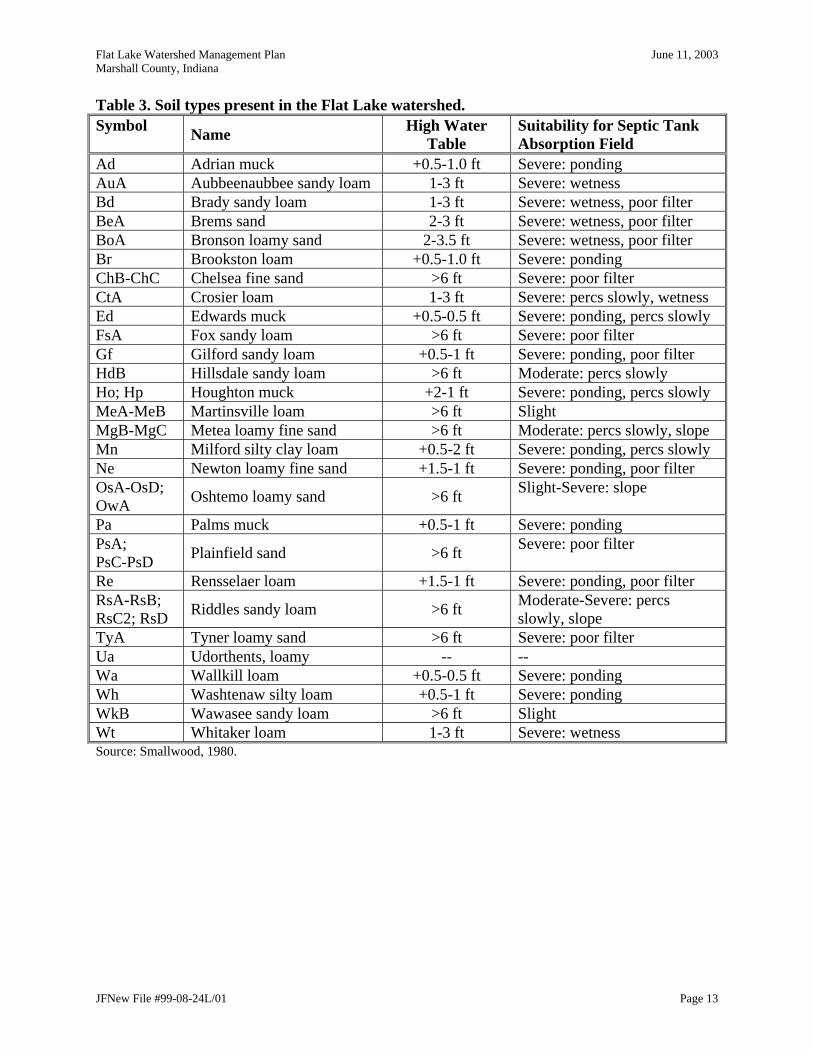
2.3.2 Septic System Use As is common in many areas of Indiana, septic tanks and septic tank absorption fields are utilized for wastewater treatment in the Flat Lake watershed. This type of wastewater treatment system relies on the septic tank for primary treatment to remove solids and the soil for secondary treatment to reduce the remaining pollutants in the effluent to levels that protect surface and groundwater from contamination. Soil conditions such as slow permeability and high water table, coupled with poor design, faulty construction, and lack of maintenance reduce the average life span of septic systems in Indiana to 7-10 years (Jones and Yahner, 1994). Other factors affecting the effectiveness of effluent treatment include the position of the septic system in the landscape, the slope on which the septic leach field is placed, the soil texture, the soil structure of the septic leach field, the soil consistency, and the septic system’s depth to limiting layers (Thomas, 1996). Many of the nutrients and pollutants of concern are removed safely if a septic system is sited correctly. Most soils have a large capacity to hold phosphate. On the other hand, nitrate (the end product of nitrogen metabolism in a properly functioning septic system) is very soluble in soil solution and is often leached to the groundwater. Care must be taken in siting the system to avoid well contamination. Nearly all organic matter in wastewater is biodegradable as long as oxygen is present. Pathogens can be both retained and inactivated within the soil as long as conditions are right. Bacteria and viruses are much smaller than other pathogenic organisms associated with wastewater and therefore, have a much greater potential for movement through the soil. Clay minerals and other soil components may adsorb them, but retention is not necessarily permanent. During storm flows, they may become resuspended in the soil solution and transported in the soil profile. Inactivation and destruction of pathogens occurs more rapidly in soils containing oxygen because sewage organisms compete poorly with the natural soil microorganisms, which are obligate aerobes requiring oxygen for life. Sewage organisms live longer under anaerobic conditions without oxygen and at lower soil temperatures because natural soil microbial activity is reduced. The Flat Lake Watershed The Natural Resources Conservation Service (NRCS) has ranked each soil series in terms of its limitations for use as a septic tank absorption field. Each soil series is placed in one of three categories: slightly limited, moderately limited, or severely limited. Use of septic absorption fields in moderately or severely limited soils generally requires special design, planning, and/or maintenance to overcome the limitations and ensure proper function. Table 3 summarizes the soils series mapped in the Flat Lake watershed in terms of their suitability for use as septic tank absorption fields. Figure 7 displays the septic tanks absorption field suitability of soils mapped in the Flat Lake watershed.
JFNew File #99-08-24L/01 Page 12
Flat Lake Watershed Management Plan June 11, 2003 Marshall County, Indiana
Table 3. Soil types present in the Flat Lake watershed. Symbol Name High Water
Table Suitability for Septic Tank Absorption Field
Ad Adrian muck +0.5-1.0 ft Severe: ponding AuA Aubbeenaubbee sandy loam 1-3 ft Severe: wetness Bd Brady sandy loam 1-3 ft Severe: wetness, poor filter BeA Brems sand 2-3 ft Severe: wetness, poor filter BoA Bronson loamy sand 2-3.5 ft Severe: wetness, poor filter Br Brookston loam +0.5-1.0 ft Severe: ponding ChB-ChC Chelsea fine sand >6 ft Severe: poor filter CtA Crosier loam 1-3 ft Severe: percs slowly, wetness Ed Edwards muck +0.5-0.5 ft Severe: ponding, percs slowly FsA Fox sandy loam >6 ft Severe: poor filter Gf Gilford sandy loam +0.5-1 ft Severe: ponding, poor filter HdB Hillsdale sandy loam >6 ft Moderate: percs slowly Ho; Hp Houghton muck +2-1 ft Severe: ponding, percs slowly MeA-MeB Martinsville loam >6 ft Slight MgB-MgC Metea loamy fine sand >6 ft Moderate: percs slowly, slope Mn Milford silty clay loam +0.5-2 ft Severe: ponding, percs slowly Ne Newton loamy fine sand +1.5-1 ft Severe: ponding, poor filter OsA-OsD; OwA Oshtemo loamy sand >6 ft Slight-Severe: slope
Pa Palms muck +0.5-1 ft Severe: ponding PsA; PsC-PsD Plainfield sand >6 ft Severe: poor filter
Re Rensselaer loam +1.5-1 ft Severe: ponding, poor filter RsA-RsB; RsC2; RsD Riddles sandy loam >6 ft Moderate-Severe: percs
slowly, slope TyA Tyner loamy sand >6 ft Severe: poor filter Ua Udorthents, loamy -- -- Wa Wallkill loam +0.5-0.5 ft Severe: ponding Wh Washtenaw silty loam +0.5-1 ft Severe: ponding WkB Wawasee sandy loam >6 ft Slight Wt Whitaker loam 1-3 ft Severe: wetness Source: Smallwood, 1980.
JFNew File #99-08-24L/01 Page 13

Flat Lake Watershed Management Plan June 11, 2003 Marshall County, Indiana
JFNew File #99-08-24L/01 Page 14
Figure 7. Soil series septic tank absorption field suitability. Source: See Appendix A. Scale: 1”=3,000’.
Flat Lake Watershed Management Plan June 11, 2003 Marshall County, Indiana
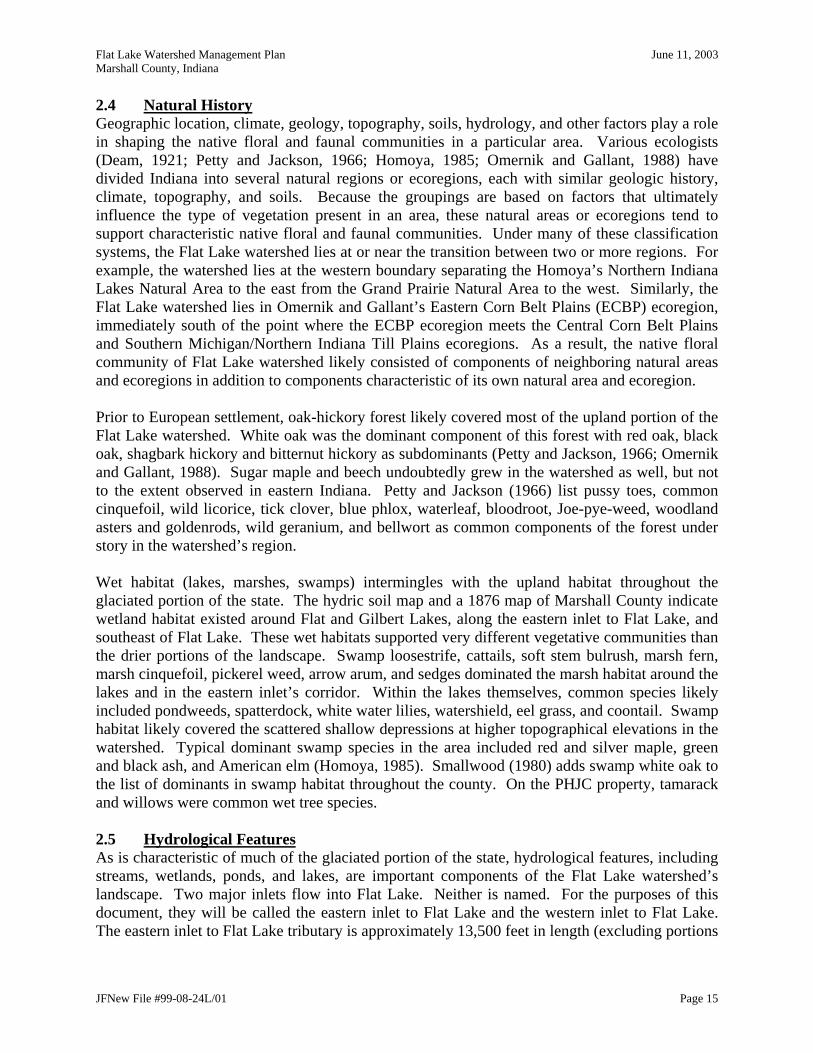
2.4 Natural History Geographic location, climate, geology, topography, soils, hydrology, and other factors play a role in shaping the native floral and faunal communities in a particular area. Various ecologists (Deam, 1921; Petty and Jackson, 1966; Homoya, 1985; Omernik and Gallant, 1988) have divided Indiana into several natural regions or ecoregions, each with similar geologic history, climate, topography, and soils. Because the groupings are based on factors that ultimately influence the type of vegetation present in an area, these natural areas or ecoregions tend to support characteristic native floral and faunal communities. Under many of these classification systems, the Flat Lake watershed lies at or near the transition between two or more regions. For example, the watershed lies at the western boundary separating the Homoya’s Northern Indiana Lakes Natural Area to the east from the Grand Prairie Natural Area to the west. Similarly, the Flat Lake watershed lies in Omernik and Gallant’s Eastern Corn Belt Plains (ECBP) ecoregion, immediately south of the point where the ECBP ecoregion meets the Central Corn Belt Plains and Southern Michigan/Northern Indiana Till Plains ecoregions. As a result, the native floral community of Flat Lake watershed likely consisted of components of neighboring natural areas and ecoregions in addition to components characteristic of its own natural area and ecoregion. Prior to European settlement, oak-hickory forest likely covered most of the upland portion of the Flat Lake watershed. White oak was the dominant component of this forest with red oak, black oak, shagbark hickory and bitternut hickory as subdominants (Petty and Jackson, 1966; Omernik and Gallant, 1988). Sugar maple and beech undoubtedly grew in the watershed as well, but not to the extent observed in eastern Indiana. Petty and Jackson (1966) list pussy toes, common cinquefoil, wild licorice, tick clover, blue phlox, waterleaf, bloodroot, Joe-pye-weed, woodland asters and goldenrods, wild geranium, and bellwort as common components of the forest under story in the watershed’s region. Wet habitat (lakes, marshes, swamps) intermingles with the upland habitat throughout the glaciated portion of the state. The hydric soil map and a 1876 map of Marshall County indicate wetland habitat existed around Flat and Gilbert Lakes, along the eastern inlet to Flat Lake, and southeast of Flat Lake. These wet habitats supported very different vegetative communities than the drier portions of the landscape. Swamp loosestrife, cattails, soft stem bulrush, marsh fern, marsh cinquefoil, pickerel weed, arrow arum, and sedges dominated the marsh habitat around the lakes and in the eastern inlet’s corridor. Within the lakes themselves, common species likely included pondweeds, spatterdock, white water lilies, watershield, eel grass, and coontail. Swamp habitat likely covered the scattered shallow depressions at higher topographical elevations in the watershed. Typical dominant swamp species in the area included red and silver maple, green and black ash, and American elm (Homoya, 1985). Smallwood (1980) adds swamp white oak to the list of dominants in swamp habitat throughout the county. On the PHJC property, tamarack and willows were common wet tree species. 2.5 Hydrological Features As is characteristic of much of the glaciated portion of the state, hydrological features, including streams, wetlands, ponds, and lakes, are important components of the Flat Lake watershed’s landscape. Two major inlets flow into Flat Lake. Neither is named. For the purposes of this document, they will be called the eastern inlet to Flat Lake and the western inlet to Flat Lake. The eastern inlet to Flat Lake tributary is approximately 13,500 feet in length (excluding portions
JFNew File #99-08-24L/01 Page 15
Flat Lake Watershed Management Plan June 11, 2003 Marshall County, Indiana
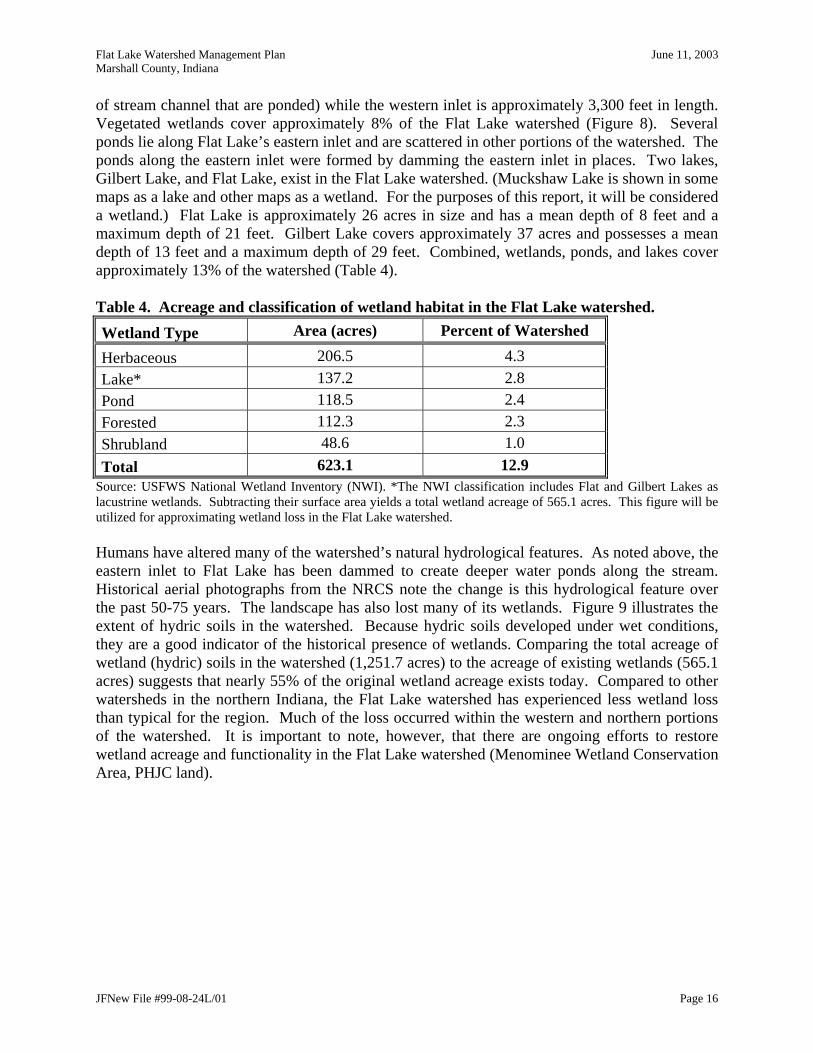
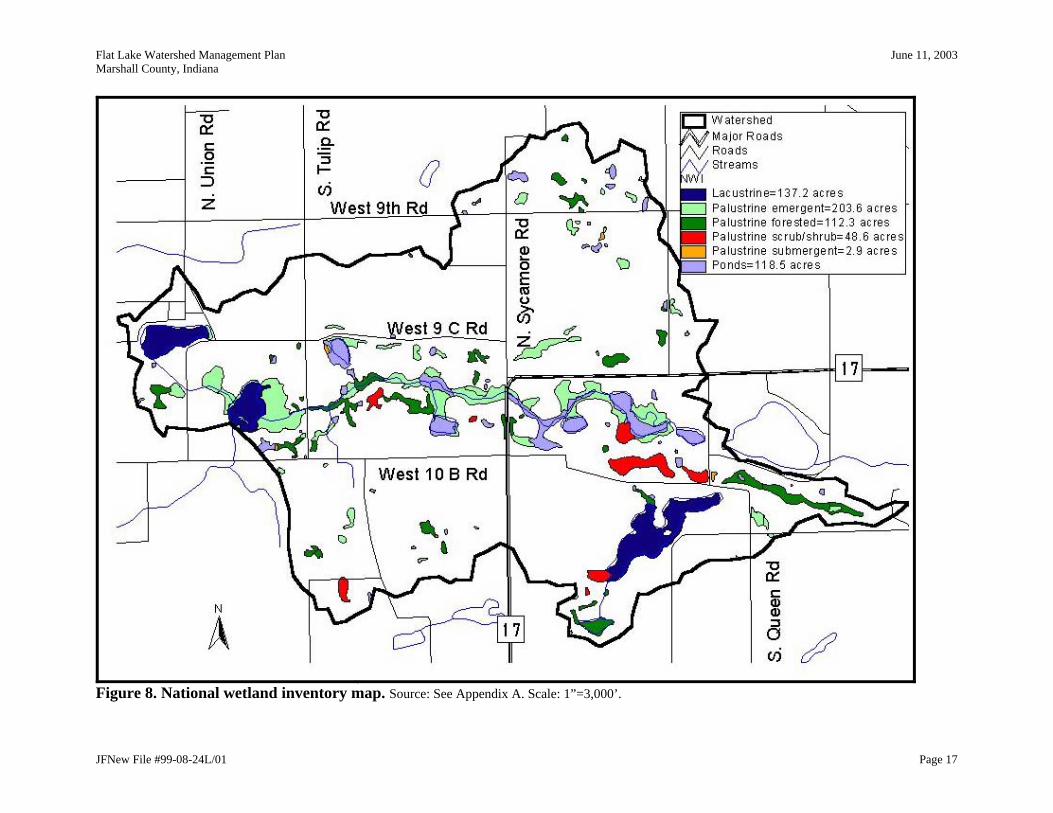
of stream channel that are ponded) while the western inlet is approximately 3,300 feet in length. Vegetated wetlands cover approximately 8% of the Flat Lake watershed (Figure 8). Several ponds lie along Flat Lake’s eastern inlet and are scattered in other portions of the watershed. The ponds along the eastern inlet were formed by damming the eastern inlet in places. Two lakes, Gilbert Lake, and Flat Lake, exist in the Flat Lake watershed. (Muckshaw Lake is shown in some maps as a lake and other maps as a wetland. For the purposes of this report, it will be considered a wetland.) Flat Lake is approximately 26 acres in size and has a mean depth of 8 feet and a maximum depth of 21 feet. Gilbert Lake covers approximately 37 acres and possesses a mean depth of 13 feet and a maximum depth of 29 feet. Combined, wetlands, ponds, and lakes cover approximately 13% of the watershed (Table 4). Table 4. Acreage and classification of wetland habitat in the Flat Lake watershed. Wetland Type Area (acres) Percent of Watershed
Herbaceous 206.5 4.3 Lake* 137.2 2.8 Pond 118.5 2.4 Forested 112.3 2.3 Shrubland 48.6 1.0 Total 623.1 12.9
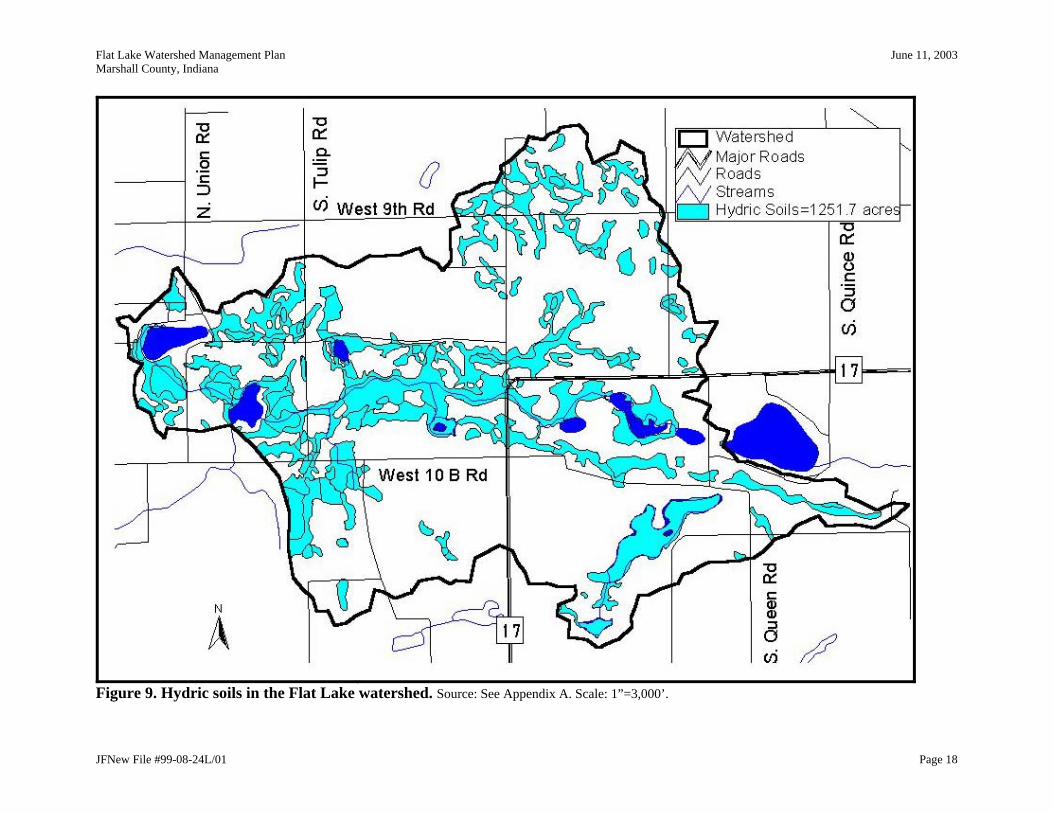
Source: USFWS National Wetland Inventory (NWI). *The NWI classification includes Flat and Gilbert Lakes as lacustrine wetlands. Subtracting their surface area yields a total wetland acreage of 565.1 acres. This figure will be utilized for approximating wetland loss in the Flat Lake watershed. Humans have altered many of the watershed’s natural hydrological features. As noted above, the eastern inlet to Flat Lake has been dammed to create deeper water ponds along the stream. Historical aerial photographs from the NRCS note the change is this hydrological feature over the past 50-75 years. The landscape has also lost many of its wetlands. Figure 9 illustrates the extent of hydric soils in the watershed. Because hydric soils developed under wet conditions, they are a good indicator of the historical presence of wetlands. Comparing the total acreage of wetland (hydric) soils in the watershed (1,251.7 acres) to the acreage of existing wetlands (565.1 acres) suggests that nearly 55% of the original wetland acreage exists today. Compared to other watersheds in the northern Indiana, the Flat Lake watershed has experienced less wetland loss than typical for the region. Much of the loss occurred within the western and northern portions of the watershed. It is important to note, however, that there are ongoing efforts to restore wetland acreage and functionality in the Flat Lake watershed (Menominee Wetland Conservation Area, PHJC land).
JFNew File #99-08-24L/01 Page 16
Flat Lake Watershed Management Plan June 11, 2003 Marshall County, Indiana
JFNew File #99-08-24L/01 Page 17
Figure 8. National wetland inventory map. Source: See Appendix A. Scale: 1”=3,000’.
Flat Lake Watershed Management Plan June 11, 2003 Marshall County, Indiana
JFNew File #99-08-24L/01 Page 18
Figure 9. Hydric soils in the Flat Lake watershed. Source: See Appendix A. Scale: 1”=3,000’.
Flat Lake Watershed Management Plan June 11, 2003 Marshall County, Indiana
2.6 Natural Communities and Endangered, Threatened, and Rare Species The Indiana Natural Heritage Data Center database provides information on the presence of endangered, threatened, or rare species, high quality natural communities, and natural areas in Indiana. The database was developed to assist in documenting the presence of special species and significant natural areas and to serve as a tool for setting management priorities in areas where special species or habitats exist. The database relies on observations from individuals rather than systematic field surveys by the Indiana Department of Natural Resources. Because of this, it does not document every occurrence of special species or habitat. At the same time, the listing of a species or natural area does not guarantee that the listed species is currently present or that the listed area is in pristine condition. The database includes the date that the species or special habitat was last observed in a specific location. Appendix C presents the results from the database search for endangered, threatened, or rare species and high quality natural communities the Flat Lake watershed. (Appendix C also includes a listing of endangered, threatened, and rare species and high quality natural communities documented in Marshall County for additional reference.) According to the database, the Flat Lake watershed and the area immediately adjacent to the watershed supports only one endangered, threatened, or rare animal or plant. The listed animal is the state endangered American badger, which was found in Section 33, Township 34 North, Range 1 East. The last reported observation of this species occurred in 1985. The Flat Lake watershed also supports one high quality community: a wetland muck flat in Sections 8-10, Township 33 North, Range 1 East. This community is a state significant community. Although they are not listed in the Natural Heritage Database, several other rare or diminishing species have been noted in the watershed. A watershed stakeholder has repeatedly observed the presence of a pair of red shouldered hawks (Buteo lineatus) on the PHJC property (Mary Baird, personal communication). Red shouldered hawks are species of special concern in Indiana. Baird also reports the possible sighting of an ornate box turtle (Terrapene ornata) and definite observation of nesting red headed woodpeckers (Melanerpes erythrocephalus). Ornate box turtles are state endangered species. As noted below, ornate box turtles do exist in Marshall County, so a sighting of one in the Flat Lake watershed is not unrealistic. Red headed woodpeckers are not rare, but their populations are diminishing. The recently restored wetland immediately south of Gilbert Lake which supports a diverse population of native plant species is worth mentioning as well. A botanical survey conducted in the restored 12-acre wetland in August 2002 revealed the presence of over 120 native species. (Appendix C provides a listing of all the species found in the restored wetland.) These species included one state endangered plant, swamp smartweed (Polygonum hydropepperoides var. setaceum), and several very conservative species such as winged oval sedge (Carex alata), swamp thistle (Cirsium muticum), umbrella flat sedge (Cyperus diandrus), and swamp saxifrage (Saxifraga pensylvanica). Additionally, this restored wetland possessed a Floristic Quality Index (FQI) score of 49.9 and a mean conservatism value (mean c) of 4.7. Areas with FQI scores over 45 or mean c values greater than 4.5 are almost certain to have natural area potential (Swink and Wilhelm, 1994).
JFNew File #99-08-24L/01 Page 19
Flat Lake Watershed Management Plan June 11, 2003 Marshall County, Indiana
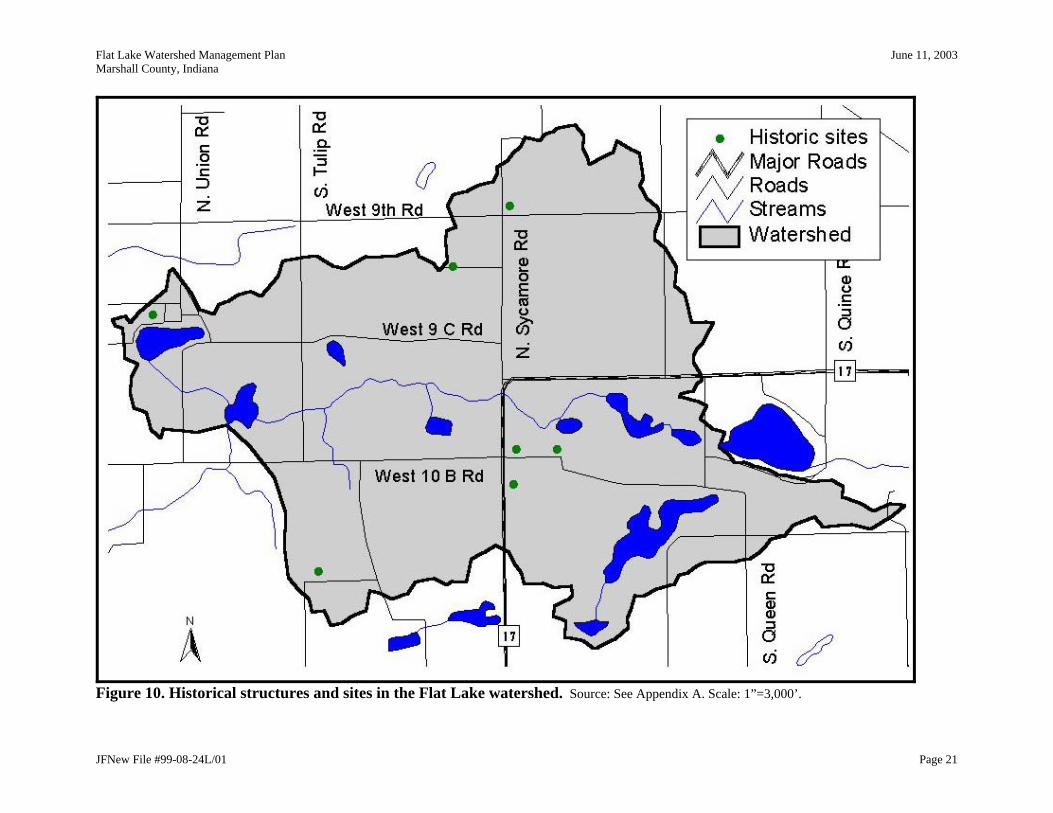
Marshall County supports a variety of endangered, threatened, and rare animals and plants. The listed animals include six reptiles: four turtles, the spotted turtle (Clemmys guttata), Kirtland’s turtle (Clonophis kirtlandii), Blanding’s turtle (Emydoidea blandingii), and the ornate box turtle, and two snakes, Butler’s garter snake (Thamnophi butleri) and the eastern massasauga (Sistrurus catenatus catenatus). Eleven birds, including the great blue heron (Ardea herodias) and the sharp-shinned hawk (Accipiter striatus), and two mammals are also listed. Nearly all of the listed plants are hydrophytic plants, likely remnants from the original marshes that covered much of Marshall County. The county also supports five high quality communities, including mesic prairie, marl beach, acid bog, fen, and muck flat. 2.7 Early History and Land Use Early settlers began arriving to the area over 200 years ago. Prior to European settlement, the Pottawatomie lived in the Flat Lake watershed. Smallwood (1980) notes that early surveyors platted the City of Plymouth in 1834. Settlers undoubtedly moved out from the city into the surrounding countryside soon after that. In 1954, county planners carved West Township, the township that encompasses the Flat Lake watershed, out of Center Township (Historic Landmarks Foundation, 1990). Surveyors had completely platted the county in 1878 (Smallwood, 1980). Glimpses of the watershed’s early days can be seen in the historic landmarks that survive today. Figure 10 maps some of these notable landmarks, which include homes, farmsteads, and cemeteries dating back to the mid-1800’s. The Ancilla Domini convent is also considered an outstanding historic landmark (Historic Landmarks Foundation, 1990).
JFNew File #99-08-24L/01 Page 20
Flat Lake Watershed Management Plan June 11, 2003 Marshall County, Indiana
JFNew File #99-08-24L/01 Page 21
Figure 10. Historical structures and sites in the Flat Lake watershed. Source: See Appendix A. Scale: 1”=3,000’.
Flat Lake Watershed Management Plan June 11, 2003 Marshall County, Indiana
As people settled the land, they began clearing forested uplands and draining wet lowlands to allow for agricultural production. One of the earliest (1876) maps of the area shows extensive wet habitat in the watershed. The 1922 plat map suggests some of this wet habitat had been drained. The 1948 plat map shows a distinct creek rather than wet or ponded habitat along much of Flat Lake’s eastern inlet corridor. 1939 and 1951 aerial photography obtained from the NRCS lends further evidence to the hypothesis that early property owners drained portions of the wet corridor along the eastern inlet in an attempt to farm the property. The aerial photography from the first half of the twentieth century also suggests that property owners may have given up trying to drain the wettest portion of the eastern inlet corridor. The 1951 photograph distinctly shows a dam across the eastern inlet immediately west of Pretty Lake, creating a small pond that exists today. This dam is not present in the 1939 photograph. Similarly, the 1951 photograph lacks a second pond located downstream of this first pond. Property owners must have constructed a second dam on the eastern inlet to create the second pond sometime after 1951. Both ponds lie in Houghton muck. The extremely poor drainage capacity of Houghton muck prevents its use as reliable farmland, unless extensive tiling and ditching assists with drainage. (High quality copies of the historical aerial photographs of the watershed could not be obtained for this document. Interested parties may contact the NRCS to review these photographs.) Figure 11 and Table 5 present current land use information for the Flat Lake watershed. Land use data from the U.S. Geological Survey forms the basis of Figure 11. Agricultural land uses dominate the Flat Lake watershed. Row crop agricultural areas cover approximately half of the watershed. Pasture occupies an additional 19% of the watershed. The natural landscape remains on a smaller portion of the watershed. Forested land exists on approximately 22% of the watershed. Wetlands and open water cover nearly 12% of the watershed. (This number differs slightly from the one in the Hydrological Features Section since different data sources are utilized.) Most of the wetlands in the watershed lie in the eastern tip of the watershed (southeast of State Road 17) or border the eastern inlet to Flat Lake. Flat and Gilbert Lakes account for nearly half of the open water acreage; the remaining portion consists of ponds and Muckshaw Lake. (The 1936 Marshall County Plat Map identifies the body of water southwest of Pretty Lake as Muckshaw Lake.) Developed areas (Ancilla Domini Convent, Ancilla College, and residential properties) cover less than 1% of the watershed.
JFNew File #99-08-24L/01 Page 22

Flat Lake Watershed Management Plan June 11, 2003 Marshall County, Indiana
JFNew File #99-08-24L/01 Page 23
Figure 11. Land use in the Flat Lake watershed. Source: See Appendix A. Scale: 1’=3,000’.
Flat Lake Watershed Management Plan June 11, 2003 Marshall County, Indiana
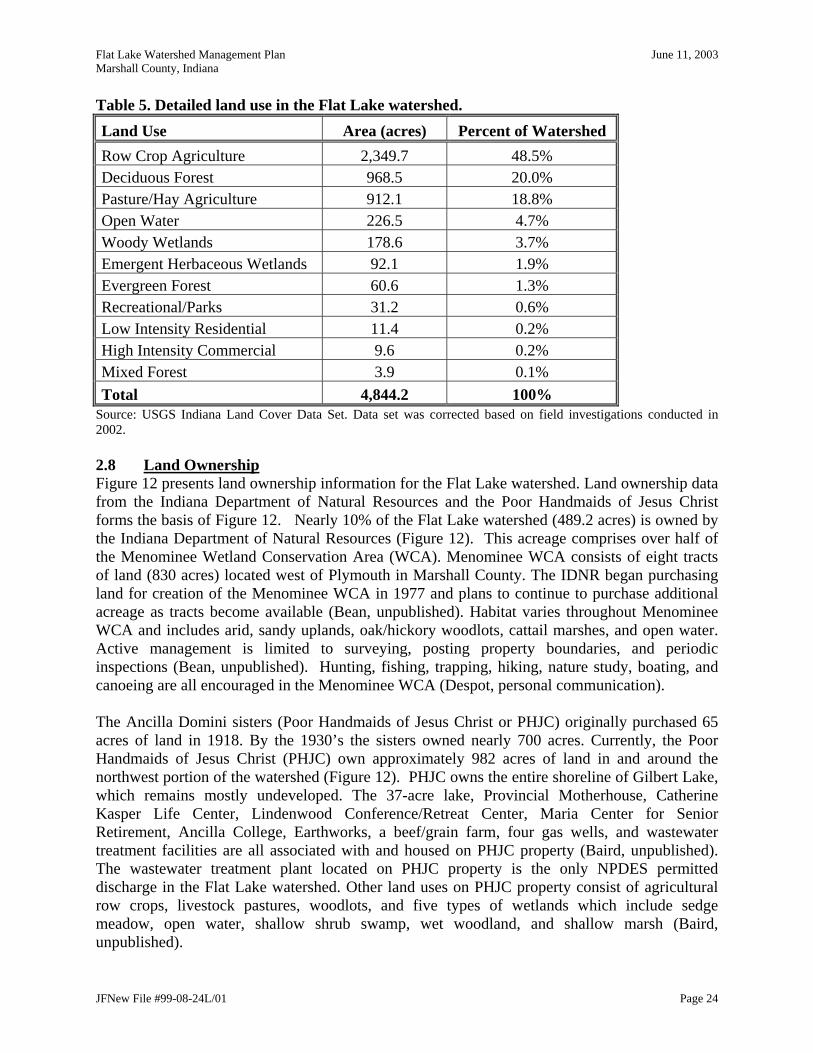
Table 5. Detailed land use in the Flat Lake watershed. Land Use Area (acres) Percent of Watershed Row Crop Agriculture 2,349.7 48.5% Deciduous Forest 968.5 20.0% Pasture/Hay Agriculture 912.1 18.8% Open Water 226.5 4.7% Woody Wetlands 178.6 3.7% Emergent Herbaceous Wetlands 92.1 1.9% Evergreen Forest 60.6 1.3% Recreational/Parks 31.2 0.6% Low Intensity Residential 11.4 0.2% High Intensity Commercial 9.6 0.2% Mixed Forest 3.9 0.1% Total 4,844.2 100%
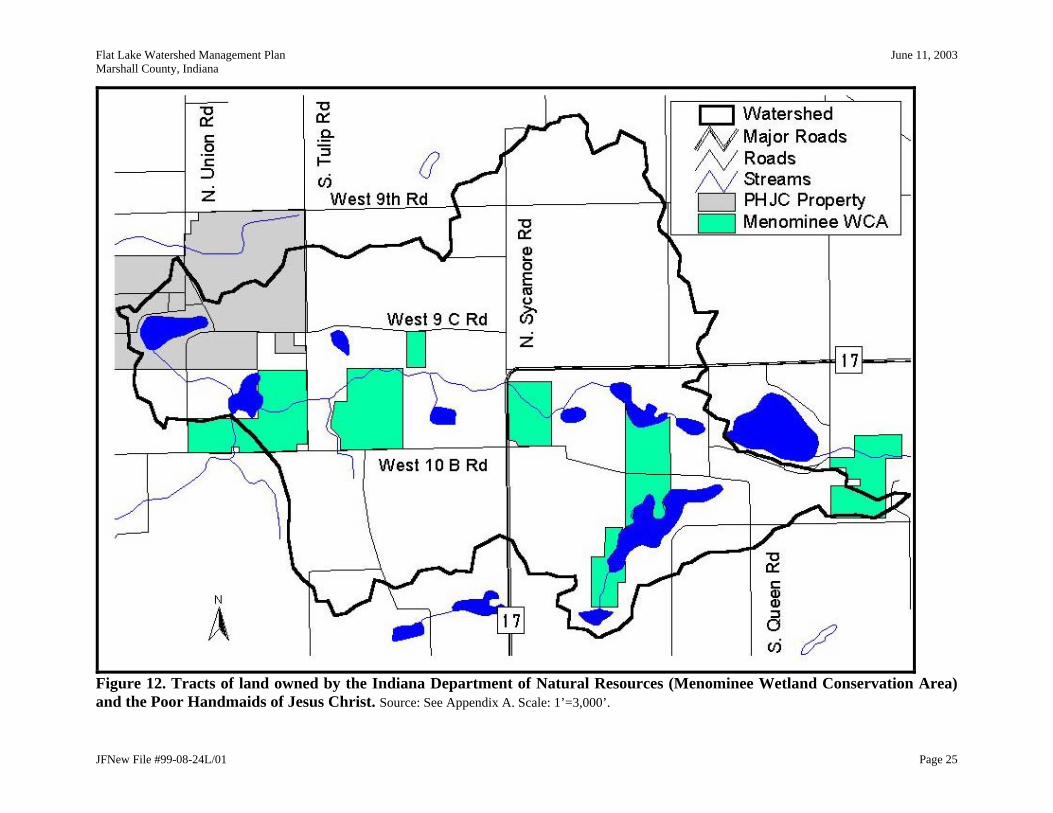
Source: USGS Indiana Land Cover Data Set. Data set was corrected based on field investigations conducted in 2002. 2.8 Land Ownership Figure 12 presents land ownership information for the Flat Lake watershed. Land ownership data from the Indiana Department of Natural Resources and the Poor Handmaids of Jesus Christ forms the basis of Figure 12. Nearly 10% of the Flat Lake watershed (489.2 acres) is owned by the Indiana Department of Natural Resources (Figure 12). This acreage comprises over half of the Menominee Wetland Conservation Area (WCA). Menominee WCA consists of eight tracts of land (830 acres) located west of Plymouth in Marshall County. The IDNR began purchasing land for creation of the Menominee WCA in 1977 and plans to continue to purchase additional acreage as tracts become available (Bean, unpublished). Habitat varies throughout Menominee WCA and includes arid, sandy uplands, oak/hickory woodlots, cattail marshes, and open water. Active management is limited to surveying, posting property boundaries, and periodic inspections (Bean, unpublished). Hunting, fishing, trapping, hiking, nature study, boating, and canoeing are all encouraged in the Menominee WCA (Despot, personal communication). The Ancilla Domini sisters (Poor Handmaids of Jesus Christ or PHJC) originally purchased 65 acres of land in 1918. By the 1930’s the sisters owned nearly 700 acres. Currently, the Poor Handmaids of Jesus Christ (PHJC) own approximately 982 acres of land in and around the northwest portion of the watershed (Figure 12). PHJC owns the entire shoreline of Gilbert Lake, which remains mostly undeveloped. The 37-acre lake, Provincial Motherhouse, Catherine Kasper Life Center, Lindenwood Conference/Retreat Center, Maria Center for Senior Retirement, Ancilla College, Earthworks, a beef/grain farm, four gas wells, and wastewater treatment facilities are all associated with and housed on PHJC property (Baird, unpublished). The wastewater treatment plant located on PHJC property is the only NPDES permitted discharge in the Flat Lake watershed. Other land uses on PHJC property consist of agricultural row crops, livestock pastures, woodlots, and five types of wetlands which include sedge meadow, open water, shallow shrub swamp, wet woodland, and shallow marsh (Baird, unpublished).
JFNew File #99-08-24L/01 Page 24
Flat Lake Watershed Management Plan June 11, 2003 Marshall County, Indiana
Figure 12. Tracts of land owned by the Indiana Department of Natural Resources (Menominee Wetland Conservation Area) and the Poor Handmaids of Jesus Christ. Source: See Appendix A. Scale: 1’=3,000’.
JFNew File #99-08-24L/01 Page 25

Flat Lake Watershed Management Plan June 11, 2003 Marshall County, Indiana
3.0 IDENTIFIED PROBLEMS An array of water quality and related problems were identified during development of the Flat Lake Watershed Management Plan. Watershed stakeholders began compiling a list of problems during the first public meeting. JFNew expanded the problem list through a review of existing water quality and related reports from a variety of sources; conversations with representatives from local natural resource agencies; water quality assessment; and subwatershed modeling. The following sections list the key reference documents used to develop the list of water quality problems, outline the results of the water quality assessment conducted as a part of this plan’s development, and suggest the sources of common pollutants causing the most problems in the watershed. Section 3.4 summarizes these items in a table format. 3.1 Key Reference Documents Below is a list of key documents used in identifying water quality and related problems in the Flat Lake watershed and the larger Kankakee River basin. Although some of the documents listed below may not have been used directly in identifying water quality concerns, they are included below because they provide an excellent overview of water quality and related issues in the larger Kankakee River basin and may be useful in future planning efforts in the Flat Lake watershed. Additionally, Commonwealth Biomonitoring recently completed a master plan for the PHJC property. Recommendations made in this report should be considered in future versions of this watershed management plan.
Baird, Sr. M. 2002. Ancilla Domini Land Design. This report details the historical and existing condition of the natural resources on the PHJC property. It also describes the natural resource assets on the property and highlights some problems that need to be addressed in the future.
Indiana Clean Lakes Program. 2002. File data (1990, 1995, 1999). School of Public and
Environmental Affairs, Indiana University, Bloomington, Indiana. The Indiana Department of Environmental Management administers the Indiana Clean Lakes Program. Under contract from Indiana Department of Environmental Management, Indiana University’s School of Public and Environmental Affairs assesses all lakes in Indiana on a five-year rotating basin system for the Indiana Clean Lakes Program. Data presented in the files included water chemistry data (temperature, pH, alkalinity, conductivity, dissolved oxygen concentration, and nutrient concentrations), water clarity data, light penetration data, and algal community data. The files also include the lakes’ Indiana Trophic State Index score. Gilbert and Flat Lakes were both assessed in 1990, 1995, and 1999.
Indiana Clean Lakes Program Volunteer Monitoring Program. 2002. File data (1990-
1993). School of Public and Environmental Affairs, Indiana University, Bloomington, Indiana. Under contract from Indiana Department of Environmental Management, Indiana University’s School of Public and Environmental Affairs coordinates volunteer lake monitoring activities at more than 125 lakes throughout the state. Citizen volunteers primarily collected water clarity data. Both Gilbert and Flat Lake were assessed by volunteer lake monitors from 1990 to 1993.
JFNew File #99-08-24L/01 Page 26
Flat Lake Watershed Management Plan June 11, 2003 Marshall County, Indiana
Indiana Department of Environmental Management. 1990. Macroinvertebrate sampling data files. The Indiana Department of Environmental Management Biological Surveys Section conducts macroinvertebrate surveys on streams in Indiana to evaluate whether or not the stream is meeting its aquatic life use designation. In 1990, the BSS conducted a survey in the eastern inlet to Flat Lake at Tulip Road. This sample site corresponds to Site 2 of the water quality survey conducted as part of the development of this watershed management plan.
Indiana Department of Environmental Management. 1996. Indiana 305(b) Report 1994-
1995. Office of Water Quality, Indianapolis, Indiana. 305(b) refers to Section 305(b) of the Clean Water Act. The 305(b) report is IDEM’s biennial report to Congress outlining the conditions of the state’s water resources and reporting on the progress the state has made toward achieving the goals of the Clean Water Act (i.e. that all waters are fishable and swimmable).
Indiana Department of Environmental Management. 1999. Unified Watershed
Assessment. Division of Water. Indianapolis, Indiana. Indiana Department of Environmental Management completed the “Unified Watershed Assessment”. Local, state, and federal agencies and the public evaluated 15 water quality and related parameters (lake fisheries data, Eurasian water milfoil infestation data, aquatic life use support data, recreational use data, lake trophic scores, stream fisheries data, mussel diversity, critical biological resources data, aquifer vulnerability data, surface drinking water use, septic system density, urbanization statistics, livestock production, crop production, and mineral resource extraction data) to identify both healthy and impaired 11-digit watersheds.
Indiana Department of Environmental Management. 2001. Kankakee River Watershed
Restoration Action Strategy (WRAS). Office of Water Quality, Indianapolis, Indiana. Indiana Department of Environmental Management completed the “Kankakee River Watershed Restoration Strategy” to provide baseline background information. The WRAS documents water quality concerns and issues and recommends mechanisms for improving water quality throughout the 8-digit Kankakee River watershed.
Indiana State Board of Health. 1975. Indiana Department of Environmental Management
data files. In the early 1970’s, Indiana State Board of Health surveyed all of Indiana’s public lakes documenting many of the same parameters that the Indiana Clean Lakes Program documents today. Gilbert Lake was evaluated during this statewide lake evaluation effort.
Indiana Department of Natural Resources. 1997. Preliminary Study of Galbraith Lake
(Gilbert), Marshall County, Indiana. Indiana Department of Natural Resources. Lake and River Enhancement Program. Indianapolis, Indiana. The diagnostic study documents current and historical water quality issues within Gilbert Lake and its watershed. The report also lists management alternatives and restoration recommendations.
JFNew File #99-08-24L/01 Page 27
Flat Lake Watershed Management Plan June 11, 2003 Marshall County, Indiana
Robertson, B. 1971. Gilbert Lake, Fish Management Report. Indiana Department of Natural Resources, Division of Fish and Wildlife. Indianapolis, Indiana. In 1970, Indiana Department of Natural Resources biologists surveyed the fish and plant communities and assessed basic water quality (temperature, dissolved oxygen, pH, alkalinity, and water clarity) in Gilbert Lake. The report includes a synopsis of the surveys and provides general fisheries management recommendations for Gilbert Lake.
Robertson, B. 1971. Flat (Mud) Lake, Fish Management Report. Indiana Department of
Natural Resources. Indianapolis, Indiana. In 1970, Indiana Department of Natural Resources biologists surveyed the fish and plant communities and assessed water quality within Gilbert Lake. The report includes a synopsis of the surveys and provides general fisheries management recommendations for Flat Lake.
Robertson, B. 1974. Gilbert Lake, Fish Management Report. Indiana Department of
Natural Resources. Indianapolis, Indiana. In 1973, Indiana Department of Natural Resources biologists surveyed the fish and plant communities and basic water quality (temperature, dissolved oxygen, pH, alkalinity, and water clarity) in Gilbert Lake. The report includes a synopsis of the surveys and provides general fisheries management recommendations for Gilbert Lake. This report documents the condition of the Gilbert Lake fish community following the fisheries renovation (rotenone treatment and restocking).
Robertson, B. 1975. Gilbert Lake, Fish Management Report. Indiana Department of
Natural Resources. Indianapolis, Indiana. In 1974, Indiana Department of Natural Resources biologists surveyed the fish and plant communities and assessed basic water quality (temperature, dissolved oxygen, pH, alkalinity, and water clarity) in Gilbert Lake. The report includes a synopsis of the surveys and provides general fisheries management recommendations for Gilbert Lake.
Robertson, B. 1977. Flat (Mud) Lake, Fish Management Report. Indiana Department of
Natural Resources. Indianapolis, Indiana. In 1976, Indiana Department of Natural Resources biologists surveyed the fish community and assessed water quality within Gilbert Lake. The report includes a synopsis of the surveys and provides general fisheries management recommendations for Flat Lake.
Robertson, B. 1977. Gilbert Lake, Fish Management Report. Indiana Department of
Natural Resources. Indianapolis, Indiana. In 1976 and 1977, Indiana Department of Natural Resources biologists surveyed the fish community and assessed basic water quality (temperature, dissolved oxygen, pH, alkalinity, and water clarity) in Gilbert Lake. The report includes a synopsis of the surveys and provides general fisheries management recommendations for Gilbert Lake. The report also documents the fish kill observed during the harsh winter of 1976-1977.
Robertson, B. 1979. Gilbert Lake, Fish Management Report. Indiana Department of
Natural Resources. Indianapolis, Indiana. In 1978, Indiana Department of Natural Resources biologists surveyed the fish community in Gilbert Lake. The report includes a
JFNew File #99-08-24L/01 Page 28
Flat Lake Watershed Management Plan June 11, 2003 Marshall County, Indiana
synopsis of the survey and provides general fisheries management recommendations for Gilbert Lake.
Robertson, B. 1980. Flat (Mud) Lake, Fish Management Report. Indiana Department of
Natural Resources. Indianapolis, Indiana. In 1979, Indiana Department of Natural Resources biologists surveyed the fish and plant communities and assessed water quality within Gilbert Lake. The report includes a synopsis of the surveys and provides general fisheries management recommendations for Flat Lake.
Robertson, B. 1980. Gilbert Lake, Fish Management Report. Indiana Department of
Natural Resources. Indianapolis, Indiana. In 1979, Indiana Department of Natural Resources biologists surveyed the fish and plant communities and assessed basic water quality (temperature, dissolved oxygen, pH, alkalinity, and water clarity) in Gilbert Lake. The report includes a synopsis of the surveys and provides general fisheries management recommendations for Gilbert Lake.
Robertson, B. 1992. Gilbert Lake, Fish Management Report. Indiana Department of
Natural Resources. Indianapolis, Indiana. In 1991, Indiana Department of Natural Resources biologists surveyed the fish community and assessed basic water quality (temperature, dissolved oxygen, pH, alkalinity, and water clarity) in Gilbert Lake. The report includes a synopsis of the surveys and provides general fisheries management recommendations for Gilbert Lake.
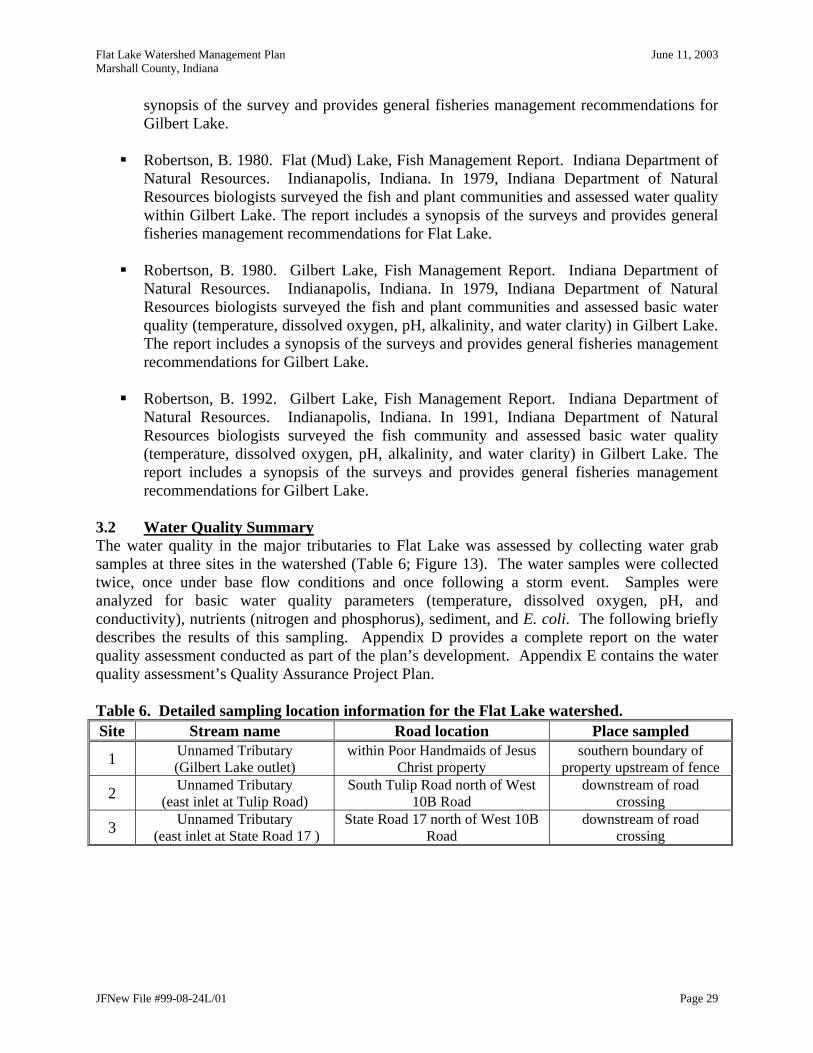
3.2 Water Quality Summary The water quality in the major tributaries to Flat Lake was assessed by collecting water grab samples at three sites in the watershed (Table 6; Figure 13). The water samples were collected twice, once under base flow conditions and once following a storm event. Samples were analyzed for basic water quality parameters (temperature, dissolved oxygen, pH, and conductivity), nutrients (nitrogen and phosphorus), sediment, and E. coli. The following briefly describes the results of this sampling. Appendix D provides a complete report on the water quality assessment conducted as part of the plan’s development. Appendix E contains the water quality assessment’s Quality Assurance Project Plan. Table 6. Detailed sampling location information for the Flat Lake watershed. Site Stream name Road location Place sampled
1 Unnamed Tributary (Gilbert Lake outlet)
within Poor Handmaids of Jesus Christ property
southern boundary of property upstream of fence
2 Unnamed Tributary (east inlet at Tulip Road)
South Tulip Road north of West 10B Road
downstream of road crossing
3 Unnamed Tributary (east inlet at State Road 17 )
State Road 17 north of West 10B Road
downstream of road crossing
JFNew File #99-08-24L/01 Page 29
Flat Lake Watershed Management Plan June 11, 2003 Marshall County, Indiana
JFNew File #99-08-24L/01 Page 30
Figure 13. Flat Lake watershed sampling site locations. Source: See Appendix A. Scale: 1”=3,000’.

Flat Lake Watershed Management Plan June 11, 2003 Marshall County, Indiana
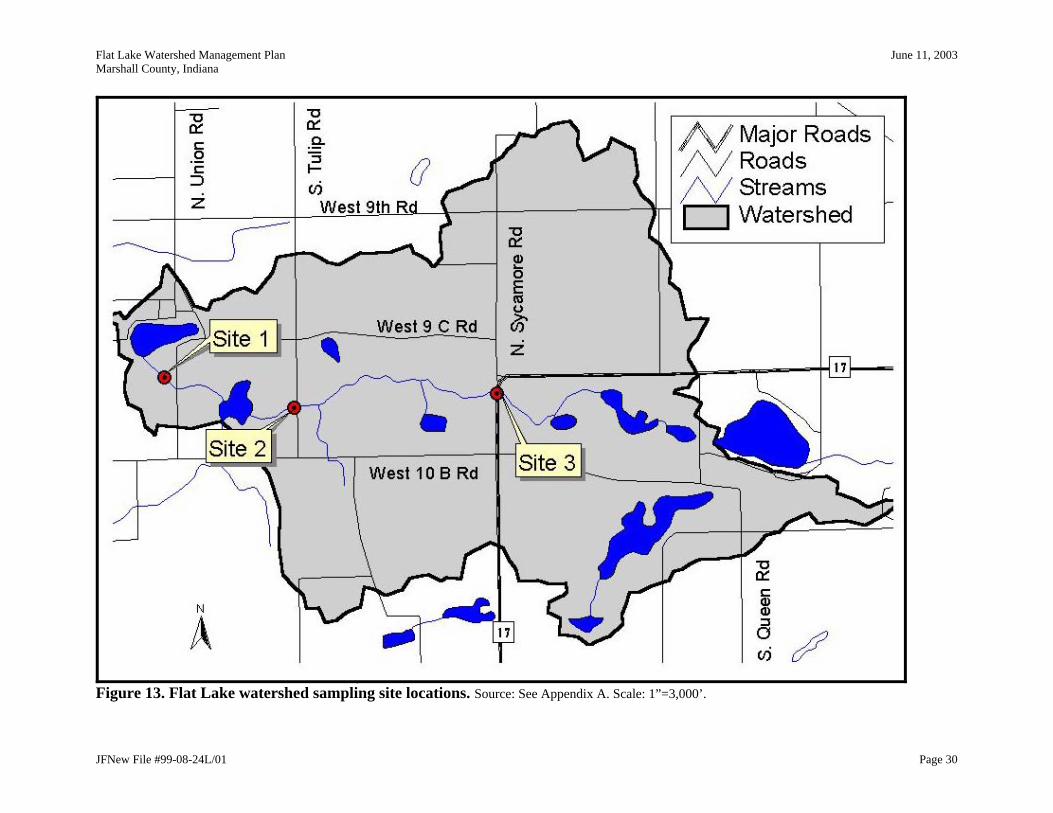
In general, physical and chemical parameter data collected from streams in the Flat Lake watershed indicate some evidence of water quality degradation when compared with ideal conditions. Dissolved oxygen levels were adequate in the east inlet to Flat Lake at Tulip Road (Site 2); however, one measurement recorded at the east inlet at State Road 17 and both measurements recorded at the Gilbert Lake outlet (Site 1) were below the state standard for dissolved oxygen. Low DO levels at these sites may be impairing the streams’ biotic communities. Nitrate-nitrogen and ammonia-nitrogen concentrations in the watershed streams were generally low and within levels acceptable for aquatic life survival. All sites were near or lower than the USEPA’s recommended nitrate-nitrogen criteria of 0.30 mg/L and all were lower than the Ohio EPA’s nitrate-nitrogen standard of 1.0 mg/L. In contrast, total Kjeldahl nitrogen and total phosphorus levels were slightly elevated. Total phosphorus concentrations generally exceeded various recommendations/standards set to protect aquatic life (USEPA, 2000; Ohio EPA, 1999; Dodd et al., 1998). Despite this, total Kjeldahl nitrogen and total phosphorus concentrations were not unusually high for Indiana streams. The elevated total Kjeldahl nitrogen and total phosphorus levels may be impairing the aquatic biota in the watershed streams and may be contributing to the eutrophication of Flat Lake. E. coli concentrations were generally low compared to the typical Indiana stream suggesting recreational use of the waterbodies in the Flat Lake watershed is acceptable. The exception to the many of the statements above is the Gilbert Lake outlet (Site 1). Dissolved oxygen levels were consistently low in this stream and were below levels necessary to sustain aquatic life. Pollutants concentrations, particularly during base flow, were very high. These high pollutant levels are likely impairing the stream’s biotic community and may be affecting downstream communities. Additionally, these pollutants are likely contributing to the eutrophication of Flat Lake. Pollutant loading rates for some parameters (ammonia-nitrogen, total Kjeldahl nitrogen, and total suspended solids) measured during storm event sampling in the Gilbert Lake outlet (Site 1) were comparable and sometimes greater than pollutant loading rates observed in the east inlet at State Road 17 (Site 3), despite the fact that the flow rate at Site 3 was more than twice the flow rate at Site 1. These results indicate that watershed management efforts to improve Flat Lake and overall water quality in the watershed should focus on the watershed draining Site 1 (Figure 14).
JFNew File #99-08-24L/01 Page 31
Flat Lake Watershed Management Plan June 11, 2003 Marshall County, Indiana
Figure 14. Critical areas targeted for improvement in the Flat Lake watershed. Source: See Appendix A. Scale: 1”=3,000’.
JFNew File #99-08-24L/01 Page 32

Flat Lake Watershed Management Plan June 11, 2003 Marshall County, Indiana
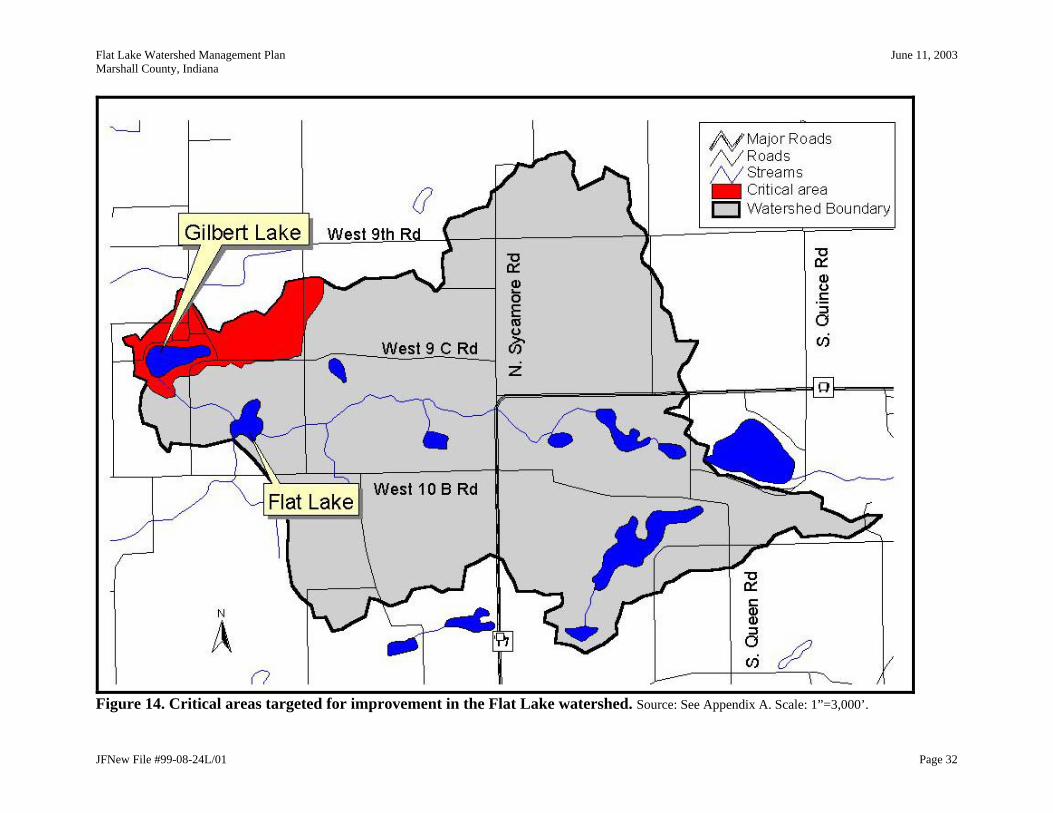
3.3 Sources of Pollutants Eutrophication was a common problem cited in many of the studies and key reference documents. Eutrophication, as defined by Cooke et al. (1993), is the excessive addition of nutrients and silt to lakes and streams causing an increase in biological productivity in the waterbody. The sampling conducted during the development of this watershed management plan also revealed high nutrient and sediment loads in some of the Flat Lake watershed streams. Understanding the sources of nutrients and sediment in the Flat Lake watershed is a critical component in developing an action plan to address the eutrophication problem in the watershed. The following summarizes the probable sources of these pollutants in the Flat Lake watershed. Common sources of silt in streams and lakes include unvegetated landscapes such as unvegetated stream banks, active farm fields, and active construction sites. Although not intuitive at first, hardscape (impervious surfaces) such as streets and parking lots can also be contributors of silt to waterways (Bannerman et al., 1993). Dirt on these surfaces often washes directly to storm drains. Gravel roads can also add sediment to nearby waterways. Of these sources, hardscape, a gravel road, and active farm fields exist in the Flat Lake watershed. A watershed tour did not reveal the presence of any active construction sites. Similarly observations made from road crossings and watershed maps indicate that the eastern inlet to Flat Lake, which accounts for most of the stream mileage in the watershed, has an intact riparian zone and little stream bank erosion. Most of the impervious surface in the watershed is concentrated on the PHJC property (Figure 12), while Tulip Road is the only public, gravel road. Management efforts to reduce sediment input from hardscape and gravel roads should focus on these two areas. Figure 11 shows the location of farm fields in row crop in the Flat Lake watershed. It is important to note that not all farm fields are prone to erosion. Those fields that are actively farmed in row crop agriculture on highly erodible and potentially highly erodible soils are more likely to erode than areas where soils are not as erodible. Approximately 800 acres of land is farmed in row crop agriculture on highly erodible and potentially highly erodible soils in the Flat Lake watershed (Figure 15). To assist with planning efforts, Figure 15 also includes the location of large tracts in the Conservation Reserve Program (CRP). The use of CRP on highly erodible or potentially highly erodible soil eliminates water quality concerns associated with farming practices. Similarly the use of CRP as field buffers down gradient of farmed, highly erodible tracts also eliminates some of the water quality concerns associated with farming practices. Management efforts aimed at reducing erosion from farm fields such as the use of CRP or conservation tillage in the Flat Lake watershed should target those areas shown on Figure 15 that are not bordered by CRP. The largest of these tracts occur along West 10 B Road and State Road 17.
JFNew File #99-08-24L/01 Page 33
Flat Lake Watershed Management Plan June 11, 2003 Marshall County, Indiana
Figure 15. Critical row crop agricultural areas in the Flat Lake watershed. Source: See Appendix A. Scale: 1”=3,000’.
JFNew File #99-08-24L/01 Page 34
Flat Lake Watershed Management Plan June 11, 2003 Marshall County, Indiana
Nutrients are also a key stressor in the Flat Lake watershed. Common sources of nutrients include fertilizers, atmospheric deposition in rainwater, human and wildlife waste, yard waste and other plant material that reaches a waterbody, soil (nutrients are often attached to the soil), and hardscape. A tour of the watershed and mapping of the watershed revealed that all of these sources as well as some others may contribute to the eutrophication of the lakes and streams in the watershed. Fertilizers are commonly used in variety of settings. Hot spots for the use of fertilizers in the Flat Lake watershed are the golf course in the eastern section of the watershed, residential property, and agricultural property (Figure 11). Nutrient input from human waste via septic systems may occur in the watershed. The most likely location(s) for this to occur is in areas where the soils are mapped as severely limited for use as a septic field (Figure 7). The PHJC waste water treatment facility is also a source of nutrients to Gilbert Lake. Cattle accessing Gilbert Lake and the Gilbert Lake outlet stream are a historical source of nutrients from animal waste. These areas have been fenced to prevent the cattle from accessing the waterbodies. Farmed areas on highly erodible soils contribute to nutrients to the watershed waterbodies when they contribute soil to the waterbodies. Impervious surfaces have been found to be a critical contributor of nutrients (Bannerman et al., 1993). Hardscape areas and areas where soil loss is prevalent in the Flat Lake watershed are noted above. Management efforts aimed at reducing nutrient loading to the watershed’s waterbodies should target these sources. Another source of nutrients may exist. Phosphorus may be released from the bottom of Flat and Gilbert Lakes via chemical reactions that occur when the lakes are stratified or under specific water chemistry conditions. In stratified lakes where the hypolimnion is anoxic, phosphorus bound to iron can be released. Similarly, when sediment with phosphorus bound to it is churned up by wind/wave action, phosphorus may be released if the pH of the water is high enough (approximately 9). Data collected by the Indiana Clean Lakes Program and the Indiana Department of Natural Resources, Division of Fish and Wildlife suggest that both types of internal phosphorus loading are likely occurring at least in Gilbert Lake. In lakes with a history of nutrient loading, such as Gilbert Lake, internal phosphorus loading can account for 70% or more of the total phosphorus budget. This source of phosphorus must be considered in management of the lake. Some steps have already been taken to manage the sources of nutrients and sediment in the watershed. The PHJC is upgrading their waste water treatment facility. They have also installed a waste water wetland to treat the waste stream from Earthworks which is located along the southern shoreline of Gilbert Lake. The PHJC has fenced Gilbert Lake and the lake’s outlet stream, preventing cattle from accessing the waterbodies. Several property owners in the watershed utilize the CRP program on or down gradient of highly erodible soils (Figure 15). Finally, all of the actively farmed acreage on the PHJC property uses conservation tillage. Management efforts should focus on the remaining hot spots and sources. 3.4 Identified Problems Summary Tables 7 through 11 summarize the water quality and related problems identified through public meetings; review of existing water quality and related reports from a variety of sources; conversations with representatives from local natural resource agencies; and water quality assessments. The problems are separated into five groups: 1. problems affecting Flat Lake, 2.
JFNew File #99-08-24L/01 Page 35
Flat Lake Watershed Management Plan June 11, 2003 Marshall County, Indiana
problems affecting Gilbert Lake, 3. problems affecting Flat Lake watershed streams, 4. problems affecting the Flat Lake watershed, which includes problems associated with landscape processes that affect water quality, and 5. problems affecting the Kankakee River basin to provide a broader context for the problems faced in the immediate Flat Lake watershed. The tables list the concern on the far left side of the table. The center columns of the tables document the location of the problems and/or specific evidence of the problem. The final column in each table provides information on the implications of the problem on aquatic ecosystems and, where appropriate, lists sources or causes for the problem. Individuals should refer to the appendices for a complete documentation of the evidence for listing that concern (Appendix D: Water Quality Assessment).
JFNew File #99-08-24L/01 Page 36
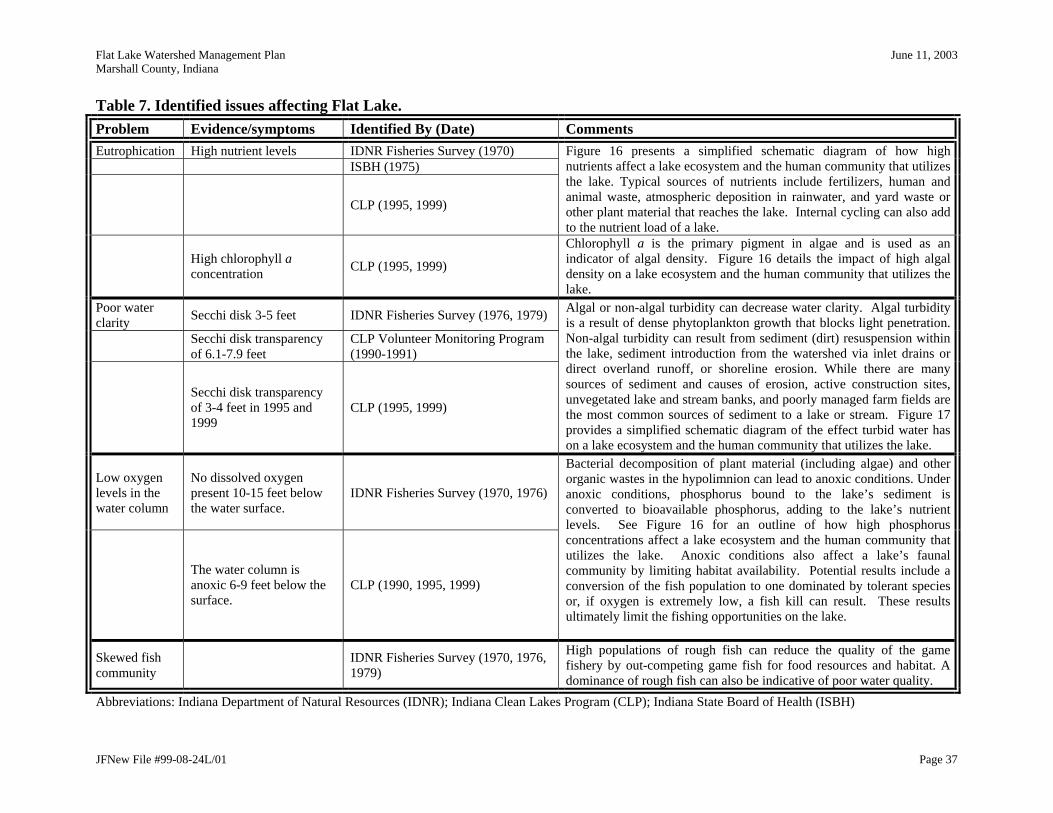
Flat Lake Watershed Management Plan June 11, 2003 Marshall County, Indiana
Table 7. Identified issues affecting Flat Lake. Problem Evidence/symptoms Identified By (Date) Comments Eutrophication High nutrient levels IDNR Fisheries Survey (1970) ISBH (1975)
CLP (1995, 1999)
Figure 16 presents a simplified schematic diagram of how high nutrients affect a lake ecosystem and the human community that utilizes the lake. Typical sources of nutrients include fertilizers, human and animal waste, atmospheric deposition in rainwater, and yard waste or other plant material that reaches the lake. Internal cycling can also add to the nutrient load of a lake.
High chlorophyll a concentration CLP (1995, 1999)
Chlorophyll a is the primary pigment in algae and is used as an indicator of algal density. Figure 16 details the impact of high algal density on a lake ecosystem and the human community that utilizes the lake.
Poor water clarity Secchi disk 3-5 feet IDNR Fisheries Survey (1976, 1979)
Secchi disk transparency of 6.1-7.9 feet
CLP Volunteer Monitoring Program (1990-1991)
Secchi disk transparency of 3-4 feet in 1995 and 1999
CLP (1995, 1999)
Algal or non-algal turbidity can decrease water clarity. Algal turbidity is a result of dense phytoplankton growth that blocks light penetration. Non-algal turbidity can result from sediment (dirt) resuspension within the lake, sediment introduction from the watershed via inlet drains or direct overland runoff, or shoreline erosion. While there are many sources of sediment and causes of erosion, active construction sites, unvegetated lake and stream banks, and poorly managed farm fields are the most common sources of sediment to a lake or stream. Figure 17 provides a simplified schematic diagram of the effect turbid water has on a lake ecosystem and the human community that utilizes the lake.
Low oxygen levels in the water column
No dissolved oxygen present 10-15 feet below the water surface.
IDNR Fisheries Survey (1970, 1976)
The water column is anoxic 6-9 feet below the surface.
CLP (1990, 1995, 1999)
Bacterial decomposition of plant material (including algae) and other organic wastes in the hypolimnion can lead to anoxic conditions. Under anoxic conditions, phosphorus bound to the lake’s sediment is converted to bioavailable phosphorus, adding to the lake’s nutrient levels. See Figure 16 for an outline of how high phosphorus concentrations affect a lake ecosystem and the human community that utilizes the lake. Anoxic conditions also affect a lake’s faunal community by limiting habitat availability. Potential results include a conversion of the fish population to one dominated by tolerant species or, if oxygen is extremely low, a fish kill can result. These results ultimately limit the fishing opportunities on the lake.
Skewed fish community IDNR Fisheries Survey (1970, 1976,
1979)
High populations of rough fish can reduce the quality of the game fishery by out-competing game fish for food resources and habitat. A dominance of rough fish can also be indicative of poor water quality.
Abbreviations: Indiana Department of Natural Resources (IDNR); Indiana Clean Lakes Program (CLP); Indiana State Board of Health (ISBH)
JFNew File #99-08-24L/01 Page 37
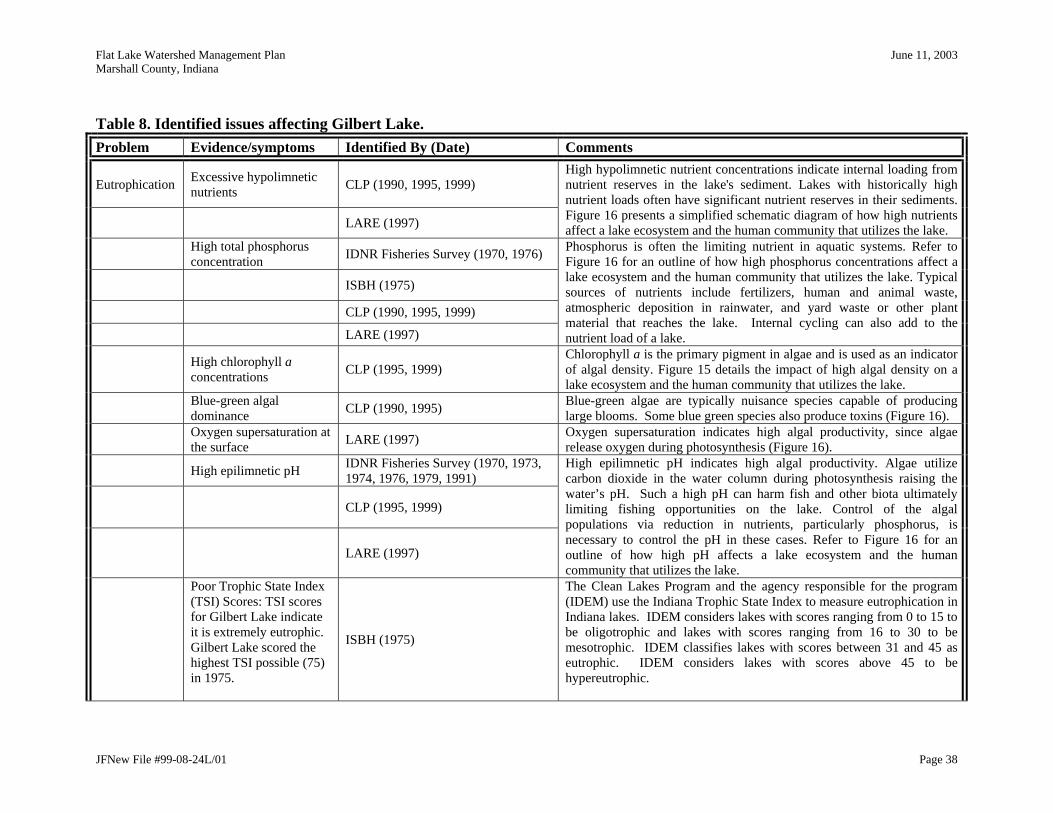
Flat Lake Watershed Management Plan June 11, 2003 Marshall County, Indiana
Table 8. Identified issues affecting Gilbert Lake. Problem Evidence/symptoms Identified By (Date) Comments
Eutrophication Excessive hypolimnetic nutrients CLP (1990, 1995, 1999)
LARE (1997)
High hypolimnetic nutrient concentrations indicate internal loading from nutrient reserves in the lake's sediment. Lakes with historically high nutrient loads often have significant nutrient reserves in their sediments. Figure 16 presents a simplified schematic diagram of how high nutrients affect a lake ecosystem and the human community that utilizes the lake.
High total phosphorus concentration IDNR Fisheries Survey (1970, 1976)
ISBH (1975)
CLP (1990, 1995, 1999)
LARE (1997)
Phosphorus is often the limiting nutrient in aquatic systems. Refer to Figure 16 for an outline of how high phosphorus concentrations affect a lake ecosystem and the human community that utilizes the lake. Typical sources of nutrients include fertilizers, human and animal waste, atmospheric deposition in rainwater, and yard waste or other plant material that reaches the lake. Internal cycling can also add to the nutrient load of a lake.
High chlorophyll a concentrations CLP (1995, 1999)
Chlorophyll a is the primary pigment in algae and is used as an indicator of algal density. Figure 15 details the impact of high algal density on a lake ecosystem and the human community that utilizes the lake.
Blue-green algal dominance CLP (1990, 1995) Blue-green algae are typically nuisance species capable of producing
large blooms. Some blue green species also produce toxins (Figure 16).
Oxygen supersaturation at the surface LARE (1997) Oxygen supersaturation indicates high algal productivity, since algae
release oxygen during photosynthesis (Figure 16).
High epilimnetic pH IDNR Fisheries Survey (1970, 1973, 1974, 1976, 1979, 1991)
CLP (1995, 1999)
LARE (1997)
High epilimnetic pH indicates high algal productivity. Algae utilize carbon dioxide in the water column during photosynthesis raising the water’s pH. Such a high pH can harm fish and other biota ultimately limiting fishing opportunities on the lake. Control of the algal populations via reduction in nutrients, particularly phosphorus, is necessary to control the pH in these cases. Refer to Figure 16 for an outline of how high pH affects a lake ecosystem and the human community that utilizes the lake.
Poor Trophic State Index (TSI) Scores: TSI scores for Gilbert Lake indicate it is extremely eutrophic. Gilbert Lake scored the highest TSI possible (75) in 1975.
ISBH (1975)
The Clean Lakes Program and the agency responsible for the program (IDEM) use the Indiana Trophic State Index to measure eutrophication in Indiana lakes. IDEM considers lakes with scores ranging from 0 to 15 to be oligotrophic and lakes with scores ranging from 16 to 30 to be mesotrophic. IDEM classifies lakes with scores between 31 and 45 as eutrophic. IDEM considers lakes with scores above 45 to be hypereutrophic.
JFNew File #99-08-24L/01 Page 38
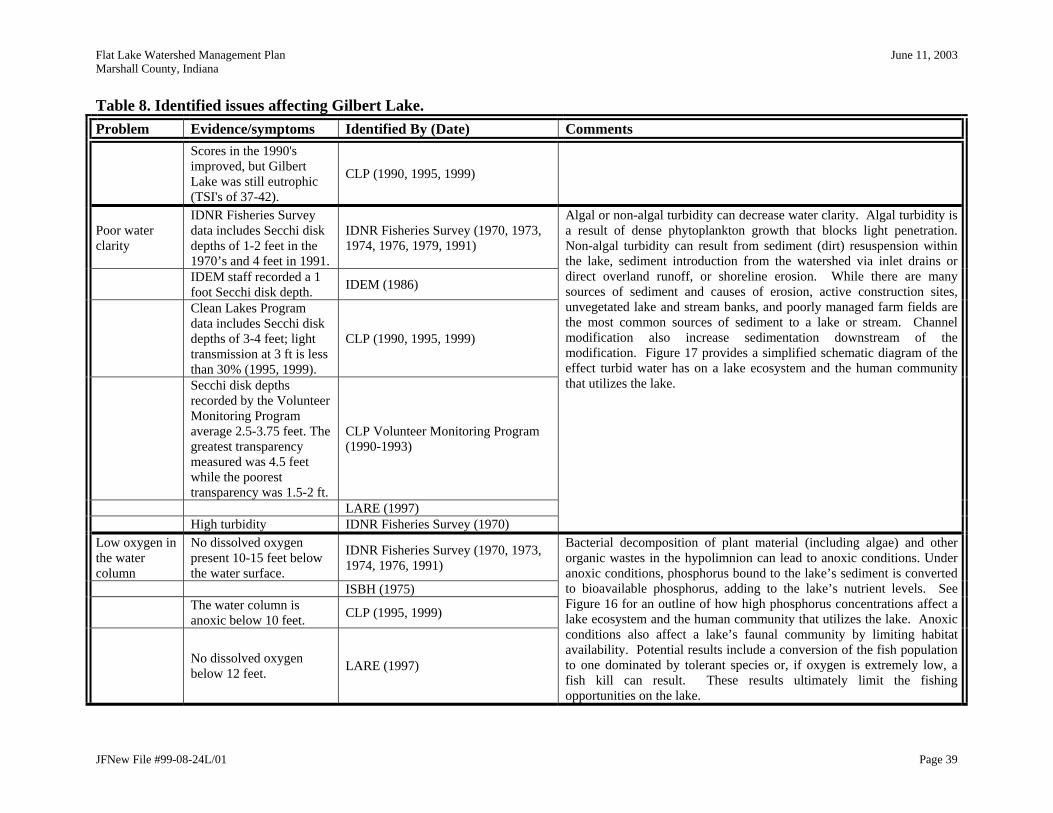
Flat Lake Watershed Management Plan June 11, 2003 Marshall County, Indiana
Table 8. Identified issues affecting Gilbert Lake. Problem Evidence/symptoms Identified By (Date) Comments
Scores in the 1990's improved, but Gilbert Lake was still eutrophic (TSI's of 37-42).
CLP (1990, 1995, 1999)
Poor water clarity
IDNR Fisheries Survey data includes Secchi disk depths of 1-2 feet in the 1970’s and 4 feet in 1991.
IDNR Fisheries Survey (1970, 1973, 1974, 1976, 1979, 1991)
IDEM staff recorded a 1 foot Secchi disk depth. IDEM (1986)
Clean Lakes Program data includes Secchi disk depths of 3-4 feet; light transmission at 3 ft is less than 30% (1995, 1999).
CLP (1990, 1995, 1999)
Secchi disk depths recorded by the Volunteer Monitoring Program average 2.5-3.75 feet. The greatest transparency measured was 4.5 feet while the poorest transparency was 1.5-2 ft.
CLP Volunteer Monitoring Program (1990-1993)
LARE (1997) High turbidity IDNR Fisheries Survey (1970)
Algal or non-algal turbidity can decrease water clarity. Algal turbidity is a result of dense phytoplankton growth that blocks light penetration. Non-algal turbidity can result from sediment (dirt) resuspension within the lake, sediment introduction from the watershed via inlet drains or direct overland runoff, or shoreline erosion. While there are many sources of sediment and causes of erosion, active construction sites, unvegetated lake and stream banks, and poorly managed farm fields are the most common sources of sediment to a lake or stream. Channel modification also increase sedimentation downstream of the modification. Figure 17 provides a simplified schematic diagram of the effect turbid water has on a lake ecosystem and the human community that utilizes the lake.
Low oxygen in the water column
No dissolved oxygen present 10-15 feet below the water surface.
IDNR Fisheries Survey (1970, 1973, 1974, 1976, 1991)
ISBH (1975)
The water column is anoxic below 10 feet. CLP (1995, 1999)
No dissolved oxygen below 12 feet. LARE (1997)
Bacterial decomposition of plant material (including algae) and other organic wastes in the hypolimnion can lead to anoxic conditions. Under anoxic conditions, phosphorus bound to the lake’s sediment is converted to bioavailable phosphorus, adding to the lake’s nutrient levels. See Figure 16 for an outline of how high phosphorus concentrations affect a lake ecosystem and the human community that utilizes the lake. Anoxic conditions also affect a lake’s faunal community by limiting habitat availability. Potential results include a conversion of the fish population to one dominated by tolerant species or, if oxygen is extremely low, a fish kill can result. These results ultimately limit the fishing opportunities on the lake.
JFNew File #99-08-24L/01 Page 39
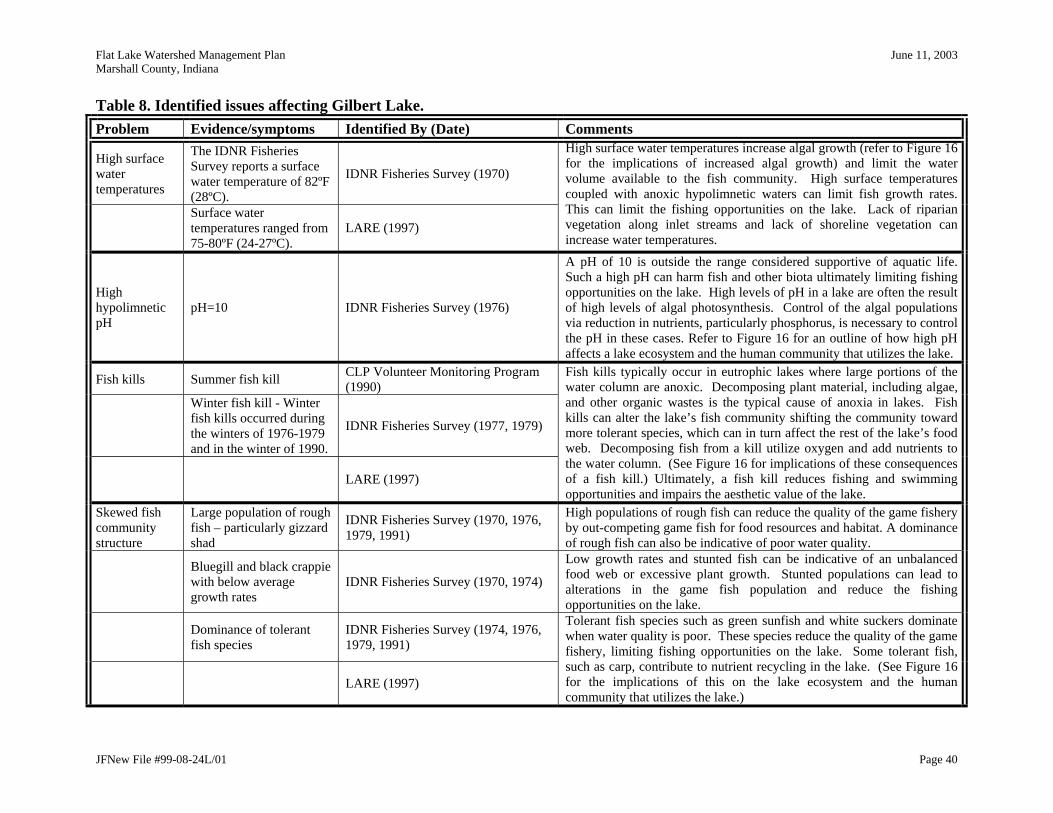
Flat Lake Watershed Management Plan June 11, 2003 Marshall County, Indiana
Table 8. Identified issues affecting Gilbert Lake. Problem Evidence/symptoms Identified By (Date) Comments
High surface water temperatures
The IDNR Fisheries Survey reports a surface water temperature of 82ºF (28ºC).
IDNR Fisheries Survey (1970)
Surface water temperatures ranged from 75-80ºF (24-27ºC).
LARE (1997)
High surface water temperatures increase algal growth (refer to Figure 16 for the implications of increased algal growth) and limit the water volume available to the fish community. High surface temperatures coupled with anoxic hypolimnetic waters can limit fish growth rates. This can limit the fishing opportunities on the lake. Lack of riparian vegetation along inlet streams and lack of shoreline vegetation can increase water temperatures.
High hypolimnetic pH
pH=10 IDNR Fisheries Survey (1976)
A pH of 10 is outside the range considered supportive of aquatic life. Such a high pH can harm fish and other biota ultimately limiting fishing opportunities on the lake. High levels of pH in a lake are often the result of high levels of algal photosynthesis. Control of the algal populations via reduction in nutrients, particularly phosphorus, is necessary to control the pH in these cases. Refer to Figure 16 for an outline of how high pH affects a lake ecosystem and the human community that utilizes the lake.
Fish kills Summer fish kill CLP Volunteer Monitoring Program (1990)
Winter fish kill - Winter fish kills occurred during the winters of 1976-1979 and in the winter of 1990.
IDNR Fisheries Survey (1977, 1979)
LARE (1997)
Fish kills typically occur in eutrophic lakes where large portions of the water column are anoxic. Decomposing plant material, including algae, and other organic wastes is the typical cause of anoxia in lakes. Fish kills can alter the lake’s fish community shifting the community toward more tolerant species, which can in turn affect the rest of the lake’s food web. Decomposing fish from a kill utilize oxygen and add nutrients to the water column. (See Figure 16 for implications of these consequences of a fish kill.) Ultimately, a fish kill reduces fishing and swimming opportunities and impairs the aesthetic value of the lake.
Skewed fish community structure
Large population of rough fish – particularly gizzard shad
IDNR Fisheries Survey (1970, 1976, 1979, 1991)
High populations of rough fish can reduce the quality of the game fishery by out-competing game fish for food resources and habitat. A dominance of rough fish can also be indicative of poor water quality.
Bluegill and black crappie with below average growth rates
IDNR Fisheries Survey (1970, 1974)
Low growth rates and stunted fish can be indicative of an unbalanced food web or excessive plant growth. Stunted populations can lead to alterations in the game fish population and reduce the fishing opportunities on the lake.
Dominance of tolerant fish species
IDNR Fisheries Survey (1974, 1976, 1979, 1991)
LARE (1997)
Tolerant fish species such as green sunfish and white suckers dominate when water quality is poor. These species reduce the quality of the game fishery, limiting fishing opportunities on the lake. Some tolerant fish, such as carp, contribute to nutrient recycling in the lake. (See Figure 16 for the implications of this on the lake ecosystem and the human community that utilizes the lake.)
JFNew File #99-08-24L/01 Page 40
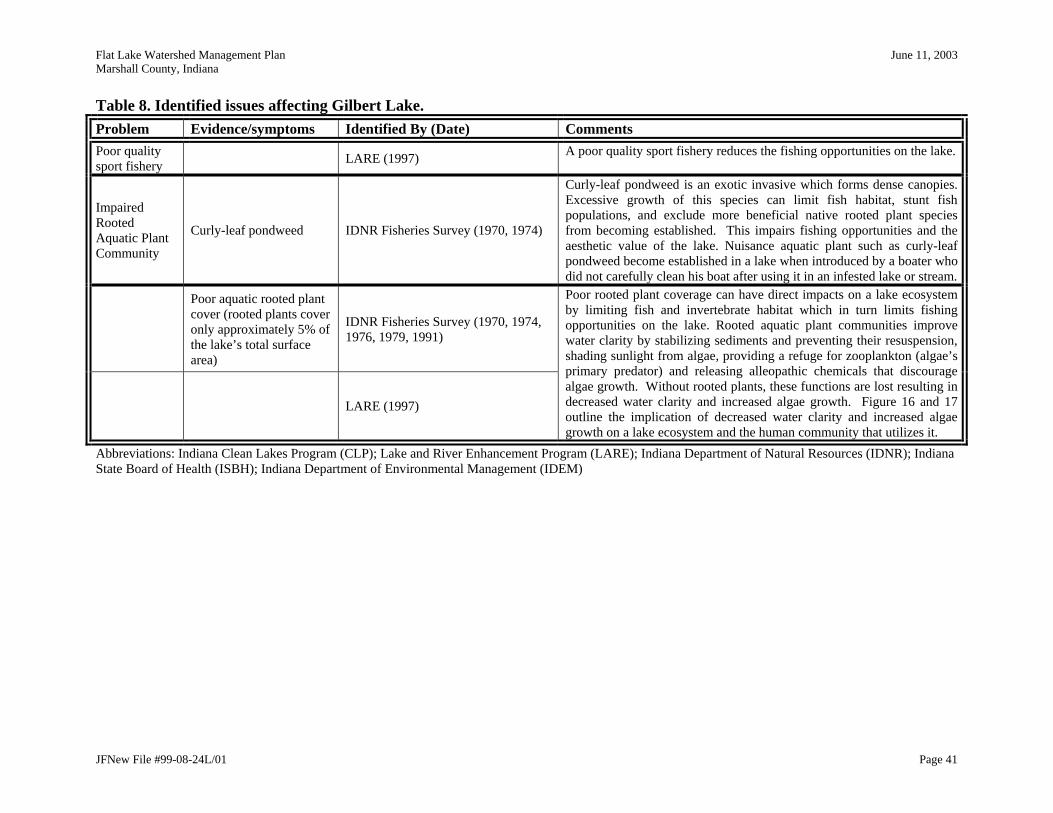
Flat Lake Watershed Management Plan June 11, 2003 Marshall County, Indiana
Table 8. Identified issues affecting Gilbert Lake. Problem Evidence/symptoms Identified By (Date) Comments Poor quality sport fishery LARE (1997) A poor quality sport fishery reduces the fishing opportunities on the lake.
Impaired Rooted Aquatic Plant Community
Curly-leaf pondweed IDNR Fisheries Survey (1970, 1974)
Curly-leaf pondweed is an exotic invasive which forms dense canopies. Excessive growth of this species can limit fish habitat, stunt fish populations, and exclude more beneficial native rooted plant species from becoming established. This impairs fishing opportunities and the aesthetic value of the lake. Nuisance aquatic plant such as curly-leaf pondweed become established in a lake when introduced by a boater who did not carefully clean his boat after using it in an infested lake or stream.
Poor aquatic rooted plant cover (rooted plants cover only approximately 5% of the lake’s total surface area)
IDNR Fisheries Survey (1970, 1974, 1976, 1979, 1991)
LARE (1997)
Poor rooted plant coverage can have direct impacts on a lake ecosystem by limiting fish and invertebrate habitat which in turn limits fishing opportunities on the lake. Rooted aquatic plant communities improve water clarity by stabilizing sediments and preventing their resuspension, shading sunlight from algae, providing a refuge for zooplankton (algae’s primary predator) and releasing alleopathic chemicals that discourage algae growth. Without rooted plants, these functions are lost resulting in decreased water clarity and increased algae growth. Figure 16 and 17 outline the implication of decreased water clarity and increased algae growth on a lake ecosystem and the human community that utilizes it.
Abbreviations: Indiana Clean Lakes Program (CLP); Lake and River Enhancement Program (LARE); Indiana Department of Natural Resources (IDNR); Indiana State Board of Health (ISBH); Indiana Department of Environmental Management (IDEM)
JFNew File #99-08-24L/01 Page 41
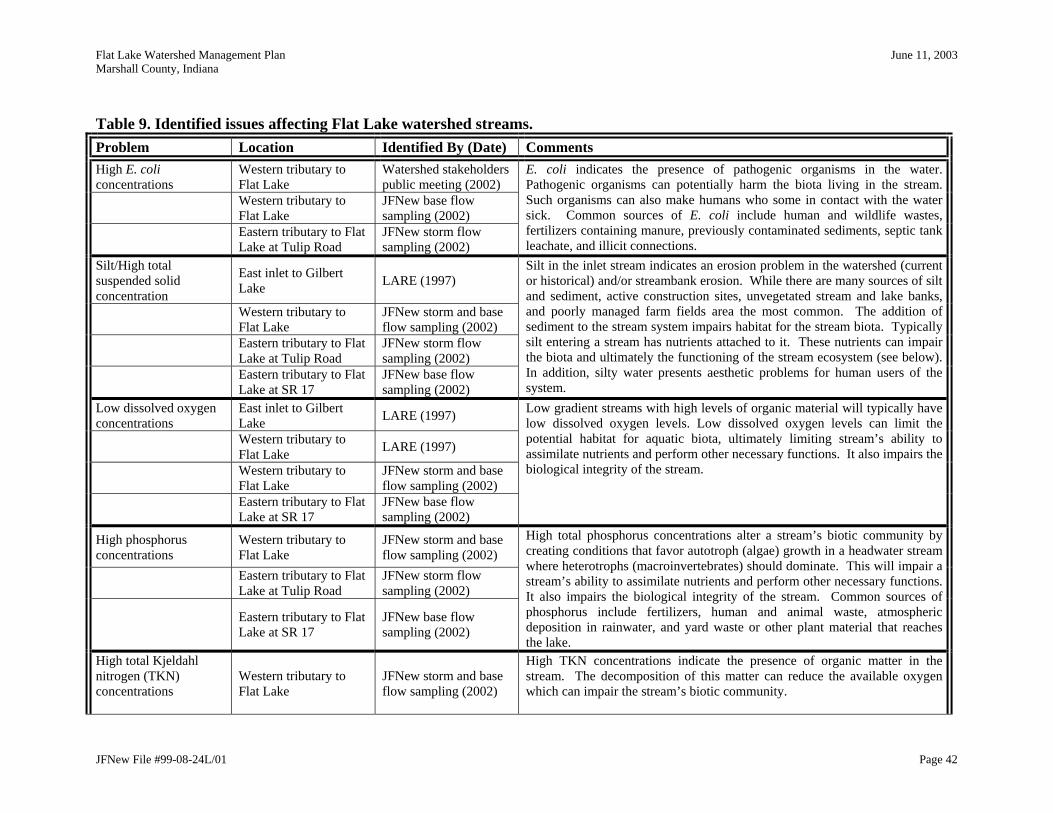
Flat Lake Watershed Management Plan June 11, 2003 Marshall County, Indiana
Table 9. Identified issues affecting Flat Lake watershed streams. Problem Location Identified By (Date) Comments High E. coli concentrations
Western tributary to Flat Lake
Watershed stakeholders public meeting (2002)
Western tributary to Flat Lake
JFNew base flow sampling (2002)
Eastern tributary to Flat Lake at Tulip Road
JFNew storm flow sampling (2002)
E. coli indicates the presence of pathogenic organisms in the water. Pathogenic organisms can potentially harm the biota living in the stream. Such organisms can also make humans who some in contact with the water sick. Common sources of E. coli include human and wildlife wastes, fertilizers containing manure, previously contaminated sediments, septic tank leachate, and illicit connections.
Silt/High total suspended solid concentration
East inlet to Gilbert Lake LARE (1997)
Western tributary to Flat Lake
JFNew storm and base flow sampling (2002)
Eastern tributary to Flat Lake at Tulip Road
JFNew storm flow sampling (2002)
Eastern tributary to Flat Lake at SR 17
JFNew base flow sampling (2002)
Silt in the inlet stream indicates an erosion problem in the watershed (current or historical) and/or streambank erosion. While there are many sources of silt and sediment, active construction sites, unvegetated stream and lake banks, and poorly managed farm fields area the most common. The addition of sediment to the stream system impairs habitat for the stream biota. Typically silt entering a stream has nutrients attached to it. These nutrients can impair the biota and ultimately the functioning of the stream ecosystem (see below). In addition, silty water presents aesthetic problems for human users of the system.
Low dissolved oxygen concentrations
East inlet to Gilbert Lake LARE (1997)
Western tributary to Flat Lake LARE (1997)
Western tributary to Flat Lake
JFNew storm and base flow sampling (2002)
Eastern tributary to Flat Lake at SR 17
JFNew base flow sampling (2002)
Low gradient streams with high levels of organic material will typically have low dissolved oxygen levels. Low dissolved oxygen levels can limit the potential habitat for aquatic biota, ultimately limiting stream’s ability to assimilate nutrients and perform other necessary functions. It also impairs the biological integrity of the stream.
High phosphorus concentrations
Western tributary to Flat Lake
JFNew storm and base flow sampling (2002)
Eastern tributary to Flat Lake at Tulip Road
JFNew storm flow sampling (2002)
Eastern tributary to Flat Lake at SR 17
JFNew base flow sampling (2002)
High total phosphorus concentrations alter a stream’s biotic community by creating conditions that favor autotroph (algae) growth in a headwater stream where heterotrophs (macroinvertebrates) should dominate. This will impair a stream’s ability to assimilate nutrients and perform other necessary functions. It also impairs the biological integrity of the stream. Common sources of phosphorus include fertilizers, human and animal waste, atmospheric deposition in rainwater, and yard waste or other plant material that reaches the lake.
High total Kjeldahl nitrogen (TKN) concentrations
Western tributary to Flat Lake
JFNew storm and base flow sampling (2002)
High TKN concentrations indicate the presence of organic matter in the stream. The decomposition of this matter can reduce the available oxygen which can impair the stream’s biotic community.
JFNew File #99-08-24L/01 Page 42

Flat Lake Watershed Management Plan June 11, 2003 Marshall County, Indiana
Table 9. Identified issues affecting Flat Lake watershed streams. Problem Location Identified By (Date) Comments
Eastern tributary to Flat Lake at Tulip Road
JFNew storm flow sampling (2002)
Eastern tributary to Flat Lake at SR 17
JFNew base flow sampling (2002)
High ammonia concentration
Western tributary to Flat Lake
JFNew storm and base flow sampling (2002)
High ammonia concentrations indicate decomposition is occurring in the stream which can lower the oxygen available to the biotic community. Additionally because ammonia is the bioavailable form of nitrogen, high ammonia concentrations can promote the algae growth shifting the biotic community from one dominated by heterotrophs to one dominated by autotrophs. This will impair a stream’s ability to assimilate nutrients and perform other necessary functions. It also impairs the biological integrity of the stream. At extreme concentrations ammonia can be toxic to aquatic fauna.
High pollutant loads Eastern tributary to Flat Lake at Tulip Road
JFNew storm flow sampling (2002)
Eastern tributary to Flat Lake at SR 17 (total suspended solids and total phosphorus)
JFNew base flow sampling (2002)
Loads are an indicative of the relative amount of each pollutant that each stream contributes to Flat Lake. During storm events, Flat Lake’s eastern inlet delivered more pollutant mass to Flat Lake than the western inlet did. This is largely due to the greater flow (amount of water moving in the stream per unit of time) in the eastern inlet. Streams with greater flow are expected to carry more pollutants to a lake. Surprisingly, the total phosphorus and total suspended solid loads at base flow were lower in the eastern inlet at Tulip Road compared to the loads in the eastern inlet at SR 17. This suggests there is a sink somewhere between Tulip Road and SR 17 that is withdrawing pollutants from the system.
Abbreviations: Lake and River Enhancement Program (LARE)
JFNew File #99-08-24L/01 Page 43
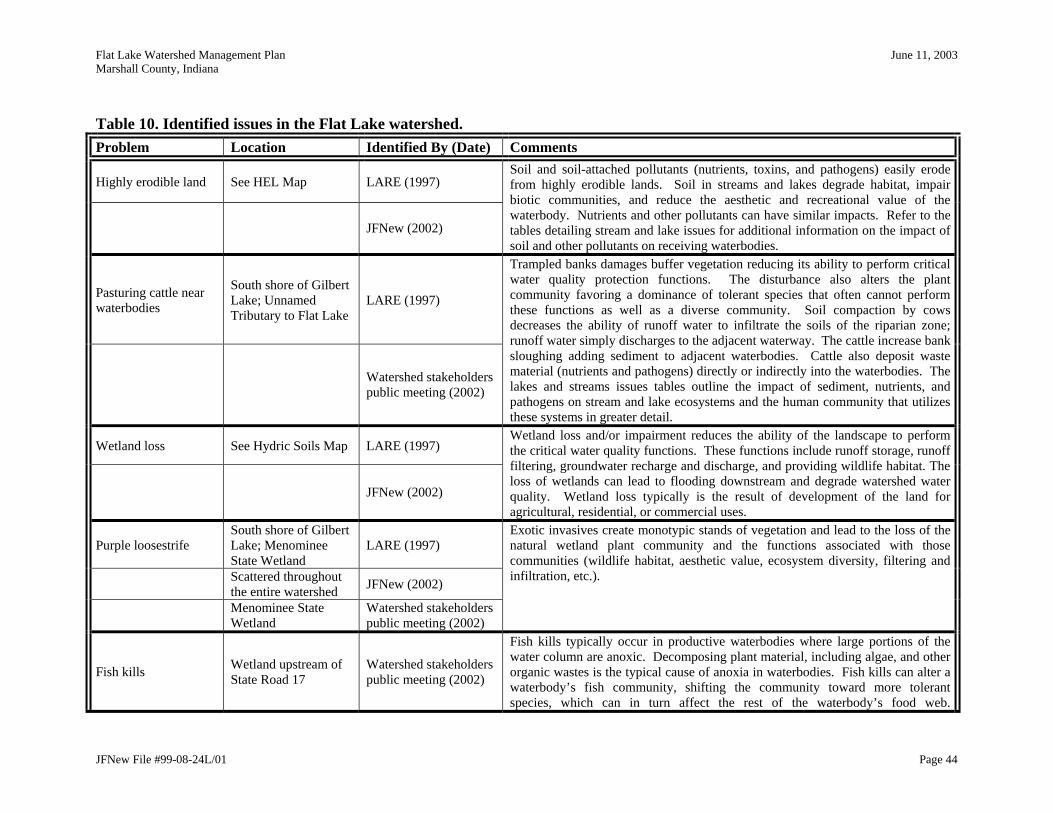
Flat Lake Watershed Management Plan June 11, 2003 Marshall County, Indiana
Table 10. Identified issues in the Flat Lake watershed. Problem Location Identified By (Date) Comments
Highly erodible land See HEL Map LARE (1997)
JFNew (2002)
Soil and soil-attached pollutants (nutrients, toxins, and pathogens) easily erode from highly erodible lands. Soil in streams and lakes degrade habitat, impair biotic communities, and reduce the aesthetic and recreational value of the waterbody. Nutrients and other pollutants can have similar impacts. Refer to the tables detailing stream and lake issues for additional information on the impact of soil and other pollutants on receiving waterbodies.
Pasturing cattle near waterbodies
South shore of Gilbert Lake; Unnamed Tributary to Flat Lake
LARE (1997)
Watershed stakeholders public meeting (2002)
Trampled banks damages buffer vegetation reducing its ability to perform critical water quality protection functions. The disturbance also alters the plant community favoring a dominance of tolerant species that often cannot perform these functions as well as a diverse community. Soil compaction by cows decreases the ability of runoff water to infiltrate the soils of the riparian zone; runoff water simply discharges to the adjacent waterway. The cattle increase bank sloughing adding sediment to adjacent waterbodies. Cattle also deposit waste material (nutrients and pathogens) directly or indirectly into the waterbodies. The lakes and streams issues tables outline the impact of sediment, nutrients, and pathogens on stream and lake ecosystems and the human community that utilizes these systems in greater detail.
Wetland loss See Hydric Soils Map LARE (1997)
JFNew (2002)
Wetland loss and/or impairment reduces the ability of the landscape to perform the critical water quality functions. These functions include runoff storage, runoff filtering, groundwater recharge and discharge, and providing wildlife habitat. The loss of wetlands can lead to flooding downstream and degrade watershed water quality. Wetland loss typically is the result of development of the land for agricultural, residential, or commercial uses.
Purple loosestrife South shore of Gilbert Lake; Menominee State Wetland
LARE (1997)
Scattered throughout the entire watershed JFNew (2002)
Menominee State Wetland
Watershed stakeholders public meeting (2002)
Exotic invasives create monotypic stands of vegetation and lead to the loss of the natural wetland plant community and the functions associated with those communities (wildlife habitat, aesthetic value, ecosystem diversity, filtering and infiltration, etc.).
Fish kills Wetland upstream of State Road 17
Watershed stakeholders public meeting (2002)
Fish kills typically occur in productive waterbodies where large portions of the water column are anoxic. Decomposing plant material, including algae, and other organic wastes is the typical cause of anoxia in waterbodies. Fish kills can alter a waterbody’s fish community, shifting the community toward more tolerant species, which can in turn affect the rest of the waterbody’s food web.
JFNew File #99-08-24L/01 Page 44
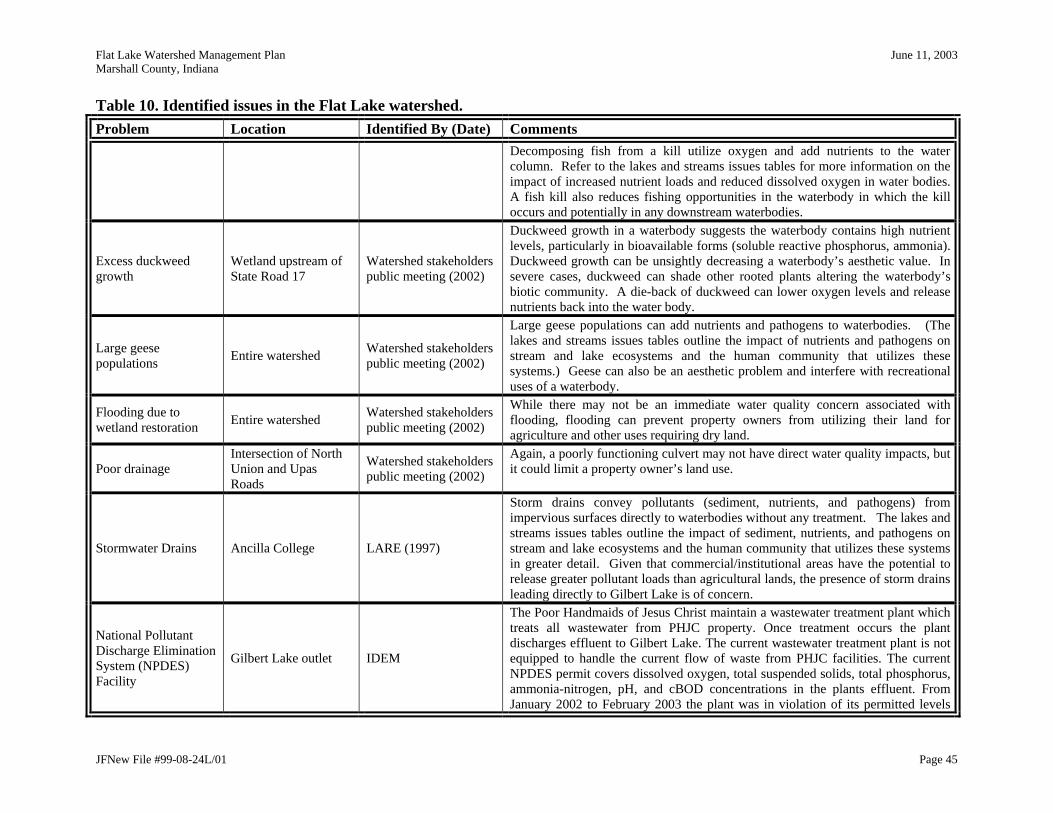
Flat Lake Watershed Management Plan June 11, 2003 Marshall County, Indiana
Table 10. Identified issues in the Flat Lake watershed. Problem Location Identified By (Date) Comments
Decomposing fish from a kill utilize oxygen and add nutrients to the water column. Refer to the lakes and streams issues tables for more information on the impact of increased nutrient loads and reduced dissolved oxygen in water bodies. A fish kill also reduces fishing opportunities in the waterbody in which the kill occurs and potentially in any downstream waterbodies.
Excess duckweed growth
Wetland upstream of State Road 17
Watershed stakeholders public meeting (2002)
Duckweed growth in a waterbody suggests the waterbody contains high nutrient levels, particularly in bioavailable forms (soluble reactive phosphorus, ammonia). Duckweed growth can be unsightly decreasing a waterbody’s aesthetic value. In severe cases, duckweed can shade other rooted plants altering the waterbody’s biotic community. A die-back of duckweed can lower oxygen levels and release nutrients back into the water body.
Large geese populations Entire watershed Watershed stakeholders
public meeting (2002)
Large geese populations can add nutrients and pathogens to waterbodies. (The lakes and streams issues tables outline the impact of nutrients and pathogens on stream and lake ecosystems and the human community that utilizes these systems.) Geese can also be an aesthetic problem and interfere with recreational uses of a waterbody.
Flooding due to wetland restoration Entire watershed Watershed stakeholders
public meeting (2002)
While there may not be an immediate water quality concern associated with flooding, flooding can prevent property owners from utilizing their land for agriculture and other uses requiring dry land.
Poor drainage Intersection of North Union and Upas Roads
Watershed stakeholders public meeting (2002)
Again, a poorly functioning culvert may not have direct water quality impacts, but it could limit a property owner’s land use.
Stormwater Drains Ancilla College LARE (1997)
Storm drains convey pollutants (sediment, nutrients, and pathogens) from impervious surfaces directly to waterbodies without any treatment. The lakes and streams issues tables outline the impact of sediment, nutrients, and pathogens on stream and lake ecosystems and the human community that utilizes these systems in greater detail. Given that commercial/institutional areas have the potential to release greater pollutant loads than agricultural lands, the presence of storm drains leading directly to Gilbert Lake is of concern.
National Pollutant Discharge Elimination System (NPDES) Facility
Gilbert Lake outlet IDEM
The Poor Handmaids of Jesus Christ maintain a wastewater treatment plant which treats all wastewater from PHJC property. Once treatment occurs the plant discharges effluent to Gilbert Lake. The current wastewater treatment plant is not equipped to handle the current flow of waste from PHJC facilities. The current NPDES permit covers dissolved oxygen, total suspended solids, total phosphorus, ammonia-nitrogen, pH, and cBOD concentrations in the plants effluent. From January 2002 to February 2003 the plant was in violation of its permitted levels
JFNew File #99-08-24L/01 Page 45
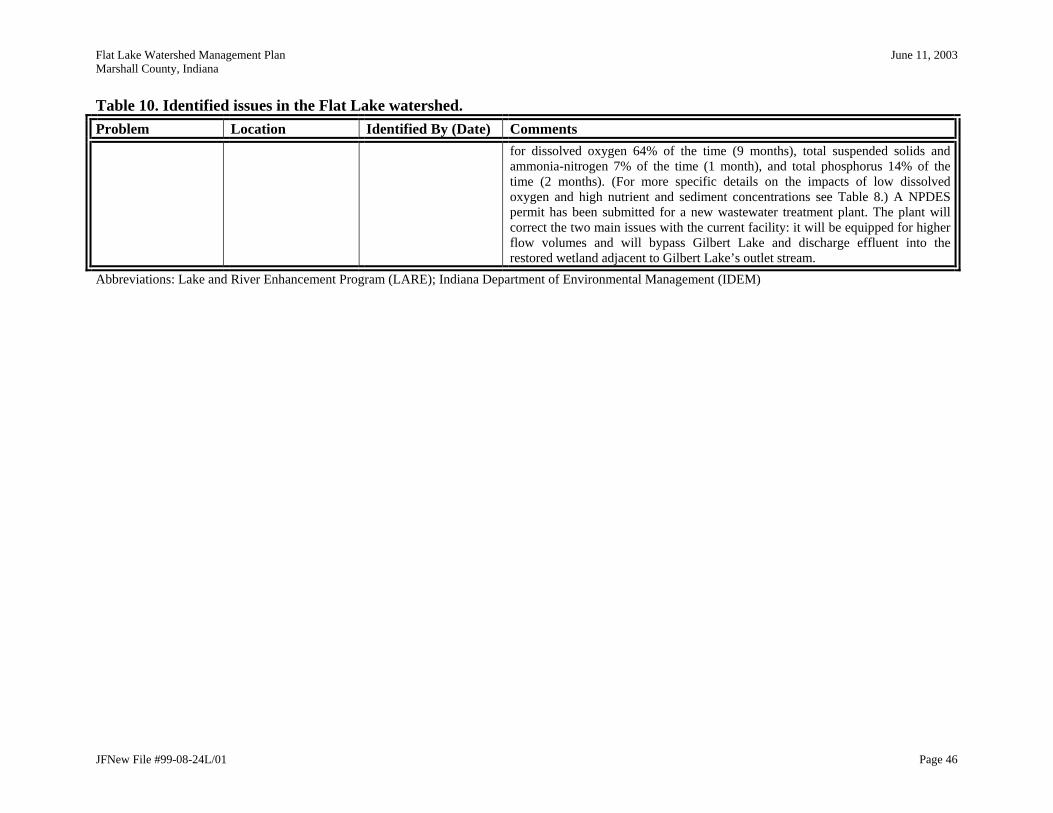
Flat Lake Watershed Management Plan June 11, 2003 Marshall County, Indiana
Table 10. Identified issues in the Flat Lake watershed. Problem Location Identified By (Date) Comments
for dissolved oxygen 64% of the time (9 months), total suspended solids and ammonia-nitrogen 7% of the time (1 month), and total phosphorus 14% of the time (2 months). (For more specific details on the impacts of low dissolved oxygen and high nutrient and sediment concentrations see Table 8.) A NPDES permit has been submitted for a new wastewater treatment plant. The plant will correct the two main issues with the current facility: it will be equipped for higher flow volumes and will bypass Gilbert Lake and discharge effluent into the restored wetland adjacent to Gilbert Lake’s outlet stream.
Abbreviations: Lake and River Enhancement Program (LARE); Indiana Department of Environmental Management (IDEM)
JFNew File #99-08-24L/01 Page 46

Flat Lake Watershed Management Plan June 11, 2003 Marshall County, Indiana
Table 11. Identified issues in the Kankakee River basin. Problem Location Identified By (Date) Comments
Eurasian water milfoil infestation in area lakes
Lakes in the 11 digit watershed UWA (1999)
Eurasian water milfoil (EWM) is an nuisance exotic species that can out-compete native plants forming a monoculture. EWM serves as poor habitat for the lakes’ biota (fish and invertebrates) and can therefore impact the lakes’ trophic structure, food web, and overall biological integrity. This in turn can affect fishing opportunities on the lakes. Dense EWM mats also impair the recreational and aesthetic value of the lakes. The spread of EWM from lake to lake is often the result of careless boaters who fail to clean their boats when going from infested to non-infested waters. Waterfowl can also spread the plant.
Relatively high density of septic systems
11 digit watershed UWA (1999)
Failing, old, or poorly-sited/designed septic systems can leach nutrients and pathogens to nearby waterways and groundwater. The addition of these pollutants to water impair the water quality, alter the trophic structure of the water’s biotic communities, and decrease the recreational and aesthetic value of waterways. Leaking septic systems also contaminate groundwater used for drinking water.
Relatively high Trophic State Index (TSI) scores
Lakes in the 11 digit watershed UWA (1999)
High TSI scores are indicative of lake eutrophication. Eutrophic lakes support skewed biotic communities and may offer limited recreational and aesthetic opportunities. See the discussion points under the Gilbert Lake issues table for a more complete discussion on eutrophication.
Relatively high number of endangered species or critical habitat
11 digit watershed UWA (1999)
This concern highlights the need to protect any listed species or special habitats in this 11 digit watershed.
Relatively high number of people using surface waters
11 digit watershed UWA (1999)
This concern highlights the need in this 11 digit watershed to protect surface water from degradation since a relatively high number of people utilize surface water.
Relatively high density of livestock
11 digit watershed UWA (1999)
Livestock can impact water quality, aquatic habitat, and biotic communities in a variety of ways. Livestock manure that reaches streams and lakes adds nutrients and pathogens to the waterbodies. Livestock accessing waterbodies for water can trample banks, adding sediment and any sediment-attached pollutants to the waterbodies. In riparian zones, overgrazing by livestock reduces the functionality of these zones in protecting water quality. On upland areas, overgrazing facilitates erosion adding sediment and sediment-attached pollutants to waterbodies. These various impacts can result in impaired biotic communities, recreational opportunities, and aesthetic value of the waterbodies.
JFNew File #99-08-24L/01 Page 47

Flat Lake Watershed Management Plan June 11, 2003 Marshall County, Indiana
Table 11. Identified issues in the Kankakee River basin. Problem Location Identified By (Date) Comments
Relatively high percentage of cropland
11 digit watershed UWA (1999)
Agricultural practices can impact water quality, aquatic habitat, and biotic communities via the erosion and runoff of sediment and sediment-attached pollutants to nearby waterbodies. (It is important to note that urban land often exports more pollutants in runoff than well managed agricultural land.)
Non-support of recreational use (high E. coli measurements)
Gunnard Anderson Ditch
305 (b) Report (1994-1995)
Yellow River at Knox
305 (b) Report (1994-1995)
Yellow River at Knox
305 (b) Report (unpublished data from 2001 monitoring)
Yellow River at Knox 303 (d) list (2002)
Kankakee River (Lake and Laporte Counties)
303 (d) list (2002)
High E. coli readings suggest pathogen contamination of the waterbody, making it unsafe for full-body contact (i.e. swimming). Common sources of E. coli include human and wildlife wastes, fertilizers containing manure, previously contaminated sediments, septic tank leachate, and illicit connections to stormwater drains or field tiles.
Impaired biotic communities Gunnard Anderson Ditch
IDEM macroinvertebrate sampling (1990)
Kankakee River (Lake and Laporte Counties)
303 (d) list (2002)
Degradation of the biotic communities can impact a creek/river’s ability to function—particularly its ability to absorb and sequester pollutants. Impaired macroinvertebrate communities can negatively impact fish community structure. Degraded biotic communities can also reduce recreational opportunities on the waterbody.
Fish consumption advisory for polychlorinated biphenyls (PCBs) and mercury (Hg)
Kankakee River (Lake and Laporte Counties)
303 (d) list (2002)
8 digit Kankakee River watershed
IDEM Kankakee River WRAS (2001)
Fish contamination can limit recreational opportunities on a waterbody. It can also impact the larger food web if fish are consumed by piscivorous birds.
Release of pollutants from Flat Lake
Downstream of Flat Lake
Watershed stakeholders public meeting (2002)
Pollutants released from the Flat Lake watershed can have many of the same impacts on downstream waterbodies as the impact these pollutants have on waterbodies in the Flat Lake watershed. Refer to the tables detailing stream and lake issues for additional information on the impact of pollutants on receiving waterbodies.
Obtaining data and targeting problems
8 digit Kankakee River watershed
IDEM Kankakee River WRAS (2001)
This concern highlights the need for gathering data on a more local level. This watershed management plan will help achieve this.
JFNew File #99-08-24L/01 Page 48
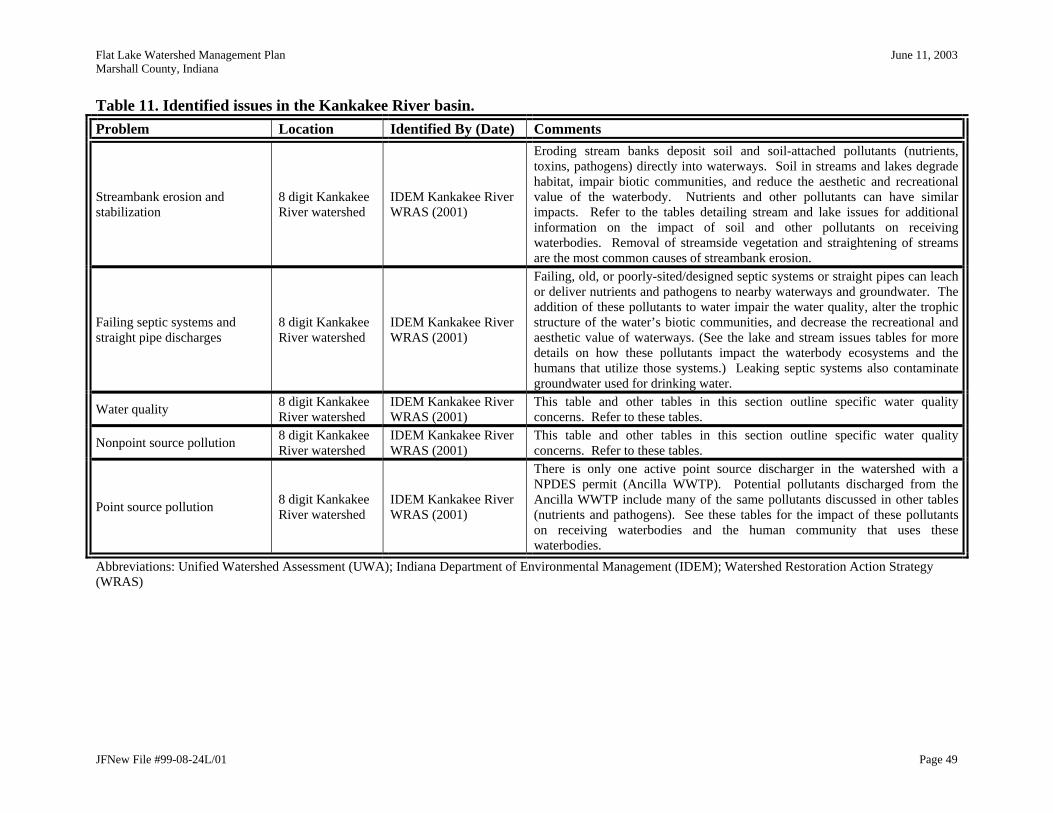
Flat Lake Watershed Management Plan June 11, 2003 Marshall County, Indiana
Table 11. Identified issues in the Kankakee River basin. Problem Location Identified By (Date) Comments
Streambank erosion and stabilization
8 digit Kankakee River watershed
IDEM Kankakee River WRAS (2001)
Eroding stream banks deposit soil and soil-attached pollutants (nutrients, toxins, pathogens) directly into waterways. Soil in streams and lakes degrade habitat, impair biotic communities, and reduce the aesthetic and recreational value of the waterbody. Nutrients and other pollutants can have similar impacts. Refer to the tables detailing stream and lake issues for additional information on the impact of soil and other pollutants on receiving waterbodies. Removal of streamside vegetation and straightening of streams are the most common causes of streambank erosion.
Failing septic systems and straight pipe discharges
8 digit Kankakee River watershed
IDEM Kankakee River WRAS (2001)
Failing, old, or poorly-sited/designed septic systems or straight pipes can leach or deliver nutrients and pathogens to nearby waterways and groundwater. The addition of these pollutants to water impair the water quality, alter the trophic structure of the water’s biotic communities, and decrease the recreational and aesthetic value of waterways. (See the lake and stream issues tables for more details on how these pollutants impact the waterbody ecosystems and the humans that utilize those systems.) Leaking septic systems also contaminate groundwater used for drinking water.
Water quality 8 digit Kankakee River watershed
IDEM Kankakee River WRAS (2001)
This table and other tables in this section outline specific water quality concerns. Refer to these tables.
Nonpoint source pollution 8 digit Kankakee River watershed
IDEM Kankakee River WRAS (2001)
This table and other tables in this section outline specific water quality concerns. Refer to these tables.
Point source pollution 8 digit Kankakee River watershed
IDEM Kankakee River WRAS (2001)
There is only one active point source discharger in the watershed with a NPDES permit (Ancilla WWTP). Potential pollutants discharged from the Ancilla WWTP include many of the same pollutants discussed in other tables (nutrients and pathogens). See these tables for the impact of these pollutants on receiving waterbodies and the human community that uses these waterbodies.
Abbreviations: Unified Watershed Assessment (UWA); Indiana Department of Environmental Management (IDEM); Watershed Restoration Action Strategy (WRAS)
JFNew File #99-08-24L/01 Page 49
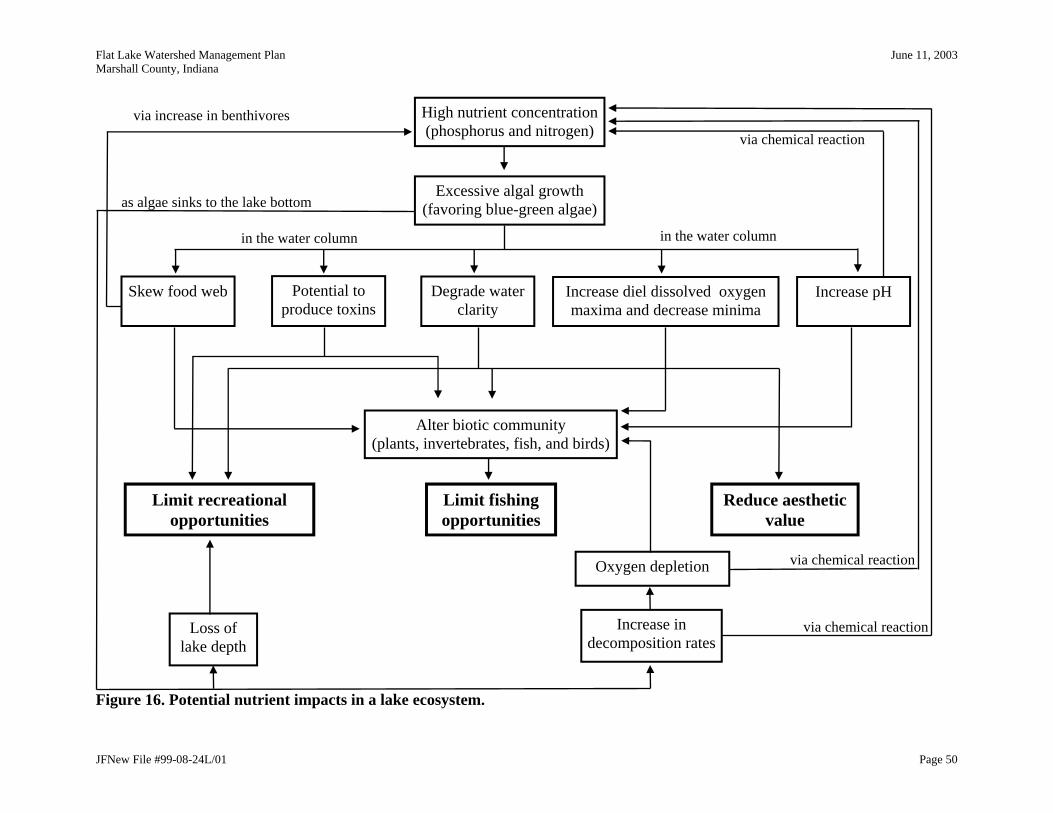
Flat Lake Watershed Management Plan June 11, 2003 Marshall County, Indiana
JFNew File #99-08-24L/01 Page 50
Figure 16. Potential nutrient impacts in a lake ecosystem.
via chemical reaction
Degrade water clarity
Potential to produce toxins
Skew food web Increase diel dissolved oxygen maxima and decrease minima
Increase pH
High nutrient concentration (phosphorus and nitrogen)
Excessive algal growth (favoring blue-green algae)
via chemical reaction
Limit fishing opportunities
Limit recreational opportunities
Reduce aesthetic value
Alter biotic community (plants, invertebrates, fish, and birds)
Oxygen depletion
Loss of lake depth
Increase in decomposition rates
via chemical reaction
as algae sinks to the lake bottom
via increase in benthivores
in the water column in the water column
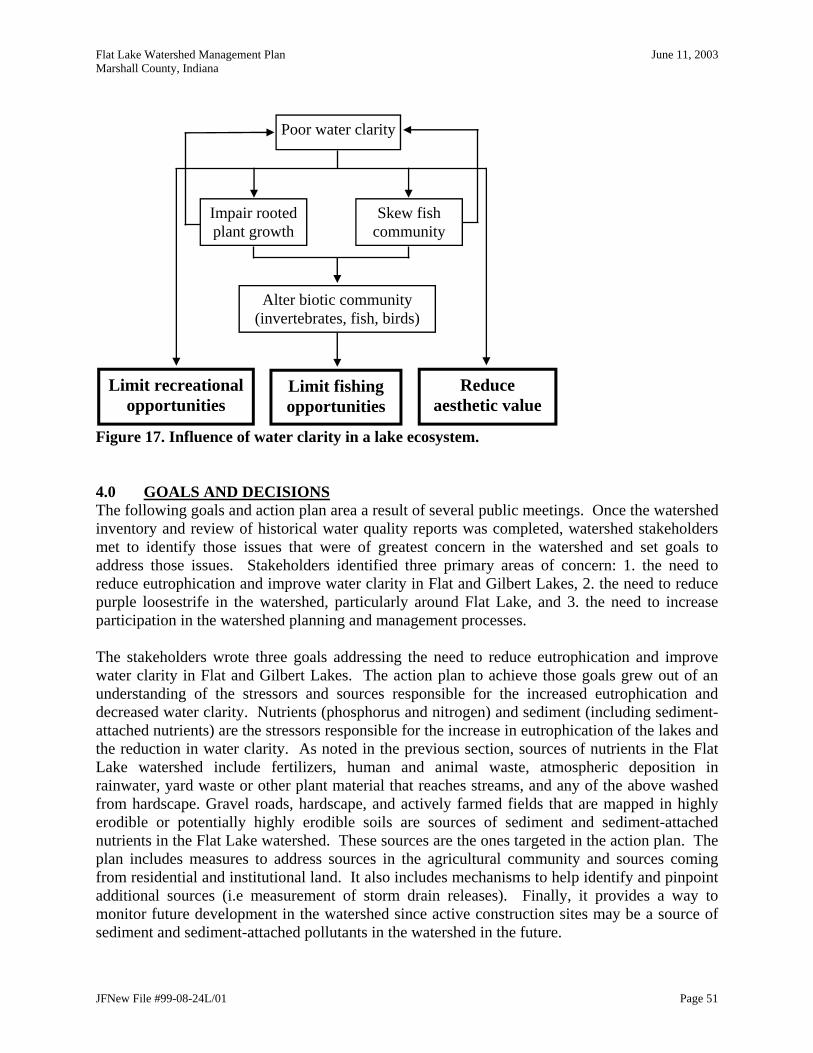
Flat Lake Watershed Management Plan June 11, 2003 Marshall County, Indiana
Poor water clarity
Impair rooted plant growth
Skew fish community
Alter biotic community (invertebrates, fish, birds)
Figure 17. Influence of water clarity in a lake ecosystem.
Limit recreational opportunities
Reduce aesthetic value
Limit fishing opportunities
4.0 GOALS AND DECISIONS The following goals and action plan area a result of several public meetings. Once the watershed inventory and review of historical water quality reports was completed, watershed stakeholders met to identify those issues that were of greatest concern in the watershed and set goals to address those issues. Stakeholders identified three primary areas of concern: 1. the need to reduce eutrophication and improve water clarity in Flat and Gilbert Lakes, 2. the need to reduce purple loosestrife in the watershed, particularly around Flat Lake, and 3. the need to increase participation in the watershed planning and management processes. The stakeholders wrote three goals addressing the need to reduce eutrophication and improve water clarity in Flat and Gilbert Lakes. The action plan to achieve those goals grew out of an understanding of the stressors and sources responsible for the increased eutrophication and decreased water clarity. Nutrients (phosphorus and nitrogen) and sediment (including sediment-attached nutrients) are the stressors responsible for the increase in eutrophication of the lakes and the reduction in water clarity. As noted in the previous section, sources of nutrients in the Flat Lake watershed include fertilizers, human and animal waste, atmospheric deposition in rainwater, yard waste or other plant material that reaches streams, and any of the above washed from hardscape. Gravel roads, hardscape, and actively farmed fields that are mapped in highly erodible or potentially highly erodible soils are sources of sediment and sediment-attached nutrients in the Flat Lake watershed. These sources are the ones targeted in the action plan. The plan includes measures to address sources in the agricultural community and sources coming from residential and institutional land. It also includes mechanisms to help identify and pinpoint additional sources (i.e measurement of storm drain releases). Finally, it provides a way to monitor future development in the watershed since active construction sites may be a source of sediment and sediment-attached pollutants in the watershed in the future.
JFNew File #99-08-24L/01 Page 51

Flat Lake Watershed Management Plan June 11, 2003 Marshall County, Indiana
The watershed stakeholders wrote one goal to address the need to reduce purple loosestrife and one goal to address the need for increased participation in watershed management. Neither of these problems has clearly defined stressors and sources. In the case of purple loosestrife, one “cause” of its spread is human beings. Because the species sports a pretty flower, some individuals may inadvertently spread the plant by transplanting it from the wild to their property. The following action plan includes an educational component to help increase awareness about the harm this species can cause in wetlands and prevent such spread of the species. Similarly, lack of awareness about the watershed is one of the “causes” of the lack of participation in watershed management. The action plan that will be undertaken to increase participation in watershed management includes actions that will raise awareness to the value of the natural
sources in the Flat Lake Watershed.
s will focus on achieving this goal before focusing on efforts to achieve the ther plan goals.
increase e public’s awareness of the value of the natural resources in the Flat Lake watershed.
he following are the prioritized goals and agreed upon action plan for the Flat Lake watershed:
es agencies/representatives, possibly resulting in the formation of a watershed roup.
oal time frame: Except for annual/continuous tasks, the goal should be reached by 2005.
re The stakeholders prioritized the goals over the course of two public meetings. Each stakeholder prioritized the five goals individually. The results of the individual prioritizations were combined to achieve a final prioritization order. Stakeholders almost unanimously saw the need for increased participation in watershed management as critical to implementing the plan. The relatively small number of stakeholders who participated in the watershed plan’s development was not enough to implement the plan. Thus, stakeholders elected to give the goal aimed at increasing participation in watershed management as the number one priority. All watershed management efforto Stakeholders considered the environmental, economic, and social impacts of their actions. As noted above the action plan was designed to target the specific stressors of concern (nutrients and sediment) to improve the environmental quality of the two major lakes in the watershed. The purple loosestrife goal recognizes that the invasion of this exotic nuisance species is a basin wide problem; stakeholders are attempting to do their part in managing this problem. Stakeholders took economic concerns into consideration by designing a management plan that for the most part could be implemented by active volunteers. Additionally, the monitoring of the success of the plan could also be completed by volunteers (see MEASURING SUCCESS section). Most of the actions items that cannot be completed by a volunteer work force can potentially qualify for funding from a known source. This funding might be used to hire a consultant to complete the work that volunteers cannot undertake. The social impact of the plan was considered in the first goal. Stakeholders agreed increased stakeholder involvement in watershed management was of primary importance. The action plan also includes a number of action items designed to th T Goal 1: We want to increase participation by all stakeholders including local natural resourcg G
JFNew File #99-08-24L/01 Page 52
Flat Lake Watershed Management Plan June 11, 2003 Marshall County, Indiana
Objective 1: Establish a core group of individuals willing to generate interest in the watershed management plan and coordinate and oversee the implementation of the plan. Objective notes: This core group, or a single contact from the core group, will provide progress reports on the plan’s implementation to Sr. Margaret Anne Henns on a regular basis, possibly quarterly. Actions:
Contact possible core group members including the local IDNR conservation officer, local high school biology teacher, Ancilla College biology professors, Menominee WCA property manager, Waterfowl USA representative, local IDNR resource specialist, regional IDNR fisheries biologist, and Ducks Unlimited.
Objective 2: Organize a watershed group to discuss the watershed management issues and water quality concerns in the watershed. Actions:
Advertise the formation of the group via the local newspapers and mailings to stakeholders using the existing stakeholder database. Efforts to enlist participants for the group should include outreach to Ancilla College students and faculty.
Hold regular meetings to discuss and address water quality issues in and around the Flat Lake watershed.
Biannually, invite local, regional, and state natural resource professionals to attend watershed group meetings. Have the invited speakers speak on local and state efforts/events to improve water quality (including regulatory efforts) and resources available to help watershed groups.
Publish meeting minutes via an email list, newsletter, and/or web site posting. These publications should include information detailing current and future efforts for improving water quality and the aesthetic value of Flat Lake and its watershed and information on how stakeholders can participate in these efforts.
Objective 3: Organize and hold one annual field day highlighting the value of the streams and lakes in the Flat Lake watershed and how to protect the water quality and aquatic life in the watershed. Actions:
Work with NRCS and Soil and Water Conservation District (SWCD) representatives to identify members of the agricultural community in the watershed who are participating in a conservation program or utilizing conservation tillage. Work with those individuals to hold demonstrations on their properties. The local IDNR Resource Specialist, Beth Forsness, has already expressed an interest in assisting with this.
Invite IDNR biologists or other experts to speak at field days, particularly concerning the value of Flat Lake and its watershed. Possible topics could include goose control, erosion control, exotic species control, volunteer water quality monitoring, water quality, conservation programs for local landowners, etc.
JFNew File #99-08-24L/01 Page 53
Flat Lake Watershed Management Plan June 11, 2003 Marshall County, Indiana
Advertise the field days via press releases to the local media, an annual newsletter, and/or mailings to stakeholders using the existing stakeholder database.
Objective 4: Publicize the value of Flat Lake, its watershed, and of ways to protect its water quality and aquatic life through various forms of media. Actions:
Develop a list of “Best Management Practices” that protect water quality in nearby waterways for agricultural land.
Develop a list of “Best Management Practices” that protect water quality in nearby waterways for residential and institutional land.
Summarize the value of the waterbodies in the Flat Lake watershed in language understood by a non-technical audience.
Publish an annual newsletter containing information outlined in the first three action items of this objective.
Develop a web site containing information outlined in the first three action items of this objective.
Objective 5: Participate in the Hoosier Riverwatch program. Actions:
Identify groups (local schools, girl/boy scouts, girls and boys club, 4-H, etc.) that may be interested in participating in Riverwatch. (Students at Ancilla College would be a possible source of volunteers with oversight from a professor or mentor.)
Identify landowners along Flat Lake tributaries that would be willing to allow a group to conduct Riverwatch sampling on their property. Target property owners at sites sampled during development of the watershed management plan.
Attend a Riverwatch training session. Advertise results of the work to the community through various forms of media
mentioned in Objective 2. Objective 6: Participate in the Indiana Clean Lakes volunteer monitoring program. Actions:
Identify individuals that may be interested in participating in the Indiana Clean Lakes Program (CLP) Volunteer Monitoring Program. (Students at Ancilla College would be a possible source of volunteers with oversight from a professor or mentor.)
Contact the CLP volunteer coordinator to schedule training for monitors on Flat and Gilbert Lakes.
Advertise results of the work to the community through various forms of media mentioned in Objective 2.
JFNew File #99-08-24L/01 Page 54
Flat Lake Watershed Management Plan June 11, 2003 Marshall County, Indiana
Goal 2: In 10 to 20 years, we want to improve water clarity in Flat and Gilbert Lakes such that the lakes exhibit a growing season Secchi disk transparency mean of 6 feet. Goal time frame: This is a long-term goal. The goal should be reached by 2013-2023. Objective 1: Continue wetland restoration efforts in the headwaters of the eastern inlet to Gilbert Lake. Objective notes:
The PHJC constructed a wetland above the eastern inlet to Gilbert Lake in 2000 and adding fencing to exclude livestock from the wetland in 2002. This area could be planted with a diverse mix of wetland species to facilitate the wetland restoration and increase its water filtering ability. Some exotic/nuisance species control may also be useful in improving the wetland’s filtering ability.
Current research suggests that structural management practices such as wetlands may remove more than 80% of the sediment and approximately 45% of the nutrients (Winer, 2000; Claytor and Schueler, 1996: and Metropolitan Washington Council of Governments, 1992). Removal efficiencies depend upon site conditions and factors related to the structure’s deign, operation, and maintenance. Nutrient removal efficiencies differ depending upon the form of the nutrient measured. For example, total phosphorus removal efficiencies are often greater than ammonia-nitrogen removal efficiencies.
Actions:
Work with IDNR Resource Specialist to understand the expected hydrology in the constructed wetland and create a plan for vegetating the wetland.
Select native plant species to vegetate wetland. A mix of emergent and floating species may be necessary depending upon the wetland’s expected hydrology.
Determine if a control of exotic/nuisance species is necessary and control with appropriate method (burning, herbicide, hand-pulling, etc.).
Identify funding for planting and maintenance (exotic/nuisance species control). Objective 2: Work with the NRCS, SWCD, and agricultural property owners in the watershed to promote water quality Best Management Practices (BMPs) usage in the watershed. Objective notes:
Many studies have shown a reduction in pollutant loads to waterbodies or improvement in waterbody trophic state due to implementation of BMPs on agricultural land. For example, Olem and Flock (1990) report 60 to 98 percent reductions in sediment loading and 40 to 95 percent reductions in phosphorus loading to waterways as a result of utilizing conservation tillage methods. Buffer strips can reduce up to 80% of the sediment and 50% of the phosphorus in runoff according to the Conservation Technology Information Center (2000). With respect to Indiana lakes and the specific goals set by the Flat Lake watershed stakeholders, Jones (1996) found that ecoregions reporting higher percentages of cropland in the Conservation Reserve Program (CRP) had mean lower TSI scores (Goal 3). Similarly, Jones observed lower TSI scores in ecoregions
JFNew File #99-08-24L/01 Page 55
Flat Lake Watershed Management Plan June 11, 2003 Marshall County, Indiana
with high percentages of conservation tillage. (Usually lakes with lower TSI scores have better water clarity as well.)
Areas to be targeted are those areas shown as sources on Figure 15. Figure 15 highlights the portion of the watershed that is mapped in a highly or potentially highly erodible soil unit and row crop agricultural production. The largest tracts are located along West 10 B Road and State Road 17.
Exact load reductions will depend upon the BMP utilized and acreage to which the BMP is applied. Appendix F presents an example load reduction calculation for converting a portion of a row cropped field to pasture (CRP). The example utilizes IDEM’s pollutant load reduction workbook. Revised Universal Soil Loss Equation (RUSLE) parameters were taken from the U.S. Environmental Protection Agency’s STEPL (Spreadsheet Tool for the Estimation of Pollutant Load) model. Using the IDEM pollutant load reduction model, converting 100 acres of row crop land to pasture will result in a reduction of 96 tons of sediment per year, 134 pounds of nitrogen per year, and 268 pounds of nitrogen per year.
Actions:
Work with the NRCS and SWCD to identify which property owners in the Flat Lake watershed are using conservation tillage methods and/or land conservation programs. Where possible or appropriate, assist the NRCS and SWCD in encouraging agricultural property owners not using conservation tillage or not participating in conservation programs to utilize these programs. Increasing conservation tillage and the use of filter strips are stated goals of the Marshall County SWCD’s Long Range Plan. Flat Lake watershed stakeholders should work with the SWCD to help them implement this goal.
Work with NRCS and SWCD representatives to hold demonstration days on properties where landowners are implementing conservation tillage methods and/or land conservation programs. This effort will help advertise available methods to reduce soil loss from land and pollutant loading to local streams. The local IDNR Resource Specialist has already expressed an interest in assisting with this. The local SWCD conducts such field days in the county.
Attend local SWCD meetings. Objective 3: Institute a program of regular street cleaning on the PHJC property. Objective notes:
The PHJC property contains the largest area of concentrated hardscape in the watershed. This area also has storm drains directly connected to the hardscape. Consequently this area is a source of silt and nutrients to the watershed’s waterbodies.
Actions:
Meet with facility groundskeeper to discuss regular cleaning schedule. Identify proper disposal areas for materials collected during cleaning. Identify which drains can be retrofitted with some type of sediment catch basin or filter.
(Can be done in conjunction with Objective 6.)
JFNew File #99-08-24L/01 Page 56
Flat Lake Watershed Management Plan June 11, 2003 Marshall County, Indiana
Objective 4: Complete bridge/roadside erosion control project where Tulip Road crosses the unnamed eastern inlet to Flat Lake. Objective notes:
Sediment and gravel washed from Tulip Road into the unnamed eastern inlet to Flat Lake was identified as a problem during the watershed plan’s development. Constructing a small levee or swale to direct road runoff away from the unnamed eastern inlet to Flat Lake and towards a small (20 square feet in size) filtration swale/area would help prevent the sediment and gravel from Tulip Road from entering the unnamed eastern inlet to Flat Lake.
Filtration areas such as the one proposed here filter up to 80-90% of the sediment from stormwater that reaches the area. Any nutrients attached to filtered sediment will also be prevented from reaching the eastern inlet to Flat Lake.
Actions:
Meet with County Highway Department to determine the feasibility of implementing an erosion control project at this site.
Obtain property owners approval of the project. Depending upon size and exact location of the filtration swale/area, permits may be
needed to construction these areas. If permits are needed, apply for federal (Army Corps of Engineers, Clean Water Act (CWA), Section 404), state (IDEM CWA Section 401 Water Quality Certification and IDNR Construction in a Floodway), and local (Marshall County Drainage Board) permits.
Prepare “Request for Proposal” (RFP) package for contractors to design and construct the filtration swale/area. The RFP may include the permitting work. Funding source may dictate the form of the RFP.
Select a contractor to design and construct the filtration swale/area Objective 5: Work with county sanitarian to identify any failing septic systems and promote proper septic system maintenance in the watershed. Objective notes:
Figure 15 suggests much of the watershed is mapped in a soil unit that is considered moderately to severely limited for use as a septic system. The areas mapped in the severely limited soil unit and those closest to the watershed’s waterbodies should be targeted first.
Actions:
Meet with the Marshall County Health Department to identify any failing septic systems in the watershed, targeting the areas noted above first.
Develop list/summary of “Best Management Practices” available to reduce the risk of pathogenic contamination of watershed waterbodies. The list should include management techniques that address contamination from all sources, including domestic and wild animals, in the watershed. Additionally, the list should be written in language that is understood by a non-technical audience.
JFNew File #99-08-24L/01 Page 57
Flat Lake Watershed Management Plan June 11, 2003 Marshall County, Indiana
Disseminate the list/summary of “Best Management Practices” available to reduce the risk of pathogenic contamination of watershed waterbodies via an email distribution list, newsletter, or if possible a link on the Ancilla College web site.
Objective 6: Quantify pollutant (sediment, nutrients, and bacteria) loads from all storm drains that discharge from Poor Handmaids of Jesus Christ property to Gilbert Lake. Objective notes: The 1997 IDNR Diagnostic Study completed for Gilbert Lake suggested that that storm drains from the Ancilla property may be contributing pollutants to the lake and increasing the eutrophication of the lake. These pollutant loads need to be identified and quantified in order establish the appropriate methods to abate this pollution and prioritization of abatement action. This objective is designed to provide stakeholders with the information needed to make such decisions. Decisions based on information obtained while achieving this goal should be included in future revisions of the watershed management plan. Actions:
Identify all storm drains entering Gilbert Lake. A portion of this might have already been completed during the building or updating of PHJC structures.
Develop a spreadsheet/database containing the location of all storm drains to Gilbert Lake.
Enter data/map or update maps of the storm drains. Attributes such as size of pipe, area of drainage, whether it carries water continuously or only during wet weather, and potential pollutants associated with it should be attached to the location information for each drain.
Identify funding sources to support sampling efforts. Develop a plan to measure pollutant loads. Sampling protocol will have to be developed
once the nature and location of storm drains is known (ie. some drains may not be accessible to sampling while others may only carry water during storm events). Sampling protocol will depend upon the funding available to sample identified storm drains.
Develop spreadsheet/database to hold sampling results. Disseminate results of this sampling to watershed stakeholders in a watershed stakeholder
meeting. Future versions of the watershed management plan should include methods for addressing storm drain pollutant loads, if necessary, and a prioritization of which drains should be addressed first.
Objective 7: Improve buffer around Gilbert Lake. Objective notes:
As noted above, buffer strips can reduce up to 80% of the sediment and 50% of the phosphorus in runoff according to the Conservation Technology Information Center (2000).
Planting trees around Gilbert Lake will also reduce internal cycling of phosphorus. Internal phosphorus loading was noted as a problem in the 1997 LARE diagnostic study. Wind action can stir shallow lakes enough to resuspend bottom sediments. If these sediments are high in phosphorus, the sediments could release the phosphorus under the right water chemistry conditions. This may be occurring in Gilbert Lake. Improving the buffer around the lake will reduce the internal loading problem.
JFNew File #99-08-24L/01 Page 58
Flat Lake Watershed Management Plan June 11, 2003 Marshall County, Indiana
Actions:
Work with IDNR Resource Specialist to supplement previous efforts to plant trees along a portion of Gilbert Lake. Such a planting will help reduce wind mixing and the resuspension of sediment and sediment-attached nutrient that results from this wind mixing.
Meet with appropriate officials to discuss feasibility of revegetating Gilbert Lake’s shoreline and shallow water.
Select appropriate site(s) and species for reforestation along the perimeter of Gilbert Lake; determine best areas for shoreline revegetation and plant species to be planted.
Identify and apply for funding to purchase plants and conduct plantings. The funding required to complete this activity will depend upon the number, size, and variety of tree and plant species chosen for planting.
Hold a volunteer field day to complete recommended plantings in and around Gilbert Lake.
Objective 8: Promote the usage of alternative fertilizers and/or the reduction in the use of fertilizer. Objective notes: Fertilizers were identified as one of the sources of nutrients to the watershed waterbodies. Actions:
Disseminate information explaining how fertilizers impact water quality and the importance of reducing fertilizer usage in the watershed via a newsletter, email list, or if possible as a link to the Ancilla College web site. Residential watershed stakeholders should be provided information on how to test their soils to determine the need for phosphorus in residential fertilizer applications and how to obtain phosphorus free fertilizer. (The local SWCD can provide soil testing information.)
Investigate the market potential of phosphorus free fertilizer within the vicinity of the Flat Lake watershed. If the market is available, future iterations of the watershed management plan should include methods for marketing phosphorus free fertilizer.
Objective 9: Work with the golf course managers to enroll the course in the Audubon International program. Objective notes:
The golf course was identified as one of the sources of fertilizers in the watershed. Audubon International is an educational program to assist golf courses in becoming
environmentally friendly. The program offers information on six program goals, one of which is water quality management. Participating golf courses can become a certified Cooperative Sanctuary System course by completing tasks in each of the six categories.
In a survey of program participants, Audubon International found that 63% of the survey respondents had decreased their fertilizer use as a result of participation in the program. Eighty three percent of the respondents increased their use of slow-release fertilizers (Audubon International, 2002).
JFNew File #99-08-24L/01 Page 59

Flat Lake Watershed Management Plan June 11, 2003 Marshall County, Indiana
Actions: Meet with the golf course superintendent to discuss the course’s participation in the
Audubon International program. Objective 10: Work with Marshall County planning officials to increase awareness of any proposed development in the watershed. Objective notes: Currently the Flat Lake watershed is not experiencing significant development pressure. However, establishing a good working relationship with Marshall County planning officials is recommended. This relationship will allow Marshall County planning officials to become familiar with the goals that stakeholders have developed to improve water quality in the watershed. It will also allow stakeholders to participate in any public comment processes associated with future development in the watershed. Actions:
Attend at least one Marshall County planning meeting annually. Goal 3: In 50 years we want Gilbert and Flat Lakes to exhibit productivity levels that are characteristic of lakes right at the theoretical dividing line between mesotrophic and eutrophic categories. Goal time frame: This is a long-term goal. The goal should be reached by 2053. Goal notes: Efforts to improve water clarity (Goal 2) will reduce eutrophication as well; therefore, the only objective for this goal is regular monitoring to help track progress toward both goals. Additionally, promotion of water quality monitoring is one of the actions the Marshall County SWCD lists in its Long Range Plan. Monitoring Flat and Gilbert Lakes and advertising the results will assist Marshall County in completing this action item. The lakes’ trophic state will be measured using primarily the Carlson’s TSI. Results obtained from the Indiana Clean Lakes Volunteer Monitoring Program (advanced or basic) will provide information to calculate Carlson’s TSI. IDEM will calculate the Indiana Eutrophication Index (EI) using data it collects during the Indiana Clean Lakes Program rotating basin sampling that occurs every five years (approximately). Stakeholders can use this information in addition to their calculations of the Carlson TSI to track progress toward achieving this goal. Objective 1: Monitor the trophic state of Flat and Gilbert Lakes. Objective notes: There are a variety of ways to achieve this objective (i.e. purchase equipment and conduct the monitoring; hire a consultant to conduct the monitoring, etc.). However, the following actions are developed based on participation in the Indiana Clean Lakes Volunteer Monitoring Program. Participation in this program does not require a lot of money and will allow more stakeholders to be involved in implementing the management plan. The program also gives participants access to some technical assistance and equipment. Finally, it assists with
JFNew File #99-08-24L/01 Page 60

Flat Lake Watershed Management Plan June 11, 2003 Marshall County, Indiana
statewide efforts to collect water quality data. As a result, participants will be able to compare their data collected for their lake to data collected by other volunteers across the state. Actions:
Identify individuals that may be interested in participating in the CLP Volunteer Monitoring Program. (Students at Ancilla College would be a possible source of volunteers with oversight from a professor or mentor.)
Contact the CLP volunteer coordinator to schedule training for monitors on Flat and Gilbert Lakes. The CLP volunteer coordinator will provide the volunteer group with a Secchi transparency disk for measuring water clarity at the time of training. After one year in the program, the lakes may be eligible for advanced monitoring, which includes measuring total phosphorus and chlorophyll a. The program will provide the necessary equipment and training to conduct advanced monitoring as it does with the basic monitoring program.
Record results of water clarity measurements in a spreadsheet to allow long-term tracking of the water clarity. Calculate the Carlson’s TSI based on average Secchi disk transparency score. If advance monitoring is conducted, calculate the Carlson’s TSI for total phosphorus and chlorophyll a.
Advertise results of the work to the community via press releases to the local media, an annual newsletter, and/or mailings to stakeholders using the existing stakeholder database.
Goal 4: We want the dissolved oxygen level in Gilbert Lake’s hypolimnion to be above 1 ppm (mg/L) at all times throughout the year except during mid to late summer (July and August). Goal time frame: This is a long-term goal. The goal should be reached by 2013. Goal notes: Efforts to improve water clarity (Goal 2) will increase hypolimnetic oxygen levels as well; therefore, the only objective for this goal is regular monitoring to help track progress toward both goals. Additionally, promotion of water quality monitoring is one of the actions the Marshall County SWCD lists in its Long Range Plan. Monitoring Gilbert Lake and advertising the results will assist Marshall County in completing this action item. Finally, this goal addresses Gilbert Lake first since it was identified as a critical area. Stakeholders will consider setting this goal for Flat Lake in future iterations of the watershed management plan. Objective 1: Monitor progress toward achieving Goal 2 since achievement of Goal 2 will help in achieving this goal. Objective notes: There are a variety of ways to achieve this objective (i.e. purchase equipment and conduct the monitoring; hire a consultant to conduct the monitoring, etc.) However, for many of the same reasons listed in the objective notes for Goal 3, Objective 1, participation in the Indiana Clean Lakes Volunteer Monitoring Program is recommended.
JFNew File #99-08-24L/01 Page 61
Flat Lake Watershed Management Plan June 11, 2003 Marshall County, Indiana
Actions: Identify individuals that may be interested in participating in the CLP Volunteer
Monitoring Program. (Students at Ancilla College would be a possible source of volunteers with oversight from a professor or mentor.)
Contact the CLP volunteer coordinator to schedule training for monitors on Flat and Gilbert Lakes.
Once in the program, volunteers can utilize dissolved oxygen equipment owned by the program. The nearest dissolved oxygen meter is stationed in Warsaw. The designated volunteer should check out the dissolved oxygen meter twice a month from May through September.
Measure dissolved oxygen and temperature twice a month from May through September. Record results of dissolved oxygen and temperature measurements in a spreadsheet to
allow long-term tracking of the dissolved oxygen goal. Create dissolved oxygen and temperature profiles for each sampling event.
Advertise results of the work to the community via press releases to the local media, an annual newsletter, and/or mailings to stakeholders using the existing stakeholder database.
Goal 5: We want to reduce the coverage of purple loosestrife around Flat Lake on the IDNR property. Once we have reduced the purple loosestrife by achieving the objectives listed below, we will evaluate the growth of native species from the seed bank and, if necessary, supplement the native plant population with plugs and/or seeds. Goal time frame: The goal should be reached by 2005. Goal notes: Because of its low cost and use of volunteers, the 4-H program will be used to start reducing the purple loosestrife around Flat Lake. The program’s protocol includes a pre-release survey of the purple loosestrife in the release area. The protocol also includes a post release survey. This will allow watershed stakeholders to set a target reduction percentage and measure their success in achieving that target reduction. Objective 1: Participate in the 4-H biological control of purple loosestrife program. Objective notes: This participation will involve a one-time beetle raising effort and release of raised beetles. Actions:
Establish a working relationship with the IDNR manager of the Menominee State Wetland Conservation Area (Tom Despot, Winamac FWA).
Obtain permission from the IDNR to conduct the beetle release in the vicinity of Flat Lake on IDNR property.
Identify individual(s) that may be interested in leading/serving as sponsor for a local 4-H control of purple loosestrife effort.
JFNew File #99-08-24L/01 Page 62
Flat Lake Watershed Management Plan June 11, 2003 Marshall County, Indiana
Work with the Indiana 4-H program office (Natalie Carroll, Purdue University) and the Marshall County NRCS Extension Educator (Randy Dickson) to identify interested students.
Objective 2: Educate watershed stakeholders on the impact of purple loosestrife on aquatic ecosystems and ways to reduce infestation of the species. Actions:
Disseminate purple loosestrife literature produced by SeaGrant, IDNR, and other natural resource agencies to watershed stakeholders via a newsletter, email list, or if possible a link on the Ancilla College web site.
Have information on purple loosestrife and its control available at field days organized by this watershed group or the local SWCD.
Table 12 summarizes the action plan and its time frame and presents important information on general cost estimates and potential funding sources for implementing the action plan. The first step of the plan is to generate more interest and participation in implementing the plan. A watershed stakeholder has agreed to spearhead the initial step toward generating more interest and participation. Once more participants are active in the plan’s implementation, the potentially responsible parties column of Table 12 will be completed. Potential funding sources listed in Table 12 are simply a starting point for researching grant opportunities and other resources available to help fund the action plan. Additional funding sources and/or other resources are likely available for implementing the plan. Appendix G provides a summary of different funding sources and resources that may be available to help implement the Flat Lake Watershed Management Plan.
JFNew File #99-08-24L/01 Page 63
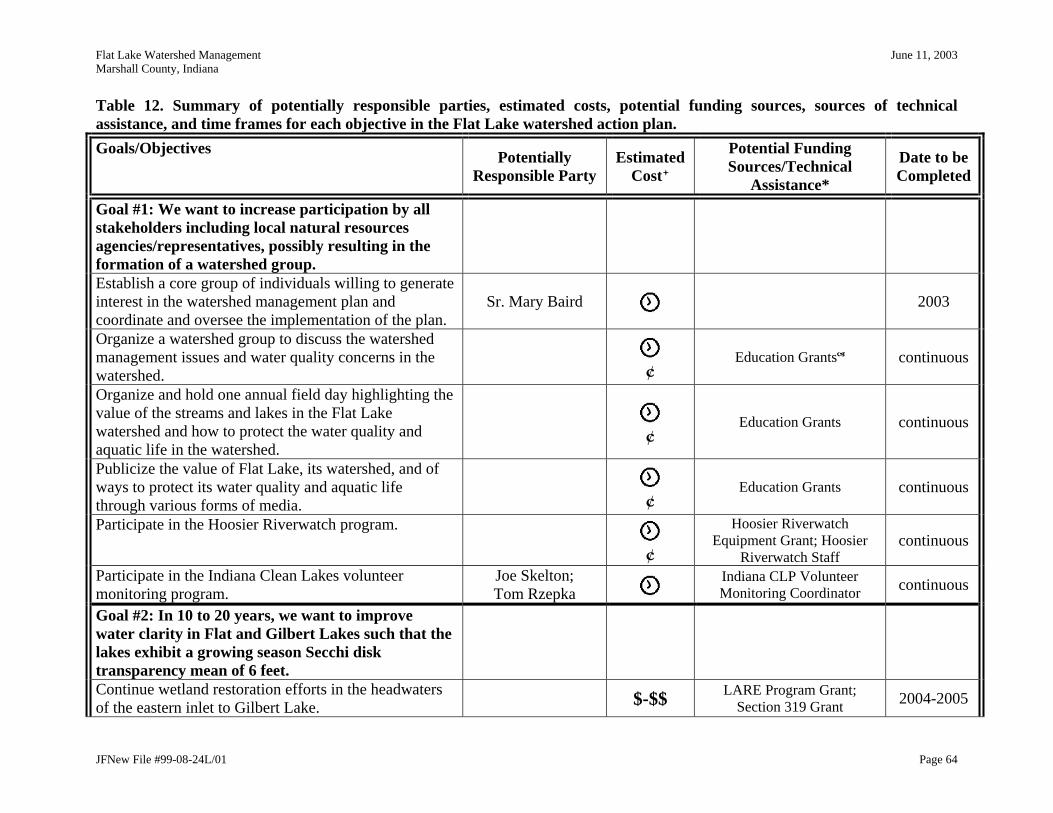
Flat Lake Watershed Management June 11, 2003 Marshall County, Indiana
Table 12. Summary of potentially responsible parties, estimated costs, potential funding sources, sources of technical assistance, and time frames for each objective in the Flat Lake watershed action plan. Goals/Objectives Potentially
Responsible Party Estimated
Cost
Potential Funding Sources/Technical
Assistance*
Date to be Completed
Goal #1: We want to increase participation by all stakeholders including local natural resources agencies/representatives, possibly resulting in the formation of a watershed group.
Establish a core group of individuals willing to generate interest in the watershed management plan and coordinate and oversee the implementation of the plan.
Sr. Mary Baird 2003
Organize a watershed group to discuss the watershed management issues and water quality concerns in the watershed.
¢
Education Grants continuous
Organize and hold one annual field day highlighting the value of the streams and lakes in the Flat Lake watershed and how to protect the water quality and aquatic life in the watershed.
¢
Education Grants continuous
Publicize the value of Flat Lake, its watershed, and of ways to protect its water quality and aquatic life through various forms of media.
¢
Education Grants continuous
Participate in the Hoosier Riverwatch program.
¢
Hoosier Riverwatch Equipment Grant; Hoosier
Riverwatch Staff continuous
Participate in the Indiana Clean Lakes volunteer monitoring program.
Joe Skelton; Tom Rzepka
Indiana CLP Volunteer Monitoring Coordinator continuous
Goal #2: In 10 to 20 years, we want to improve water clarity in Flat and Gilbert Lakes such that the lakes exhibit a growing season Secchi disk transparency mean of 6 feet.
Continue wetland restoration efforts in the headwaters of the eastern inlet to Gilbert Lake. $-$$ LARE Program Grant;
Section 319 Grant 2004-2005
JFNew File #99-08-24L/01 Page 64
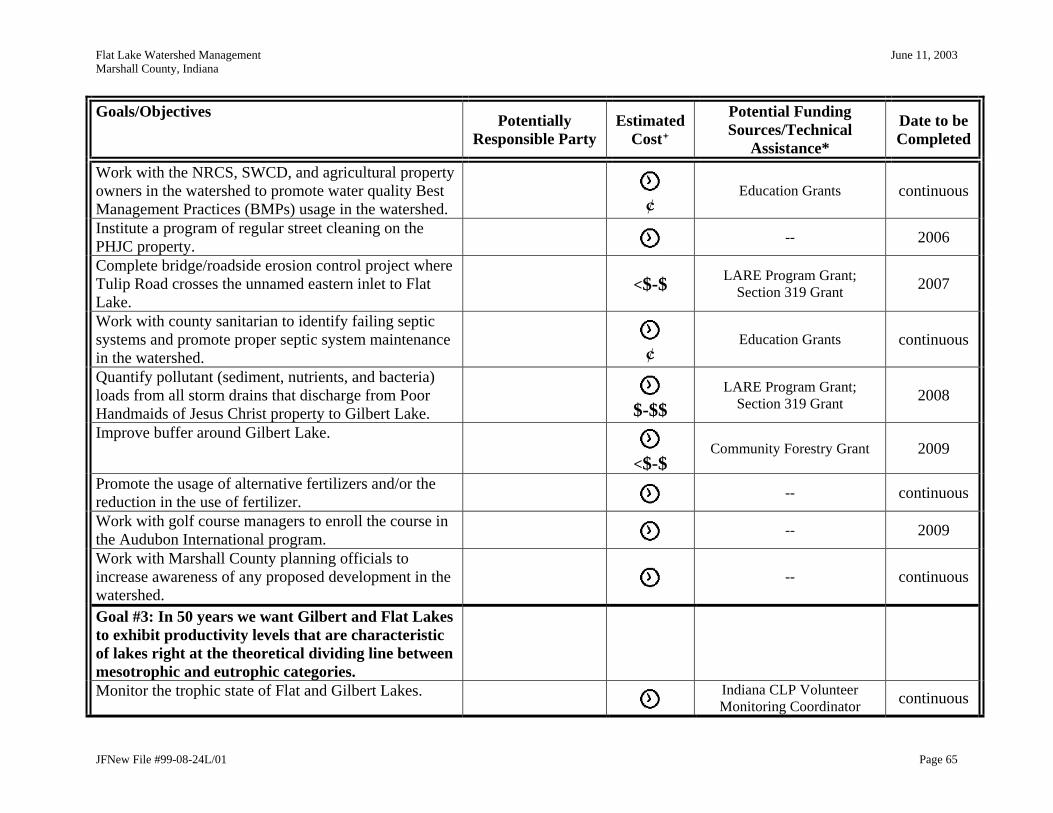
Flat Lake Watershed Management June 11, 2003 Marshall County, Indiana
Goals/Objectives Potentially Responsible Party
Estimated Cost
Potential Funding Sources/Technical
Assistance*
Date to be Completed
Work with the NRCS, SWCD, and agricultural property owners in the watershed to promote water quality Best Management Practices (BMPs) usage in the watershed.
¢
Education Grants continuous
Institute a program of regular street cleaning on the PHJC property. -- 2006
Complete bridge/roadside erosion control project where Tulip Road crosses the unnamed eastern inlet to Flat Lake.
<$-$ LARE Program Grant; Section 319 Grant 2007
Work with county sanitarian to identify failing septic systems and promote proper septic system maintenance in the watershed.
¢
Education Grants continuous
Quantify pollutant (sediment, nutrients, and bacteria) loads from all storm drains that discharge from Poor Handmaids of Jesus Christ property to Gilbert Lake.
$-$$
LARE Program Grant; Section 319 Grant 2008
Improve buffer around Gilbert Lake.
<$-$ Community Forestry Grant 2009
Promote the usage of alternative fertilizers and/or the reduction in the use of fertilizer. -- continuous
Work with golf course managers to enroll the course in the Audubon International program. -- 2009
Work with Marshall County planning officials to increase awareness of any proposed development in the watershed.
-- continuous
Goal #3: In 50 years we want Gilbert and Flat Lakes to exhibit productivity levels that are characteristic of lakes right at the theoretical dividing line between mesotrophic and eutrophic categories.
Monitor the trophic state of Flat and Gilbert Lakes. Indiana CLP Volunteer Monitoring Coordinator continuous
JFNew File #99-08-24L/01 Page 65
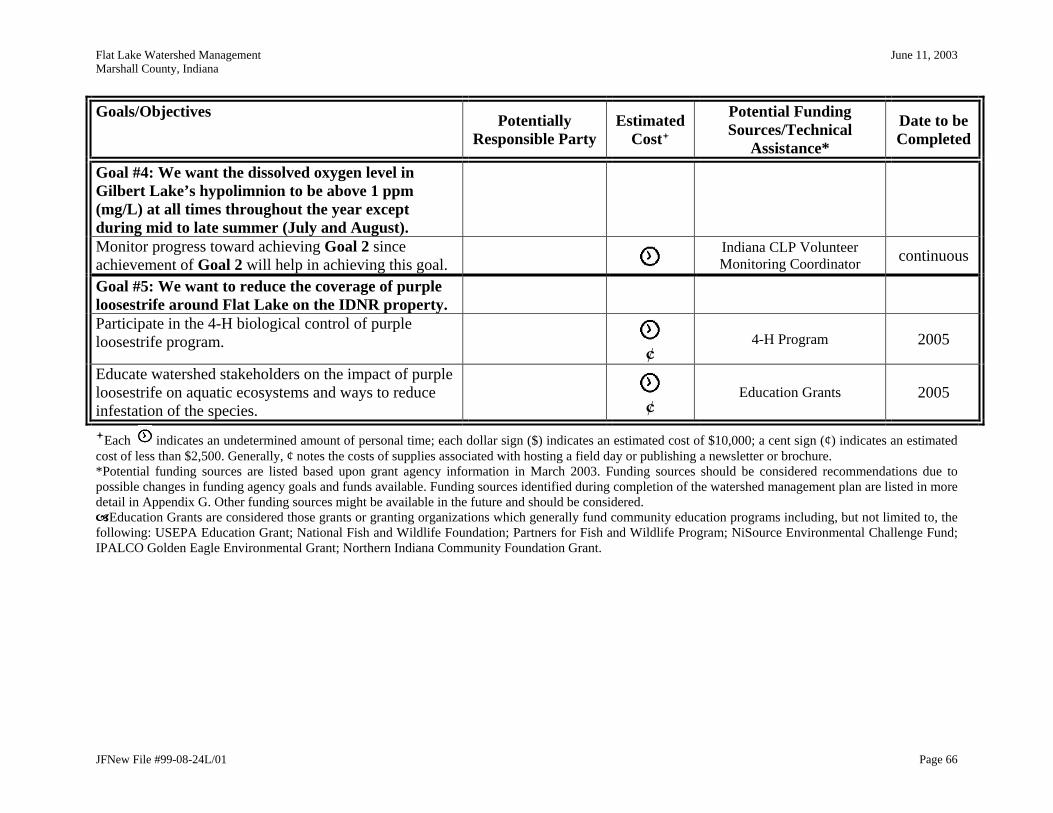
Flat Lake Watershed Management June 11, 2003 Marshall County, Indiana
Goals/Objectives Potentially Responsible Party
Estimated Cost
Potential Funding Sources/Technical
Assistance*
Date to be Completed
Goal #4: We want the dissolved oxygen level in Gilbert Lake’s hypolimnion to be above 1 ppm (mg/L) at all times throughout the year except during mid to late summer (July and August).
Monitor progress toward achieving Goal 2 since achievement of Goal 2 will help in achieving this goal.
Indiana CLP Volunteer Monitoring Coordinator continuous
Goal #5: We want to reduce the coverage of purple loosestrife around Flat Lake on the IDNR property.
Participate in the 4-H biological control of purple loosestrife program.
¢ 4-H Program 2005
Educate watershed stakeholders on the impact of purple loosestrife on aquatic ecosystems and ways to reduce infestation of the species.
¢
Education Grants 2005
Each indicates an undetermined amount of personal time; each dollar sign ($) indicates an estimated cost of $10,000; a cent sign (¢) indicates an estimated cost of less than $2,500. Generally, ¢ notes the costs of supplies associated with hosting a field day or publishing a newsletter or brochure. *Potential funding sources are listed based upon grant agency information in March 2003. Funding sources should be considered recommendations due to possible changes in funding agency goals and funds available. Funding sources identified during completion of the watershed management plan are listed in more detail in Appendix G. Other funding sources might be available in the future and should be considered.
Education Grants are considered those grants or granting organizations which generally fund community education programs including, but not limited to, the following: USEPA Education Grant; National Fish and Wildlife Foundation; Partners for Fish and Wildlife Program; NiSource Environmental Challenge Fund; IPALCO Golden Eagle Environmental Grant; Northern Indiana Community Foundation Grant.
JFNew File #99-08-24L/01 Page 66
Flat Lake Watershed Management Plan June 11, 2003 Marshall County, Indiana
5.0 MEASURING SUCCESS Measuring stakeholders’ success at achieving their goals and assessing progress toward realizing their vision for the Flat Lake watershed is a vital component of the plan. The following describes concrete milestones for stakeholders to reach and tangible deliverables produced while they work toward each goal. It also includes interim measures of success which will help stakeholders evaluate their progress toward their chosen goals. Finally, it outlines monitoring plans, where appropriate, to evaluate whether or not stakeholders have attained their goals. Because several of the goals are long-term goals (i.e. it will take more than 5 years to attain), regular monitoring is essential to ensure the actions stakeholders take are helping achieve those goals. Monitoring will allow stakeholders to make timely adjustments to their strategy if the monitoring results indicate such adjustments are needed. Goal 1: We want to increase participation by all stakeholders including local natural resources agencies/representatives, possibly resulting in the formation of a watershed group. Milestones: (Except for annual/continuous tasks milestones should be reached by the end of 2004.)
Identification of a point person to lead the implementation of the plan. Flat Lake watershed group formed. Identification of potentially responsible parties to implement the plan (i.e completing
Table 12 of the plan). Watershed group meetings held. Watershed group meeting minutes published. Watershed group newsletter published. Watershed group website developed. Property owners using conservation programs identified. Field days held. List of agricultural Best Management Practices developed. List of residential/institutional Best Management Practices developed. Hoosier Riverwatch volunteer training attended. Hoosier Riverwatch data collected and submitted. Clean Lakes Program volunteer training attended. Clean Lakes Program data collected and submitted.
Interim Measures of Success:
Number of Flat Lake watershed group meetings held. Number of individuals attending watershed group meetings. Number of stakeholder mailings and/or newsletters distributed. Number of hits on the watershed group website. Number of individuals attending field days. Number of individuals receiving Best Management Practice lists. Number of individuals attending Hoosier Riverwatch training. Number of Hoosier Riverwatch sampling events conducted. Number of people involved in Hoosier Riverwatch sampling. Number of individuals attending Clean Lakes Program training. Number of Clean Lakes Program sampling events conducted. Number of people involved in Cleans Lakes Program sampling.
JFNew File #99-08-24L/01 Page 67
Flat Lake Watershed Management Plan June 11, 2003 Marshall County, Indiana
Goal Attainment: This goal lacks a specific water quality target similar that the other goals possess. Rather than being attained this goal will be a continual effort by watershed stakeholders. Goal 2: In 10 to 20 years, we want to improve water clarity in Flat and Gilbert Lakes such that the lakes exhibit a growing season Secchi disk transparency mean of 6 feet. Milestones: (Except for annual/continuous tasks milestones should be reached by the end of 2010.)
Property owners using conservation programs identified. Demonstration days held. Marshall County Soil and Water Conservation District (SWCD) meetings attended. Meeting with Marshall County Health Department held. List of Best Management Practices to control pathogen contamination developed. Gilbert Lake storm drains identified. Storm drain database developed. Storm drain map created. Storm drain sampling collection funding source identified. Storm drain sampling protocol developed. Sampling of storm drains completed. Revegetation of Gilbert Lake shoreline meeting held. Feasibility for planting trees along the shoreline of Gilbert Lake determined. Reforestation/revegetation sites selected. Reforestation/revegetation funding sources identified. Volunteer day for reforestation/revegetation of Gilbert Lake held. Information regarding impacts of fertilizers to water quality disseminated. Market potential for phosphorus-free fertilizer investigated. Meeting with golf course managers held. Marshall County planning meetings attended.
Interim Measures of Success:
Wetland restoration project complete. Number of property owners using conservation programs identified. Number of demonstration days held. Increase in acreage of watershed in CRP. Increase in acreage of watershed using conservation tillage. Number of Marshall County SWCD meetings attended. Number of individuals receiving Best Management Practices to control pathogen
contamination list. Number of failing septic systems identified. Bridge/roadside erosion control project completed. Establishment of pollutant loads from all storm drains. Reforestation/ revegetation project completed. Number of individuals participating in reforestation/revegetation volunteer day. Number of individuals receiving fertilizer information. Golf course enrolled in Audubon International program. Number of Marshall County planning commission meetings attended.
JFNew File #99-08-24L/01 Page 68
Flat Lake Watershed Management Plan June 11, 2003 Marshall County, Indiana
Goal Attainment: The goal is attained when the growing season average water clarity is consistently greater than or equal to 6 feet as measured by a Secchi disk. The following outlines how to document progress toward goal attainment as well as actual attainment of the goal. Indicator to be monitored: Water clarity. Parameter assessed: Secchi disk transparency. Frequency of monitoring: Bimonthly throughout the growing season – May-September. Sampling may also occur bimonthly in April and October depending upon the availability of volunteer completing the monitoring. Location of monitoring: Each lake’s deepest point. Length of monitoring: The monitoring will be conducted for 10 to 20 years. Protocol: Monitoring will be conducted according to the CLP Volunteer Monitoring Program protocol. This protocol is presented in Appendix H. Monitoring equipment: Secchi disk, color chart, and data forms that are provided by the CLP Volunteer Monitoring Program. The monitor will also need a boat, oars, anchor, data sheets, clipboard, and pencil. Data entry: Monitor will return data forms to the CLP Volunteer Monitoring Coordinator. Alternatively, the monitor may enter data directly via the CLP Volunteer Monitoring Program web site (see CLP Volunteer Monitoring protocol in Appendix H for instructions). Monitor should also keep a copy of the data forms in a three ring binder. Data evaluation: The CLP Volunteer Monitoring Coordinator will evaluate the monitoring data as part of the Volunteer Monitoring Program. The data collected will be compared to data collected by other lake volunteer monitors across the state to provide some context. Data may also be evaluated by a consultant as needed. The IDEM lakes coordinator, the IDNR Lake and River Enhancement Program’s aquatic biologist, and local SWCD or NRCS staff may also provide assistance in interpreting the data as needed. Goal 3: In 50 years we want Gilbert and Flat Lakes to exhibit productivity levels that are characteristic of lakes right at the theoretical dividing line between mesotrophic and eutrophic categories. Milestones: (Training should be completed by the end of 2004. Data collection/submittal is a continuous task.)
Clean Lakes Program volunteer training attended. Clean Lakes Program data collected and submitted.
Interim Measures of Success:
Number of individuals attending Clean Lakes Program training. Number of Clean Lakes Program sampling events conducted. Number of people involved in Cleans Lakes Program sampling.
Goal Attainment: The goal is attained when the lake productivity level is near the dividing line between mesotrophic (moderately productive) and eutrophic (productive). Figure 18 provides a diagram for estimating productivity level based on Secchi disk transparency, total phosphorus, and chlorophyll a. Carlson’s equations (Carlson, 1977) form the basis of this diagram. This
JFNew File #99-08-24L/01 Page 69
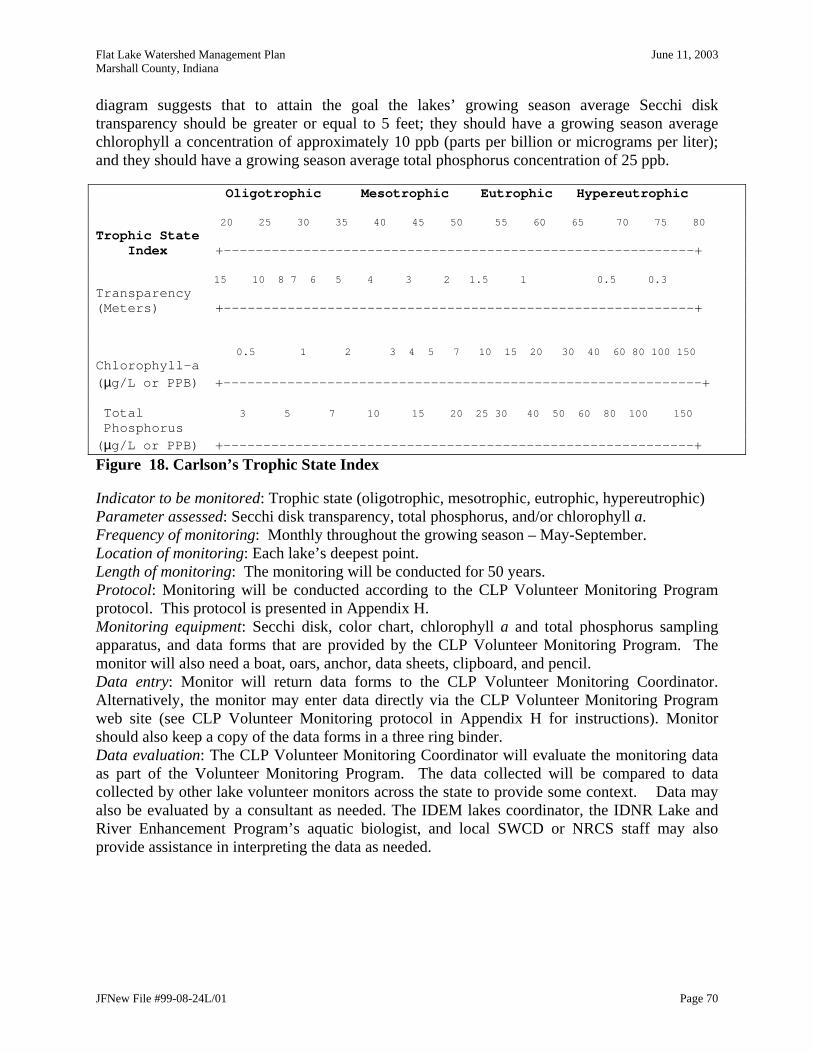
Flat Lake Watershed Management Plan June 11, 2003 Marshall County, Indiana
diagram suggests that to attain the goal the lakes’ growing season average Secchi disk transparency should be greater or equal to 5 feet; they should have a growing season average chlorophyll a concentration of approximately 10 ppb (parts per billion or micrograms per liter); and they should have a growing season average total phosphorus concentration of 25 ppb. Oligotrophic Mesotrophic Eutrophic Hypereutrophic 20 25 30 35 40 45 50 55 60 65 70 75 80 Trophic State Index +-----------------------------------------------------------+ 15 10 8 7 6 5 4 3 2 1.5 1 0.5 0.3
Transparency (Meters) +-----------------------------------------------------------+ 0.5 1 2 3 4 5 7 10 15 20 30 40 60 80 100 150
Chlorophyll-a (µg/L or PPB) +------------------------------------------------------------+ Total 3 5 7 10 15 20 25 30 40 50 60 80 100 150 Phosphorus (µg/L or PPB) +-----------------------------------------------------------+ Figure 18. Carlson’s Trophic State Index
Indicator to be monitored: Trophic state (oligotrophic, mesotrophic, eutrophic, hypereutrophic) Parameter assessed: Secchi disk transparency, total phosphorus, and/or chlorophyll a. Frequency of monitoring: Monthly throughout the growing season – May-September. Location of monitoring: Each lake’s deepest point. Length of monitoring: The monitoring will be conducted for 50 years. Protocol: Monitoring will be conducted according to the CLP Volunteer Monitoring Program protocol. This protocol is presented in Appendix H. Monitoring equipment: Secchi disk, color chart, chlorophyll a and total phosphorus sampling apparatus, and data forms that are provided by the CLP Volunteer Monitoring Program. The monitor will also need a boat, oars, anchor, data sheets, clipboard, and pencil. Data entry: Monitor will return data forms to the CLP Volunteer Monitoring Coordinator. Alternatively, the monitor may enter data directly via the CLP Volunteer Monitoring Program web site (see CLP Volunteer Monitoring protocol in Appendix H for instructions). Monitor should also keep a copy of the data forms in a three ring binder. Data evaluation: The CLP Volunteer Monitoring Coordinator will evaluate the monitoring data as part of the Volunteer Monitoring Program. The data collected will be compared to data collected by other lake volunteer monitors across the state to provide some context. Data may also be evaluated by a consultant as needed. The IDEM lakes coordinator, the IDNR Lake and River Enhancement Program’s aquatic biologist, and local SWCD or NRCS staff may also provide assistance in interpreting the data as needed.
JFNew File #99-08-24L/01 Page 70
Flat Lake Watershed Management Plan June 11, 2003 Marshall County, Indiana
Goal 4: We want the dissolved oxygen level in Gilbert Lake’s hypolimnion to be above 1 ppm (mg/L) at all times throughout the year except during mid to late summer (July and August). Milestones: (Training should be completed by the end of 2004. Data collection/submittal is a continuous task.)
Clean Lakes Program volunteer training attended. Clean Lakes Program data collected and submitted.
Interim Measures of Success:
Number of individuals attending Clean Lakes Program training. Number of Clean Lakes Program sampling events conducted. Number of people involved in Cleans Lakes Program sampling.
Goal attainment: The goal is attained when the Gilbert Lake’s water column consistently has a dissolved oxygen concentration greater than 1 ppm (part per million or milligram per liter). Because Gilbert Lake is naturally at least a moderately productive lake, dissolved oxygen levels in the lake’s hypolimnion at or less than 1 ppm are expected during mid to late summer (July and August). Low dissolved oxygen levels at these times would not be considered a failure in achieving the stated goal. Indicator to be monitored: Presence of dissolved oxygen at concentrations greater than 1 ppm throughout the lake’s water column. Parameter assessed: Dissolved oxygen. Frequency of monitoring: Monthly throughout the growing season – May-September. Sampling may also occur once in April and once in October depending upon the availability of volunteer completing the monitoring. Location of monitoring: The lake’s deepest point. Length of monitoring: The monthly monitoring will be conducted for 10 to 20 years. Protocol: Monitoring will be conducted according to the CLP Volunteer Monitoring Program protocol. This protocol is presented in Appendix H. Monitoring equipment: Dissolved oxygen meter. The monitor may borrow a meter belonging to the CLP Volunteer Monitoring Program from the Kosciusko County SWCD in Warsaw. The monitor will also need a boat, oars, anchor, data sheets, clipboard, and pencil. Data entry: Monitor will return data forms to the CLP Volunteer Monitoring Coordinator or the CLP Director. Monitor should also keep a copy of the data forms in a three ring binder. Data evaluation: The CLP Volunteer Monitoring Coordinator or Director will evaluate the monitoring data as part of the Volunteer Monitoring Program. Data may also be evaluated by a consultant as needed. The IDEM lakes coordinator, the IDNR Lake and River Enhancement Program’s aquatic biologist, and local SWCD or NRCS staff may also provide assistance in interpreting the data as needed.
JFNew File #99-08-24L/01 Page 71

Flat Lake Watershed Management Plan June 11, 2003 Marshall County, Indiana
Goal 5: We want to reduce the coverage of purple loosestrife around Flat Lake on the IDNR property. Once we have reduced the purple loosestrife by achieving the objectives listed below, we will evaluate the growth of native species from the seed bank and, if necessary, supplement the native plant population with plugs and/or seeds. Milestones: (Milestones should be reached by the end of 2005.)
Meeting with Indiana Department of Natural Resources manager of Menominee State Wetland Conservation Area held.
Permission to conduct purple loosestrife beetle releases on DNR property granted. Individuals interested in leading 4-H purple loosestrife program identified. 4-H program enrollment completed. 4-H program student participants identified. Release site selected. Pre-release monitoring at release site conducted. Purple loosestrife beetles raised and released. Post-release monitoring completed (spring and fall). Purple loosestrife literature disseminated.
Interim Measures of Success:
4-H purple loosestrife monitoring program completed. Number of individuals receiving purple loosestrife literature.
Goal attainment: The goal is attained when the purple loosestrife density is decreased and native wetland plant populations are increased. Biological control efforts may take 5 to 15 years before results are observed. Indicator to be monitored: Purple loosestrife density and wetland plant community diversity. Parameter assessed: Wetland plant community. Frequency of monitoring: At a minimum, the wetland plant community should be evaluated once in the fall. One or possibly two additional monitoring visits may be beneficial and should be considered. A spring monitoring to assess the presence and quantity of biological control organisms (beetles) should also be conducted. Location of monitoring: Location will depend upon where beetles are released. Length of monitoring: The monthly monitoring will be conducted for 5 to 15 years. This is the timeframe in which one may expect to observe results from biological control efforts. Observing success with purple loosestrife control in heavily infested areas such as the area around Flat Lake has occurred as early as three years. Protocol: Monitoring will be conducted according to the 4-H Biological Control of Purple Loosestrife program protocol. Data sheets for use with this protocol are presented in Appendix I. The complete protocol may be obtained from the Purdue Cooperative Extension Service (765-494-8422 or www.four-h.purdue.edu). The monitoring protocol includes a pre-release site inspection. This pre-release site inspection will be used to set a target for reduction and provide a measure against which success of the release will be measured. Volunteers that do not possess wetland plant identification skills may use this protocol. (Volunteers must learn how to identify purple loosestrife. Appendix J contains a brochure produced by the Ontario Federation of Anglers and Hunters and distributed by SeaGrant Great Lakes Network that provides tips on how
JFNew File #99-08-24L/01 Page 72
Flat Lake Watershed Management Plan June 11, 2003 Marshall County, Indiana
to identify purple loosestrife.) The Cornell University’s Bernd Blossey, an expert in biocontrol of non-indigenous species, has created an alternative monitoring protocol for individuals with wetland plant identification skills. Use of this protocol may be considered if appropriate volunteers are available. The protocol may be obtained at www.invasiveplants.net/plants/purpleloosestrife.htm. Monitoring equipment: For the first monitoring effort, the volunteer will need stakes to mark transects beginning and end points and thick rope/cord to establish permanent transects. The number of stakes and amount of cord will depend upon the number of transects established. Three are suggested by the protocol but more could be established if there are more than 9-10 students in the program. The transects should be 70 feet long so at least 210 feet of cord is needed. The stakes marking the transects should be at least 10 feet tall (before being anchored in the ground) since purple loosestrife can grow to be as tall as 6 feet. Placing surveying flagging at the top of the stakes will help volunteers easily spot the markers from year to year. Once the survey area is established, volunteers will need only data sheets, clipboard, pencil, calculator, and field guides (as needed). Data entry: Monitors will keep a copy of the data forms in a three ring binder. Data evaluation: The 4-H group leader will evaluate the data sheets in cooperation with the students. The group leader can obtain technical assistance from the Purdue Cooperative Extension Service (765-494-8422). Data may also be evaluated by a consultant as needed. 6.0 FUTURE CONSIDERATIONS There are several considerations stakeholders should keep in mind as they implement the Flat Lake Watershed Management Plan. Many of these considerations are noted in the proceeding sections of this text, but due to their importance, they warrant reiteration. Beaver Dam at Flat Lake Watershed stakeholders expressed concern over the beaver dam at the outlet to Flat Lake. Their concern revolved around what the ecological, social, and economical consequences would be if the dam failed. Stakeholders discussed the option of removing the dam and installing an artificial control structure in its place to ensure the lake level is maintained. JFNew and the IDNR Menominee WCA property manager inspected the dam in the spring of 2003. The dam appeared to be stable at the time of inspection. Because the dam is a natural construct and because it is likely that beavers would simply build a dam upstream of any artificial control structure, stakeholders agreed to postpone any action on the dam at this time. Watershed stakeholders may chose to revisit this issue in future revisions of the plan. Internal Phosphorus Loading in Gilbert Lake The action plan addresses many of the external sources of nutrients. However, many shallow lakes in Indiana also suffer from the internal release of phosphorus. This is particularly true for lakes that had historically high external phosphorus loads such as Gilbert Lake. In these lakes, internal sources can be the cause of more than 70% of the total phosphorus load to the lake. While it is important to address the external sources of phosphorus, complete restoration of the lake may not occur until the internal source of phosphorus is treated as well.
JFNew File #99-08-24L/01 Page 73
Flat Lake Watershed Management Plan June 11, 2003 Marshall County, Indiana
The action plan contains some one objective (Goal 2, Objective 7) that will help alleviate internal loading. This objective seeks to minimize wind mixing of the lake by enhancing the lake shoreline and planting trees along the lake’s edge. Preventing or minimizing the mixing will help minimize the impact of internal loading. In the future, more internal phosphorus control may be necessary. One of the most common and effective ways to treat internal phosphorus loading is through a strategy of phosphorus inactivation and precipitation (i.e., an alum treatment). Phosphorus precipitation and inactivation is designed to remove phosphorus from the water column and to prevent the release of phosphorus from the lake’s bottom sediments. The treatment involves adding aluminum salts to the lake. These salts form a floc or an agglomeration of small particles. This floc acts in two ways: (a) it absorbs phosphorus from the water column as it settles, and (b) it seals the bottom sediments if a thick enough layer has been deposited. Phosphorus can also precipitate out as an aluminum salt. Alum treatments cost about $1,000-$1,600 per acre treated. Alum treatments should only be considered once all external sources of phosphorus are controlled. Stakeholders may consider such a treatment in the future is external phosphorus control is insufficient to achieve the goals outlined in the plan. Permits, Easements, and Agreements: Revegetation of wetland and lake perimeter: Permission to revegetate the constructed wetland above Gilbert Lake’s inlet ditch (Goal 2, Objective 1) and to improve the buffer around Gilbert Lake (Goal 2, Objective 7) through supplemental tree plantings and shoreline/shallow water plantings must be obtained from the property owner (PHJC) before any plantings occur. The PHJC has granted permission to plant trees in the past. Tulip Road erosion control project: Depending upon the size and exact placement of the filtration swale/area to treat the erosion problem where Tulip Road crosses the eastern inlet to Flat Lake (Goal 2, Objective 4), several permits may be required to complete the project. These permits may include federal (Army Corps of Engineers, Clean Water Act (CWA), Section 404), state (IDEM CWA Section 401 Water Quality Certification and IDNR Construction in a Floodway), and local (Marshall County Drainage Board) permits. Copies of the Army Corps of Engineers CWA Section 404 and IDEM CWA Section 401 Water Quality Certification permit applications are provided in Appendix K. Landowner permission or an easement agreement from the Marshall County Highway Department and/or private landowner (depending upon the size and location) will be necessary as well to complete the project. Purple loosestrife control: The release of beetle to control of purple loosestrife (Goal 5, Objective 1) will require landowner permission. The Menominee WCA property manager has already responded positively to the proposed release. Registration of the species, number, and location of beetles being released is also required by the Indiana Department of Natural Resources Division of Nature Preserves. Operation and Maintenance: Tulip Road erosion control project: Any filtration area built to treat roadside erosion and prevent sediment loading to the eastern inlet to Flat Lake will require periodic maintenance. This maintenance simply involves removing any sediment accumulation that prevents proper
JFNew File #99-08-24L/01 Page 74
Flat Lake Watershed Management Plan June 11, 2003 Marshall County, Indiana
filtration of the stormwater directed to the area. Sediment accumulation should be checked on an annual basis and actually removal of accumulation is expected to occur once every three to five years. The County Highway Department may be able to assist with this maintenance; however, maintenance responsibilities should be discussed with the Department during the initial scoping process to determine if the project is feasible. Wetland Restoration: The PHJC have restored two wetlands on their property by restoring the area’s natural hydrology. Additionally, they have fenced these areas to prevent disturbance by grazing cattle. In the long term, these areas will provide water quality benefits while requiring little maintenance. In the short term, certain management activities may be employed to help these areas recover faster than they would if they were left alone. Such activities included prescribed burns, spot herbicide treatments, and supplemental plantings. The PHJC has utilized or plans to utilize several of these management techniques to the wetland south of Gilbert Lake. This wetland was burned in the spring of 2003. It will be spot treated with a herbicide to kill the reed canary grass in the wetland and seeded and planted with native wetland species. These maintenance activities which are designed to increase the plant diversity of the wetland will also increase functionality of the wetland. They also increase the pace of wetland restoration. Additional burns, herbicide spot treatments, and plantings may further increase the wetland’s recovery. As wetland recovery progresses, additional maintenance activities may be deemed necessary in the future. The wetland at the headwaters of the eastern inlet to Gilbert Lake might also benefit from such maintenance activities. Monitoring: Monitoring is an important component of this watershed management plan. Without monitoring, stakeholders will not know when or whether they have achieved their goals; or worse, they will not make timely refinements to their actions to ensure the actions they are taking will achieve their goals. The MEASURING SUCCESS Section details how stakeholders will monitor their progress toward achieving the goals set in this watershed management plan. Plan Revisions: This watershed management plan is meant to be a living document. Revisions and updates to the plan will be necessary as stakeholders begin to implement the plan and as other stakeholders become more active in implementing the plan. The PHJC will be responsible for holding and revising the Flat Lake Watershed Management Plan as appropriate based on stakeholder feedback. To assist with record keeping and to ensure action items outlined in the plan are being completed, stakeholders should complete the simple Action Register form provided in Appendix L. This form should be returned to the PHJC. The PHJC will keep completed action registers in three ring binder and review action register s to ensure tasks are being completed. The forms will also help document the success of actions taken in the watershed.
JFNew File #99-08-24L/01 Page 75
Flat Lake Watershed Management Plan June 11, 2003 Marshall County, Indiana
7.0 LITERATURE CITED Bannerman, R.T., D.W. Owens, R.B. Dodds, and N.J. Hornewer. 1993. Sources of Pollutants in
Wisconsin Stormwater. Water Science Technology. 28(3-5):241-259. Madison, Wisconsin. Carlson, R.E. 1977. A trophic state index for lakes. Limnology and Oceanography, 22(2):361-
369. Claytor, R. A. and T.R. Schueler. 1996. Design of Stormwater Filter Systems. Center for
Watershed Protection, Ellicott City, Maryland. Clean Lakes Program. 2002. File data: 1990, 1995, 1999. School of Public and Environmental
Affairs, Indiana University, Bloomington, Indiana. Clean Lakes Program Volunteer Monitoring Program. 2002. File data (1990-1993). School of
Public and Environmental Affairs, Indiana University, Bloomington, Indiana. Baird, M. Unpublished. Ancilla Domini Land Design: 2002. Poor Handmaids of Jesus Christ,
Ancilla Domini, Donaldson, Indiana. Bean, W.F. Undated. Management Plan for Menominee Wetland Conservation Area. Indiana
Department of Natural Resources. Indianapolis, Indiana. Conservation Technology Information Center. Conservation Buffer Facts. [web page] No date.
http://www.ctic.purdue.edu/core4/buffer/bufferfact.html. [Accessed March 3, 2000] Deam, C.C. 1921. Trees of Indiana. Department of Conservation. Indianapolis, Indiana. Dodd, W. K., J.R. Jones, and E. B. Welch. 1998. Suggested classification of stream trophic state:
Distributions of temperate stream types by chlorophyll, total nitrogen, and phosphorus. Wat. Res. 32:1455-1462.
Historic Landmarks Foundation of Indiana. 1990. Marshall County: Interim Report Historic Sites
and Structures Inventory. Indianapolis, Indiana. Homoya, M.A., B.D. Abrell, J.R. Aldrich, and T.W. Post. 1985. The Natural Regions of Indiana.
Indiana Academy of Science. Vol. 94. Indiana Natural Heritage Program. Indiana Department of Natural Resources, Indianapolis, Indiana.
Indiana Department of Environmental Management. 1990. Macroinvertebrate sampling data
files. Indiana Department of Environmental Management. 1996. Indiana 305(b) Report 1994-1995.
Office of Water Quality, Indianapolis, Indiana.
JFNew File #99-08-24L/01 Page 76
Flat Lake Watershed Management Plan June 11, 2003 Marshall County, Indiana
Indiana Department of Environmental Management. 1999. Unified Watershed Assessment. Division of Water. Indianapolis, Indiana.
Indiana Department of Environmental Management. 2001. Kankakee River Watershed
Restoration Action Strategy. Office of Water Quality, Indianapolis, Indiana. Indiana Department of Natural Resources. 1990. Water Resources Availability in the Kankakee
River Basin, Indiana. Division of Water. Indianapolis, Indiana. Indiana Department of Natural Resources. 1997. Preliminary Study of Galbraith Lake (Gilbert),
Marshall County, Indiana. Indiana Department of Natural Resources, Lake and River Enhancement Program. Indianapolis, Indiana.
Indiana State Board of Health. 1975. Indiana Department of Environmental Management data
files. Jones, W. 1996. Indiana Lake Water Quality Update for 1989-1993. Indiana Department of
Environmental Management, Clean Lakes Program, Indianapolis, Indiana. Jones, D.D. and J.E. Yahner. 1994. Operating and Maintaining the Home Septic System. Purdue
University Cooperative Extension Service. ID-142. Metropolitan Washington Council of Governments. 1992. Design of Stormwater Wetland
Systems: Guidance for Creating Diverse and Effective Stormwater Wetland Systems in the Mid-Atlantic Region. Anacostia Restoration Team, Department of Environmental Programs, Metropolitan Washington Council of Governments, Washington, D.C.
National Climatic Data Center. 1976. Climatography of the United States. No.60. Ohio EPA. 1999. Association between nutrients, habitat, and aquatic biota in Ohio rivers and
streams. Ohio EPA Technical Bulletin MAS/1999-1-1, Columbus. Olem, H. and G. Flock, eds. 1990. Lake and reservoir restoration guidance manual. 2nd edition.
EPA 440/4-90-006. Prepared by North American Lake Management Society for U.S. Environmental Protection Agency, Washington, D.C.
Omernik, J.M. and A.L. Gallant. 1988. Ecoregions of the Upper Midwest States. U. S.
Environmental Protection Agency, Corvallis, Oregon. EPA/600/3-88/037. Petty, R.O. and M.T. Jackson. Plant communities. In: Lindsey, A.A. (ed.) Natural Features of
Indiana. Indiana Academy of Science, Indiana State Library, Indianapolis, Indiana, p. 264-296.
Purdue Applied Meteorology Group. 2003. Department of Agronomy. Indiana Climate Page.
[web page] No date. http://shadow.agry.purdue.edu/sc.index.html [Accessed January 12, 2003]
JFNew File #99-08-24L/01 Page 77

Flat Lake Watershed Management Plan June 11, 2003 Marshall County, Indiana
Robertson, B. 1970. Gilbert Lake, Fish Management Report. Indiana Department of Natural
Resources. Indianapolis, Indiana. Robertson, B. 1971. Flat (Mud) Lake, Fish Management Report. Indiana Department of Natural
Resources. Indianapolis, Indiana. Robertson, B. 1974. Gilbert Lake, Fish Management Report. Indiana Department of Natural
Resources. Indianapolis, Indiana. Robertson, B. 1975. Gilbert Lake, Fish Management Report. Indiana Department of Natural
Resources. Indianapolis, Indiana. Robertson, B. 1977. Flat (Mud) Lake, Fish Management Report. Indiana Department of Natural
Resources. Indianapolis, Indiana. Robertson, B. 1977. Gilbert Lake, Fish Management Report. Indiana Department of Natural
Resources. Indianapolis, Indiana. Robertson, B. 1979. Gilbert Lake, Fish Management Report. Indiana Department of Natural
Resources. Indianapolis, Indiana. Robertson, B. 1980. Flat (Mud) Lake, Fish Management Report. Indiana Department of Natural
Resources. Indianapolis, Indiana. Robertson, B. 1980. Gilbert Lake, Fish Management Report. Indiana Department of Natural
Resources. Indianapolis, Indiana. Robertson, B. 1991. Gilbert Lake, Fish Management Report. Indiana Department of Natural
Resources. Indianapolis, Indiana. Smallwood, B. 1980. Soil Survey of Marshall County. United States Department of Agriculture,
Soil Conservation Service in cooperation with Purdue University, Agriculture Experiment Station and Indiana Department of Natural Resources, Soil and Water Conservation Committee.
Swink, F. and G. Wilhelm. 1994. plants of the Chicago Region. 4th edition. Indiana Academy of
Science, Indianapolis, Indiana. Thomas, J.A. 1996. Soil Characteristics of “Buttermilk Ridge” Wabash Moraine, Wells County
Indiana. Notes for the IU/PU (Ft. Wayne) Soils Course: Characteristics of Fine-Grained Soils and Glacial Deposits in Northeastern Indiana for On-Site Wastewater Disposal Systems.
United States Environmental Protection Agency. 2000. Ambient Water Quality Criteria
Recommendations. Information Supporting the Development of State and Tribal Nutrient Criteria. Rivers and Streams in Nutrient Ecoregions VI. EPA 822-B-00-017.
JFNew File #99-08-24L/01 Page 78

Flat Lake Watershed Management Plan June 11, 2003 Marshall County, Indiana
JFNew File #99-08-24L/01 Page 79
Wayne, W.J. 1966. Ice and Land: a Review of the Tertiary and Pleistocene History of Indiana. In: Lindsey, A.A. (ed.) Natural Features of Indiana. Indiana Academy of Science, Indiana State Library, Indianapolis, Indiana, p. 21-39.
Winer, R. 2000. National Pollutant Removal Database for Stormwater Treatment Practices, 2nd
Edition. Center for Watershed Protection, Ellicott City, Maryland.