Embed Size (px)
Citation preview
Fletcher School, Tufts University
Greece and the Euro: A Mundellian Tragedy
George Alogoskoufis
Presentation at the Tufts/LSE Conference Greece and the Euro: From Crisis to Recovery, April 12, 2019
George Alogoskoufis, Greece and the Euro, A Reality Check, December 2018
Introduction and SummaryThis paper analyzes the process of destabilization, crisis and adjustment in the Greek economy since the accession of the country to the European Union and, subsequently, the euro area.
It reviews four policy cycles of the past 40 years, the four acts of the Greek tragedy, and discusses alternative ways forward, following the sudden stop and the great depression of the 2010s.
It concludes that despite the significant constraints implied by continued participation in the euro area, namely a stark Mundellian conflict between internal and external balance, exiting the euro area risks further destabilizing the economy and bringing about a return of the problems of the 1980s.
The current challenge for Greece is to seek to remain in the euro area and adopt a policy mix based on supply side reforms, which would allow for a sustained recovery without the reemergence of external imbalances.
!2
George Alogoskoufis, Greece and the Euro: A Reality Check, December 2018
1. Four Cycles of Economic Policy
!3
George Alogoskoufis, Greece and the Euro: A Reality Check, December 2018
1. EC Accession and Economic Destabilization in the 1980s
Greece joined the European Economic Community (EEC) in 1981, much earlier than the other economies of the southern periphery, such as Spain and Portugal. However, the macroeconomic policy that it adopted after accession soon set it apart from the rest of the EEC.
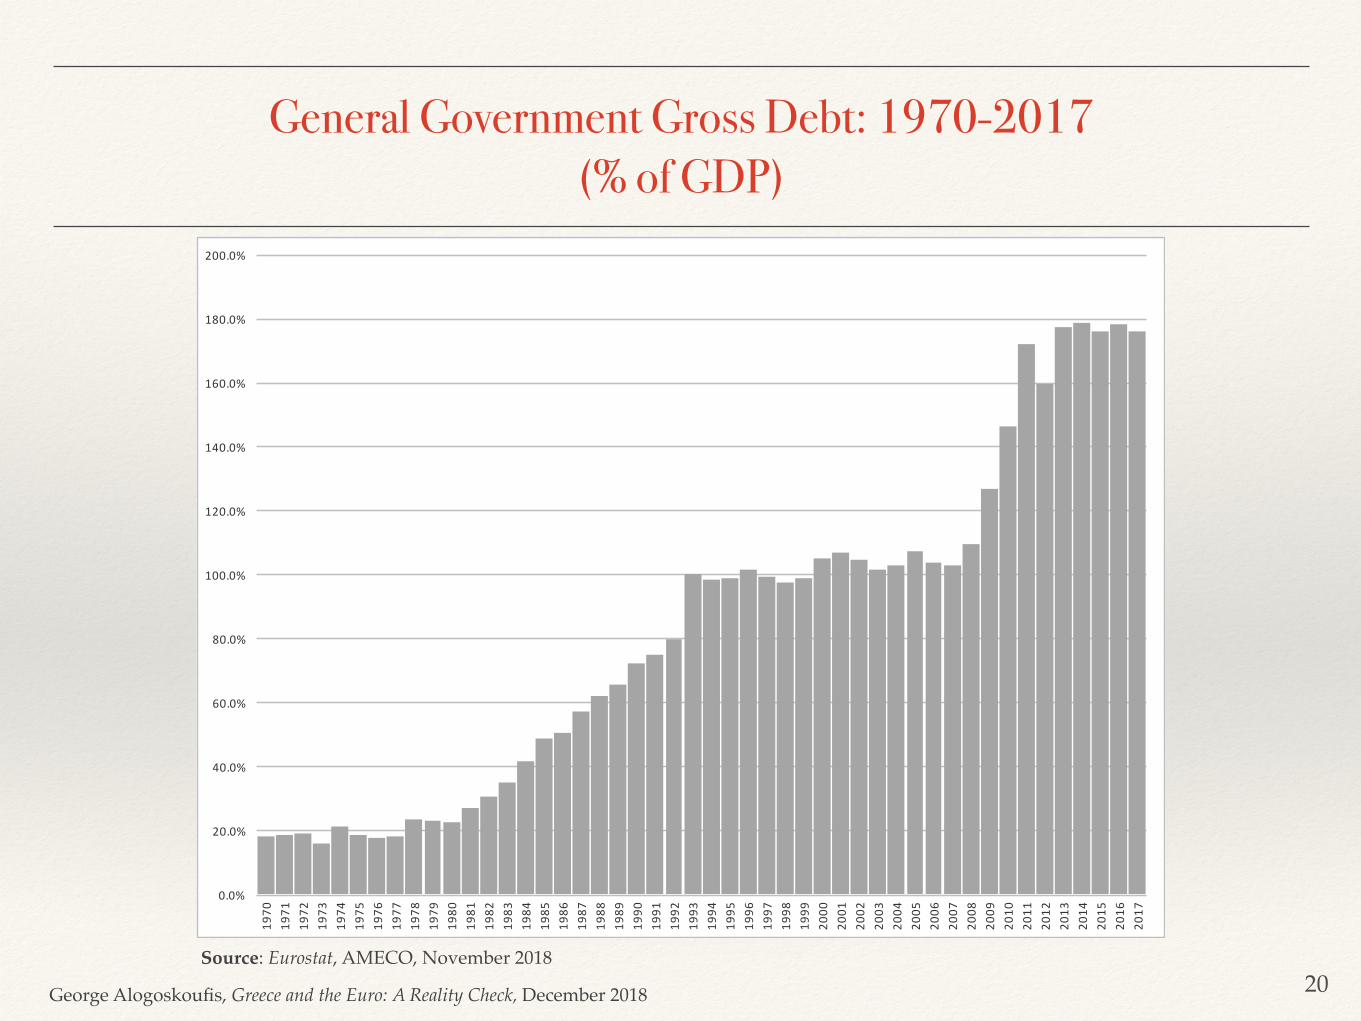
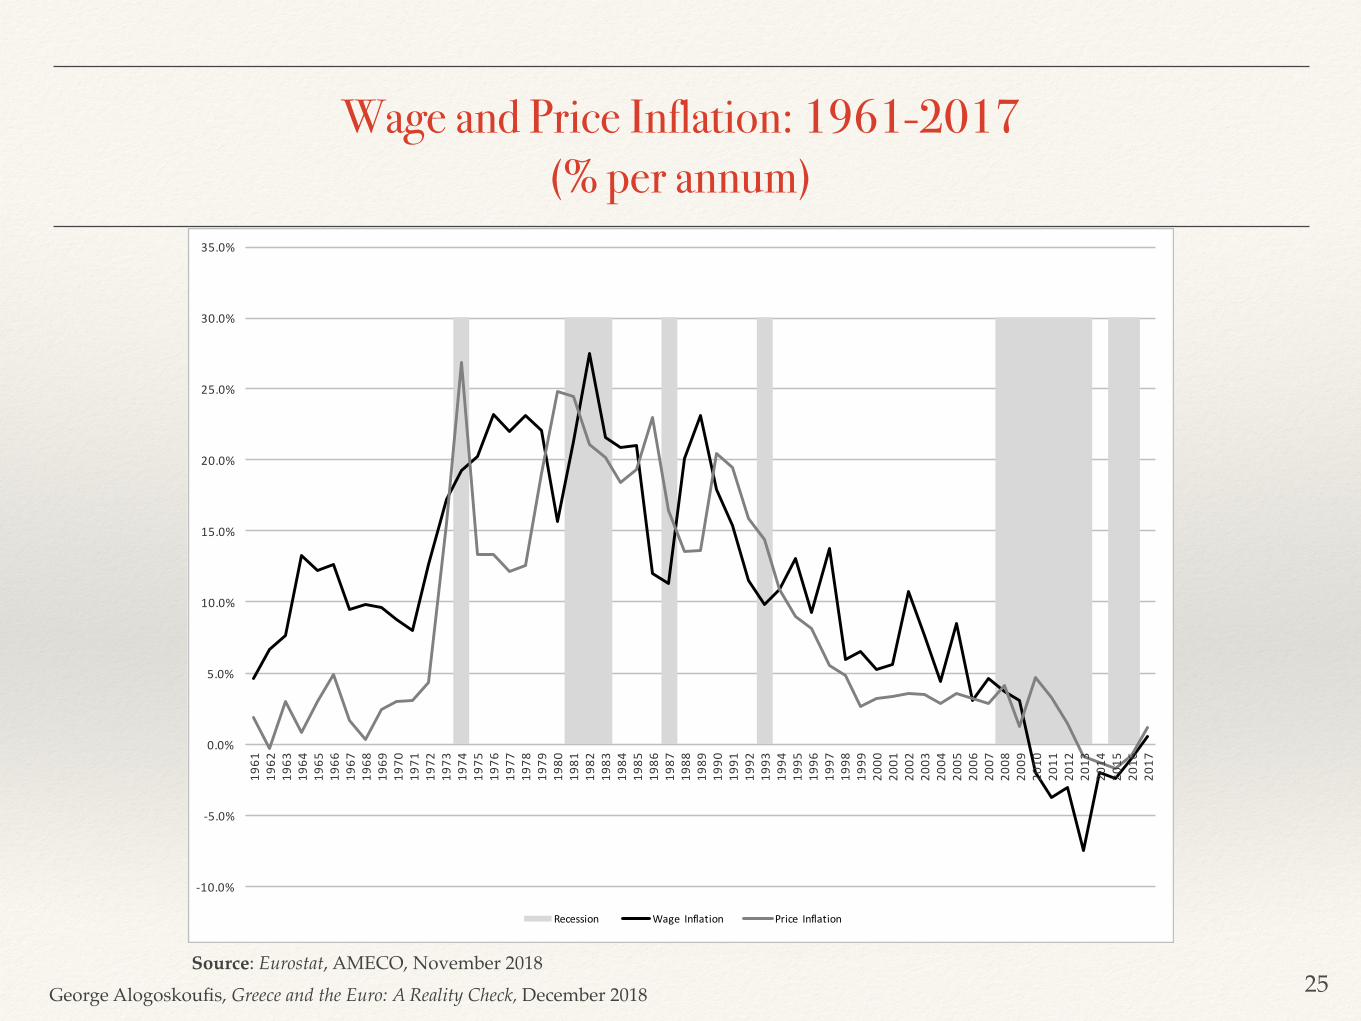
In the 1980s, a decade of fiscal and monetary tightening for the rest of the Community, Greece engaged in an unprecedented fiscal and monetary expansion, which resulted in the rapid accumulation of a huge government debt and an average annual inflation rate in excess of 20%.
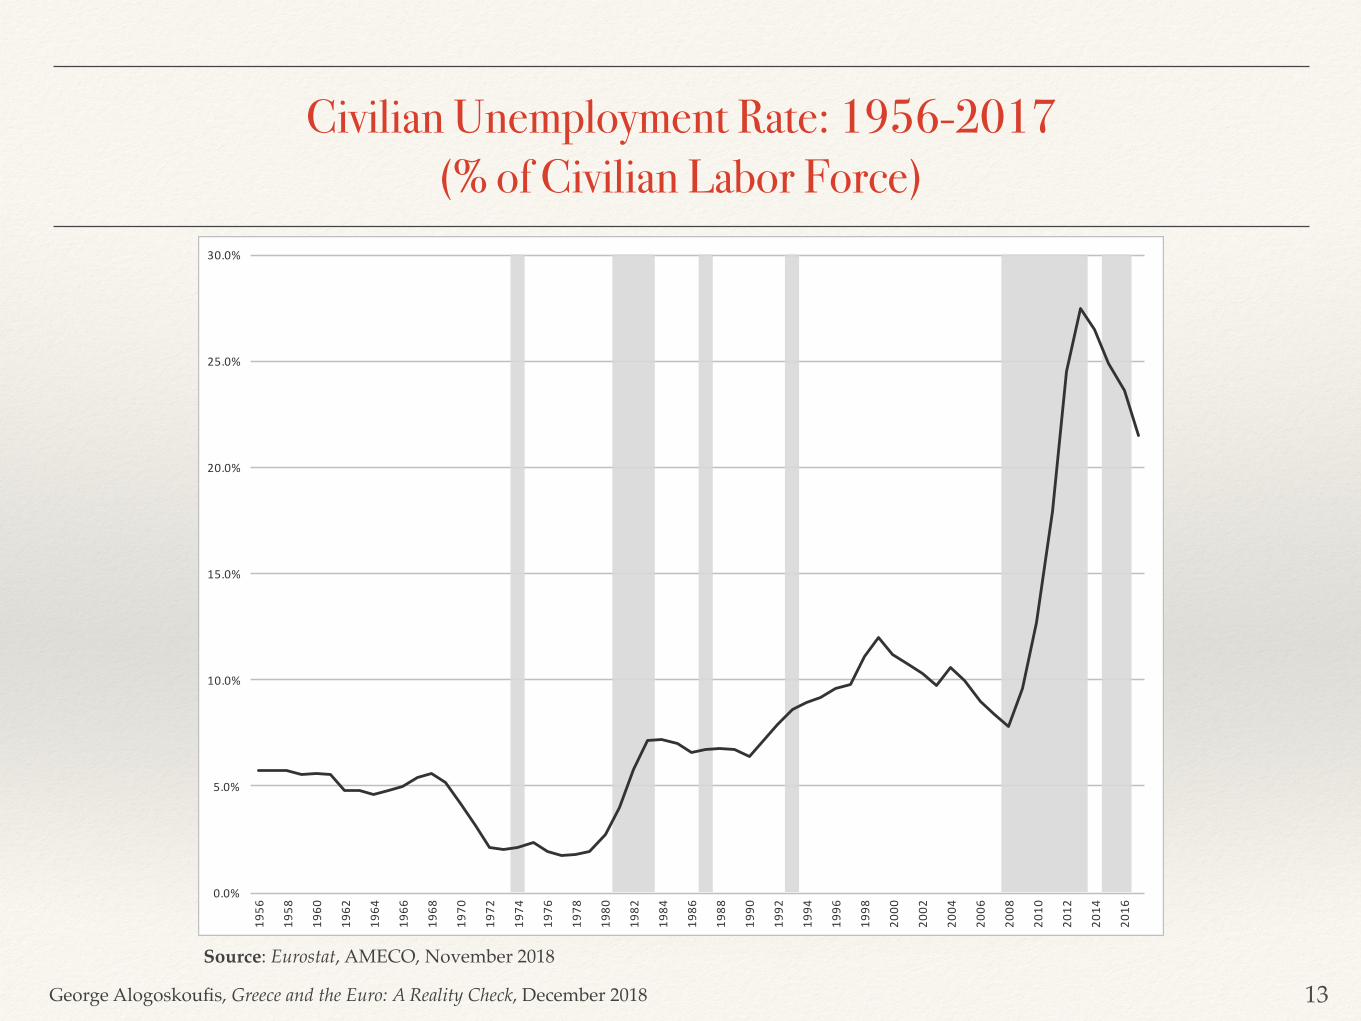
As a result the unemployment rate more than doubled and Greece also faced periodic balance of payments crises.
!4
George Alogoskoufis, Greece and the Euro: A Reality Check, December 2018
2. The Lopsided Convergence of the 1990s
During the 1990s Greece attempted to change course and adapt to the nominal convergence requirements of the Maastricht Treaty on European Union.
However, it did so half-heartedly, as the policy mix that it adopted was lopsided.
With the exception of the first part of the decade, the adjustment was primarily based on monetary rather than fiscal tightening, while structural reforms were few and in between.
Greece managed to eventually approach the nominal convergence criteria of the Maastricht Treaty and become part of the euro area (EA) in 2001, two years after the original eleven members.
However, as the adjustment was primarily based on monetary and not fiscal tightening, the problems of low international competitiveness and fiscal fragility were not addressed.
!5
George Alogoskoufis, Greece and the Euro: A Reality Check, December 2018
3. Economic Euphoria and the Mundellian Trap of the 2000s
From the moment that Greece became a member of the euro area it enjoyed a significant economic boom.
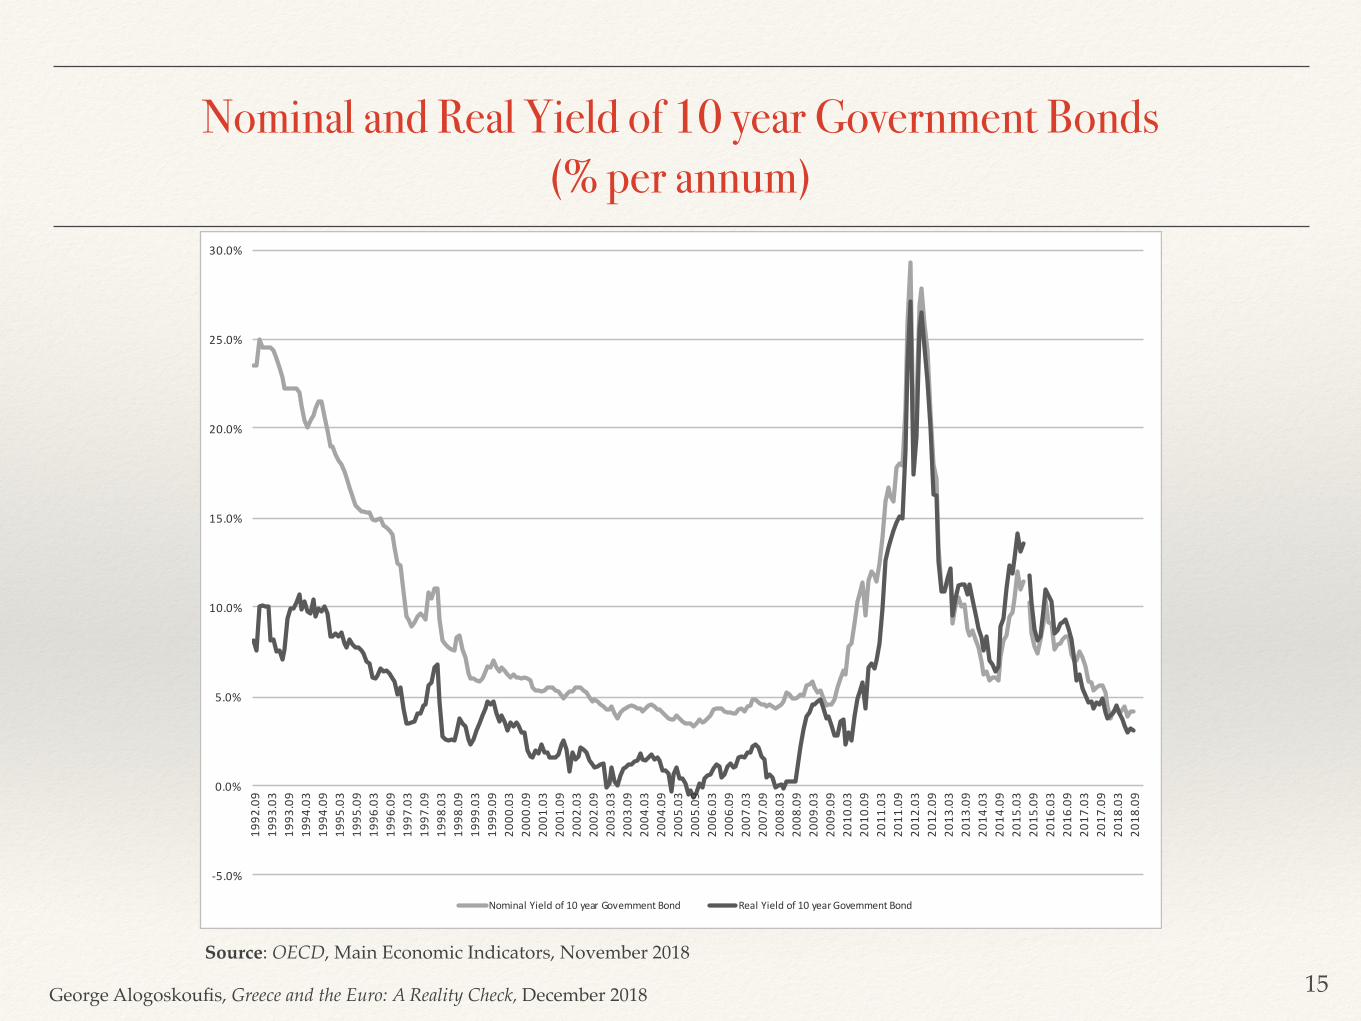
This was mainly due to the rapid reduction in real interest rates following the elimination of the devaluation premium. The reduction in real interest rates boosted both investment and private consumption, as it discouraged private savings. As if this was not enough, the boom was reinforced by another round of fiscal expansion and wage increases in excess of productivity, which started immediately after entry to the euro area, and which further boosted aggregate demand.
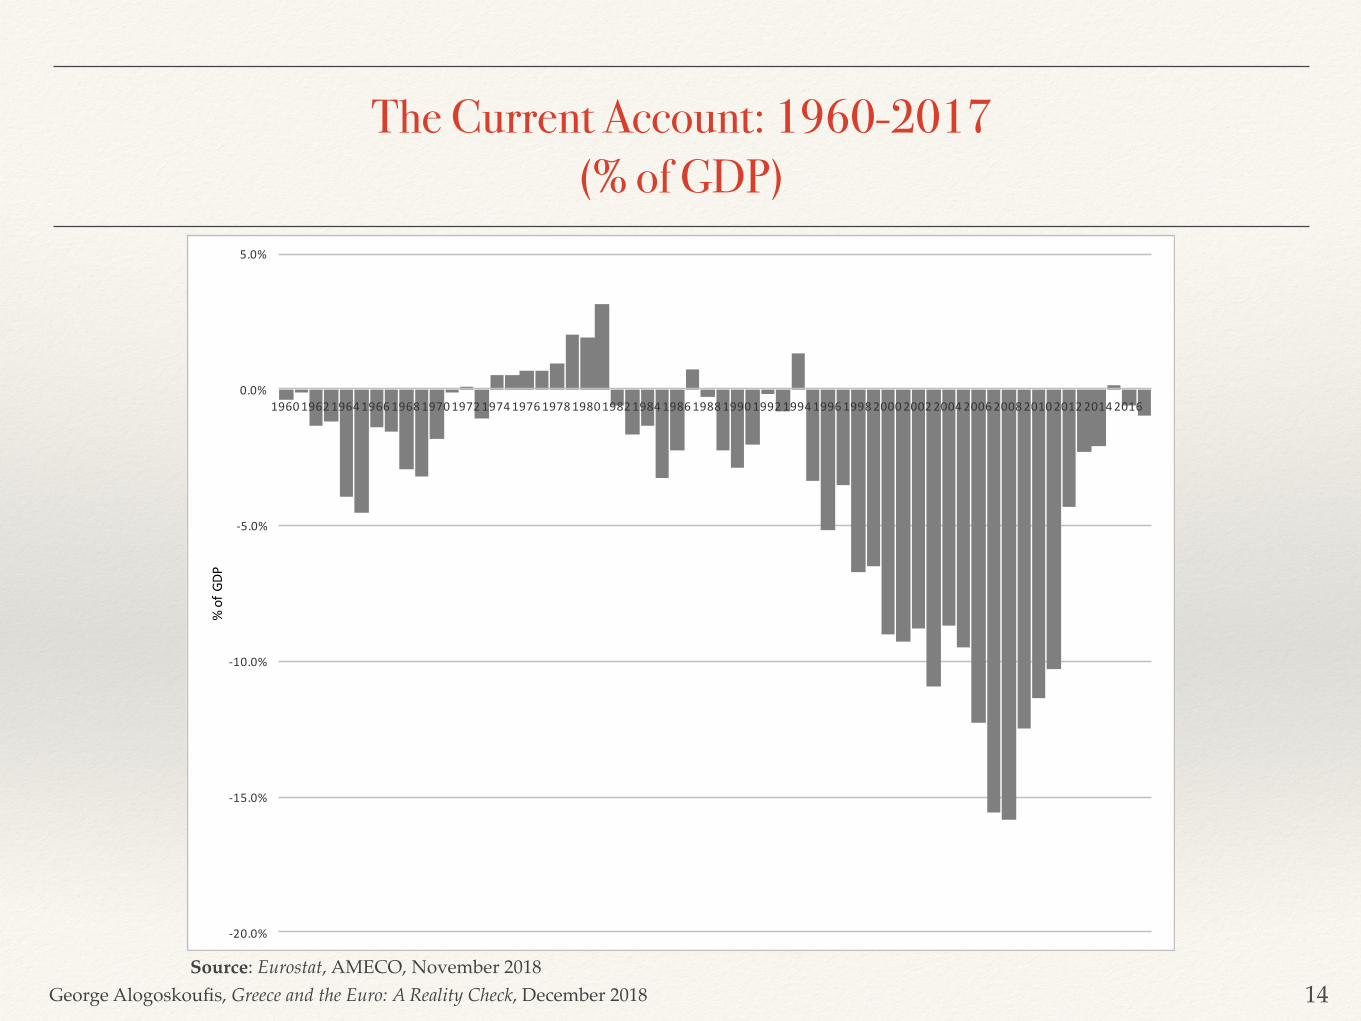
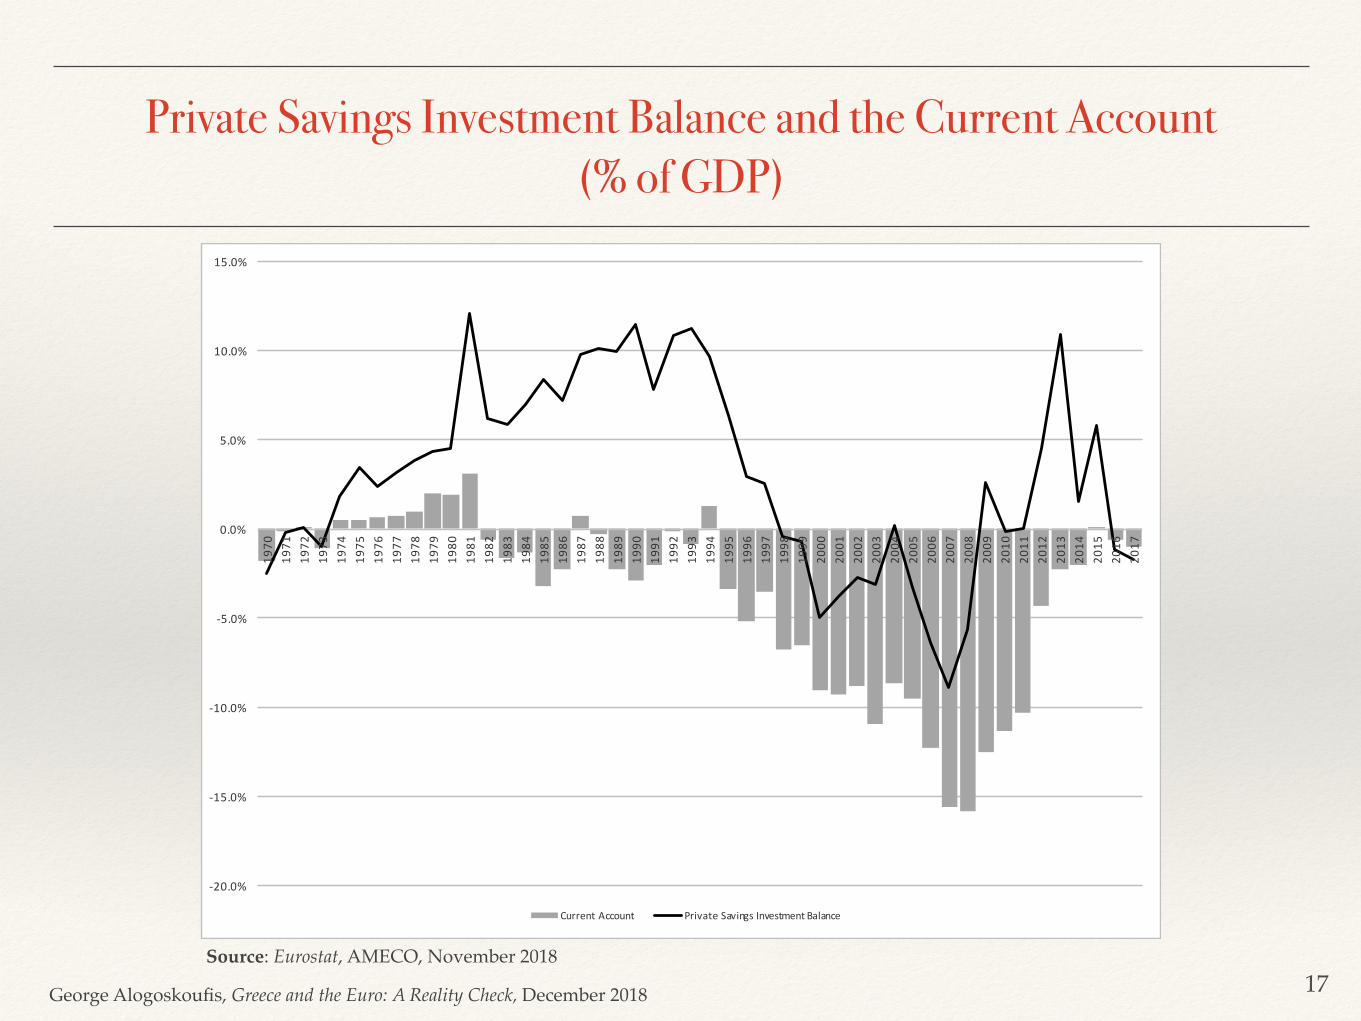
As the boom and the savings-investment imbalance also implied a significant deterioration in Greece’s current account and an unprecedented accumulation of external debt, Greece was caught in a Mundellian trap.
Fiscal tightening in order to deal with external imbalances would kill the boom, while fiscal relaxation maintained the boom at the expense of unprecedented external imbalances.
Having entered the euro area with low international competitiveness, and given up the option of using an appropriate monetary and exchange rate policy to simultaneously address both problems through a devaluation, Greece saw its external imbalances worsen much more than in other economies of the euro area periphery.
!6
George Alogoskoufis, Greece and the Euro: A Reality Check, December 2018
The Nature of the Mundellian TrapThe conflict between internal and external balance, characteristic of economies with low international competitiveness which operate under fixed exchange rates and free capital mobility, has been the main problem of Greece since it entered the euro area. The option of a one-off devaluation, which exists in regimes of fixed but adjustable exchange rates, does not exist in a single currency regime such as the EA. Hence, the only remaining instrument for stabilizing the economy is fiscal policy.
However, under fixed exchange rates and free capital mobility, fiscal policy cannot solve the problem of the conflict between internal and external balance, even in the short run. According to the Mundell-Fleming model, the most widely accepted short-term analytical model of international macroeconomics, under free international capital mobility, a fiscal expansion results in an increase in aggregate domestic demand, causing an increase in GDP growth and a reduction of unemployment, but it also results in a widening of the current account deficit. On the other hand, a fiscal contraction leads to a reduction in the current account deficit, but to the detriment of growth and employment, by reducing domestic demand and creating a recession.
!7
George Alogoskoufis, Greece and the Euro: A Reality Check, December 2018
4. The Crisis and the Adjustment Programs of the 2010s
The international financial crisis of 2008-09 provided the spark to international investors for the reassessment of Greece’s ability to service the external debt that had been accumulating during the previous ten years. The sudden stop in international lending occurred in 2010, in the aftermath of the deep recession of 2009 that led to the deterioration of both fiscal and external imbalances.
The adjustment programs that were adopted in the aftermath of the 2010 crisis was a hastily designed program of steep fiscal consolidation, reductions in nominal wages and a catalog of structural reforms. The Mundellian dilemma was resolved in favor of external balance and a deepening of the recession.
As a result of this policy shift, there was a disastrous recession for the Greek economy, where each percentage point of improvement in the current account in relation to GDP would cost about two and a half percentage points of GDP in terms of the decline in total domestic output, and around one and half percentage points of the labor force, in terms of the rise in unemployment. Thus, the cost in terms of lost output and jobs has been exorbitant.
!8
George Alogoskoufis, Greece and the Euro: A Reality Check, December 2018
2. Main Economic and Political Developments since EC Accession
!9
George Alogoskoufis, Greece and the Euro: A Reality Check, December 2018
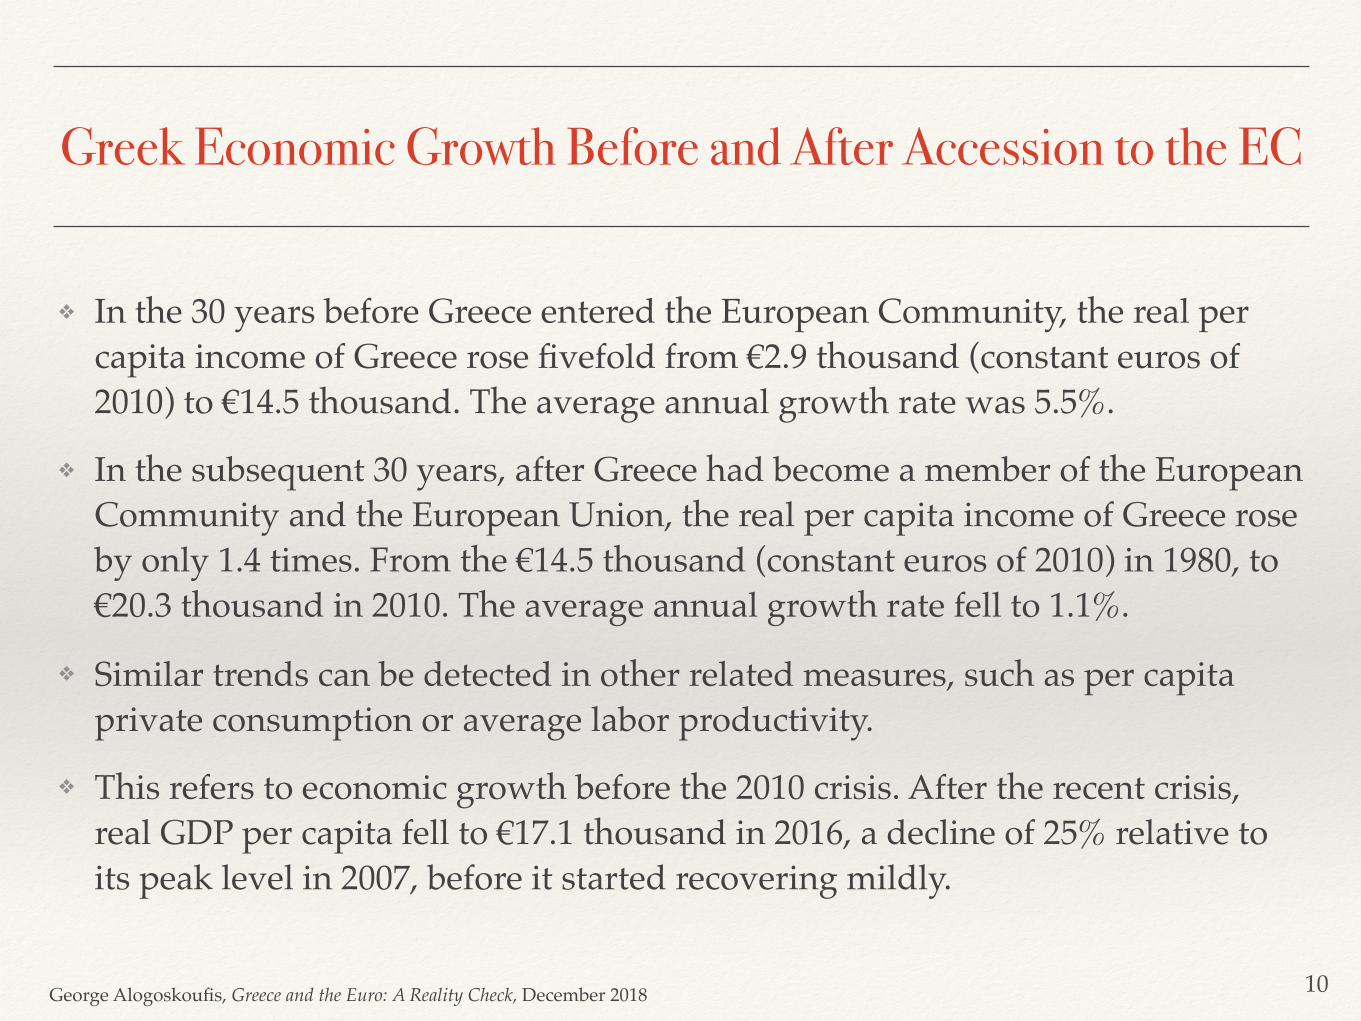
Greek Economic Growth Before and After Accession to the EC
❖ In the 30 years before Greece entered the European Community, the real per capita income of Greece rose fivefold from €2.9 thousand (constant euros of 2010) to €14.5 thousand. The average annual growth rate was 5.5%.
❖ In the subsequent 30 years, after Greece had become a member of the European Community and the European Union, the real per capita income of Greece rose by only 1.4 times. From the €14.5 thousand (constant euros of 2010) in 1980, to €20.3 thousand in 2010. The average annual growth rate fell to 1.1%.
❖ Similar trends can be detected in other related measures, such as per capita private consumption or average labor productivity.
❖ This refers to economic growth before the 2010 crisis. After the recent crisis, real GDP per capita fell to €17.1 thousand in 2016, a decline of 25% relative to its peak level in 2007, before it started recovering mildly.
!10
George Alogoskoufis, Greece and the Euro: A Reality Check, December 2018
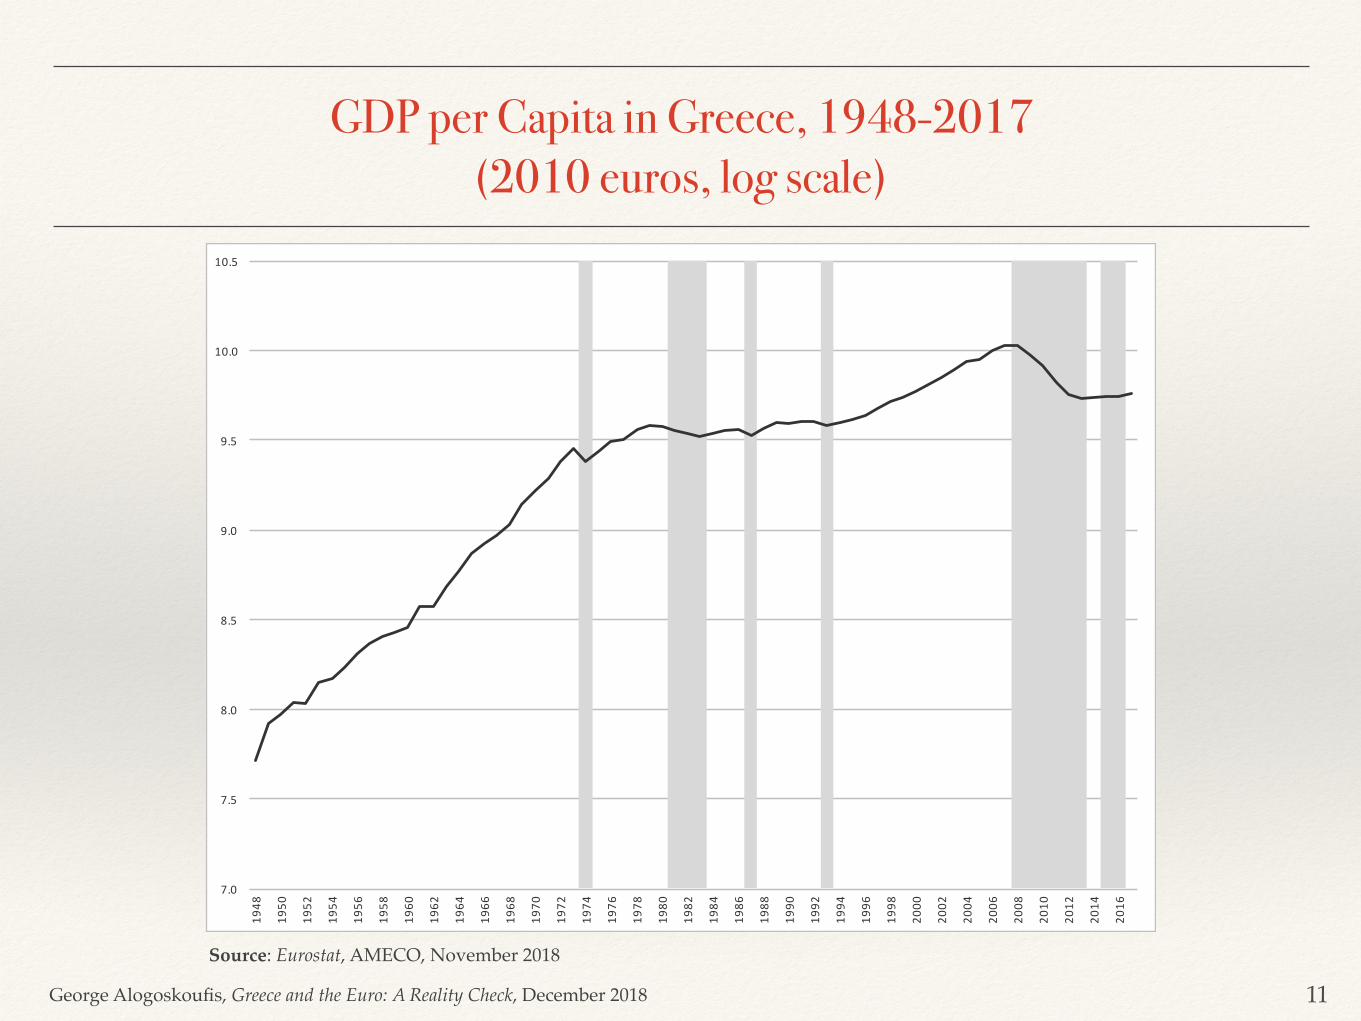
GDP per Capita in Greece, 1948-2017 (2010 euros, log scale)
!11Source: Eurostat, AMECO, November 2018
7.0
7.5
8.0
8.5
9.0
9.5
10.0
10.519
48
1950
1952
1954
1956
1958
1960
1962
1964
1966
1968
1970
1972
1974
1976
1978
1980
1982
1984
1986
1988
1990
1992
1994
1996
1998
2000
2002
2004
2006
2008
2010
2012
2014
2016
George Alogoskoufis, Greece and the Euro: A Reality Check, December 2018
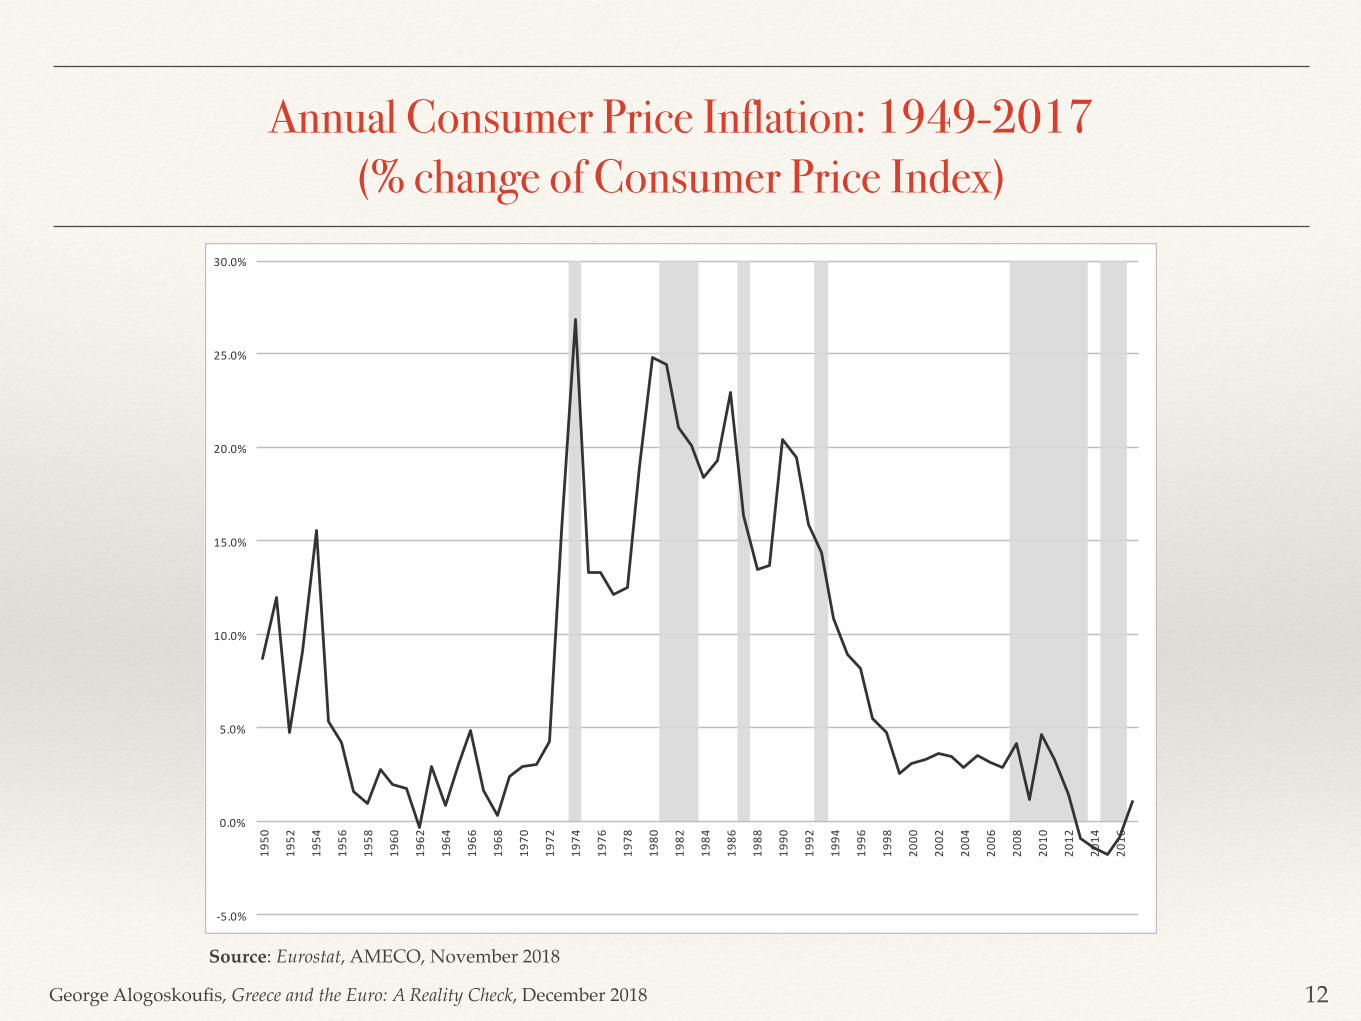
Annual Consumer Price Inflation: 1949-2017 (% change of Consumer Price Index)
!12Source: Eurostat, AMECO, November 2018
-5.0%
0.0%
5.0%
10.0%
15.0%
20.0%
25.0%
30.0%19
50
1952
1954
1956
1958
1960
1962
1964
1966
1968
1970
1972
1974
1976
1978
1980
1982
1984
1986
1988
1990
1992
1994
1996
1998
2000
2002
2004
2006
2008
2010
2012
2014
2016
George Alogoskoufis, Greece and the Euro: A Reality Check, December 2018
Civilian Unemployment Rate: 1956-2017 (% of Civilian Labor Force)
!13Source: Eurostat, AMECO, November 2018
0.0%
5.0%
10.0%
15.0%
20.0%
25.0%
30.0%19
56
1958
1960
1962
1964
1966
1968
1970
1972
1974
1976
1978
1980
1982
1984
1986
1988
1990
1992
1994
1996
1998
2000
2002
2004
2006
2008
2010
2012
2014
2016
George Alogoskoufis, Greece and the Euro: A Reality Check, December 2018
The Current Account: 1960-2017 (% of GDP)
!14Source: Eurostat, AMECO, November 2018
-20.0%
-15.0%
-10.0%
-5.0%
0.0%
5.0%
19601962196419661968197019721974197619781980198219841986198819901992199419961998200020022004200620082010201220142016
%ofG
DP
George Alogoskoufis, Greece and the Euro: A Reality Check, December 2018
Nominal and Real Yield of 10 year Government Bonds (% per annum)
!15Source: OECD, Main Economic Indicators, November 2018
-5.0%
0.0%
5.0%
10.0%
15.0%
20.0%
25.0%
30.0%19
92.09
1993
.03
1993
.09
1994
.03
1994
.09
1995
.03
1995
.09
1996
.03
1996
.09
1997
.03
1997
.09
1998
.03
1998
.09
1999
.03
1999
.09
2000
.03
2000
.09
2001
.03
2001
.09
2002
.03
2002
.09
2003
.03
2003
.09
2004
.03
2004
.09
2005
.03
2005
.09
2006
.03
2006
.09
2007
.03
2007
.09
2008
.03
2008
.09
2009
.03
2009
.09
2010
.03
2010
.09
2011
.03
2011
.09
2012
.03
2012
.09
2013
.03
2013
.09
2014
.03
2014
.09
2015
.03
2015
.09
2016
.03
2016
.09
2017
.03
2017
.09
2018
.03
2018
.09
NominalYieldof10yearGovernmentBond RealYieldof10yearGovernmentBond
George Alogoskoufis, Greece and the Euro: A Reality Check, December 2018
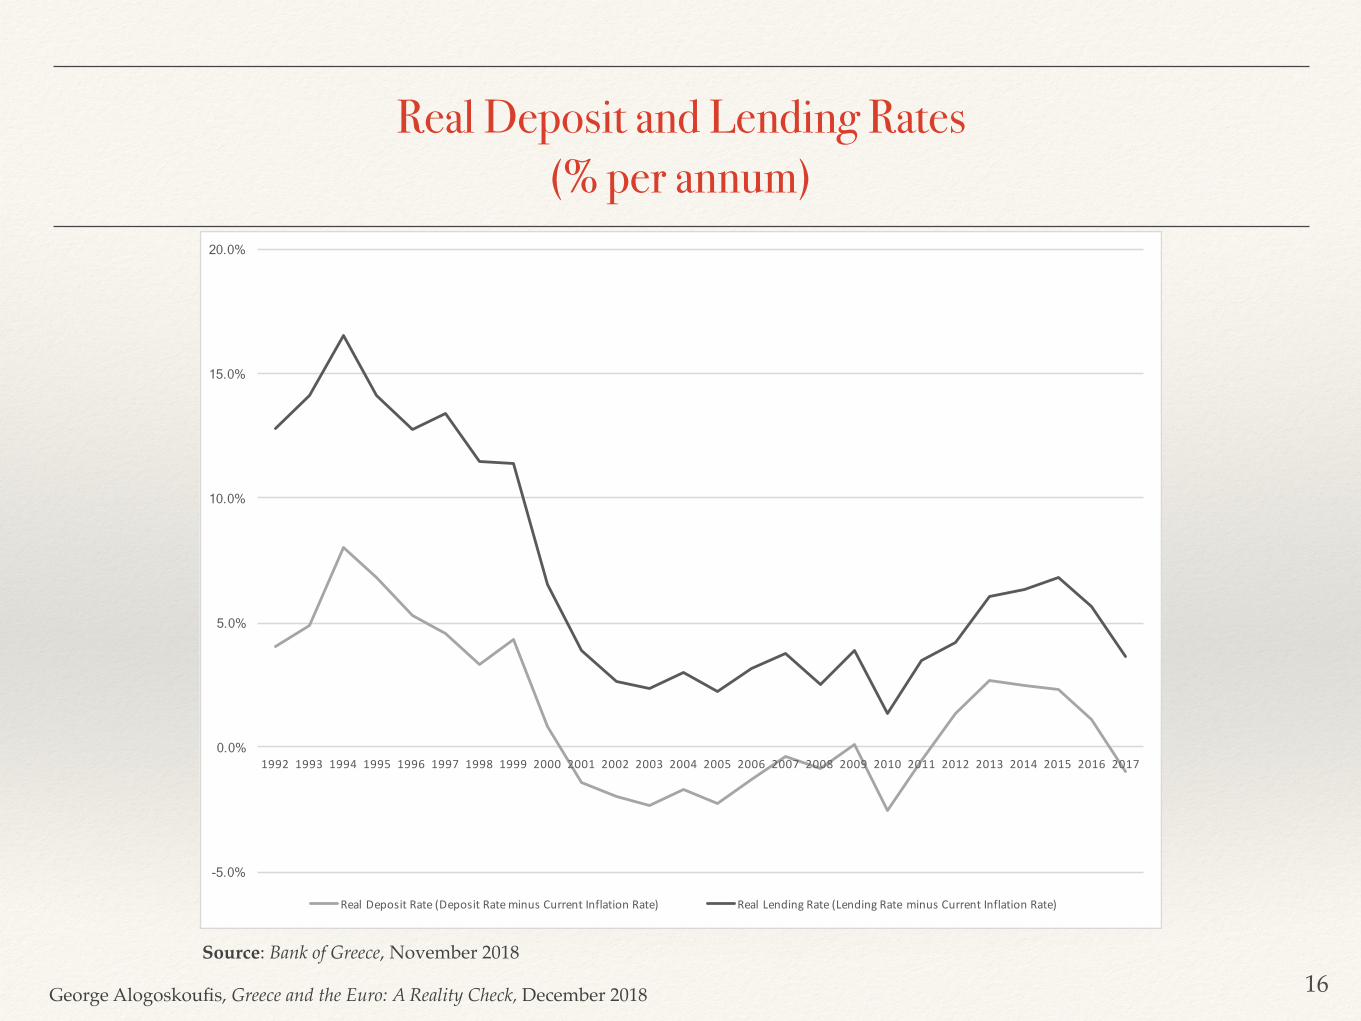
Real Deposit and Lending Rates (% per annum)
!16Source: Bank of Greece, November 2018
-5.0%
0.0%
5.0%
10.0%
15.0%
20.0%
1992 1993 1994 1995 1996 1997 1998 1999 2000 2001 2002 2003 2004 2005 2006 2007 2008 2009 2010 2011 2012 2013 2014 2015 2016 2017
RealDepositRate(DepositRateminusCurrentInflationRate) Real LendingRate(LendingRateminusCurrentInflationRate)
George Alogoskoufis, Greece and the Euro: A Reality Check, December 2018
Private Savings Investment Balance and the Current Account (% of GDP)
!17Source: Eurostat, AMECO, November 2018
-20.0%
-15.0%
-10.0%
-5.0%
0.0%
5.0%
10.0%
15.0%19
7019
7119
7219
7319
7419
7519
7619
7719
7819
7919
8019
8119
8219
8319
8419
8519
8619
8719
8819
8919
9019
9119
9219
9319
9419
9519
9619
9719
9819
9920
0020
0120
0220
0320
0420
0520
0620
0720
0820
0920
1020
1120
1220
1320
1420
1520
1620
17
CurrentAccount PrivateSavingsInvestmentBalance
George Alogoskoufis, Greece and the Euro: A Reality Check, December 2018
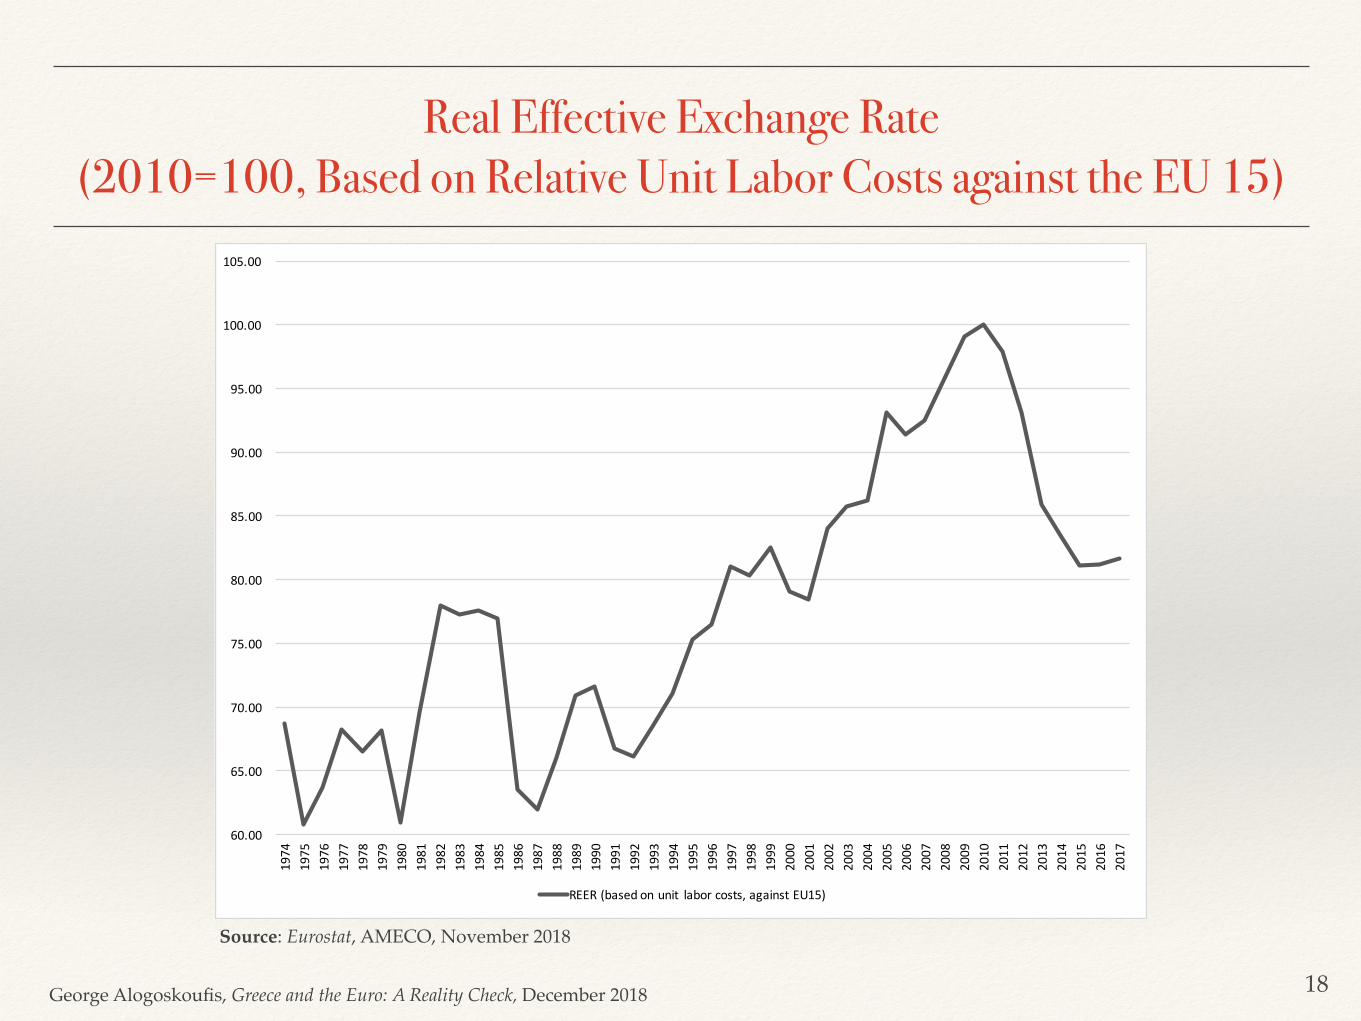
Real Effective Exchange Rate (2010=100, Based on Relative Unit Labor Costs against the EU 15)
!18
Source: Eurostat, AMECO, November 2018
60.00
65.00
70.00
75.00
80.00
85.00
90.00
95.00
100.00
105.00
1974
1975
1976
1977
1978
1979
1980
1981
1982
1983
1984
1985
1986
1987
1988
1989
1990
1991
1992
1993
1994
1995
1996
1997
1998
1999
2000
2001
2002
2003
2004
2005
2006
2007
2008
2009
2010
2011
2012
2013
2014
2015
2016
2017
REER(basedonunit laborcosts,againstEU15)
George Alogoskoufis, Greece and the Euro: A Reality Check, December 2018
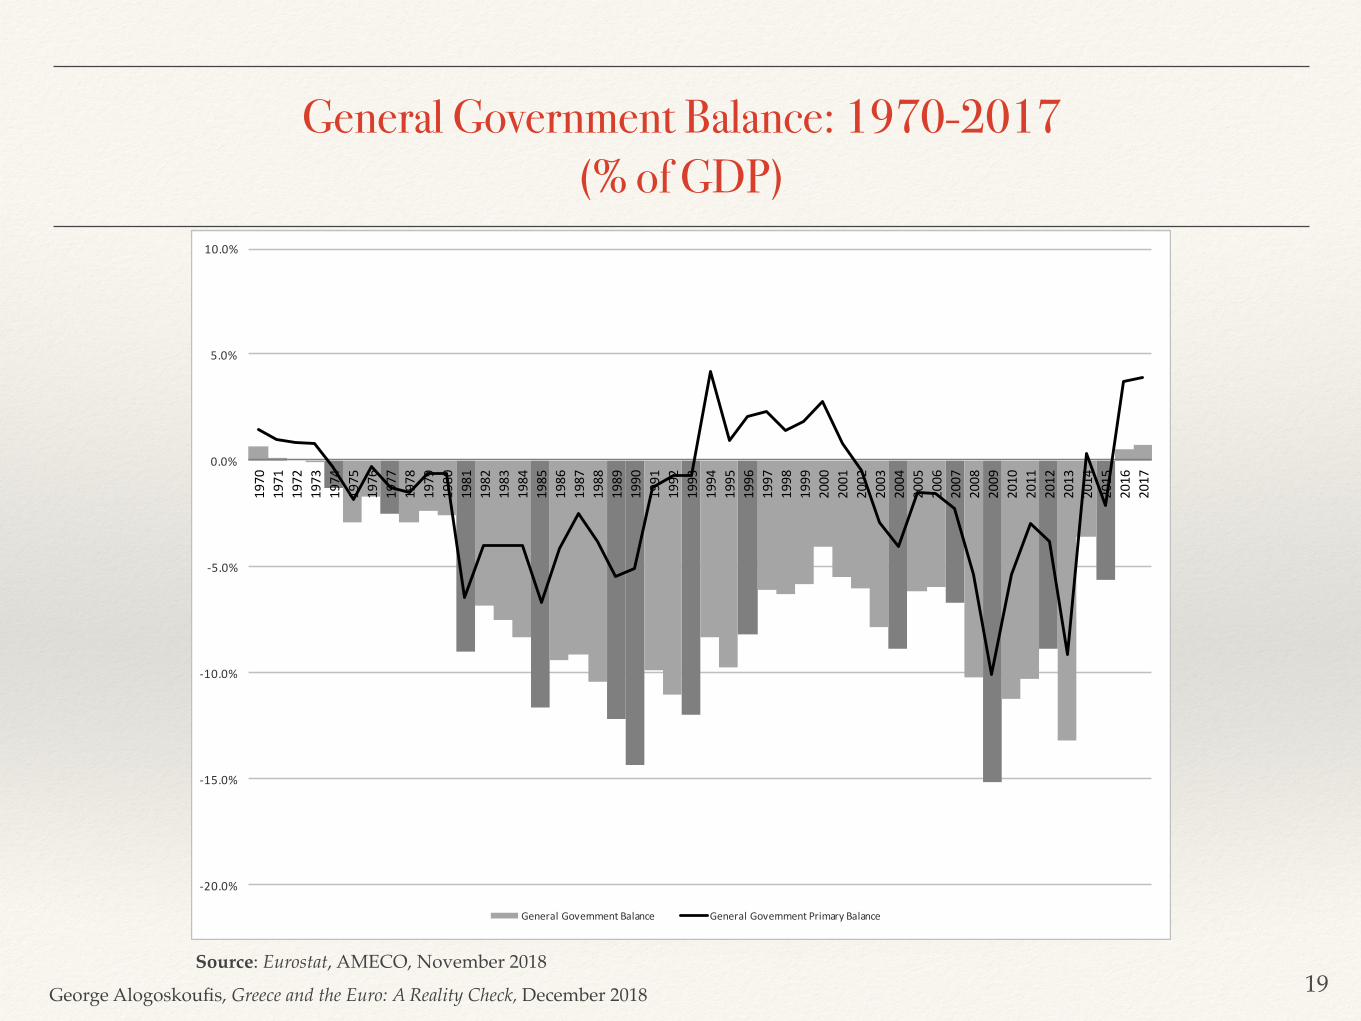
General Government Balance: 1970-2017 (% of GDP)
!19Source: Eurostat, AMECO, November 2018
-20.0%
-15.0%
-10.0%
-5.0%
0.0%
5.0%
10.0%1970
1971
1972
1973
1974
1975
1976
1977
1978
1979
1980
1981
1982
1983
1984
1985
1986
1987
1988
1989
1990
1991
1992
1993
1994
1995
1996
1997
1998
1999
2000
2001
2002
2003
2004
2005
2006
2007
2008
2009
2010
2011
2012
2013
2014
2015
2016
2017
GeneralGovernmentBalance GeneralGovernmentPrimaryBalance
George Alogoskoufis, Greece and the Euro: A Reality Check, December 2018
General Government Gross Debt: 1970-2017 (% of GDP)
!20Source: Eurostat, AMECO, November 2018
0.0%
20.0%
40.0%
60.0%
80.0%
100.0%
120.0%
140.0%
160.0%
180.0%
200.0%19
7019
7119
7219
7319
7419
7519
7619
7719
7819
7919
8019
8119
8219
8319
8419
8519
8619
8719
8819
8919
9019
9119
9219
9319
9419
9519
9619
9719
9819
9920
0020
0120
0220
0320
0420
0520
0620
0720
0820
0920
1020
1120
1220
1320
1420
1520
1620
17
George Alogoskoufis, Greece and the Euro: A Reality Check, December 2018
Is Grexit a Solution or a Return to the Problems of the Past?
Is an orderly exit from the euro area a solution to this Mundellian dilemma for Greece? In my view the answer is a resounding no. “Grexit” could prove catastrophic for Greece.
The first main problem with exiting the euro area is the one associated with the transition. Even a well designed transition to a national currency can prove disorderly and extremely destabilizing. It is one thing to move from a weak currency to a strong currency, as happened in the late 1990s with the creation of the euro area, and another thing to attempt the opposite.
Even if the transition could be managed relatively effectively, which is doubtful, what would happen under a regime of national monetary sovereignty. In all probability, Greece would revert to a regime akin to the policies of the 1980s, with high inflation and a stagnant economy. Such an outcome would be clearly inferior to remaining in the euro area, which at least guarantees low inflation.
For an economy such as Greece’s, which has in the past abused the degrees of freedom afforded to it by monetary sovereignty, trying to escape from the Mundellian trap may mean entering into a stagflationary trap, as happened during the 1980s. Thus, Grexit may prove to be return to the problems of the past, and especially the first act of the Greek tragedy, that of the 1980s, instead of a solution of the current predicament of Greece.
!21
George Alogoskoufis, Greece and the Euro: A Reality Check, December 2018
From Crisis to Recovery within the Euro Area
The main conclusion from this analysis is that, in order for Greece to recover after this great crisis and remain in the euro area, it should adopt a different mix of macroeconomic and structural policies, relative to the past four decades, including the eight year adjustment program of the 2010s.
This new policy mix should be based on supply-side reforms and concentrate on four main priorities:
First, a revenue neutral tax reform, that would encourage savings and investment.
Second, a restoration of the ability of the financial system to use the increased savings in order to finance a recovering economy.
Third, structural reforms that would create opportunities and incentives for foreign direct investment in sectors producing internationally tradable goods and services.
Finally, a reform of the public sector through a shift in emphasis from public production and procurement of goods and services, to public regulation, even in socially sensitive sectors such as health, education, and social security. This would help reduce public expenditure, increase economic efficiency, free up resources for social protection and private investment, and allow Greece to effectively reduce its gigantic public debt.
!22
George Alogoskoufis, Greece and the Euro: A Reality Check, December 2018
3. Additional Graphs
!23
George Alogoskoufis, Greece and the Euro: A Reality Check, December 2018
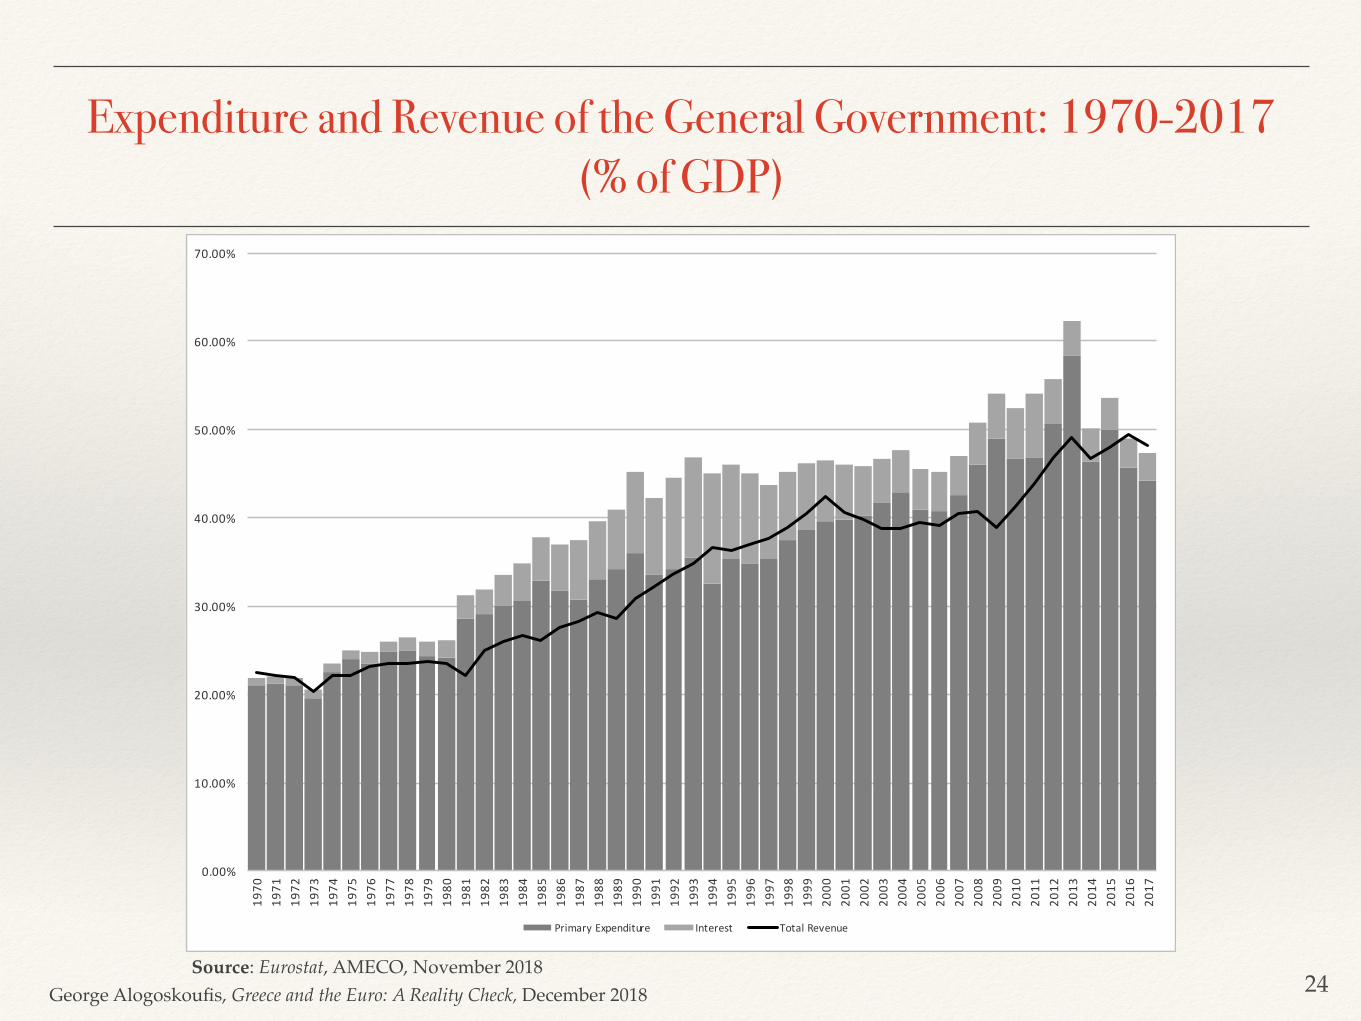
Expenditure and Revenue of the General Government: 1970-2017 (% of GDP)
!24Source: Eurostat, AMECO, November 2018
0.00%
10.00%
20.00%
30.00%
40.00%
50.00%
60.00%
70.00%19
7019
7119
7219
7319
7419
7519
7619
7719
7819
7919
8019
8119
8219
8319
8419
8519
8619
8719
8819
8919
9019
9119
9219
9319
9419
9519
9619
9719
9819
9920
0020
0120
0220
0320
0420
0520
0620
0720
0820
0920
1020
1120
1220
1320
1420
1520
1620
17
PrimaryExpenditure Interest TotalRevenue
George Alogoskoufis, Greece and the Euro: A Reality Check, December 2018
Wage and Price Inflation: 1961-2017 (% per annum)
!25Source: Eurostat, AMECO, November 2018
-10.0%
-5.0%
0.0%
5.0%
10.0%
15.0%
20.0%
25.0%
30.0%
35.0%19
6119
6219
6319
6419
6519
6619
6719
6819
6919
7019
7119
7219
7319
7419
7519
7619
7719
7819
7919
8019
8119
8219
8319
8419
8519
8619
8719
8819
8919
9019
9119
9219
9319
9419
9519
9619
9719
9819
9920
0020
0120
0220
0320
0420
0520
0620
0720
0820
0920
1020
1120
1220
1320
1420
1520
1620
17
Recession Wage Inflation Price Inflation
George Alogoskoufis, Greece and the Euro: A Reality Check, December 2018
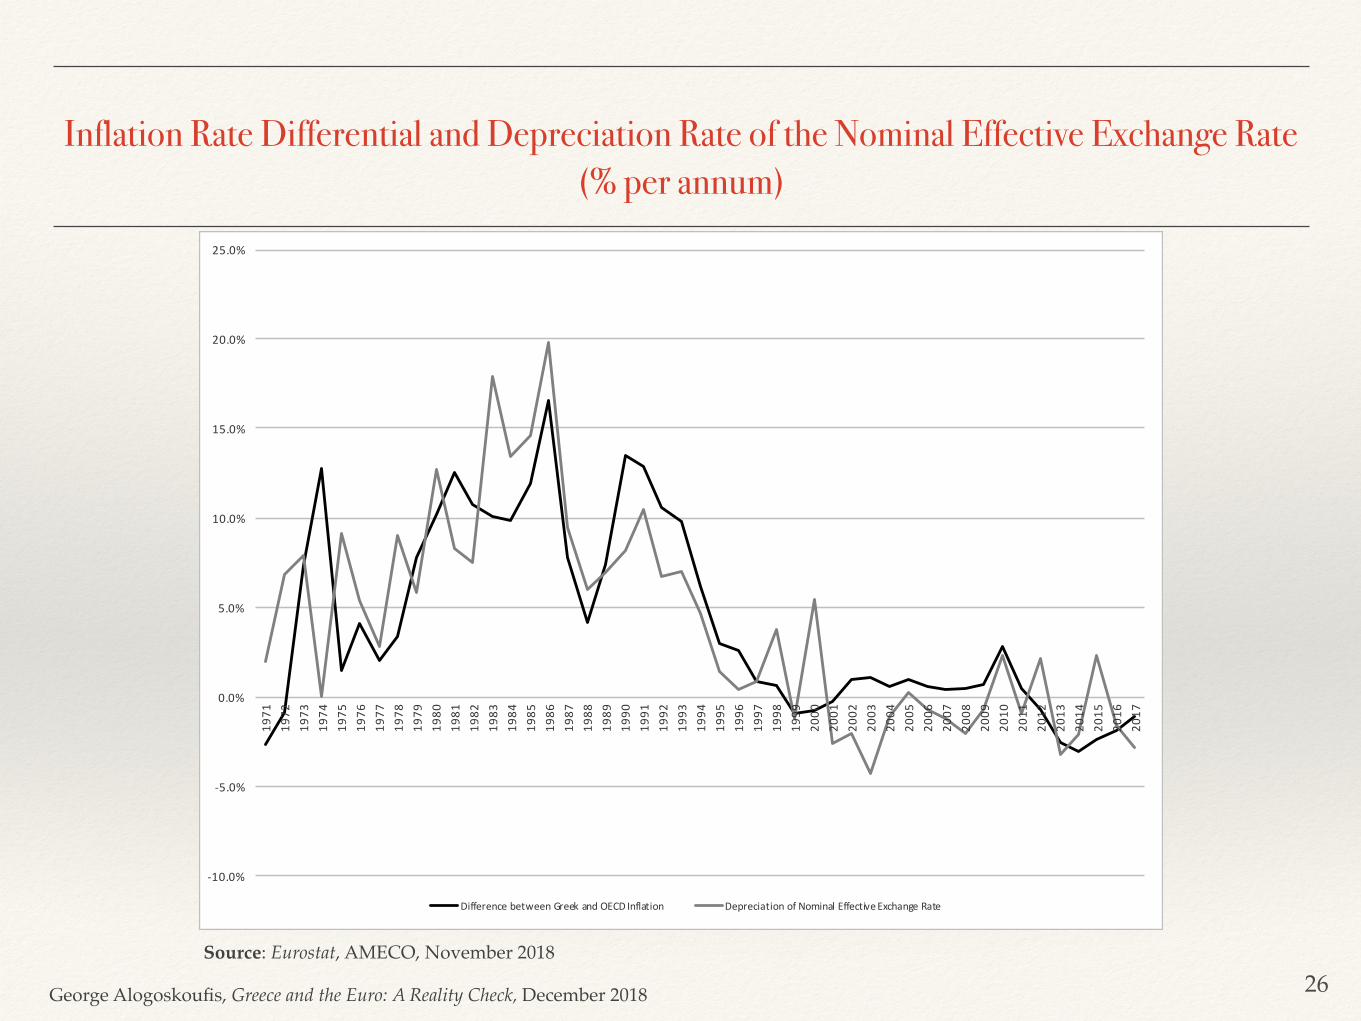
Inflation Rate Differential and Depreciation Rate of the Nominal Effective Exchange Rate (% per annum)
!26Source: Eurostat, AMECO, November 2018
-10.0%
-5.0%
0.0%
5.0%
10.0%
15.0%
20.0%
25.0%19
7119
7219
7319
7419
7519
7619
7719
7819
7919
8019
8119
8219
8319
8419
8519
8619
8719
8819
8919
9019
9119
9219
9319
9419
9519
9619
9719
9819
9920
0020
0120
0220
0320
0420
0520
0620
0720
0820
0920
1020
1120
1220
1320
1420
1520
1620
17
DifferencebetweenGreekandOECDInflation DepreciationofNominalEffectiveExchangeRate
George Alogoskoufis, Greece and the Euro: A Reality Check, December 2018
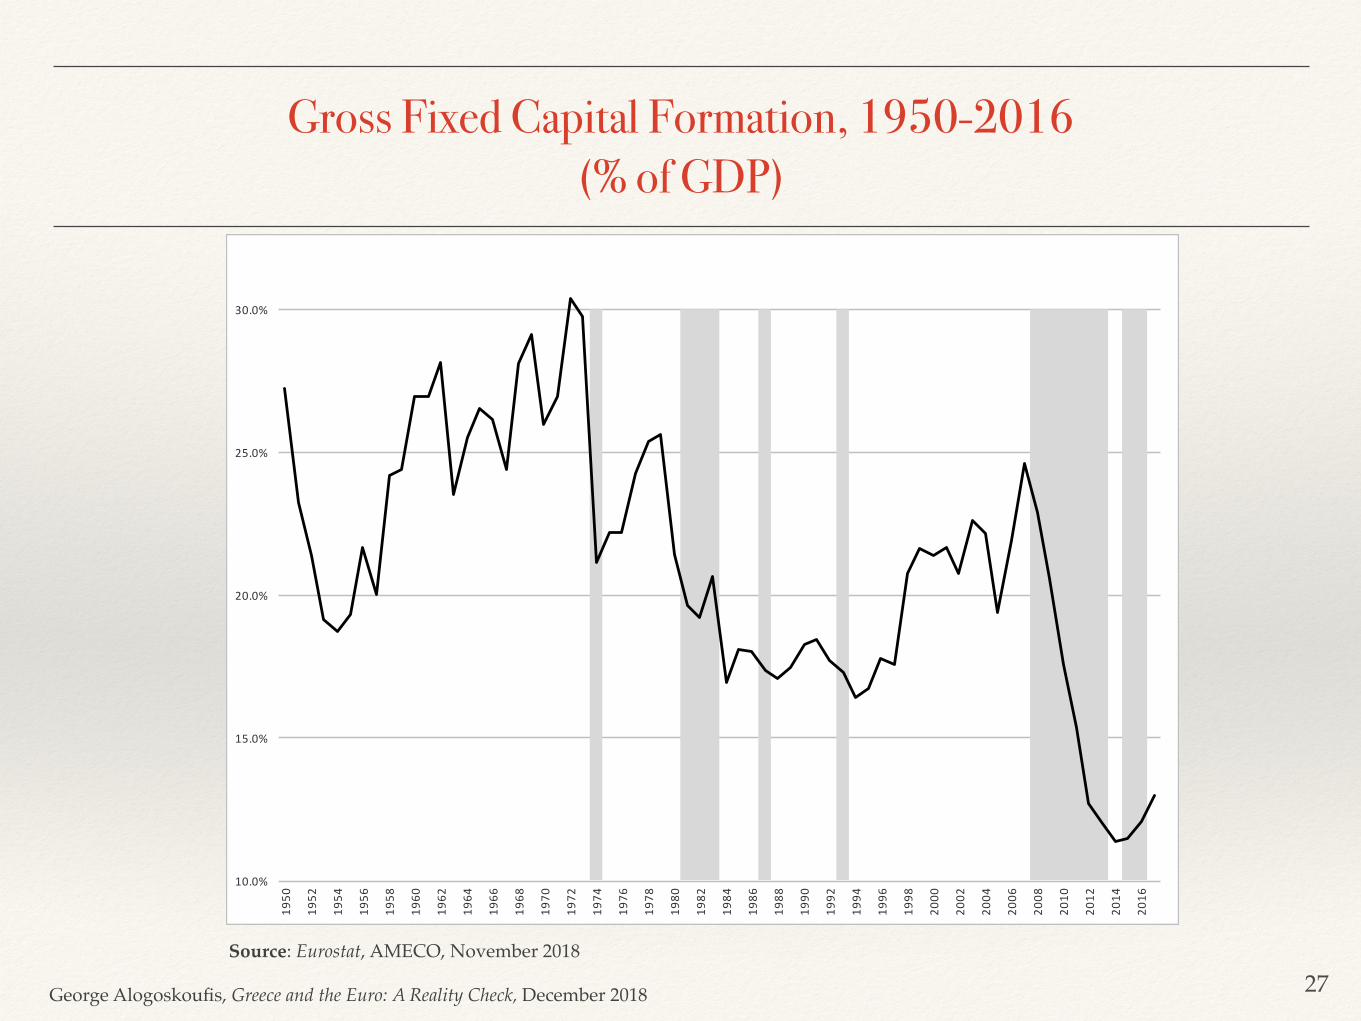
Gross Fixed Capital Formation, 1950-2016 (% of GDP)
!27Source: Eurostat, AMECO, November 2018
10.0%
15.0%
20.0%
25.0%
30.0%
1950
1952
1954
1956
1958
1960
1962
1964
1966
1968
1970
1972
1974
1976
1978
1980
1982
1984
1986
1988
1990
1992
1994
1996
1998
2000
2002
2004
2006
2008
2010
2012
2014
2016
George Alogoskoufis, Greece and the Euro: A Reality Check, December 2018
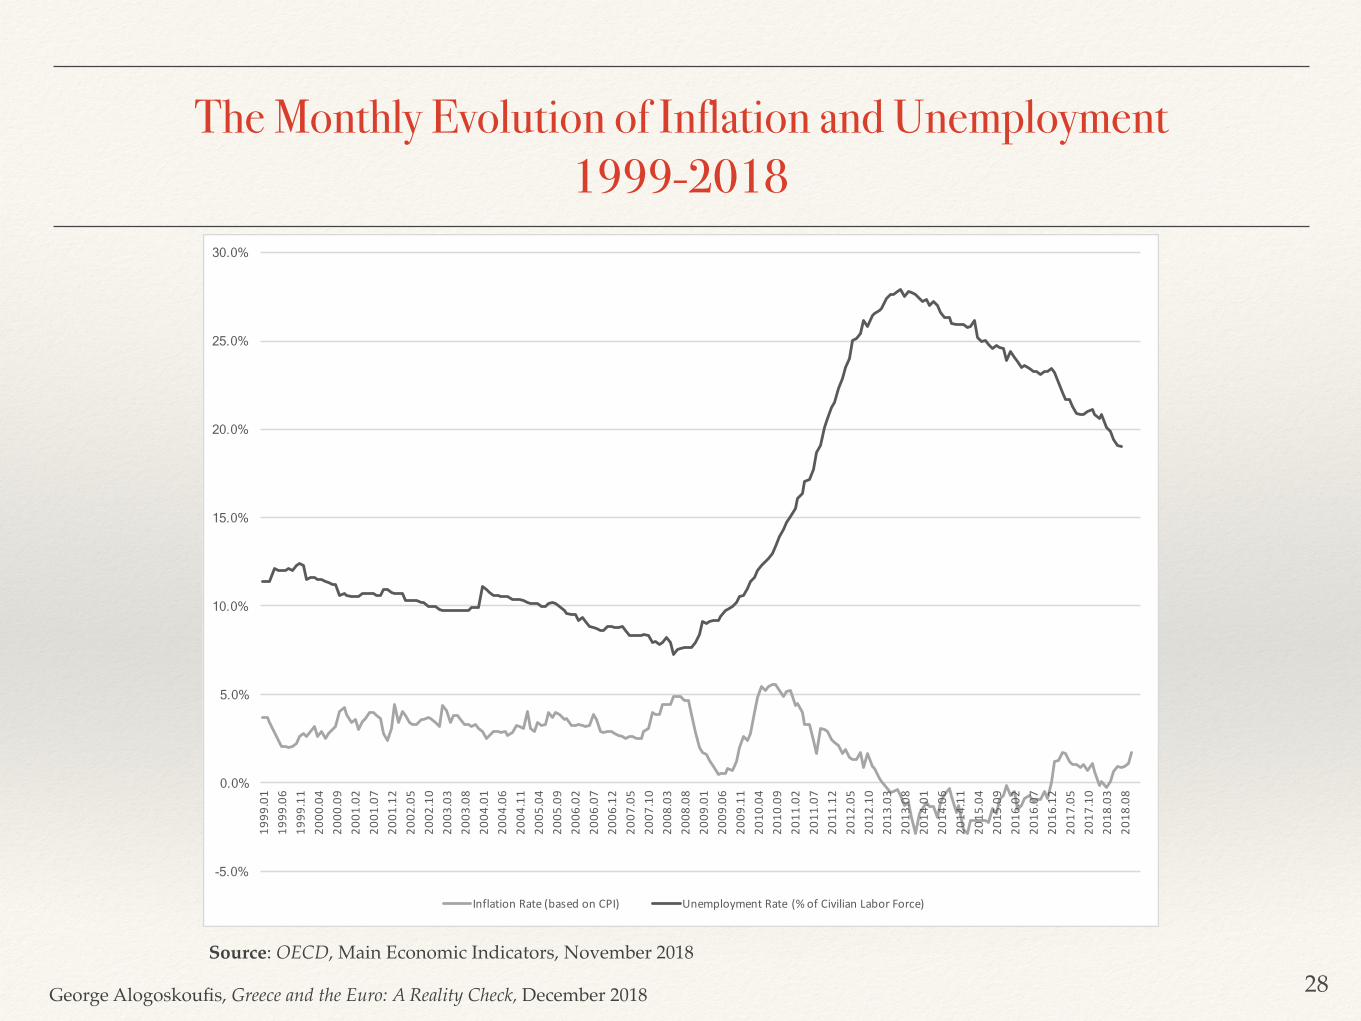
The Monthly Evolution of Inflation and Unemployment 1999-2018
!28
-5.0%
0.0%
5.0%
10.0%
15.0%
20.0%
25.0%
30.0% 19
99.01
1999
.06
1999
.11
2000
.04
2000
.09
2001
.02
2001
.07
2001
.12
2002
.05
2002
.10
2003
.03
2003
.08
2004
.01
2004
.06
2004
.11
2005
.04
2005
.09
2006
.02
2006
.07
2006
.12
2007
.05
2007
.10
2008
.03
2008
.08
2009
.01
2009
.06
2009
.11
2010
.04
2010
.09
2011
.02
2011
.07
2011
.12
2012
.05
2012
.10
2013
.03
2013
.08
2014
.01
2014
.06
2014
.11
2015
.04
2015
.09
2016
.02
2016
.07
2016
.12
2017
.05
2017
.10
2018
.03
2018
.08
InflationRate(basedonCPI) UnemploymentRate (%ofCivilianLaborForce)
Source: OECD, Main Economic Indicators, November 2018
George Alogoskoufis, Greece and the Euro: A Reality Check, December 2018
What is the Alternative?There is limited scope for a radical overhaul of the adjustment program.
The first priority is to acknowledge the limitations and the weaknesses of the current Greek adjustment program. The Greek government, the EU institutions and the IMF have deep disagreements. It is no longer the “troika” vs Greece, but the EU institutions vs the IMF and Greece is in the middle.
The second is for the three sides to cooperate on the revision of the program. There is a need to arrive at an acceptable compromise to be adopted by the European side, the IMF and a wider political spectrum in Greece than just the current government.
The serious input from the Greek side on such a revision is a sine qua non. A revised adjustment program must enjoy wide political legitimacy in Greece itself, which is something that does not apply to the current program.
The third priority is the consistent application of the revised program by Greece for a number of years, in a way that inspires confidence that the program is there for the medium term. A government enjoying support from across the political spectrum would help in this.
Only a credible medium term adjustment program with broader aims and wider political legitimacy than the current one can ensure the revival of investment and consumption in Greece in order to drag the economy out of the seven-year depression and contribute to a sustained recovery.
!29