Embed Size (px)
Citation preview
i Report IEA-PVPS T14-09:2017
ISBN 978-3-906042-66-4
Flexible resources for flexible transmission system operation
IEA-PVPS Task 14: “High Penetration of PV Systems in Electricity Grids” Subtask 3: High penetration solutions
for central PV generation scenarios

ii

iii
INTERNATIONAL ENERGY AGENCY
PHOTOVOLTAIC POWER SYSTEMS PROGRAMME
Flexible resources for flexible transmission system
operation
IEA-PVPS Task 14: “High Penetration of PV Systems in Electricity Grids” Subtask 3: High penetration solutions for central PV generation scenarios
IEA-PVPS T14-09:2017
October 2017
Corresponding Author:
Eng. Adriano Iaria
Development of Energy Systems Dept. RSE S.p.A Ricerca sul Sistema Energetico.
Via Rubattino, 54, 20134 Milano (MI) - Italy
Ph. +39-02-3992-5241
Fax +39-02-3992-5597
e-mail: [email protected]

iv
Report contributors
BELGIUM
Koen Verpoorten1,2, Kristof De Vos1,2
1Department of Electrical Engineering, University of Leuven, Leuven, Belgium
2EnergyVille, Genk, Belgium
GERMANY
Markus Kraiczy1, Rafael Fritz1, Bernhard Ernst1, Dominik Jost1,
1 Fraunhofer Institute for Wind Energy and Energy System Technology, Kassel
Germany
GREECE
Stathis Tselepis, CRES, Centre for Renewable energy Sources and Saving, Greece.
ITALY
Adriano Iaria2, Claudio Brasca2, Diego Cirio2, Antonio Gatti2, Marco Rapizza2
2Ricerca sul Sistema Energetico – RSE S.p.A., Energy Systems Development Dept.,
Milano, Italy
JAPAN
Kazuhiko Ogimoto3, Ken Obayashi4, Koichi Asano4
3University of Tokyo, Institute of Industrial Science, Tokyo, Japan
4New Energy and Industrial Technology Development Organization, (NEDO), Smart
Community Department, Kawasaki City, Japan
SWITZERLAND
Christof Bucher, Basler & Hofmann AG, Zürich, Switzerland
UNITED STATES OF AMERICA
Barry Mather5, Vahan Gevorgian5
5National Renewable Energy Laboratory (NREL), Golden, Colorado, USA
Foto credit cover page
RSE S.p.A. Ricerca sul Sistema Energetico (Milan – Italy)

v
Acknowledgments
The Italian contribution has been financed by the Research Fund for the Italian Electrical
System under the Contract Agreement between RSE S.p.A. and the Ministry of Economic
Development - General Directorate for Nuclear Energy, Renewable Energy and Energy
Efficiency in compliance with the Decree of March 8, 2006.
The German contribution is supported by the German Federal Ministry for Economic Affairs and Energy and the “Forschungszentrum Jülich GmbH (PTJ)” within the framework of the project “HiPePV2” (FKZ: 0325785).
The US’s contribution is sponsored by the U.S. Department of Energy.

vi
Table of content
Report contributors ......................................................................................................................................... i
Acknowledgments ........................................................................................................................................... v
List of Figures ................................................................................................................................................ viii
List of Tables ....................................................................................................................................................ix
List of acronyms ............................................................................................................................................... x
Executive Summary ........................................................................................................................................ 1
1 Introduction ............................................................................................................................................... 3
1.1 Motivation ............................................................................................................................................................ 3
1.2 Goal of the activity ............................................................................................................................................ 3
1.3 Report structure ................................................................................................................................................ 4
2 Power systems and markets with presence of PV ........................................................................ 5
2.1 Present status of power system .................................................................................................................. 5
2.1.1 Generation and Consumption .................................................................................................... 5
2.1.2 Cross-border power balancing.................................................................................................. 9
2.2 Present status of Market .............................................................................................................................. 10
2.3 Expected evolution of generation and demand.................................................................................. 12
2.4 PV forecast integration into power system operation and market............................................ 15
2.5 Operational events experienced with presence of PV into power system .............................. 17
2.6 PV requirements in case of frequency and voltage deviations .................................................... 20
2.6.1 Germany ........................................................................................................................................... 23
2.6.2 Italy ..................................................................................................................................................... 23
3 Existing flexibility resources ............................................................................................................. 26
3.1 National status of flexibility resources .................................................................................................. 27
3.2 National practice about operating power reserves .......................................................................... 29
3.2.1 Reserve requirements ................................................................................................................ 30
4 Innovative flexibility resources including demand activation ............................................. 34
4.1 List of innovative solutions ......................................................................................................................... 34
4.2 Flexibility on the demand side obtained through demand response ........................................ 37
4.3 Flexibility by installations of storage with adoption of new technologies ............................. 39
4.3.1 Synthetic inertia and fast frequency response supply by battery storage............ 40
4.4 Communication infrastructure for demand-response and control of battery storage ...... 43
4.5 Cross border balancing market ................................................................................................................. 44
5 PV output management for system operation ............................................................................ 46
5.1 Curtailment of connected PV output ...................................................................................................... 46
5.1.1 Belgium ............................................................................................................................................. 46
5.1.2 Germany ........................................................................................................................................... 47
5.1.3 Greece ................................................................................................................................................ 47
5.1.4 Italy ..................................................................................................................................................... 47
5.1.5 Switzerland ..................................................................................................................................... 50
5.1.6 Japan ................................................................................................................................................... 50
5.2 Further flexibility from PV output modification ................................................................................ 50
5.2.1 International trend ....................................................................................................................... 50
5.2.2 Demonstration Projects ............................................................................................................. 51
5.3 Communication infrastructure for distributed PV output modification ................................. 57
6 Conclusions .............................................................................................................................................. 58
Technical issues and flexibility ............................................................................................................ 58
7 Recommendations ................................................................................................................................ 60

vii
Operational flexibility and enhancement ...................................................................................... 60
Flexibility resources ................................................................................................................................... 60
References ....................................................................................................................................................... 61

viii
List of Figures Figure 1: Example of discrete probability density function of possible power deficit Pdef
(source: [11]) .......................................................................................................................................... 16
Figure 2: Net and gross load profile evolution in the working days of March in Italy
(source AEEGSI [20]) ............................................................................................................................ 20
Figure 3: LVRT capability – MV level PV; Germany (According to [24]) ................................... 23
Figure 4: LVRT capability – MV and LV levels PV (Prated≥6kVA); Italy (graphic based on
[26]) ............................................................................................................................................................ 24
Figure 5: LVRT capability – HV level PV; Italy (graphic based on [27]) .................................... 24
Figure 6: Logical scheme for activation of frequency relays with unblocking based on
voltage; MV level PV - Italy (scheme based on [26]) ................................................................. 25
Figure 7: Logical scheme for activation of frequency relays with voltage unblocking,
tripping and enabling of restrictive thresholds from remote. MV level PV - Italy
(scheme based on [26], [28]) ............................................................................................................. 26
Figure 8: demand response application with variable residual (net) load ............................. 38
Figure 9: Dynamic simulation, with different values of inertia, of a big thermal generator
loss in the Italian Sardinia Island (source: Ricerca sul Sistema Energetico - RSE
S.p.A.) ......................................................................................................................................................... 41
Figure 10: Block diagram of a derivative control aimed to inertial response - wind
associated storage (picture based on [43]) ................................................................................. 42
Figure 11: Droop function in case of over-frequency (Germany- [21]) .................................... 47
Figure 12: DG droop function in case of over-frequency (Italy; graphic based on [26]) .... 48
Figure 13: Grid-friendly PV power plant (source V. Gevorgian, NREL) ..................................... 53
Figure 14: Progress of METI Demonstration Projects (Source: TEPCO) ................................... 55
Figure 15: Project structure of National Project on output curtailment for PVs (Source:
Project Material) .................................................................................................................................... 56

ix
List of Tables Table 1: Statistics on power generation and consumption in the interviewed European
countries ...................................................................................................................................................... 6
Table 2: Statistics on power generation and consumption in ENTSO-E area; data provided
by ENTSO-E ................................................................................................................................................. 7
Table 3: Statistics on power generation and consumption in Japan - [2] ................................... 8
Table 4: Statistics on power generation and consumption in United States of America ([4]-
[6]) ................................................................................................................................................................. 9
Table 5: Cross-border power balancing in the interviewed European countries ................. 10
Table 6: Present status of Market ........................................................................................................... 11
Table 7: PV participation into electricity markets ........................................................................... 12
Table 8: PV installed capacity evolution .............................................................................................. 13
Table 9: Evolution of other generation capacity and demand ..................................................... 14
Table 10: PV forecast integration into power system operation and market ........................ 16
Table 11: Specifications about PV forecast integrated into power system operation and
market ....................................................................................................................................................... 17
Table 12: LV level PV requirements in case of voltage and frequency deviations ................ 21
Table 13: MV level PV requirements in case of voltage and frequency deviations .............. 22
Table 14: HV level PV requirements in case of voltage and frequency deviations ............... 23
Table 15: Flexibility resources adopted for power balancing ..................................................... 27
Table 16: Main typical performances of nuclear and fossil-fuelled power plants ................ 28
Table 17: Main typical performances of typical hydro power plants and pumped
storage ....................................................................................................................................................... 29
Table 18: Present national requirements about primary reserve (FCR) ................................. 31
Table 19: Present national requirements about secondary reserve (aFRR) .......................... 32
Table 20: Present national requirements about tertiary reserve (mFRR) ............................. 33
Table 21: National procurement/payment roles for operating reserves ................................ 33
Table 22: elements affected by PV evolution in the interviewed countries ............................ 34
Table 23: innovative flexibility resources at distribution MV level ........................................... 35
Table 24: innovative flexibility resources at transmission HV level ......................................... 36
Table 25: Status of demand response ................................................................................................... 39
Table 27: Communication infrastructures for DR and distributed storage –
existing/presumed ............................................................................................................................... 44
Table 28: procedures for PV active power curtailment at distribution level (Germany) .. 47
Table 29: RIGEDI schemes for DG active power curtailment at MV level (Italy; [17]) ........ 49
Figure 14: Progress of METI Demonstration Projects (Source: TEPCO) ................................... 55
Figure 15: Project structure of National Project on output curtailment for PVs (Source:
Project Material) .................................................................................................................................... 56
Table 30: Communication technologies for generation modification of distributed small-
scale PV existing/presumed solutions........................................................................................... 57

x
List of acronyms CCGT Combined Cycle Gas Turbine
CE Continental Europe
CHP Combined Heat and Power
CM Congestion Management
DG Distributed Generation
DR Demand response
DSO Distribution System Operator
EHV Extra High Voltage
FACTS Flexible Alternating Current Transmission System device
FCR Frequency Containment Reserve
FFR Fast Frequency Response
FRRa Automatic Frequency Restoration Reserve
FRRm Manual Frequency Restoration Reserve
GPRS General Packet Radio Service
GPS Global Positioning System
GSM Global System for Mobile communications
HV High Voltage
HVDC High Voltage Direct Current link
ICT Information and Communications Technology
LCC HVDC Line Commutated Converter HVDC
LDC Local Distribution Company
LoRa Long Range standard
LPWAN Low-Power Wide-Area Network
LVRT Low Voltage Ride Through
OCGT Open Cycle Gas Turbine
PHS Pumped Hydroelectric Storage
PV Photovoltaic
RES Renewable energy sources
RMR Reserve Margin Restoration
ROCOF Rate Of Change Of Frequency
RR Replacement Reserve
TSA Transient Stability Analysis
TSO Transmission System Operator
VC Voltage Control
VIU Vertical integrated utilities
VSC HVDC Voltage Source Converter HVDC

1
Executive Summary The dramatic increase of PV generation implies several challenges in transmission and
distribution system operation. As for transmission, major issues relate to the variability,
uncertainty, reduction of inertia and regulation capabilities, with consequent higher
needs in flexibility resources requirements. Flexibility is considered as the ability of the
power system to deploy its resources with the aim to match with changes in “net load” (e.g. load minus DG output including variable generation) ensuring a stable and a secure
operation. In particular, high PV penetration significantly affects the daily profile of “net load”: lower net load in central daylight hours involves the risk of over-generation since
a minimum amount of traditional generation is required for operational security (e.g.
balancing reserve); in the evening, the decreasing PV output, which occurs together with
the evening load demand ramp, exacerbates the upward ramps of net load with
consequent risk of inadequate system response. The above concerns are further increased
by the progressive decommissioning, due to loss of market competitiveness, of thermal
power plants i.e. the main traditional resources of flexibility. New, highly performing
flexibility resources are therefore gaining more and more importance.
This report provides a review of present and expected scenarios about flexibility in
system operation. It summarizes and integrates results of a survey involving national
experts in six countries, namely Belgium, Germany, Greece, Italy, Japan, and Switzerland.
Information is provided about: i) power systems and markets with presence of PV; ii)
existing flexibility resources; iii) innovative flexibility resources, including demand
response and PV output management for system operation. Contents are structured in
order to support scenario development in future PV integration studies.
The main conclusions of the report are the following:
High reliability in PV forecast can be achieved in the short-term (e.g. 1 hour or
less). However, not all the flexibility resources can be activated compatibly with
this time frame. Consequently more and faster flexibility resources are needed (e.g.
improving the thermal power performances of installing battery energy storage
systems).
A large amount of renewable energy sources (RES) requires probabilistic
approaches for the assessment of balancing reserve requirements aimed to
compensate RES forecast uncertainty, accepting a certain risk in order to limit
expensive over-estimations.
In order to face the changes in net load daily profile, new highly performant
flexibility resources are needed, such as: i) thermal power plants allowing shorter
starting time, lower number of hours of continuous operation, smaller minimum “off” time, faster ramping capability; ii) distributed generation (DG) output
modification; iii) demand response (DR); iv) battery storage.
DR is endorsed in order to be exploited for peak shaving, power balancing and
congestion management. Participation of electric vehicles in DR is considered a
reasonable opportunity.

2
PV output curtailment/modification can be seen as a sort of ancillary service due
mainly to grid congestions and system balance but also for voltage deviations and
for system voltage-related stability.
Provision of flexibility necessarily means a reduction of energy production of RES
(e.g. for upward power reserve provision), unless storage units are installed.
Accordingly, in order to realize the utilization of flexibility of RES, it is inevitable to
establish a regulatory framework and market mechanism.
DR and DG output modification involve the need of smart grids based on ICT
infrastructures allowing observability and controllability of the grid, also at
distribution level. Many ICT solutions are or will be available in the next future
(wireless communication internet; Low-Power Wide-Area Networks; etc.).
Accurate studies need to be performed in order to highlight the advantages and
the drawbacks of each option.
Despite the present high costs, battery energy storage BES can be one of the most
promising kinds of flexible resources with high performances in terms of response
speed to power unbalances due to PV variability and uncertainty following fast
meteorological changes. BES represents, also associated with variable renewables,
a promising solution for synthetic inertia and fast frequency control provision.
PV may be associated to storage and possibly be kept in de-loaded operation in
order to supply a fast frequency response.

3
1 Introduction High penetration of PV generation is expected to create specific challenges in terms of
transmission system operation, introducing variability, uncertainty, null inertia with
consequent higher complexity in flexibility resources provision. Moreover many thermal
power plants, which are one of the main resources of flexibility, e.g. in terms of active
power regulation and system inertia, are facing a progressive decommissioning since they
are less competitive than renewable resources. Flexibility is considered as the ability of the power system to deploy its resources with the aim to match with changes in “net load” ensuring a stable and a secure operation. The definition and comprehensive description can be found in many publications including “The Power of Transformation”1.
The present IEA Task 14 Subtask 3 Activity 4 report is aimed to collect structured
information on present and expected scenarios about flexibility in system operation. It
summarizes and integrates results of a survey involving national experts from industries
and research in 6 countries, namely Belgium, Germany, Greece, Italy, Japan and
Switzerland.
The results of this report will be followed and used in the subsequently planned report of Subtask 3 Activity 5 “Survey and case study of innovative transmission system operation
of transmission level with generation forecast and innovative flexibility resources”. 1.1 Motivation
PV generation is characterized by variability, since its availability follows daily and annual
patterns, and by uncertainty, depending on weather conditions. Variability involves the
more and more challenging need of proper conventional generation capacity and storage.
Uncertainty involves the a-head allocation of reserve and the real time balancing. Another
challenge to deal with is the lack of system inertia related to PV penetration and the
related displacement of conventional generation.
Like other RES, PV must be exploited when the primary source (solar irradiation in this
case) is available, otherwise it is lost. Moreover, PV systems are often of small size and
connected to the distribution system. Connection is realized via power electronic
converters. These basic recalls motivate the need for actions aimed to boost PV
integration in the power systems and electricity markets, among which are: I)
improvement of ramp rate, reduction of minimum operation and start-up time reduction
of existing and new thermal and hydro generators; II) improvement of PV generation
forecast; III) demand activation; IV) exploitation of energy storage by means of pumped
storage power plants and/or batteries, V) PV output modification, VI) interconnections
exploitation for reserve capacity sharing among control areas and for electricity markets
integration.
1.2 Goal of the activity
Structured information about flexible resources for power system operation is retrieved
in order to support scenarios development in future PV integration studies. The aim is to
1 International Energy Agency (IEA): “The Power of Transformation -Wind, Sun and the Economics of Flexible
Power Systems- (2014)
https://www.iea.org/publications/freepublications/publication/the-power-of-transformation---wind-sun-and-the-
economics-of-flexible-power-systems.html

4
support, in first instance, experts from research centres but also utilities and industry and
regulatory authorities involved in definition of perspective scenarios concerning the
power system operation.
1.3 Report structure
Keeping in mind the aforementioned needs, the report is structured into the four
following sections:
chapter no. 2 - power systems and markets with presence of PV;
chapter no. 3 - existing flexibility resources;
chapter no. 4 - innovative flexibility resources including demand-activation;
chapter no. 5 - PV output management for system operation;
Chapter 2 is aimed to compare different national situations.
Chapters 3 to 5 are meant to supply information for the analyses and simulations foreseen
in Task 14 activities 3.6 and 3.7.
There is a substantial amount of existing studies(2,3,4,5,6,7) close to the scope of PVPS Task
14 Activity 3.4. However, the technological and regulatory situation of intermittent RE
evolves rapidly. The present work has been prepared with the aim to provide up-to-date,
synthetic information consistent with the needs of PVPS Task 14 Subtask 3.
2 CIGRE Working Group C5.11: Market Design for Large Scale Integration of Intermittent Renewable Energy
Sources (2013)
3 CIGRE WG C2-5_MARKET OPERATORS-Their Evolution, Current Organization and Future Structure,
Brochure 626 (2015) 4 International Energy Agency: “Empowering Variable Renewables, Options for Flexible Electricity Systems”. Grid Integration of Variable Renewables (GIVAR) programme - Phase I (2008). 5 International Energy Agency: “Harnessing Variable Renewables: a Guide to the Balancing Challenge”. GIVAR programme - Phase II (2011).
6International Energy Agency: The Power of Transformation - Wind, Sun and the Economics of Flexible Power
Systems (2014). GIVAR programme - Phase III (2014). 7 The 21st Century Power Partnership: Flexibility in 21st Century Power Systems (2014)

5
2 Power systems and markets with presence of PV
This chapter collects the survey results about the present and expected situation of power
systems and national practices about the electricity markets and PV integration. The aim
is to provide proper information for scenario development to feed PV integration studies.
2.1 Present situation of power system
Many kinds of study can be carried out about the impact of high PV penetration on
power system. Among these are:
Load flow analysis - steady state assessment of power flows;
Dynamic analysis - assessment of angle, voltage, frequency stability in case of
large perturbations on power systems (under sound or degraded network
conditions);
Probabilistic/stochastic assessment of reserve requirements aimed to face RES
variability and uncertainty.
This section provides general data useful for the above mentioned kinds of study.
2.1.1 Generation and Consumption
The Table 1 shows relevant statistics on PV generation and power consumption
concerning the interviewed European countries.

6
Table 1: Statistics on power generation and consumption in the interviewed European countries
Generation and
consumption Belgium Germany Italy Greece Switzerland
Value Year Value Year Value Year Value Year Value Year
Nominal frequency [Hz] 50 50 - 50 50 50
Total net generation capacity
[GW] 20.6 2015 189.4 2013 124.7 2013
17.35
(mainland) ott-15 17.9 2014
PV capacity (nationwide) [GW] 2.7 2015 37 08/2014 18.4 2013 2.6 ott-15 ca. 1.2 2015
Hydroelectric generation
capacity [GW] 0.1 2015 10.3 08/2014 14.5 2013 3.24 ott-15 12.97 2014
Hydroelectric pumped storage
capacity [GW] 1.3 2015 6.5 2014 7.5 2013 0.7 ott-15 3.717 2014
Thermal generation capacity
[GW]
(including geothermal and
biomass)
8 2015 88.5 2013
75.8 all
3 OCGT
41.2
CCGT
31.6
Convent.
2013 10.22 ott-15 1.021 2014
Thermonuclear generation
capacity [GW] 5.9 2015 12.1 2013 0 2015 0 ott-15 3.485 2015
Wind generation capacity [GW] 1.7 2015 38 08/2014 8.5 2013 1.457 ott-15 0.06 2014
Peak/Off peak load (nationwide)
[GW] 13.5/5.7 2015 86.9 2011 51.6/18.7 2014 9.161/3.3 2013 9.662 2015
Total energy consumption
[GWh] (no storage) 81315 2012 518000 2014 330043 2013
50742
(mainland) 2014 57500 2014
Share of PV on total elect.
consumption [%] 2.9 2012 6 2014 6.5 2013
7
(mainland) 2014 1.5 2014
Total energy cross-border
exchange [GWh] 23760 2012 -35700 2014
42138
(imp) 2013 8588.9 2014
42900
export
37400
import
2014
Electricity consumption by
storage [%]
(Hydro Pumped Plants and
others)
2.5 2014 0.9 2013 0.34 2014 2.35 2014
Total net energy generated
by national generators [GWh] 83071 2012 562000 2014 289803 2013 41258.6 2014 69633 2014
Share of energy generated by
PV [GWh] 2148 2012 34900 2014 21588 2013 3558 2014
Ca.
900 2014
Share of energy gen. by
hydroelectric [GWh] 1659 2012 24098 2014 54671 2013 3062 2014 39300 2014
Share of energy gen. by thermal
[GWh] 31495 2012
317000
(fossil) 2014 198646 2013 30362 2014 3719 2014
Share of energy gen. by
thermonuclear [GWh] 40295 2012 91800 2014 0 2013 0 2014 26370 2014
Share of energy gen. by wind
[GWh] 2750 2012 55000 2014 14897 2013 3009 2014 108 2014
Share of installed PV capacity at
HV level [%] / / 6 08/2014 5.4 2013 2.2 2014 / /
Share of installed PV capacity at
MV level [%] / / 32 08/2014 61.4 2013 45.6 2014 / /
Share of installed PV capacity at
LV level [%] / / 61 08/2014 33.2 2013 52.2 2014 / /
Average size of PV systems
[kW] 5 2015 17 2012 30.5 2013 46.36 2014 / /
Further general data about Europe may be retrieved in “Yearly Statistics & Adequacy
Retrospect” ([1]), published by ENTSO-E. For the sake of simplicity, Table 2 shows
relevant statistics about the global ENTSO-E area (Continental Europe, Scandinavia,

7
Isolated areas of Great Britain, Ireland, Iceland); data about each country are also included
in [1].
Table 2: Statistics on power generation and consumption in ENTSO-E area; data provided by
ENTSO-E
Generation and consumption ENTSO-E area
Value Year
Nominal frequency [Hz] 50
Total net generation capacity [GW] 1015.1 2014 [1]
Solar capacity (nationwide) [GW] 82.8 2014 [1]
Hydroelectric generation capacity [GW] 202 2014 [1]
Hydroelectric pumped storage capacity [GW] / /
Thermal generation capacity [GW]
(geothermal and biomass included) 452.5 2014 [1]
Thermonuclear generation capacity [GW] 126.5 2014 [1]
Wind generation capacity [GW] 122.8 2014 [1]
Peak/Off peak load (nationwide) [GW] 522/234 2014 [1]
Total energy consumption [GWh] (no storage) 3218390 2014 [1]
Share of solar on total elect. consumption [%] 2.8 2014
Total energy cross-border exchange [GWh] 445554 export
442620 import 2014 [1]
Electricity consumption by storage [%]
(Hydro Pumped Plants and others) 47637 2014 [1]
Total net energy generated
by all generators [GWh] 3268961 2014 [1]
Share of energy generated by solar [GWh] 91727 2014 [1]
Share of energy gen. by hydroelectric [GWh] 608392 2014 [1]
Share of energy gen. by thermal [GWh] 1333186 2014 [1]
Share of energy gen. by thermonuclear [GWh] 858890 2014 [1]
Share of energy gen. by wind [GWh] 249102 2014 [1]
Share of installed PV capacity at HV level [%] n.a. n.a.
Share of installed PV capacity at MV level [%] n.a. n.a.
Share of installed PV capacity at LV level [%] n.a. n.a.
Average size of PV systems [kW] n.a. n.a.

8
Table 3 shows relevant statistics about the Japanese power system. These data were
retrieved from the Japanese Ministry of Economic, Trade, and Industry website ([2]), with
the exception of the PV installed capacity [3].
Table 3: Statistics on power generation and consumption in Japan - [2]
Generation and consumption Value Year
Nominal frequency [Hz] 50/60 2014
Total net generation capacity [GW] 313.8 2014
PV capacity (nationwide) [GW] 23.3 2014
Hydroelectric generation capacity [GW] 22.6 2014
Hydroelectric pumped storage capacity [GW] 27 2014
Thermal generation capacity [GW]
(geothermal and biomass included) 193.9 2014
Thermonuclear generation capacity [GW] 44.3 2014
Wind generation capacity [GW] 2.8 2014
Peak/Off peak load (nationwide) [GW] (152/82) 2014
Total energy consumption [GWh] (no storage) 933000 2014
Share of PV on total elect. consumption [%] 2.1 2014
Total energy cross-border exchange [GWh] 0 2014
Electricity consumption by storage [%]
(Hydro Pumped Plants and others) 0.6 2013
Total net energy generated
by national generators [GWh] 936300 2014
Share of energy generated by PV [GWh] 19400 2014
Share of energy gen. by hydroelectric [GWh] 82300 2014
Share of energy gen. by thermal [GWh] 829600 2014
Share of energy gen. by thermonuclear [GWh] 0 2014
Share of energy gen. by wind [GWh] 5009 2014
Share of installed PV capacity at HV,MV level(≥50 kW) [%]
69
(≥10 kW) 2015
Share of installed PV capacity at LV level(< 50kW) [%]
Share of installed PV capacity at LV level(< 10kW) [%] 31 (<
10kW) 2015
Average size8 of PV systems [kW] 2400 2014
Concerning the United States, general information was achieved from the website of the
U.S. Energy Information Administration “EIA” ([4]). The North American electrical power
system (Quebec region included) is partitioned into four synchronous areas with nominal
frequency of 60 Hz ([5]). Synchronous areas are connected via HVDC links and back-to-
back substations (AC/DC/AC conversion). Asynchronous DC interconnections allow the
coexistence of different adopted standards in the fourth synchronous areas operation.
The Table 4 summarizes general data of the North American system, on the basis of
publicly available data ([4]-[6]).
8 Only PV systems that have more than 1,000 kW for the maximum output are included.

9
Table 4: Statistics on power generation and consumption in the United States of America ([4]-[6])
Generation and consumption Value Year
Nominal frequency [Hz] 60 [5]
Total generation capacity [GW] 1172.6 [4] 2014
PV capacity (nationwide) [GW] 18.3 [3] 2014
Hydroelectric generation capacity [GW] 78.8 [4] 2014
Hydroelectric pumped storage capacity [GW] 21.6 [4] 2014
Thermal generation capacity [GW]
(geothermal and biomass included) 879.8 [4]
2014
Thermonuclear generation capacity [GW] 103.9 [4] 2014
Wind generation capacity [GW] 65.3 [4] 2014
Other generation9 [GW] 3.3 [4] 2014
Peak load (nationwide) [GW] 767 [4] 2012
Total energy consumption [GWh] (no storage) 3863000 [6] 2014
Share of PV on total elect. consumption [%] 0.6 ([4].[6]) 2014
Total energy cross-border exchange [GWh] / /
Electricity consumption by Hydro Pumped Storage [%] 0.2 [4] 2014
Total net energy generated
by national generators [GWh] 4103141 [4] 2014
Share of energy generated by PV [GWh]
Share of energy generated by Solar PV
24786 [4]
2439 [4] 2014
Share of energy gen. by hydroelectric conventional [GWh] 259366 [4] 2014
Share of energy gen. by thermal [GWh] 2750571 [4] 2014
Share of energy gen. by thermonuclear [GWh] 797167 [4] 2014
Share of energy gen. by other renewables Excluding
Hydroelectric and Solar [GWh] 261523 [4] 2014
Share of installed PV capacity at HV level [%] / /
Share of installed PV capacity at MV level [%] / /
Share of installed PV capacity at LV level [%] / /
Average size of PV systems [kW] / /
2.1.2 Cross-border power balancing
In order to reduce the impact of the RES variations, it is effective to share power balancing
capability across national borders. Nevertheless, power balancing sharing depends on the
transmission capacity between areas and on the peculiarities of each national system. For
instance, the Continental Europe (CE) grid is highly meshed in some areas and quite less
in other ones. Low meshing implies reduced transmission capacity as in the case of the
Italian grid, which is electrically long with some internal critical sections, highlighting six
different market zones. Italy like other peripheral systems (e.g. Ireland) adopts the central
dispatch practice involving dispatch instructions issued by the TSO to all parties; in CE,
self-dispatch practice is adopted with single generators or portfolio of generators
following an aggregated schedule of actions (start/stop/increase output/decrease).
Different situations, within ENTSO-E borders, are summarized by a survey [7],
periodically performed in order to have the snapshot of the current scenario.
9 Other energy sources including: batteries, hydrogen, purchased steam, sulfur, tire-derived fuels and other
miscellaneous energy sources.

10
Cross-border power balancing is expected in Greece even if, in the near future, it is
evaluated only with Italy. It is worth noting that the Italian and Greek systems are not only
synchronously interconnected via the CE 10 and Balkans grids, but they are also
interconnected by a 400 kV, 500 MW HVDC link.
The Italian transmission system operator TERNA is evaluating technical-economic
feasibility of bilateral agreements for mechanisms for exchange of tertiary and secondary
reserve.
Belgium buys operating reserve capacity abroad, e.g. Frequency Containment Reserve
(FCR) (namely, primary frequency regulation reserves) in France & Frequency
Restoration Reserve (FRR) (tertiary reserves) from other TSOs. The Belgian TSO Elia has
participated in the International Grid Control Cooperation platform (IGCC 11 ) since
October 2012. The aim of IGCC is to optimise the balancing management of the system
and the quality of electricity grid control. This coordination is intended to automatically
compensate for any imbalances in opposite directions experienced by system operators
avoiding activation of secondary reserves in opposite directions. Imbalance is shared
between Austria, Germany, Belgium, the Netherlands, Denmark, Switzerland and the
Czech Republic. Before reserve activation, imbalance volumes between regions are
netted.
Table 5 summarizes the situations in the interviewed European countries.
Table 5: Cross-border power balancing in the interviewed European countries
Cross-border power balancing
Belgium Yes
Switzerland Yes
Germany Yes
Greece Under Discussion
Italy Under Discussion
No cross-border interconnections are present in Japan.
2.2 Present situation of markets
The Table 6 summarizes electricity market situation in the interviewed countries.
In Japan, retail power market was not fully deregulated until the year 2016, while there
has been a voluntary nation-wide wholesale market operated by Japan Electricity Power
Exchange (JEPX). The last part of the retail market, of residential sector, has been
10 Central Europe 11 IGCC Participants: Amprion, 50Hertz, TransnetBW and TenneT DE (the four German transmission system
operators), Energinet.dk (Denmark), CEPS (Czech Republic), Swissgrid (Switzerland), TenneT NL (The
Netherlands), APG (Austria) and Elia (Belgium). See also http://www.elia.be/en/users-group/ad-hoc-taskforce-
balancing/IGCC.

11
liberalized since 2016 April. The transmission/distribution sectors, which are currently
within 10 vertically integrated power companies, are gradually being separated.
Unlike other countries, in the day-ahead market of Greece ([8]), uniform pricing still
applies, reflecting the price of the most expensive offer to meet the predicted demand;
zonal pricing has not been activated yet.
In Germany, it’s certainly worth noting that no dispatching services are included in
market structures.
Table 6: Present status of Market
Belgium Greece Germany Italy Switzerland Japan
Power system
market regulated Yes yes yes yes Yes No
Market structure Energy trading +
dispatching
Energy trading
+ dispatching Energy Trading
Energy
trading +
dispatching
Energy trading +
dispatching
Only trading in
private JPEX
Clearing price for
electricity market zonal m.p.12 pay as bid zonal m.p. zonal m.p.
Merit Order and
one clearing price
for the whole
country
zonal m.p.
Electricity market
time resolution
60 min (15min
settlement) 60 min 15 min 60 min
15 min (but many
energy products
are traded on a 1h)
30min
Electricity market
time horizon
intraday (5 min)
and day ahead
from hours to
day ahead
from hours (30
min) to day ahead
from hours
to day ahead
Long term
contracts, day
ahead (spot
market), intraday
and after day
4 hours ahead &
day ahead.
1 hour-ahead
market will be
established on April
2016
Remuneration
scheme for ancillary
services
pay as bid pay as bid pay as bid pay as bid pay as bid /
Services included in
the ancillary service
market
FCR, FRRa, FRRm,
Black Start, VC, CM
VC, FCR, FR,
RMR FCR, FRR, RMR
FRR, RMR,
CM
FCR, FRR, RMR, VC,
CM /
Procurement
scheme for not
market regulated
ancillary services
Bilateral Contracts
Between TSO &
producers. Market
platform for free
bids and activation
/
Bilateral contracts
Between TSO/ISO
& produces and
consumers
bilateral
contracts
between
TSO and
producers
Bilateral Contract
between TSO/ISO
and producers,
which in some
cases are DSO
Supply and demand
adjustment by
vertically unified
electric power
company
PV generation is already integrated into electricity markets of Belgium, Germany, Italy,
Switzerland (Table 7).
PV aggregation is used in Italy, Germany, and Switzerland.
In Switzerland, all PV power plants, which get FIT13 from the Swiss national FIT program,
are aggregated into one balancing group and put on the market. All other PV power plants
are integrated into the balancing area of the DSO that performs its load forecast including
these PV power plants.
In Italy, relevant PV power plants (with rated power higher than 10 MVA) can directly
present energy bids in day-ahead electricity market; energy traders can perform bids
12 Marginal Price: in a given market zone, it is the offer/bid with the highest merit order that has been accepted. 13 Feed-In Tariff: policy mechanism based on offering long-term contracts to renewable energy producers.

12
based on generation forecast of aggregated PVs. The publicly-owned company in charge
of granting incentives for electricity generation from renewables14 performs daily bidding
activity in the day-ahead electricity market by means of aggregation of small PV systems
([9]).
Table 7: PV participation into electricity markets
Belgium Switzerland Germany Greece Italy Japan
PV generation
integrated into
energy market
Yes Yes Yes No Yes no
Scheme of PV
integration into
market
Voluntary
participation for size
< 10kW
Mandatory
participation for
size > 10kW: injection
tariff. Under 10kW:
net energy metering
All PV power plants
which get FIT are
aggregated into
one balancing
group.
Optional participation by
means of aggregators for
PV with appropriate
meters
/
Direct participation
for big PV plants.
Optional
participation by
means of aggregators
/
2.3 Expected evolution of generation and demand
2.3.1 PV capacity
Looking at the expected evolution of PV capacity, shown in Table 8, it can be noted that
PV is overall expected to grow significantly. The growth percentage, shown in the last
column, is given by: 𝑦𝑒𝑎𝑟𝑙𝑦 𝑝𝑒𝑟𝑐𝑒𝑛𝑡 𝑔𝑟𝑜𝑤𝑡ℎ 𝑟𝑎𝑡𝑒= ( √𝑒𝑥𝑝𝑒𝑐𝑡𝑒𝑑 𝑐𝑎𝑝𝑎𝑐𝑖𝑡𝑦 𝑝𝑟𝑒𝑠𝑒𝑛𝑡 𝑐𝑎𝑝𝑎𝑐𝑖𝑡𝑦⁄𝑛𝑜.𝑦𝑒𝑎𝑟𝑠 − 1) ∙ 100
High percent increases are in general highlighted in those countries with low present
capacity (Belgium, Greece, Switzerland).
Italy and Germany are the interviewed European countries with the highest PV present
capacities. Despite the already large installed capacity amount, a significant growth, in
GW, is further expected in the period 2013-2024.
A significant PV cumulative capacity is expected in Japan (64 GW by 2030 against 23.3 GW
installed in 2014). That capacity is certainly a big challenge in an islanded grid like the
Japanese one; it can be accommodated by displacing a large amount of conventional
thermal and thermonuclear generation. The Japanese one is certainly an interesting
national case about how to manage a very high PV penetration in terms of nation-wide
balancing.
By 2021, on the basis of information available on the internet, expected cumulative PV
installed capacity in U.S.A. is around 100 GW; the resulting annual percent increase is
more than 27%.
14 GSE “Gestore dei Servizi Energetici”, http://www.gse.it.

13
Table 8: expected evolution of PV installed capacity
Expected cumulative amount [GW] Voltage
level
Horizon
Year
Present
cumulative
amount
Reference
Year [%, yearly]
Belgium 4.7 (moderate) MV. LV 2020
2.7 2015 11.7
6.5 (high) MV. LV 2020 19.2
Germany
39 MV. LV 2015 37
08/2014
4
41.5 MV. LV 2016 5
5815 / 2024 4.1
Italy 23.5 / 2019
18.4 2013 4.2
29.78 / 2024 4.5
Greece 4 (estimate) / 2020
2.6 10/2015 8.7
10 / 2050 3.9
Switzerland
1.5 Mainly LV 2016
1.2 2015
25
1.8 Mainly LV 2017 22.5
2.1 Mainly LV 2018 20.5
12 Mainly LV 2050 6.8
ENTSO-E
(solar gen.)
[10]
104 (Conservative scenario A)
111 (Best Estimate scenario B) / 2020
82.8 2014
3.9
5.
125 (Conservative scenario A)
139 (Best Estimate scenario B) / 2025
3.8
4.8
Japan 64 / 2030 23.3 2014 6.5
U.S.A. ≈10016 / 2021 18.3 2014 27.5
2.3.2 Other generation and demand
The Table 9 summarizes the evolution of other generation and demand. In the whole
European area of ENTSO-E, two scenarios (scenario A and scenario B) have been defined
for the evaluation of the risk for the security of supply over the coming years [10]. These scenarios, known as Scenario A “Conservative” and Scenario B “Best Estimate”, are based on national generation adequacy outlooks prepared by each individual TSO. The so called “conservative” scenario A takes into account: i) additional investments in generation or decommissioning with high certainty of happening; ii) the best estimate of load forecast
available to the TSOs, taking into account the highest expected growth of the consumption
according to national grid development plans; a RES evolution involving 105 GW of new
capacity in period 2016-2025. The “Best Estimate” scenario B takes into account: i) the generation capacity evolution described in Scenario A as well as future power plants
whose commissioning can be considered as reasonably credible by TSOs according to the
available national information; ii) almost the same best estimation of load forecast used
in scenario A (with some national exceptions); iii) a RES evolution involving 185 GW of
new capacity in period 2016-2025.
Total or partial thermonuclear decommissioning may be expected in Belgium, Germany,
Japan and Switzerland. The progressive decommissioning of thermal and thermonuclear
power plants will be compensated by renewables like PV and wind off/on-shore. In
Germany, the thermonuclear capacity should be replaced by wind, PV and other energy
sources until the year 2022.
15 Scenario B Netzentwicklungsplan Strom 2014 16 Source GTM Research / SEIA U.S. Solar Market Insight. Information available at
https://www.seia.org/news/us-solar-market-set-grow-119-2016-installations-reach-16-gw.

14
Table 9: Evolution of other generation capacity and demand
Country Category Expected value Hor. Year Variation Period
Belgium
Thermal [GW] 8 2020 0 2015-2020
Thermonuclear [GW] 5.5 2020 -0.4 2015-2020
Hydro [GW] 1.5 2020 1.4 2015-2020
Wind on-shore [GW] 2.5 2020 2.3 2015-2020
Wind off-shore [GW] 1.5 2020
Other generation [GW] 1.5 2020 / /
Yearly energy consumption [TWh] 96 2020 14.7 2012-2020
Germany17
Thermal [GW] 72.7 (fossil) 2024 -5.1 2012-2024
Thermonuclear [GW] 0 2024 -12.1 2012-2024
Hydro [GW] 4.8 2024 +0.4 2012-2024
Wind on-shore [GW] 50.4 2024 +22.2
08/2014-
2024 Wind off-shore [GW] 12.8 2024
Other generation [GW] 12.6 2024
Yearly energy consumption [TWh] 535.2 2024
Greece
Thermal [GW] 1.755 2020 -8.0 10/2015-
2020
Thermonuclear [GW] 0 0
Hydro [GW] 0.688 2020 -2.6 10/2015-
2020
Wind on-shore [GW] 7.500 (including off-shore) 2020 6.0
10/2015-
2020 Wind off-shore [GW]
Yearly energy consumption [TWh] 62 2020 11.3 2014-2024
Italy
Thermal [GW] 55 ≈2020 -20.8 2013-2020
Thermonuclear [GW] 0 0
Hydro [GW] 19 ≈2024 4.5 2013-2024
Wind on-shore [GW] 15 2024 7.2 2013-2024
Wind off-shore [GW] 0.65 2024
Other generation [GW] 7.7 (biomass) ≈2024
Yearly energy consumption [TWh] 327 2024 -3 2013-2024
Switz.
Thermal [GW] constant / /
Thermonuclear [GW] Possible phase out until 2034 / /
Hydro [GW] constant / /
Wind on-shore [GW] marginal / /
Wind off-shore [GW] None / /
Other generation [GW] 2 (CHP. rough estimation) 2050 / /
Yearly energy consumption [TWh] 60 (Should stay constant by means of more
efficiency and increasing electrification) 2050 / /
ENTSO-E
[10]
Thermal [GW] 380; 344 (Conservative scenario A)
377; 365 (Best Estimate scenario B) 2020; 2025
-108.5 (A)
-87.5 (B) 2014-2025
Thermonuclear [GW] 119; 103 (Conservative scenario A)
121; 106 (Best Estimate scenario B) 2020; 2025
-23.5 (A)
-20.5 (B) 2014-2025
Hydro [GW] 159; 160 (Conservative scenario A)
162; 166 (Best Estimate scenario B) 2020; 2025
-42 (A)
-36 (B) 2014-2025
Wind [GW] 171; 197 (Conservative scenario A)
193; 255 (Best Estimate scenario B) 2020; 2025
74.2 (A)
132.2 (B) 2014-2025
Yearly energy consumption [TWh] / 2020; 2025 248 (B) 2016-2025
Japan
Thermal [GW] 87.80 2030 -106.1 2014-2030
Thermonuclear [GW] 36.5 2030 -7.8 2014-2030
Hydro [GW] 50.4 2030 0.8 2014-2030
Wind on-shore [GW] 9.8 2030 7.8 2014-2030
Wind off-shore [GW] 0.8 2030
Other generation [GW] 5.5 2030
Yearly energy consumption [TWh] 1065 2030 132 2014-2030
17 Scenario B 2024 Netzentwicklungsplan Strom 2014

15
2.4 Integration of PV forecast into power system operation and
market
Solar forecasting in power system is quite recent: cloud movements and
evolution/involution, and sometimes fog are the main reasons for PV generation
volatility. Sky images are suitable to produce short-term forecasts, whereas satellite
images can be used to anticipate radiation changes within a time horizon of few hours.
Forecasting can reduce the uncertainty associated with PV as well wind or other
renewable energy sources. Previous paragraph 2.3 showed how solar PV in the electric
grid is steadily rising in various areas worldwide. The increasing penetration of solar
power has to be integrated with the conventional power plants, which are still needed for
ancillary services supply and energy supply where sufficient energy is not supplied by
renewable generation. Solar power forecasting is therefore very important for
operational planning because it has to ensure a low uncertainty around the forecasted
operating point.
In particular, solar and other RES forecast is needed to assess the net load (i.e. gross load – RES output) hence the day-ahead unit commitment of conventional generation.
Forecasts should also be taken into account for the evaluation of balancing power reserve
requirements: with a large amount of RES generation, probabilistic approaches for the
assessment of the balancing reserve become more and more important. Indeed,
probabilistic approaches instead of deterministic ones allow containing uneconomic
over-estimation of reserve since they are aimed to assess a reserve requirement
associated to a reasonable risk degree. In other words, probabilistic approaches cope with
the most probable events and exclude the most unlikely extreme situations (e.g. sudden
loss of the 100% installed capacity of RES in a given large control area). In particular,
probabilistic methodologies lead to the assessment of the probability concerning a given
imbalance between load and generation; the corresponding probability cumulative
distribution function gives a needed balancing reserve associated with a reliability
probabilistic level that is assumed lower than 100% (Figure 1)([11], [12]).
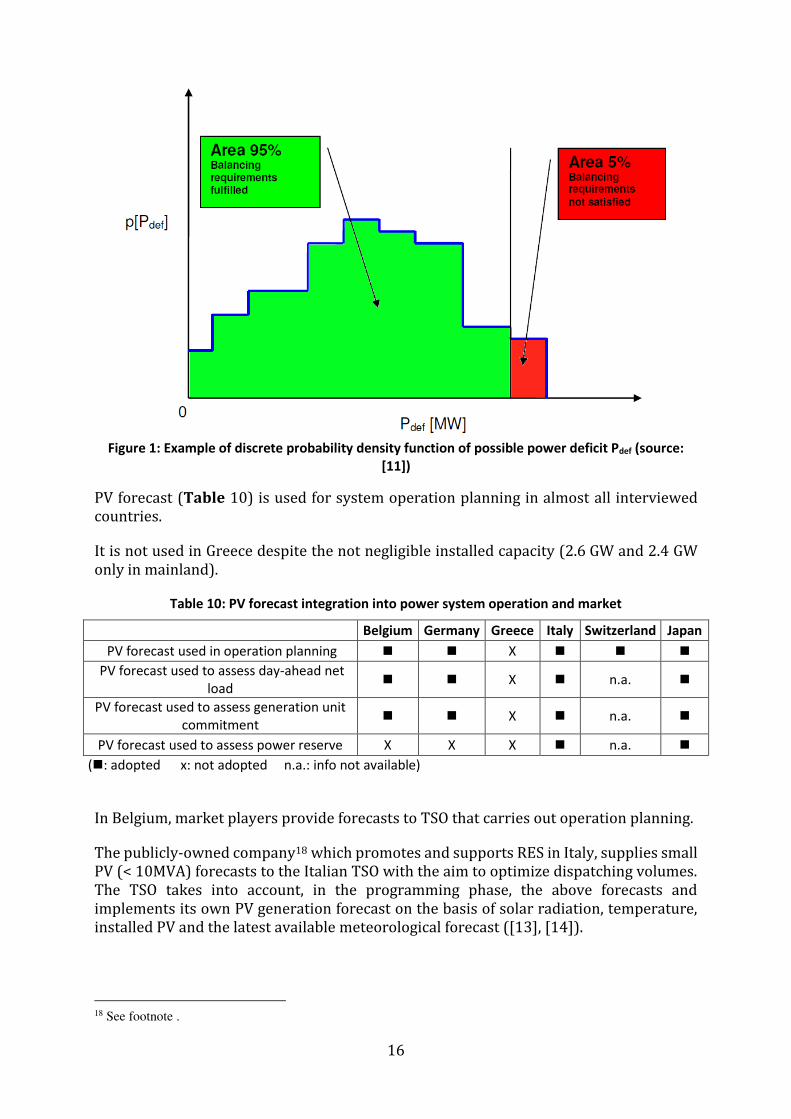
16
Figure 1: Example of discrete probability density function of possible power deficit Pdef (source:
[11])
PV forecast (Table 10) is used for system operation planning in almost all interviewed
countries.
It is not used in Greece despite the not negligible installed capacity (2.6 GW and 2.4 GW
only in mainland).
Table 10: PV forecast integration into power system operation and market
Belgium Germany Greece Italy Switzerland Japan
PV forecast used in operation planning X
PV forecast used to assess day-ahead net
load X n.a.
PV forecast used to assess generation unit
commitment X n.a.
PV forecast used to assess power reserve X X X n.a.
(: adopted x: not adopted n.a.: info not available)
In Belgium, market players provide forecasts to TSO that carries out operation planning.
The publicly-owned company18 which promotes and supports RES in Italy, supplies small
PV (< 10MVA) forecasts to the Italian TSO with the aim to optimize dispatching volumes.
The TSO takes into account, in the programming phase, the above forecasts and
implements its own PV generation forecast on the basis of solar radiation, temperature,
installed PV and the latest available meteorological forecast ([13], [14]).
18 See footnote .

17
In Japan, it has been recently changed that regulated transmission and distribution
companies, as a last resort, have to purchase PV energy from PV generation owners on the
basis of uncertainty of PV energy in each Vertical Integrated Utilities (VIU) control area.
Italy and Japan use PV forecast for the assessment of power reserve (Table 11). In Italy,
RES forecast is used to assess the tertiary reserve for balancing uncertainties around a
forecasted operating point, due to RES and load deviations in addition to forced outages
of conventional programmable generation. In Japan PV forecast is used for assessment of
the hot (spinning) reserve.
Table 11: Specifications about PV forecast integrated into power system operation and market
Belgium Germany Italy Japan
PV forecast used to
assess ahead net
load
(gross load – RES
output)
Context Day-ahead and
intraday energy
market
Day-ahead
and intraday
energy
market
Day-ahead
energy
market
Two days before
obligation in
balancing rule
Time resolution 1h (15 min
settlement) 15 min 1h 30 min
Maximum time
horizon
12-36h
(day-ahead);
5min (intraday)
up to 3 days day-ahead day-ahead
PV forecast used to
assess generation
unit commitment
Context Forward,
Day-ahead and
intraday
markets
Day-ahead
energy
market
Day ahead
energy
market
Two days before
obligation in
balancing rule
Time resolution 15 min 1h 1 h
Maximum time
horizon Several days day-ahead 1 week, 2 days19
PV forecast used to
assess power
reserve
Context
Not used Not used
Day-ahead
and intraday
dispatching
services
market
Day-ahead
forecast of supply
and demand in
system operator
Time resolution 1h (15 min
settlement) 1 h
Maximum time
horizon day-ahead
Kind of reserve tertiary
reserve hot reserve
2.5 Operational events experienced with presence of PV into
power system
It is well known that, on 20 March 2015, a solar eclipse took place in Europe involving a
significant PV output decrease ([15]). That involved a true stress test for pan-European
systems where different measures were successfully implemented by TSOs around
Europe ([16]):
higher operating reserves allocation (various TSOs);
19 One week for pumped storage operation planning, 2 days for whole sale market.

18
specific control logics implemented for reserve activation during the solar eclipse
(German TSOs);
cross-border NTC20 reduction (Italian TSO);
HVDC link capacity reduction up to 50% (links between Northern Europe, UK, and
CE);
preventive decrease, in Italy, of PV power production, implemented in order to
limit power dip and to have enough regulating capacity (4400 MW, around 25% of
Italian PV capacity, was put out of service from 7 a.m. to 2 p.m.).
The above and other measures allowed keeping frequency within the acceptable range of
± 50 mHz ([16]).
In the US a total solar eclipse occurred on August 21, 2017. A significant impact on the
power system was expected however, similarly to the case of Europe in 2015, the event
was less dramatic than expected because of cloudy weather and changes to customer
behavior related to the eclipse. For instance, California had expected utility-scale solar
output to drop by 4,200 MW during the event, but the actual drop was of only 3,400 MW.
Similarly, PJM Interconnection experienced a net decrease in demand of about 5,000 MW
throughout the eclipse, for a variety of factors. In any case a solar eclipse is a real challenge
for a power system largely reliant on PV generation and it is expected that similar events
will bring more impact in future as PV penetration increases.
The eclipse is more challenging since it involves huge variations of the solar infeed, first
downward and then upward, quite fast compared to the capabilities of the conventional
generating units.
Overall, an eclipse represents a rare event. Other concerns, correlated to presence of PV
into power systems, are instead ordinarily faced by all the interviewed countries. These
concerns are related to: i) PV output uncertainty and variability; ii) ability of network, at
HV level, to accommodate possible high power flows due to PV output; iii) PV tripping due
to interface protections in case of emergency operation, especially in case of old
protection settings with very narrow frequency range for PV operation. While the first
two items still represent big challenges, new protection settings are, in general, adopted
with larger frequency ranges and retrofitting programs have been implemented on the
basis of PV plant rated power, date and voltage level of connection [18].
In addition to the above issues, the progressive decommissioning of low competitive
traditional generation involves: system inertia reduction with lower inertial response in
case of frequency perturbations; lower operating power reserve; lower short circuit level
with more relevant voltage dips in case of short circuits on transmission HV level (short circuit current “ISC” of PV is around 1,1 × 𝐼𝑟𝑎𝑡𝑒𝑑 against a ISC of about 5 × 𝐼𝑟𝑎𝑡𝑒𝑑 in case of
synchronous generators).
Another possible concern consists in the changes in daily profile of net load. In case of
high PV penetration, the lower net load in central day light hours involves the risk of
20 Net transfer Capacity: the NET TRANSFER CAPACITY is the maximum total exchange program between
two adjacent control areas compatible with security standards applicable in all control areas and taking into
account the technical uncertainties on future network conditions.

19
overgeneration since a minimum amount of traditional generation is required for
operational security (e.g. balancing reserve). In the evening, the decreasing PV output
involves higher upward ramps of net load with consequent risk of slow system response
to load ramp.
Belgium and Germany
PV output deviations from expected forecast (e.g. due to fog/low stratus) can assume
relevant values, if compared with power system regulating capacity, in Germany and
Belgium. In particular forecast error may involve power shortage in case of fog and low
clouds involving a high sky covering.
In Germany the amount of PV shortage, due to forecast errors, may be in the order of
several GWs, for several hours.
In Belgium voltage problems on the distribution level can result in the disconnection of
DG equipment.
RES curtailment, in order to relief transmission lines, is a periodic practice in Germany
but it is mainly performed because and on wind generation.
Greece
Small amount of PV power shortage can occur in Greece because of voltage dips at
distribution level. Shortage duration is usually of minutes. In case of frequent events, the
window of voltage operation is changed for the affected grid segment.
Italy
In Italy, even if most of PV capacity is installed on distribution level, the aggregated high
volumes of PV production impact of HV and EHV transmission grid, especially in areas with
low local demand. Power reversal, from MV to HV level, was observed for the 5% of yearly
hours (y. 2015) in 793 HV/MV primary substations ([19]), involving possible congestions at
HV and up to EHV level (>200 kV) with consequent establishment of different market zones
and different clearing prices involving lower global efficiency of energy market results in
comparison to a unique clearing price. Congestions are, in particular, highlighted in the south
and in the Sicily and Sardinia island where the highest share of RES capacity is installed and
where transmission capacity is lower due to the weakly meshed topology of the grid.
Of particular interest is the system operational security of the two main islands, namely
Sicily and Sardinia. On May 18th 2011, Sicily was affected by the tripping of 200 MW PV
generated power due to old protection frequency settings (49.7≤f≤50.3Hz), after the
outage of a conventional thermal plant (150 MW). These events involved load shedding
due to under-frequency and pointed out the need of larger frequency ranges for PV
operation. At present, large frequency ranges for new PV plants and retrofitting programs
have been adopted. Traditional generation displacement is a significant issue for security
of power system operation in the Sardinia island, asynchronously interconnected to
mainland with two HVDC systems: the old LCC21 HVDC 300 MW SA.CO.I.22 and the newer
LCC 2x500 MW SA.PE.I.23. The expected refurbishment or SA.CO.I is being evaluated with
adoption of VSC converter technology in order to overcome possible limits due to the
minimum short circuit level on power system and to support voltage regulation.
21 Line Commutated Converter. 22 SArdina – COrsica – Italian peninsula three-terminal monopolar HVDC. 23 SArdina – Italian PEninsula two-terminal bipolar HVDC.

20
Concerning the daily profile of net load, Figure 2 depicts the Italian gross and net load
evolution in the working days of March, comparing the years 2011 and 2013: while the
gross load is almost unchanged, it can be seen how the net load changes as consequence
of the PV capacity ([19]) increase from 2011 (12.8 GW) to 2013 (18.4 GW). In order to
face the daily net load steeper ramps, faster switch-on/off cycles of traditional thermal
generation are required in addition to the improvement of regulating power ramps.
Figure 2: Net and gross load profile evolution in the working days of March in Italy (source AEEGSI
[20])
Japan
In Japan, large amount of PV deployment is unevenly going on over 10 balancing areas. In
Kyushu, one of the balancing areas, it is expected to make PV generation curtailment due to
overgeneration in terms of demand supply balance as a total area in the near future, dependent
on the power demand, base load generation, and interconnection capacity.
2.6 PV requirements in case of frequency and voltage deviations
This paragraph summarizes the requirements in terms of PV range of operation, in the
interviewed countries, with the aim to help the definition of the consequences of possible
large perturbations occurring on power system and interacting with PV protections.
Larger frequency operational ranges are in general required, in comparison with the past,
by recent developments of national grid codes and, in some cases, a certain frequency
droop control is required if over-frequency occurs.
Table 12 summarizes the main requirements in terms of frequency and voltage ranges of
operation, respectively for PV on LV, MV and HV voltage levels. It can be noted that:
in Japan, no underfrequency range is required for PV operation at all voltage levels;
in Greek, despite the general change, quite stringent frequency limits for PV
operation in mainland (on all LV, MV, HV levels): 49.5- 50.5Hz is adopted;
LVRT24 capabilities are in general required for PV at MV and HV voltage levels;
on LV level LVRT is required in Italy, on the basis of the rated size, and Japan while
it is under discussion in Germany.
24 Low Voltage Ride Through “LVRT” is the capability of electric generators to stay connected in short periods
with low voltage, e.g. residual voltage in case of voltage dips due to short circuits. It is needed to avoid a
widespread loss of generation in case of short circuit, on HV or EHV levels.

21
Table 12: LV level PV requirements in case of voltage and frequency deviations
PV size
[kW]
Voltage range
Vmin÷Vmax
[% of Vnominal]
LVRT capability
(Yes/no)
Frequency range
fmin÷fmax ensured
[Hz ]
Frequency droop
(Yes/No) Year of connection
Be
lgiu
m
5 +/-15% No
(within 0.2 sec) 47-51 No /
Ge
rma
ny
all
+/- 10%,
-15% +10%
(depending on
time interval &
probability acc.
EN50160)
No 47.7-51.5
Yes
∆P=40% PM pro Hz
([21])
From 2012
Gre
ece
≤100 Mainland
-20% +15% No 49.5-50.5 No
≤100 Autonomous
Power
Systems
(Islands)
-20% +15% 47.5 - 51.5
Ita
ly (
[22
],[2
3])
PN≥1 kW -15% +10% No 49≤f≤51 From 01/04/2012 to
30/06/2012
PN≥1 kW -15% +10% No 47.5≤f≤51.5 No From 01/07/2012 to
31/12/2012
PN≥1 kW -15% +10% No 47.5≤f≤51.5
Yes
2.4%Pinj in the over-
frequency range
50.3≤f≤51.5Hz
After 31/12/2012
AN≥6 kVA -15% +10% Yes
(see Figure 4) 47.5≤f≤51.5
Yes
2.4%Pinj in the over-
frequency range
50.3≤f≤51.5Hz
After 31/12/2012
6≤PN≤20kW (retrofitting)
-15% +10% 49≤f≤51 Before 01/04/2012
Sw
itz.
Same as in Germany (EN50160)
Jap
an
< 50kW
95 – 107 [V]
182 – 222 [V]
Yes
Voltage dip
amplitude: over
80% of rated
value
Duration time: 1s
50.0 +0.8,-0
60.0 +1.0,-0
Yes
(Step Shape)
0.8Hz for 50Hz
1.0Hz for 60Hz
(Ramp Shape)
47.5-51.5 Hz for 50Hz
57.0-61.8 Hz for 60Hz

22
Table 13: MV level PV requirements in case of voltage and frequency deviations
PV size
[kW]
Voltage range
Vmin÷Vmax
[% of Vnominal]
LVRT capability
YES/NO
Frequency range
fmin÷fmax ensured
[Hz ]
Frequency droop Year of
connection
Be
lgiu
m
n.a. n.a. n.a. n.a. n.a. n.a.
Ge
rma
ny
All
+/- 10%,
+/- 15%
(depending on
time interval &
probability acc.
EN50160)
Yes
(see Figure 3)
47.5-51.5
(suggested setting
BDEW MS-RL; [24])
Yes - Compare LV From 2009
Gre
ece
100 to
~5MWp
-15% +10%
(but also
depending on
local conditions)
No 49.5- 50.5 No
Autonomous
Power
Systems
(Islands)
-15% +10%
(but also
depending on
local conditions)
47.5- 51.5
Ita
ly (
[23
])
PN≥1 kW -15% +10% No
47.5≤f≤51.5
(in case of
transients due to
HV level)
49.7≤f≤50.3
(in case of
transients due to
MV level)
No
From
01/04/2012 to
30/06/2012
PN≥1 kW -15% +10% No
47.5≤f≤51.5
(in case of
transients due to
HV level)
49.7≤f≤50.3
(in case of
transients due to
MV level)
Yes
2.4%Pinj (in the over-freq.
range 50.3≤f≤51.5Hz)
From
01/07/2012
AN≥6 kVA -15% +10% Yes
(see Figure 4)
47.5≤f≤51.5
(in case of
transients due to
HV level)
49.7≤f≤50.3
(in case of
transients due to
MV level)
Yes
2.4%Pinj (in the over-freq.
range 50.3≤f≤51.5Hz)
From
01/07/2012
PN≤50 kW (retrofitting)
-15% +10% No 49≤f≤51 No Before
01/04/2012
PN≥50 kW (retrofitting)
-15% +10% No
47.5≤f≤51.5
(in case of
transients due to
HV level)
49.7≤f≤50.3
(in case of
transients due to
MV level)
No Before
01/04/2012
Jap
an
50kW-2MW
Maintain the LV
voltage at
regulated range
Same as for LV Same as for LV Same as for LV

23
Table 14: HV level PV requirements in case of voltage and frequency deviations
PV size
[kW]
Voltage range
Vmin÷Vmax
[% of Vnominal]
LVRT capability YES/NO
Frequency range
fmin÷fmax ensured
[Hz ]
Frequency droop Year of
connection
Be
lgiu
m
n.a. n.a. n.a. n.a. n.a. n.a.
Ge
rma
ny
All - Yes
47.5-51.5 Hz
(suggested setting
VDE AR-N 4120;
[25])
Yes
Compare LV
Gre
ece
>5MWp -15% +10% No 49.5- 50.5 No
Ita
ly([
27
])
All -15% +10% Yes
(see Figure 5) 47.5≤f≤51.5
Yes
2.4%Pinj
(in the freq. range
50.3≤f≤51.5Hz)
Jap
an
>2MW
Maintain the LV
voltage at regulated
range
Same as for LV Same as for LV Same as for LV
2.6.1 Germany
Figure 3 depicts the LVRT capability required to PV on MV level: different schemes for
tripping are foreseen on the basis of amplitude of voltage dip and time duration. In all
cases, a 100% voltage dip (i.e. null residual voltage) has to be tolerated for, at least,
150 ms.
Figure 3: LVRT capability – MV level PV; Germany (According to [24])
2.6.2 Italy
In Italy, a 100% voltage dip has to be overcome without tripping respectively for:
at least 200 ms, in case of PV plants with rated power Prated≥6kVA and connected
to distribution MV and LV level (Figure 4);
at least 150 ms, in case of PV plants connected to transmission HV and EHV levels
(Figure 5).

24
Figure 4: LVRT capability – MV and LV levels PV (Prated≥6kVA); Italy (graphic based on [26])
Figure 5: LVRT capability – HV level PV; Italy (graphic based on [27])
Concerning frequency relays protection, islanding operation of distribution grid must be
avoided. Therefore protections of MV level PV have to distinguish between the fast
frequency perturbations, due to distribution grid islanding or faults, and the usually slow
frequency deviations due to perturbations at transmission level. In case of fast frequency
variations, the narrow operational range “49.7 ≤ 𝑓 ≤ 50.3” has to be enabled while, in
case of slow variations, the larger range “47.5 ≤ 𝑓 ≤ 51.5” has to be ensured.
Without remote signals, the activation of the narrow range (faults on MV level) can be
triggered by means of one of the following functions:
PV tripping
allowed zone
0
5
10
15
20
25
30
35
40
45
50
55
60
65
70
75
80
85
90
95
100
105
-10
0 01
00
20
03
00
40
05
00
60
07
00
80
09
00
10
00
11
00
12
00
13
00
14
00
15
00
16
00
17
00
18
00
19
00
20
00
21
00
22
00
23
00
24
00
25
00
26
00
27
00
28
00
29
00
30
00
31
00
32
00
33
00
34
00
35
00
36
00
37
00
38
00
39
00
40
00
41
00
42
00
43
00
44
00
45
00
46
00
47
00
48
00
49
00
50
00
Vo
lta
ge
[%
Vn
om
]
Time [ms]
132-150kV 220kV 380kV

25
maximum homopolar voltage 𝑉0 for detection of short circuits “phase-ground”; maximum inverse sequence voltage 𝑉𝑖 for detection of two-phase short circuits
insulated from ground;
maximum direct sequence voltage 𝑉𝑑 for detection of three-phase or two-phase
short circuits insulated from ground.
The above logic is represented in Figure 6.
Figure 6: Logical scheme for activation of frequency relays with unblocking based on voltage;
MV level PV - Italy (scheme based on [26])
The following Figure 7 depicts a possible logical schemes also based on remote signals
([26], [28]).
f<47.5 Hz
f>51.5 Hz
f<49.7 Hz
f>50.3 Hz
or
Vo>threshold
Vi>threshold
Vd>threshold
or
&
f
V
Delayed tripping 1.0s
Delayed tripping 0.1s
Delayed tripping 4.0s

26
Figure 7: Logical scheme for activation of frequency relays with voltage unblocking, tripping and
enabling of restrictive thresholds from remote. MV level PV - Italy (scheme based on [26], [28])
In case of LV level PV, the required frequency range is only the largest one“47.5 ≤ 𝑓 ≤ 51.5”
since needs of the global system are considered predominant in comparison with the local
distribution grid ones. That is allowed because of the static nature of PV: indeed, unlike the
rotating machines, no torsional torques may occur, even if an asynchronous re-closure on MV
level is operated after a local fault.
3 Existing flexibility resources
Highly performant ancillary services are gaining more and more importance as the
penetration of RES is increasing in the power system. In particular, high penetration of PV
may lead to an increase in needed operating reserves since the system must be prepared
for any sudden PV output fluctuations, on the basis of solar irradiance and clearness sky
condition. Moreover, progressive traditional generation displacement, because of higher
RES competitiveness or priority of dispatch, involves lower flexibility in terms of lower
power reserve, lower system inertia (higher frequency fluctuations) and lower short
circuit power (lower voltage support).
This chapter collects the survey results about the present status of flexibility resources
and of the national practices about the operation power reserves. The aim is to supply
proper information for analyses and simulations to be performed in PV integration
studies.
f<47.5 Hz
f>51.5 Hz
f<49.7 Hz
f>50.3 Hz
or
Vo>threshold
Vi>threshold
Vd>threshold
or
&
f
V
Delayed tripping 1.0s
Delayed tripping 0.1s
Delayed tripping 4.0s
Enabling restrictive thresholds by remote signal
TELETRIPPING Instantaneous tripping

27
3.1 Situation of flexibility resources
Table 15 shows the flexibility resources adopted, in the interviewed countries, in order to
balance demand and generation; they are, in general, market regulated with the exception
of Japan.
Table 15: Flexibility resources adopted for power balancing
Belgium Switz. Germany Greece Italy Japan
Open Cycle Gas
Turbine (OCGT) X
Combined Cycle
Gas Turbine (CCGT)
Conventional
thermal p.p.
Hydro Power Plant X
Hydro Pumped
Storage
Interruptible load X X
Battery storage for
frequency control X
Pilot project X
Pilot projects
Pilot
projects
Interconnections for
primary FCR capacity
sharing
FACTS
FACTS
HVDC
HVDC
HVDC
FACTS
HVDC
Regulation scheme
market &
bilateral
agreements
with TSO/ISO
market
market
market
market &
bilateral
agreements
with TSO/ISO
managed
by
VIUs/TSOs
(: adopted x: not adopted)
Conventional dispatchable power generation plants are a traditional source of flexibility
even if, in some cases (e.g. thermal), performances improvement is recommended.
Battery storage is instead at early stages. In Italy, two pilot projects25 have been set up: i)
the so-called “Energy-Intensive” project involving 35 MW of storage systems installed in mainland, whose first aim is to reduce the curtailment of wind generation due to sub-
transmission grid constraints, incrementing the transmission grid’s capacity to absorb RES output; ii) the so-called “Power-Intensive” projects involving the installation of 2 x 8
MW batteries in the two major Italian islands with the aim to improve security of
operation, supplying Frequency Containment Reserve (e.g. with Fast Frequency
Responses [29]).
Information about the main performances of flexible generation is shown in Table 16 and
in Table 17. Changes in solar irradiance may occur in short timescales therefore
conventional generators have to be capable of changing their output quickly with large
25 Info available at web address:
https://www.terna.it/en-gb/azienda/chisiamo/ternastorage.aspx.
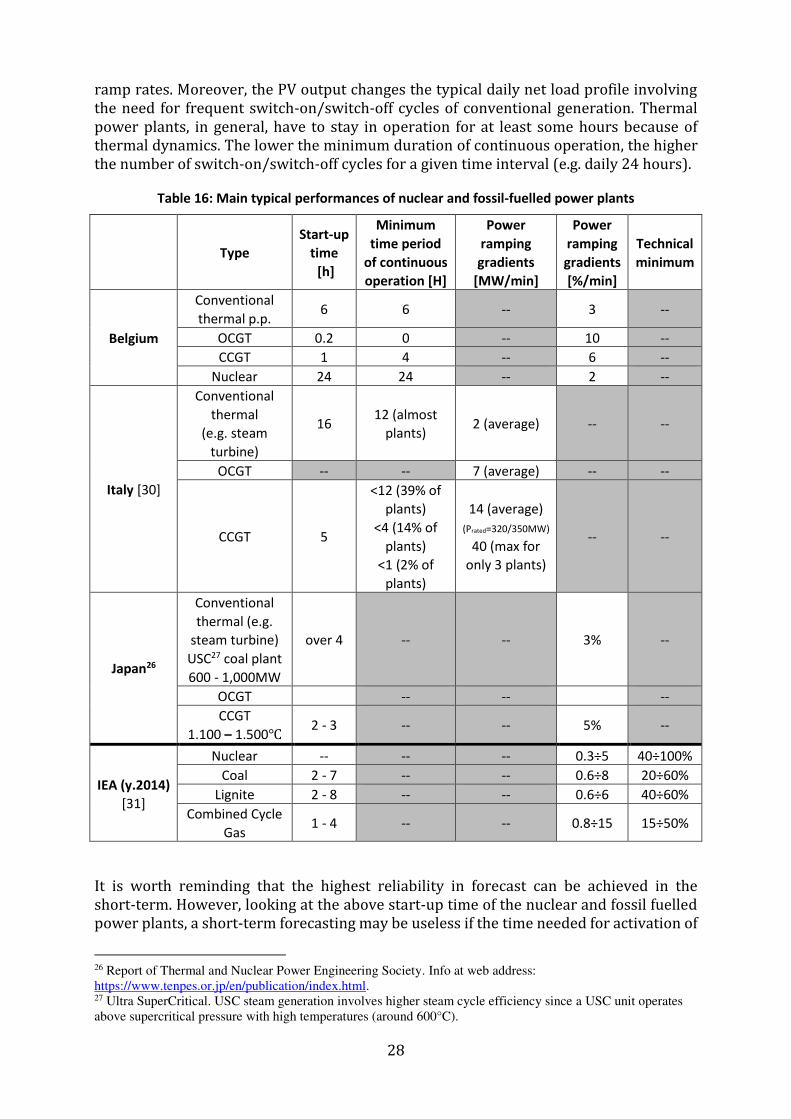
28
ramp rates. Moreover, the PV output changes the typical daily net load profile involving
the need for frequent switch-on/switch-off cycles of conventional generation. Thermal
power plants, in general, have to stay in operation for at least some hours because of
thermal dynamics. The lower the minimum duration of continuous operation, the higher
the number of switch-on/switch-off cycles for a given time interval (e.g. daily 24 hours).
Table 16: Main typical performances of nuclear and fossil-fuelled power plants
Type
Start-up
time
[h]
Minimum
time period
of continuous
operation [H]
Power
ramping
gradients
[MW/min]
Power
ramping
gradients
[%/min]
Technical
minimum
Belgium
Conventional
thermal p.p. 6 6 -- 3 --
OCGT 0.2 0 -- 10 --
CCGT 1 4 -- 6 --
Nuclear 24 24 -- 2 --
Italy [30]
Conventional
thermal
(e.g. steam
turbine)
16 12 (almost
plants) 2 (average) -- --
OCGT -- -- 7 (average) -- --
CCGT 5
<12 (39% of
plants)
<4 (14% of
plants)
<1 (2% of
plants)
14 (average)
(Prated=320/350MW)
40 (max for
only 3 plants)
-- --
Japan26
Conventional
thermal (e.g.
steam turbine)
USC27 coal plant
600 - 1,000MW
over 4 -- -- 3% --
OCGT -- -- --
CCGT
1.100 – 1.500℃ 2 - 3 -- -- 5% --
IEA (y.2014)
[31]
Nuclear -- -- -- 0.3÷5 40÷100%
Coal 2 - 7 -- -- 0.6÷8 20÷60%
Lignite 2 - 8 -- -- 0.6÷6 40÷60%
Combined Cycle
Gas 1 - 4 -- -- 0.8÷15 15÷50%
It is worth reminding that the highest reliability in forecast can be achieved in the
short-term. However, looking at the above start-up time of the nuclear and fossil fuelled
power plants, a short-term forecasting may be useless if the time needed for activation of
26 Report of Thermal and Nuclear Power Engineering Society. Info at web address:
https://www.tenpes.or.jp/en/publication/index.html. 27 Ultra SuperCritical. USC steam generation involves higher steam cycle efficiency since a USC unit operates
above supercritical pressure with high temperatures (around 600°C).

29
the available flexibility resources may amount to some hours. In other words, the above
plants cannot be used to cope with RES forecast short-term updates if they are off.
Short-term time horizon for the operational planning is suitable for dispatching quick-
start generators, e.g. pumped storage hydro power plants, latest generation combined
cycles or open cycle gas turbines).
Table 17: Main typical performances of typical hydro power plants and pumped storage
Type Start-up time Power ramping gradients
Belgium
Hydro power plants -- --
Hydro pumped
storage 1 min 1000 [MW/min]
Italy [30]
Hydro power plants -- 18 (average) [MW/min]
Hydro pumped
storage -- 187 (average) [MW/min]
IEA (y.2014) [31] Reservoir hydro -- 15-25 [%/min]
3.2 National practice about operating power reserves
One of the most important ancillary services is maintaining the frequency within the given
margins by continuous modulation of active power. This capacity can be defined as
Operating Reserve ([32]) or Control Reserves ([33]) (or Operational Reserve; [34]).
Power unbalances may occur on different time scales, from seconds to days, and different
control strategies may be required depending on the speed of the variability. A general
way of classifying operating reserves could be based on whether they are deployed during
normal conditions or event conditions (e.g. tripping of a generator or load). Indeed, the frequency then must be corrected back to its scheduled setting and the system’s ACE (Area Control Error) must be reduced to zero during both instantaneous and non-
instantaneous events. A certain amount of replacement reserves has then to be allocated
in order to protect the system against possible further contingencies.
Standards about operating reserve are generally based on certain reliability criteria and
allowable risk criteria, but often differ, sometimes substantially, from balancing area to
balancing area. The following Operating Reserve classification will be based on definitions
used in North America and in Europe, specifically looking at the North American Electric
Reliability Corporation (NERC; [32]) and the European Network of Transmission System
Operators (ENTSO-E; [33], [34]).
NERC standards distinguish Operating Reserves under normal and contingency
conditions. Under normal conditions:
regulating reserves: online resources, on Automatic Generation Control (AGC),
that respond for upward and downward power activation aimed to compensate
minute-to-minute power fluctuations.
load following (or fast energy markets): similar to regulating reserves but
slower. Bridges between the regulation service and the hourly or sub-hourly
energy markets.
Under contingency conditions:

30
spinning reserve: online generation, synchronized to the grid, that can begin to
increase output immediately in response to a frequency change in case of relevant
generator or transmission outage and can reach full output within few minutes to comply with NERC’s Disturbance Control Standard (e.g. 10 minutes)
non spinning reserve: same as spinning reserve but not immediate initial
response; resources can be offline but still must be capable of reaching full output
within few minutes.
replacement reserves: reserve is used to restore spinning and non-spinning
reserves to their pre-contingency status; response time in tens of minutes (e.g. 30-
60 min).
ENTSO-E standards distinguish for Continental Europe (CE) the Control Reserve:
Primary Control Reserve (Frequency Containment Reserve FCR) - The
primary control reserve is the (positive/negative) part of the primary control
range measured from the working point prior to the disturbance up to the
maximum primary control power. The primary control range is the range of
adjustment of primary control power, within which primary controllers can
provide automatic control, in both directions (upward/downward), in response to
a frequency deviation (time fame activation within seconds)
Secondary Control Reserve (automatic Frequency Restoration Reserve
aFRR) - The positive/negative secondary control reserve is the part of the
secondary control range between the working point and the maximum / minimum
value. The secondary control range is the range of adjustment of the secondary
control power, within which the secondary controller can operate automatically,
in both directions at the time concerned. Secondary control aims to keep or to
restore the power balance in each control area and, consequently, to keep or to
restore the system frequency to its set-point value (e.g. 50 Hz) and the power
interchanges with adjacent control areas to their programmed scheduled values,
thus ensuring that the full reserve of primary control power activated will be made
available again. These actions of secondary control will take place simultaneously
and continually, both in response to minor deviations (inevitable occurrences
during normal operation) and in response to a major discrepancy between
production and consumption (e.g. tripping of a generator or network
disconnection).
Tertiary Control Reserve (manual Frequency Restoration Reserve mFRR) -
The power which can be connected (automatically or manually) under tertiary
control, in order to provide an adequate secondary control reserve. This reserve
must be used in such a way that it will contribute to the restoration of the
secondary control range when required. The restoration of an adequate secondary
control range may take, for example, up to 15 minutes, whereas tertiary control
for the optimization of the network and generating system will not necessarily be
complete after this time.
3.2.1 Reserve requirements
This section is focused on general requirements by TSO/ISO about operating reserves.

31
Detailed information on the whole pan European system is available on ENTSO-E website
([35], [36]).
In particular Table 18, Table 19 and Table 20 synthesize the information supplied by the
interviewed countries. Even if it is not complete and restricted to interviewed countries,
this information provides support for system adequacy evaluation, in terms of availability
of proper reserve margins, and dynamic analysis of power systems (e.g. TSA in case of
large perturbations with consequent power reserve deployment).
Procurement and payments schemes for operating reserve are summarized in Table 21.
Table 18: Present national requirements about primary reserve (FCR)
Belgium Germany Italy Switzerland Japan
Provider generators &
demand
generators &
demand generators
generators (demand
could, normally
doesn't)
Generators
Minimum allowed
rated power of
participating units
None 1MW per pool 10 MVA 1 MW --
Permanent frequency
droop adopted --
Adopted (5%
thermal, 4%
hydro,2.4wind
and PV
downward)
2-12% --
Reserve deployment
Time
1/2 of reserve
within 15 sec;
whole reserve
within 30 sec
30s
1/2 of reserve
within 15 sec;
whole reserve
within 30 sec
2-15/30s --
Minimum frequency
deviation for control
activation (e.g.
deviation beyond a
dead band)
100 mHz ±20mHz ±20 mHz 0 to 500 mHz --
Minimum ramp rate -- 200%Reserve/min 3%Pnom/min --
Minimum reserve time
duration 15 minutes 15 minutes 15-30 minutes --
Time distance between
reserve allocation and
real time
day-ahead about 6 till 13 days
from hours
ahead to day-
ahead -- --
Reserve margin
allocated -- -- 1.5% Pnom -- --

32
Table 19: Present national requirements about secondary reserve (aFRR)
Belgium Germany Italy Switzerland Japan
Provider
Generators
and Demand,
Pumped
Storage
Generators and
Demand Generators
Generators
(ongoing
projects for
Demand)
Generators
Minimum allowed
rated power of
participating units
5 MW 5 MW per pool 10MVA 5 MW --
Reserve deployment
Time
30 sec to 15
minutes 300 sec sec to 15 minutes -- --
Activation Automatic Automatic Automatic Automatic --
Minimum ramp rate Fully available
after 30
seconds
20%Prated/min 1%Reservemargin /
2sec -- --
Minimum reserve
time duration 15 min none 2 h -- --
Time distance
between reserve
allocation and real
time
day-ahead about 6 till 13
days
from hours ahead to
day-ahead weekly auctions --

33
Table 20: Present national requirements about tertiary reserve (mFRR)
Belgium Germany Italy Switzerland Japan
Provider
Generators and
Demand and
Pumped Storage,
(also Distribution
level)
Generators
and Demand Generators Generators Generators
Minimum allowed
rated power of
participating units
None 5 MW per
pool 10MVA 5 MW --
Reserve deployment
Time
15 min for R3-
PROD
(conventional
production), 3
minutes for
R3DP (demand
response)
15 min
15min for
replacement of
secondary reserve or
120min for balancing
load, RES, and forced
outages of
conventional
generation
tender blocks of
4h (bids must fit
into such a
block)
--
Activation Manual Manual Manual Manual --
Minimum ramp rate Full delivery in
15 minutes
6.6%
[%Prated/mi
n] coming
from the
deployment
time
10 MW/15min or
50MW/min gradient
in case of secondary
reserve replacement.
no ramps for
tertiary control --
Minimum reserve time
duration
No minimum,
but maximum of
8 hours (R3-
PROD),
maximum 4 or 8
hours (R3DP)
15 min
No minimum, with
exception of 4 h for
reservoir hydro
power plants
within a 4h
tender blocks --
Time resolution for the
margin allocation -- 4 hours 1 hour 15 min --
Time distance between
margin allocation and
real time
day-ahead
day-ahead
till days
ahead
from hours ahead to
day-ahead -- --
Table 21: National procurement/payment roles for operating reserves
Primary reserve (FCR) Non-spinning reserve or
secondary reserve (aFRR)
Replacement reserve or
tertiary reserve (mFRR)
Belgium Monthly tender/reservation
price €/MW
Tenders & reservations free bids/
reservation price €/MW and capped activation price €/MWh free activation
price €/MWh
Tenders & reservations free bids/
reservation price €/MW and capped activation price €/MWh free activation
price €/MWh
Germany org. Market/pay as bid/uplift
component in final energy price for
consumer (network tariff)
org. Market/pay as bid/capacity costs
paid by consumers (network tariff).
org. Market/pay as bid/costs paid by
consumers "uplift". Capacity costs paid
by consumers, activation costs paid by
unbalancing responsible parties.
Italy
Mandatory provision with fixed
%Prated of committed units
Not remunerated, unless ad-hoc
meters installed
Cost recovery scheme: paid by
consumers within the “uplift” component of the final energy price
Procurement scheme: Organized
Market
Payment rule: Pay as bid
Cost recovery scheme: paid by
consumers within the “uplift” component of the final energy price
Procurement scheme: Organized Market
Payment rule: Pay as bid
Cost recovery scheme: paid by
consumers within the “uplift” component of the final energy price
Switzerland
org. Market/pay as bid (energy is not
compensated)/paid by consumer
within the "uplift" component on
final energy price
org. Market (volume defined by TSO,
approx. 400MW/pay as bid/paid by
consumer within the "uplift"
component on final energy price
org. Market/pay as bid/paid by
consumer within the "uplift" component
on final energy price
Japan
Basically, each VIU procures each
reserve by the integral operation of
own generation and transmission
sections
Basically, each VIU procures each
reserve by the integral operation of
own generation and transmission
sections
Basically, each VIU procures each reserve
by the integral operation of own
generation and transmission sections

34
4 Innovative flexibility resources including demand response
Changes of PV output span in a wide range of timescales with consequent different kind
of impact on the power system: i) seconds/minutes with impact on power quality, power
reserve and load following; ii) hours/days with impact on unit commitment. The expected
matters for operation, in the interviewed countries, are shown in Table 22.
Table 22: elements affected by PV evolution in the interviewed countries
Belgium Germany Italy Japan
V control at distribution Level
Frequency control (Balancing) at Transmission Level
Balancing in interaction between transmission and distribution
V control in interaction between transmission and distribution
Looking at the above PV impacts on power system, it is necessary to identify new highly
performant flexibility resources, which are quickly available if needed, such as demand
response. This latter, in addition to remote controlled output modification of distributed
generation (hereinafter, DG output modification), involves the need of smart grids based
on ICT infrastructures allowing observability and controllability of the grid, also at
distribution level. ICT is needed to help system operation performed by TSOs, for the
whole system security (voltage and frequency stability in addition to congestion
management at transmission level), and DSOs for implementation of actions requested by
TSOs commands or needed in order to solve local problems (e.g. local under/overvoltage,
congestions).
Innovative solutions are presented hereinafter in this chapter. The aim is to highlight the
most promising flexibility resources and their characteristics on the basis of the national
developments.
4.1 List of innovative solutions
The Table 23 and the Table 24 list the possible innovative flexible resources respectively
for LV-MV and HV-EHV levels in Belgium, Italy and Japan. The state of the art of these
flexible resources is represented so as to understand which are the solutions with the
main chance to be exploited.
The innovative flexibility solutions at distribution MV level are used for the requirements
at distribution and transmission levels. In this report we further discuss about the latter.

35
Table 23: innovative flexibility resources at distribution MV level
Type Sub type Belgium Italy Japan
Demand Response
Industrial load
Household load
Electric vehicles
PV output modification n.a. ([17])
n.a.
Storage
Battery Li-ion
Battery Vanadium Redox
Battery NaS
Flywheel28
SMES29
Supercapacitor
Heat storage
Battery storage associated with PV30 for
fast frequency control supply
Battery storage associated with wind
generators for synthetic inertia supply
Line Dynamic Thermal Rating31
studied
endorsed
planned/under construction
commissioned
28 Flywheel works by accelerating a rotor to a high speed and maintaining the energy in the system as rotational
energy. 29 Superconducting Magnetic Energy Storage systems store energy in the magnetic field created by the flow of
direct current in a superconducting coil. 30 PV generation systems cannot provide inertial response unless innovative solutions are adopted: e.g.
synthesizing an inertia emulator by means of utilization of battery energy storage systems (BESS) together with
proper inverters aimed to simulate a traditional generator inertial response. 31 Maximizing line capacities exploiting the temperature variability due to climatic conditions. By this way, a
lower amount of network congestions is highlighted and, consequently, lower is the possible need of RES
curtailment for congestion management.

36
Table 24: innovative flexibility resources at transmission HV level
Type Sub type Belgium Italy Japan
Demand Response Industrial load
PV output modification n.a. [27]
n.a.
Storage
Battery LI-ion Battery Vanadium Redox
Battery NaS
Flywheel
SMES
Supercapacitor
Heat storage Seawater pumped storage
Conventional PHS
Battery storage associated with PV for
fast frequency control supply
Battery storage associated with wind
generators for synthetic inertia supply
Synthetic inertia associated with wind n.a. n.a. n.a.Enhanced performant thermal power
plants
Line Dynamic Thermal Rating
Cross-border balancing market
HVDC VSC links
FACTS devices
studied
endorsed
planned/under construction
commissioned
Concerning demand response, this option is worldwide endorsed and participation of
electric vehicles is in general considered a reasonable opportunity. Indeed, EVs may
behave as a load, a supplier of electricity to the grid or an energy storage device and, by
means of smart grid enabling technologies, utilities can manage EVs charging time and
rates. At every voltage level, industrial/commercial can have the flexibility to adjust their
energy consumption for production processes or air conditioning but also household, at
low voltage level, can participate in DR thanks to smart grid technologies availability.
PV output modification is presently achieved by means of local logics, e.g. over-frequency
droop or tripping based on local frequency signal. The innovative concept is based on
adoption of remote signals/commands sent by TSO or by DSO on request of the TSO.
Remote signals may be also sent automatically, in the future, by innovative special
protection schemes based on identification of critical events (e.g. contingencies) or based
on monitoring of selected system quantities and aimed to preserve operational security.
Despite the present high costs, battery energy storage BES for ancillary services is one of
most promising kinds of flexible resources with high performances in terms of response
speed; it is commonly considered a solution but, in general, at early stages on MV level

37
(Table 23). On HV level (Table 24) battery storage is already planned in Japan and some
pilot projects are adopted in the main islands of Italy (Sicily and Sardinia).
Synthetic inertia32 can be supplied by BES associated to wind while BES association with
PV generation can be exploited for fast frequency control 33 provision. In case of
converter-based WIND, synthetic inertial response can be gained by increasing or
decreasing the turbine speed, without need of BES. Inertial response requirements have
been already defined within the Grid Code of Hydro Quebec Transénergie (HQT) – Canada
([37];[38]): wind power plants with a rated output grater then 10 MW must be equipped
with a frequency control system. The Irish Commission of Energy Regulation has
published the technical definitions of the synthetic inertia to be considered as ancillary
service ([37], [39]). The ENTSO-E Network Code on Requirements for generators allows
system operators to require emulate inertial response from wind generators, depending
on their size and geographical location ([40]). In Brazil, the Operador Nacional do Sistema
Elétrico (ONS) is changing the grid code and already added, in the auctions rules, the
requirement that all WPPs, connected at transmission HV level, need to provide reserve
in case of events of under frequencies, using synthetic inertia ([37]).
Concerning the enhanced performant thermal power plants, in the context of AEEGSI34
survey for the consultation n. 557/2013 ([30]), the Italian TSO “TERNA” implemented a
study on flexibility resources. In this study, the main highlighted improvements are: 1)
need of starting time (between TSO command and reaching of minimum generated
power) lower than 2 hours in order to allow activation of tertiary reserve in real time; 2)
a lower number of hours of continuous operation of thermal power plants in order to
follow the new profile of net load by many daily cycles characterized by hours with very
low values followed by hours with high values (4÷8 hours in operation and 4÷6 hours out
of service); 3) fast ramp (about 50MW/min) in order to follow the fast upward load ramps
in the evening when the high share of PV generation decrease; 4) need of a higher amount
of enabled plants for dispatching services supply in order to get a higher amount of
downward reserve since it seems to be not enough for perspective analysed scenarios. In
conclusion, the ancillary services market should be organized in order to incentivize
higher performances of plants enabled to supply these services.
4.2 Flexibility on the demand side obtained through demand
response
The development of innovative demand response services can allow, for customers, the
possibility to control their power exchange and to change their consumption patterns.
The basic purpose of Demand Response DR is to lower or shift consumption during
periods of high wholesale market prices. Anyway, Demand Response DR is worldwide
endorsed (see also Table 25) in order to be exploited for peak shaving, valley filling, power
balancing and congestion management. Peak shaving and valley filling have the purpose
of improving the grid accommodation capacity of power flows in case of highly variable
net load. Figure 8 depicts the DR usefulness in case of net load (or residual load) affected
by high PV penetration in the midday hours.
32 Proportional-derivative control of frequency (emulation of inertial response of synchronous machines). 33 Proportional control of frequency. 34 Italian Regulatory Authority for Electricity Gas and Water.

38
Figure 8: demand response application with variable residual (net) load
Power balancing by means of DR can face the on-going displacement of traditional
regulating generation in the context of the increased variability of generation due to
not-programmable renewable sources. Congestion management, also at transmission
level, may be then supported by means of control of demand aimed to match power flows
with grid transmission and distribution capacity.
Potential drivers of DR may be: the average retail price of electricity, a proper electricity
market structure, the presence of a dedicated demand-side policy/regulation, the
generation mix with high level of renewables penetration and reduced reserve margins.
In Belgium, DR is used in order to provide balancing services for TSO. Large consumers
on transmission and distribution level are involved.
In Italy, DR is not yet used and the transmission grid code of the national TSO doesn't
consider load units as possible sources for dispatching services. Indeed, at present, only
disconnection of preselected loads from power system is implemented in order to
maintain security of operation. A change in the next years is anyway expected; after all
demand participation into ancillary and balancing services market has been yet approved
by directive EU 2012/27 on energetic efficiency accepted by Italian legislative decree
102/2014. The Italian Regulatory Authority for Electricity Gas and Water AEEGSI, with
deliberation n.111 of year 2006 (article 59.1), doesn't distinguish between generation and
demand for the integration with the TSO control systems. Anyway the presently adopted
requirement of 10 MW minimum rated power has to be modified with a lower value
allowing the participation in MSD market of loads able to supply dispatching services.
Aggregation of demand, for DR, is in general deemed as a necessary option since it is not
reasonable to integrate each participating small consumer into an ancillary services
market. Aggregators aggregate a number of individual participating customers into a
coherent group of business players and, then, combine DR capacity by entering into
contract with the participating consumer. In some cases, the aggregators have bilateral
agreements with the local distribution company LDC or an Energy Retailer to market and
manage DR activities. In other cases, aggregators are able to aggregate DR capacity and
offer it directly into the wholesale power market like any other generation resource.

39
Table 25: Status of demand response
Belgium Italy Japan Status of demand
response “DR” for system security or
reliability
Used foreseen Foreseen
Present or foreseen
DR service providers aggregator aggregator
Foreseen providers: Local
Distribution Company; Energy
retailer; Aggregator
Present/expected
DR procurement
scheme
Bilateral agreements between DR
provider and TSO/ISO
Market regulated and/or
Bilateral agreements
between DR provider and
TSO/ISO
Bilateral agreements between
DR provider and TSO/ISO
Adoption of
communication
infrastructure and
meter data systems
allowing auto-DR
implementation
no no Not yet but it is foreseen
Kind of loads
suitable for demand
response
Industrial loads. Heat pumps
(studied). Electric vehicles (studied)
Industrial loads
domestic refrigerators
water heaters
air-conditioning
electric vehicles
domestic refrigerators
water heaters
air-conditioning
vending machines
electric vehicles
Possible drivers for
users engagement
in DR
implementation
I) industrial loads (bilateral contracts
with payments);
II) Household loads (pricing
mechanism; currently not available);
III) Electric vehicles (pricing
mechanism; currently not available)
Pricing mechanism for industrial
loads, household and electric
vehicles Legislation rules for
industrial loads
4.3 Flexibility by installations of storage with adoption of new
technologies
Storage will play more and more a key role for power system operation in all the areas
with high penetration of variable renewables and several technologies are already
available for battery storage.
Battery storage
Battery storage can limit power pics and power dips due to fast meteorological changes
by means the availability of very fast control. Besides energy storage, batteries can supply
services like:
forecast error compensation
net-load levelling
frequency control,
peak shaving,
voltage control,
synthetic inertia.
At distribution level, batteries exploitation is commonly expected for load levelling, back-
up for power supply and residential management. At transmission level some
demonstrative centralized battery storage projects in Italy and Japan, have the aim to

40
verify the technical-economic feasibility of ancillary services supplied by batteries,
following commands directly operated by the system operator. As already mentioned in
chapter 3, in Italy two significant projects are being carried out about centralized battery
storage:
35 MW of “energy intensive” battery storage to improve the flexibility in managing renewable energy plants and to increase the hosting capacity of the grid in the
southern continental area of Italy;
2x8MW of “power intensive” battery storage in the two major Italian islands (Sicily and Sardinia) aimed to increase the operation security in the power systems of the
two areas.
In Japan, batteries are in commercial use or pilot stage in various use cases including:
self-consumption at houses (Lithium-ion),
load levelling (at major demands such as shopping centres),
wind firm output levelling (Lithium-ion and NaS),
transmission/distribution line voltage profile improvement under PV penetration
(Lithium-ion),
frequency regulation and net-load levelling (Lithium-ion, flow, NaS).
Pumped Hydroelectric Storage
In Belgium also PHS (Pumped Hydroelectric Storage) solution is studied (at early stage)
at transmission level, while distributed batteries storage are seen as a possible solution
only at distribution level.
In Japan, there is an amount of 25 GW pumped storage of conventional and
adjustable-speed types, including sea water pumped storage of adjustable speed type.
4.3.1 Synthetic inertia and fast frequency response supply by battery storage The inertia of the power systems is the physical “resistance” to frequency change. It is
provided by rotating synchronous machines with heavy rotors. For example, in case of
under-frequency, synchronous rotating machines convert kinetic energy into electrical
power injected to the grid, providing an instantaneous support to angular stability of the
system. Lower inertia means, for a given power unbalance, higher frequency deviations
and higher rate of change of frequency “ROCOF” (index used in various protection devices/schemes like automatic load shedding). As shown in Table 26, PV introduces null
inertia against the relevant inertia (3 to 10s) of thermal generators.
Table 26: typical inertia values for the different kind of generators
H [s]
Hydro generators 2 to 5
Combined Cycle generators 5 to 10
Steam turbine generators 3 to 8
PV and full converter wind generators 0
With increased PV generation, its effects on system inertia have to be mandatorily taken
into account, especially in the case of isolated power systems like the Japanese one or
weakly interconnected networks like the one of the Sardinia island (Italy),

41
asynchronously interconnected with the Italian peninsula i.e. without external
contribution to inertia. An example is given by the dynamic35 simulation shown in the
Figure 9 were a 10% unbalance is considered in Sardinia (perspective scenario year
2020): the total rated power of the rotating machines is 2640 MW and the generation loss
is the 10% (264 MW). Two different cases of system inertia are considered: 𝐻 = 4.14 𝑠
(blue curve), like around the presents situation, and H=2.07 s (red curve), assuming a high
penetration of PV and full-converter wind generation. It can be seen how, lower inertia
involves larger frequency excursions and ROCOF; this simulated case is not critical36 but
shows how lower inertia can involve an increased probability of under frequency load
shedding.
Figure 9: Dynamic simulation, with different values of inertia, of a big thermal generator loss in the
Italian Sardinia Island (source: Ricerca sul Sistema Energetico - RSE S.p.A.)
In the recent years, scientific literature proved how batteries, associated with variable
renewables, represent a promising solution for synthetic inertia supply that is expected
deployed in tenths of seconds with proportion to the time derivative of the power system
frequency.
Controller structures for Inertial Response are proposed by scientific literature([41],
[42]), e.g. in case of battery storage embedded in wind power plants in order to increase
their synthetic inertial response. It is worth reminding that, as already mentioned,
converter-based WIND can supply synthetic inertial response by increasing or decreasing
the turbine speed, without need of BES ([43], [44]). A derivative control method based on
the rate of change of frequency (ROCOF) was proposed in literature in order to emulate
35 RMS (root mean square) simulation in the time domain. 36 In Sardinia ±500mHz range around 50 Hz is allowed by the defense plan of the Italian electrical system. In
Europe ±800mHz is allowed as frequency peak and 0.5÷1Hz/s is the present accepted ROCOF by ENTSO-E
(2Hz/s in the future). Reference: ENTSO-E Frequency Stability Evaluation Criteria for the Synchronous Zone of
Continental Europe.
Time (s)
Fre
qu
en
cy (
Hz)

42
the inertial response of a synchronous generator. The equation of motion of a rotating
synchronous machine is given by:
2𝐻 𝑑𝑓𝑑𝑡 = 𝑇𝑚 − 𝑇𝑒
Where:
H is the inertia constant (2...5s for hydro generator, 5...10s for combined cycle,
3...8s for conventional generator);
𝜔 = 2𝜋𝑓 is the rotor angular speed;
𝑇𝑚 is the mechanical torque;
𝑇𝑒 is the electromagnetic torque.
Of course, the inertia constant is 0s for full converter wind and PV, so inertial control of
such devices can enable them to emulate an inertial response with inertia constant H by
changing active power reference by the quantity
∆𝑃𝐼𝑁𝐸𝑅𝑇𝐼𝐴 = −2𝐻 𝑑𝑓𝑑𝑡
A base scheme for inertial control (Figure 10), with grid frequency as input and active
power reference as output to the actuator, may include:
i) a derivative block for rate of change of frequency “ROCOF” calculation with low-pass filter (𝑇𝑓𝑖𝑙𝑡𝑒𝑟 = 20𝑚𝑠) for noise treatment since derivative control is
sensitive to the noise;
ii) a proper gain for active power reference 𝑃𝑂𝐿𝐷 𝑅𝐸𝐹𝐸𝑅𝐸𝑁𝐶𝐸 + ∆PINERTIA
calculation based on above equation (value similar to the inertia constant of a
synchronous generator);
iii) a ROCOF dead-band ( ±0.05𝐻𝑧/𝑠) block aimed to limit control action to
significantly fast frequency deviations.
Figure 10: Block diagram of a derivative control aimed to inertial response - wind associated
storage (picture based on [43])
Given a certain under-frequency event, the synthetic inertia allows to have a lower initial
ROCOF [df/dt] and a higher time to reach the minimum frequency point. It’s worth noting that, although the above control can be in principle also valid for PV
generation associated with storage, it’s necessary to distinguish the different dynamic
behaviour of rotating turbine wind and static PV. For example, the most common method
to enable frequency response in converter-based wind is by increasing or decreasing the
s1+Tfilters
-H f df dt⁄ ∆PINERTIA
ROCOF estimation
with noise filtering Dead band

43
turbine speed; that practice cannot be applied to PV since no rotating parts are involved.
PV may be associated to storage and also kept in de-loaded operation, i.e. with a certain
power margin at a given solar irradiation, in order to supply itself a fast frequency
response ([45], [46]). In other words, PV plants can be operated below their optimal
operating point (Maximum Power Point Tracking) at reduced/increased DC voltage with
respect to the optimal DC operation voltage (VMPPT). The control, for fast frequency
response, of PV with storage can be similar to the speed governor of conventional
synchronous generators used for primary frequency control, i.e., a proportional controller
based on system frequency deviation, avoiding the mentioned limitation of ROCOF due to
noises. Given a certain under-frequency event, the fast frequency control allows to contain
the minimum frequency value.
4.4 Communication infrastructure for demand-response and control
of battery storage
Smart Grid is worldwide deemed as the base solution for managing the high penetration
of variable RES. Smart Grid can be defined as “the convergence of information and operational technology applied to the electric grid, allowing sustainable options to
customers and improved security, reliability and efficiency to utilities” [47]. Smart grids
are therefore based on utilization of ICT communication infrastructures allowing
observability and controllability of the grid, from distribution to transmission level.
Concerning centralized systems on HV transmission level (e.g. centralized large batteries
on HV level or big industrial load used for DR), it is reasonable to assume the adoption of
dedicated communication systems.
Concerning DR and the distributed batteries storage, standardized communication
systems/protocols, such as IEC 61850 communication standard supply, in general, base
concepts for realization of proper communication infrastructures. Accordingly with the
Smart Grid needs, IEC 61850 is compliant with the following requirements:
interoperability among typical elements of the grid, even if supplied by different
manufacturers, by means of an open and proper communication tool;
flexibility needed in case of possible power system evolutions and common
language for information sharing;
support of services aimed to real-time operation.
Main limits of IEC 61850 are: the complexity of proposed architecture; the high costs for
the installation of servers and devices for data management; the limits due to adaptation
to other existing protocols.
In Japan, Open Automated Demand Response (OpenADR) is the main candidate
communication protocol while others are under discussion. The typical application of
openADR concerns sending information and signals to cause consumers devices to be
turned off during periods of high demand.
Based on the survey, Table 27 shows the possible communication infrastructures.

44
Table 27: Communication infrastructures for DR and distributed storage – existing/presumed
Belgium Italy [48] Japan
Wireless communication
LPWAN
Internet
Wi-Fi
WiMAX
Power Line Carrier
Internet
Radio
Power Line Carrier
Wireless communication will play a key role taking into account the larger and larger
number of devices connected to the internet. Low-Power Wide-Area Network (LPWAN)
can be an alternative solution to the internet; this kind of telecommunication network is
designed to allow long range communications at a low bit rate (e.g. low number of bits
that are conveyed per unit of time, among connected objects). Long range LoRa, standard
of LPWAN, is deemed very promising (e.g. by Belgium). Each standard uses a different
technique to maximize range while minimizing transmission power: LoRa radios use a
modulation technique that can find signal well below the noise floor.
Wi-Fi and WiMAX are both wireless communication protocols based on radio waves
utilization (wireless). Wi-Fi can typically cover areas from tens to hundreds of meters
with a transfer data speed in the range 54÷125 Mbps37. WiMAX can cover distances of
tens of kilometres with a speed around 75 Mbps.
The internet is the most widespread infrastructure. Anyway, this solution involves the
need of ensure data and processes security and it may be affected by too much high
response times for the application in real-time operation.
Power line carrier PLC communication in power systems is already adopted for telemetry
(i.e. measurement from remote location) and remote control (e.g. for transmission line
protections). In Italy, meters adopted by the main distribution utility ENEL are based on
PLC communication with adoption of communication standard ISO 14908. The main
advantage of PLC solution is the exploitation of the existing grid lines; anyway, with that
solution, noises may significantly affect transferred information and, in case of line
tripping or network switching, continuity of operation is not ensured.
4.5 Cross border balancing market
In operational planning, variable RES involve uncertainty around forecast and variability.
Power balancing capability across national borders is a proper solution aimed to reduce
the impact of the RES variations. It was already undertaken within continental Europe
(see also ph. 2.1.2) and it is under discussion in Italy and in Japan, even if the latter is not
presently interconnected. At present in Italy, with low load, the possible PV surplus can
involve the reduction of thermal generation with consequent less regulating capacity. In
general, when reserve is not sufficient, the Italian TSO changes the cross-borders
exchange schedules.
Cross border balancing market seems to be a proper scheme to manage power balancing
among countries. It’s worth noting that development of cross-border interconnections
with neighbouring countries allows higher exchange volumes ensuring, in first instance,
higher market competitiveness but also the possibility of power reserve sharing among
countries. At transmission level, the new VSC HVDC technology is a proper solution in
37 Megabits Per Second.

45
order to manage power transfer in the context of a cross border balancing market. E.g.
between Italy and France, a new 1200 MW rated HVDC is under construction in order to
increase transmission capacity between the two countries.

46
5 PV output management for system operation As pointed out in Europe with the occurrence on the 25 March solar eclipse ([16]),
controllability and observability of PV have to be endorsed in order to support utility
operators in terms of planning and operation.
Concerning controllability of PV, as successfully occurred in Italy, it is possible to
disconnect in advance a share of the installed PV production but, such practice on a large
scale, need the knowledge of: i) the exact amount of PV feed-in to be switched off; ii)
timing of PV switching off and switching on; iii) logical steps for PV switching on; iv)
impact of shutdowns on the system.
Concerning observability of PV, a clear description of the installed PV capacity and their
capabilities is needed for the accuracy of forecast studies (technical data, retrofitting
campaign, disconnection/reconnection settings and logics, etc.). Real time measurement
of the dispersed PV generation may be then the key element for adapting, in real time, the
strategy for operational security.
5.1 Curtailment of connected PV output
A considerable RES energy production may involve temporary critical situations in the
system operation mainly because of over generation of RES which leads to the reduction
of the regulating reserve and the reduction of global inertia, especially. As already
mentioned, the inertia issue is critical in case of PV and “full converter” Wind generation. Consequently the grid may be exposed to greater vulnerability.
RES capability to provide ancillary services may be one of the affordable technical
solutions and consequently a good driver toward high PV penetrations. Moreover,
participation into markets for ancillary services may be an interesting option, for PV, to
retrieve an additional income as discussed and studied with wind generation.
PV curtailment can be seen as a sort of ancillary service due mainly to grid congestions
and system balance but also for voltage deviations and for system voltage-related
stability.
The development of variable DG generation has involved new control problems since it is
dispersed in thousands or millions of generators connected to distribution networks.
Therefore special procedures are needed to take into account the nature of dispersed
generation and the role of DSOs.
National practices, especially in countries with high PV penetration are useful to
understand how manage the PV output in case of violation of operational grid boundaries.
5.1.1 Belgium
At present, no procedures are adopted, in Belgium, for PV power curtailment aimed to
transmission level security, at MV and LV distribution levels.
No HV connected PV is present but, in principle, same rules, as other generation types,
would be applied.

47
5.1.2 Germany
In Germany an active power reduction is foreseen in case of over frequency (>50.2Hz) by
means of application of a local P(f) characteristic. A droop function is adopted as
suggested in the technical conditions for the connection to the medium voltage network
and low voltage network (e.g. see Figure 11).
Figure 11: Droop function in case of over-frequency (Germany- [21])
Furthermore, congestion management is applied with the definition of requirements
concerning active power curtailment for the HV, MV and LV levels.
Procedures for PV active power curtailment in Germany, aimed to transmission and
distribution system operational security, are shown in Table 28. The procedure for active
power curtailment can differ between the DSOs. At LV level, the active power curtailment
is usually activated for a LV grid area (for example zip code area) e.g. via a radio ripple
signal. At MV level, the minimum size of the interested PV units can differ per DSO, larger
PV systems (e.g. PV systems with Prated > 500kW) have a direct connection with the DSO
network control centre for remote control and online power reading.
Table 28: procedures for PV active power curtailment at distribution level (Germany)
Voltage level Size of interested PV units Activation Communication technology
LV
(EEG 2014)
Prated>30 kW
remote interface Usually
manual for an
LV area (e.g.
zip code)
GSM38
, Radio Ripple Control
P≤30 kW
remote interface or fixed limitation of the
active power to 70% on nominal power
MV Based on DSO
Remote-
controlled by
DSO
--
Reactive power control for voltage support is also required in the HV, MV, and LV levels,
with different specifications per voltage level.
5.1.3 Greece
At present, no procedures are adopted, in Greece, for PV power curtailment aimed to
transmission level security, at all the voltage levels.
5.1.4 Italy
In Italy, PV plants, on the basis of size and date of connection, contribute to operational
security since they have to comply with the national grid code ([26], [27]).
38 Global System for Mobile Communication.

48
A curtailment is foreseen in case of frequency higher than 50,3 Hz, with 2.4% of
permanent frequency droop 39 and total power cut at 51.3Hz (see Figure 12). That
requirement (ref §4.1 AEEG 84/2012 [22]) is applied to:
PV on LV level with Prated ≥ 1kA and date of connection after 31/12/2012;
PV on MV level with Prated ≥ 1kA and date of connection after 01/07/2012;
PV on HV level.
Figure 12: DG droop function in case of over-frequency (Italy; graphic based on [26])
PV systems on LV level
Remote signal for tripping is considered as input in the control schemes of the interface
protection system of PVs having P𝑟𝑎𝑡𝑒𝑑 ≥ 1kW and installed after July 1st 2012 [22].
PV systems on MV level The Italian TSO TERNA adopts the “RIGEDI” procedure (year 2014 [17]) for DG
curtailment in case of emergency operational conditions of the national electric system:
the interested generators are PV and WIND connected on MV distribution level with rated
power P𝑟𝑎𝑡𝑒𝑑 ≥ 100kW. Different shedding schemes, shown in Table 28, are foreseen by
the RIGEDI procedure.
39 The frequency droop of a generator is equal to the quotient of the relative quasi-steady-state frequency error
on the network and the relative variation in power output from the generator associated with the action of a
frequency containment controller (e.g. primary controller on the basis of ENTSO-E glossary): it can be
expressed as:
100 ∙ ( ∆𝑓𝑓𝑁𝑂𝑀𝐼𝑁𝐴𝐿)/ ( ∆𝑃𝑃𝑁𝑂𝑀𝐼𝑁𝐴𝐿).

49
Table 29: RIGEDI schemes for DG active power curtailment at MV level (Italy; [17])
Procedure
scheme
Voltage
level
Size of interested
PV units Activation Communication technology
GDPRO
MV Prated≥100 kW
Manual with forewarning --
GDTEL Remote-controlled by DSO GSM/GPRS or satellite channel
GDRM Remote-controlled with TSO
command via DSO
TSO↔DSO: Dedicated channel TSO↔DSO: GSM/GPRS or satellite channel
The GDPRO scheme is implemented on DG connected to the grid by means of not
dedicated lines whit presence of consumption units. Generation shedding is performed by
plant owner on request by distributor.
The GDTEL scheme is implemented on DG feeding-in all net40 production on the grid and
connected via dedicated line that can be opened by motorized switch-disconnector on the
basis of remote triggering by the DSO in case of request by the TSO.
The GDRM scheme is directly applied by the TSO defence system via the communication
with the remote control system of the DSO.
In general, the RIGEDI procedure, waiting for the full implementation of the smart grids,
takes into account that:
the GDPRO plants are not remote-controlled and not overseen therefore a
congruous forewarning is needed for shedding;
only some plants are remote-controlled for remote shedding in short time;
some plants are compliant with GDRM procedure. Since DG doesn’t participate into the national market for ancillary services (MSD), no economic merit order is considered in the generation shedding; this last is implemented
only on the basis of a uniform distribution in compliance with operational security of the
national transmission system.
In case of RIGEDI-GDRM a dedicated communication network should be implemented
between TSO and DSO. Already existing channels for remote control are allowed with the
condition of separation between present data exchange (e.g. data metering) and RIGEDI
communication/commands. On the TSO TERNA side, the connection has to be protected
by a firewall. A new connection has to be agreed by the DSO and the TSO with consequent
communication of the IP internet protocol access by the TSO to the DSO. The GDRM plant
should then be linked to DSO by means of GSM/GPRS modem connected via a
communication network. DSO is synchronized by means of GPS or by means of a satellite
channel where GSM/GPRS service is not covered.
PV systems on HV level
Besides in case of unacceptable over-frequency, the TSO can ask to PV generators on HV
level to curtail their power output in case of: grid congestions, risk of overloading, risk of
instability, steady state unacceptable over-frequency ([27]). The power limitation has to
be implemented by PV plant owner, via remote control, within 15 minutes after TSO
communication. In case of agreement between PV owner and TSO (not mandatory), a
remote control can be implemented in order to allow the direct remote limitation
40 Taking into account absorption of the plant auxiliary services.

50
command by the TSO. Power limitation steps have to be, at least, 10% of the installed
capacity.
5.1.5 Switzerland
Mostly, no procedures are adopted for PV power curtailment aimed to transmission level
security, at MV level. Power curtailment application is up each individual DSO.
No HV connected PV are present.
5.1.6 Japan
In Japan, before the rapid PV penetration under Feed-in-Tariff which was launched in
2012 just after the East Japan Great Earthquake, limited visibility and manageability were
required with the PV systems.
Concerning the curtailment of medium sized PVs, with P_rated≥50kW and distributed on
MV level, the manual interruption with forewarning is required. No need of dedicated
lines for PV connection is foreseen. The adopted communication system is manual by
phone.
Concerning the curtailment of medium sized PVs, with P_rated≥2MW and distributed on
MV level, manual control by plant operator after TSO/ISO communication is required.
Also in this case, the adopted communication system is manual by phone.
In January 2015, the enforcement regulation of the Act on Special Measures concerning
the Procurement of Renewable Energy was revised, and PV system function of output
control is required to maintain the security of bulk power system ([49]). This control
function is obliged to all type of PV system interconnected LV, MV, or HV network.
In 2015, a national R&D project started to actually establish the technology to realize
visibility and controllability of PV systems from roof-top scale to MW scale including
additional DR measure combined with the curtailment signal.
In 2016, the Partial Revision of the Act on Special Measures Concerning Procurement of
Electricity from Renewable Energy Sources by Electricity Utilities was approved and
established by the Diet in May, and promulgated in June.
The Revised Act stipulates the revision of the new Feed-in Tariff (FIT) scheme to achieve
both the introduction of renewable energy to the maximum extent possible and the
curbing of the public burden ([50]). The major revisions are: 1) Creation of a new
authorization system; 2) Revised method of setting purchase prices; 3) Revision of
businesses obliged to purchase renewable energy and other regulations; 4) Revision of
the arrangement for reducing surcharges on electricity rates.
5.2 Further flexibility from PV output modification
5.2.1 International trend
Flexibility of operation is the ability of a power system to adapt to changing balance
between supply and load at any time scale. Flexibility is system specific, and is inherently
tied to the physical characteristics of a system, its planning process and operational
practices, market mechanisms and regulatory environment. Without sufficient flexibility,
the system operators may need to frequently curtail the wind and solar generation thus
reducing the capacity factors and revenue streams of the plants and causing negative
prices, which in turn reduces the attractiveness of investments in new generation (both

51
conventional and renewable). There is no universally accepted method for measuring the
system flexibility. The analytic field for measuring flexibility is still evolving based on
advances in resource and load modelling and forecasting, and stochastic analyses for
understanding system operations over a wide range of conditions.
As discussed in Chapter 4, under the penetration of renewable generation with variability
and uncertainty, a power system requires more flexibility from various resources
including RES with variability and uncertainty such as PV and wind. Under the
circumstance of reduced value of energy and increased value of flexibility, the value of
RES will be increased when it supply not only energy but also flexibility to reduce cost of
power usage and enhancing security of power supply.
The aggressive supply of flexibility is pursued earlier with wind generation which
penetrated into many power systems earlier than PV. A modern wind generator or wind
farm can supply ancillary services by means of various control functions including
maximum power production control, power ramp rate control, delta control, synthetic
inertia control, power system damping control. With those controls, there are several
practices and many studies to utilize the functions in a power system.
In Europe, REserviceS Project (2012-2014; [51]) studied flexibility needs of a power
system, technology candidate, economic analysis, market design and next R&D. In
Denmark, for example, EaseWind (2011-2014; [52]) of ForskEL project studied the
contribution of wind generation to various aspects including frequency regulation,
synchronization, and dynamic stability. In Europe, there are diversified activities ([53],
[54]) about technologies, regulation and institution aimed to realize the flexibility from
PV and wind generation.
In the United States, under an initiative of the Grid Tech Team, research institutes such as
NREL 41 , ANL 42 , LBNL 43 and EPRI 44 , utilities, grid operators have been studying the
controllability of PV and wind generation, their values and grid operation and institutions
to realize the value. NREL, as an example, recently published a report on capacity reserves
and frequency stability services from variable generation ([55]).
Provision of flexibility necessarily means a reduction of energy production of RES (e.g. for
upward power reserve provision). Accordingly, in order to realize the utilization of
flexibility of RES, it is inevitable to establish a regulatory framework and market
mechanism.
5.2.2 Demonstration Projects
In this section, among many efforts of R&D of PV output modification, some examples of
demonstration projects are described.
(1) US The National Renewable Energy Laboratory (NREL) has a research area of “Active Power Control” where wind power control technologies were developed from 2013 to 2016. In
2014 report, [56] , NREL had summarized its research in the areas of active power control
41 National Renewable Energy Laboratory. Web address: http://www.nrel.gov/. 42 Argonne National Laboratory. Web address: http://www.anl.gov/. 43 Lawrence Berkeley National Laboratory. Web address: https://www.lbl.gov/about/. 44 Electric Power Research Institute. Web address: http://www.epri.com/Pages/Default.aspx.

52
(APC) by wind power. The report focused on economics and steady-state impacts of APC
by wind in the power systems, dynamic stability and reliability impacts, and controls
design and testing activities. In one recent paper, [57] NREL has evaluated the impact of
the wind generation provision of APC strategies on the U.S. Western Interconnection at
various levels of wind power penetration (up to 80% instantaneous penetration).
In 2014-2015, t NREL, AES, the Puerto Rico Electric Power Authority (PREPA), First Solar,
and the Electric Reliability Council of Texas carried out a demonstration project on two
utility-scale photovoltaic (PV) plants to test the viability of providing important ancillary
services from these facilities.
Fiscal year 2014 activities focused primarily on finding collaborative industry partners
and planning activities for FY15 testing. First, NREL contacted various industry members
to identify potential utility or independent operators as collaborators to demonstrate a
PV power plant as an asset to the grid based on the selection criteria above. As a result,
two PV power plant owners/operators agreed to become partners with NREL to perform
such testing:
1. Ilumina PV power plant owned and operated by AES Corporation. This20-MW plant is located near Guayama on Puerto Rico’s south coast. 2. Pecos Barilla PV power plant owned and operated by First Solar Electric,
LLC. This 22MW plant is located near Fort Stockton in Pecos County in West Texas.
General conclusions of the demonstration tests include the following:
System-level modelling exercises will be needed to determine the exact
parameters of each control feature to maximize the reliability benefits to PREPA45
and ERCOT46.
All hardware components enabling PV power plants to provide a full suite of grid-
friendly controls are already in existence in many utility-scale PV plants. It is
mainly a matter of implementing controls and/or communications upgrades to
fully enable these. Issues to be addressed in the process include communications
protocol compatibility and proper scaling for set point signals. Although these are
not significant barriers, dialogue and interaction between the plant operators and
the system operators is an important component of implementation of advanced
process control capabilities. Modifying programming logic may be necessary at
multiple places in the chain of communications.
Fine-tuning of the PPC47 to achieve rapid and precise response is an important step
and is non-trivial. It may be easier with newer equipment because of the faster
response times of newer inverters and controller systems.
FFR response by a PV plant requires precise tuning of PI48 controllers for fast
response times and avoiding unintentional oscillation of the output active power.
45 Puerto Rico Electric Power Authority. 46 Electric Reliability Council of Texas. 47 Portable program carrier. 48 Proportional-integral.

53
For optimum FFR performance, the exact amount of generation loss must be
dispatched to participating PV plants as an active power set point, so the pre-fault
frequency can be quickly recovered. This will require a low-delay communication
infrastructure to deliver information on the exact generation loss to the utility
control center with consecutive distribution of proper active power set points to
all participating PV plants that provide FFR.
Many utility-scale PV power plants are already capable of receiving curtailment
signals from grid operators; each plant is different, but it is expected that the
transition to AGC49 operation mode will be relatively simply with modifications
made only to a PPC and interface software (Figure 13).
Fast response by PV inverters makes it possible to develop other advanced
controls, such as power oscillation damping.
PV power plants without energy storage are capable of providing many services to
the grid, but market mechanisms and/or new interconnection requirements are
needed to incentivize curtailed operation for any up-regulation service.
Figure 13: Grid-friendly PV power plant (source V. Gevorgian, NREL)
In 2016, NREL, CAISO and First Solar conducted demonstration testing of essential
reliability services by a 300 MW PV power plant located in CAISO service area. This project
demonstrated that advanced power electronics and solar generation can be controlled to
contribute to system-wide reliability. It was shown that the First Solar plant can provide
essential reliability services related to different forms of active and reactive power controls,
including plant participation in AGC, primary frequency control, ramp rate control, and
voltage regulation. For AGC participation in particular, by comparing the PV plant testing
results to the typical performance of individual conventional technologies, it was shown that
regulation accuracy by the PV plant is 24–30 points better than fast gas turbine technologies.
49 Automatic Generation Control.
54
The plant’s ability to provide volt-ampere reactive control during periods of extremely low
power generation was demonstrated as well.
The project team developed a pioneering demonstration concept and test plan to show how various types of active and reactive power controls can leverage PV generation’s value from being a simple variable energy resource to a resource that provides a wide range of ancillary services. With this project’s approach to a holistic demonstration on an actual, large, utility-scale, operational PV power plant and dissemination of the obtained
results, the team sought to close some gaps in perspectives that exist among various
stakeholders in California and nationwide by providing real test data.
(2) Japan
Japan has been experiencing rapid PV deployment since feed-in-tariff program was
launched in July, 2012 one year after the Great East Japan Earthquake and Tsunami. Under the situation of rapid PV deployment, the Japan Government established “Working Group on Grid Connection of Renewable Energy (the Working Group)” in 2014 and a committee in 2015, to discuss about the carrying capacity in a balancing area and its enhancement,
and to discuss about the improvement of the FIT program respectively. In the meantime,
the PV penetration is affecting the stable operation of a power system in each of the
balancing area in Japan according to the level of the penetration. Under the situation,
several RE integration demonstration projects have been continually conducted Japan
[58].
Figure 14 depicts a total schedule of the METI 50 demonstration projects related to
renewable energy integration. In the Project No. 2 demonstrated an innovative inverter
technology, demand response utilizing automated HEMS and a battery, and demand and
supply planning and real-time operation simulation technology [59]. The project No. 3
demonstrated a two-way communication technology for the visibility and controllability
of a residential-scale PV. Project No. 4 demonstrated the state-of-the-art PV generation
forecast technologies with the review of utilities of system operation viewpoints.
50 Ministry of Economy, Trade and Industry .

55
Figure 14: Progress of METI Demonstration Projects (Source: TEPCO) From 2014, the national project package “Grid integration of VRE mitigation technologies on Output Fluctuations of Renewable Energy Generations in Power Grid” began with a project period of five years. The project includes themes of wind ramp forecast with actual
wind farm monitoring, energy storage utilization, demand and supply planning and
analysis, and integrated demonstration in an island (project No. 6 in Figure 14).

56
Figure 15: Project structure of National Project on output curtailment for PVs (Source: Project
Material)
From FY2016, after the preceding study in FY2014, the same national project package
added a new project with a schedule from FY 2016 to FY 2018, focusing on the PV
output control and enhancement of PV output control method. The project is intended
to establish the technology along with the rapid PV deployment under the feed-in-
tariff program in Japan. The project includes the following development items as
depicted in Figure 15:
R&D Item 1: Establishment of PV output control method for curtailment
Enhancement of remote PV output control system
Development of demonstration system
Field demonstration
Development of calculation technologies for optimal output controlled capacities
R&D Item 2: Enhancement of PV output control method
Development of power self-consumption control method
Development of supply and demand control method
Enhancement of distributed energy management system

57
5.3 Communication infrastructure for distributed PV output
modification
Dispersed PV plants management involves the need of smart grids based on ICT
infrastructures allowing plant observability and controllability from distribution and
transmission levels.
Suggested communication infrastructures for PV remote control, such as demand
response (§ 4.4), span over a wide range of solutions like those summarized in Table 30,
based on the survey.
Table 30: Communication technologies for generation modification of distributed small-scale PV
existing/presumed solutions
Belgium Germany Italy Switzerland Japan
Internet
GPRS
for example GSM, radio
ripple control, Internet, PLC
Power Line Carrier
Internet
Wi-Fi
WiMAX
Normally no communication.
Rarely one of the following: ripple control
system (modulated on grid voltage);
smart metering system (often optical
fibre) to the substation; PLC to the home
Dedicated line
Internet
Radio
PLC
Through promising intelligent control methods and remote control solutions the existing
power grid infrastructure can be exploited allowing a higher penetration of distributed
PV. Interoperability and standardized communication systems/protocols, such as IEC
61850 communication standard, are important keys to realize such intelligent
approaches. Despite its inherent architecture complexity, as already mentioned IEC
61850 ensures: i) interoperability among elements, even if supplied by different
manufactures; ii) flexibility in case of possible technology evolutions and common
language for information sharing; iii) support of services aimed to real time operation. In Japan, OpenADR is the main candidate communication protocol. It is typically used to send
information and signals to consumers for switching off devices in case of high power demand.
Wireless communication is particularly suitable for PV output management, taking into account
huge number of dispersed PV plants.
The internet infrastructure solution involves the need of ensure data and processes
security and it may be affected by too much variable and high response times for the
application in real time.

58
6 Conclusions
High penetration of PV generation, together with wind, creates specific challenges in
terms of transmission system operation, introducing variability, uncertainty, null inertia
with consequent higher needs and complexity in flexibility resources provision. This is
due to both the increased requirements in ancillary services associated to power
flexibility and to the displacement of conventional generation resources, i.e. the major
traditional resources of flexibility for power system operation.
This report presented a review of existing and expected resources for flexibility in terms
of: solutions for balancing (e.g. PV output management), PV forecast error compensation,
peak shaving, inertia supply, congestions management.
The review was based on a survey involving national experts of 6 countries, namely
Belgium, Germany, Greece, Italy, Japan and Switzerland With the aim to highlight items
and scenarios of interest for PV integration studies.
Technical issues and flexibility
Solar PV in the electric grid is steadily rising in various areas worldwide. A significant PV
installed capacity is expected in Japan, 64 GW by 2030 against 23.3 GW installed in 2014,
and in U.S.A. with 100 GW by 2021 against 18.3 GW installed in 2014. High market share
increases are expected in countries with low present capacity like Belgium, Greece and
Switzerland and a certain growth is foreseen in countries like Italy and Germany, despite
their already large PV installed capacity amount.
PV forecast is used for system operation planning in almost all participating countries. It
is not used in Greece despite the not negligible installed capacity of 2.6 GW (against a
maximum load around 9.2 GW). PV output has very fast and large variations with variable
meteorological conditions. Therefore, highest reliability in PV forecast, such as for other
variable RES, can only be achieved in the short-term. Flexibility resources must then be
involved, aimed to compensate for the power imbalances caused by PV fluctuations or
deviations with respect to the forecast. However a certain minimum time interval is
needed for their activation; resources like battery energy storage systems are very fast,
while thermal power plants are very slow. Consequently, the time horizon for operational
planning is affected by the type of available flexibility resources and it cannot be lower
than the minimum required time interval for resources activation.
Probabilistic approaches for the assessment of balancing reserve requirements, aimed to
compensate RES forecast uncertainty, allow, unlike the deterministic methodologies, to
contain over-estimation of the power reserve. In fact probabilistic approaches lead,
accepting a certain risk, to the reduction of the reserve margins for operational security,
in comparison with deterministic approaches aimed to cover the, possible but unlikely,
maximum unbalance. A large amount of RES generation requires therefore probabilistic
approaches for the assessment of the needed balancing reserve.
A possible concern consists in the changes in daily profile of net load, e.g. gross load minus
distributed generation (DG) output. High PV penetration leads to lower net load in central
day light hours with consequent risk of over generation since a minimum amount of
traditional generation is currently considered to be required for operational security.
Moreover, in the evening, the decreasing PV output leads to high upward ramps of net

59
load with risk of slow system response to load ramp. Keeping in mind the above issues, it
is necessary to endorse new highly performant flexibility resources, which can be quickly
available if needed, such as: i) enhanced performant thermal power plants allowing short
starting time, lower number of hours of continuous operation, fast ramp; ii) DG output
modification; iii) demand response (DR); iv) battery storage.
The basic purpose of DR is to lower and/or shift consumption during periods of high
wholesale market prices. Anyway, DR is, in general, endorsed in order to be exploited for
peak shaving, power balancing and congestion management. Participation of electric
vehicles in DR is then considered a reasonable opportunity.
Despite the present high costs, battery energy storage BES for ancillary services can be
one of most promising kinds of flexible resources with high performances in terms of
response speed. Battery storage can limit power pics and power dips due to fast
meteorological changes by means the availability of very fast control.
DR and DG output modification involve the need of smart grids based on ICT
infrastructures allowing observability and controllability of the grid, also at distribution
level. ICT is needed to help system operation performed by TSOs, for the whole system
security (voltage and frequency stability in addition to congestion management at
transmission level), and DSOs for implementation of actions requested by TSOs
commands or needed in order to solve local problems (e.g. local under/overvoltage,
congestions). Standardized communication systems/protocols, such as IEC 61850
communication standard supply, in general, base concepts for realization of proper
communication infrastructures. In Japan, Open Automated Demand Response (OpenADR)
is the main candidate communication protocol. Wireless communication will play a key
role taking into account the larger and larger number of devices connected to the internet.
This last is the most widespread infrastructure. Anyway, this solution involves the need
of ensure data and processes security and it may be affected by too much high response
times for the application in real-time operation. Low-Power Wide-Area Network
(LPWAN) can be an alternative solution to the internet. Power line carrier PLC
communication in power systems is already adopted for telemetry and remote control.
The main advantage of PLC solution is the exploitation of the existing grid lines; anyway,
with that solution, noises may significantly affect transferred information and, in case of
line tripping or network switching, continuity of operation is not ensured.
The progressive decommissioning of traditional generation, besides lower operating
power reserve, involves system inertia reduction with lower inertial response in case of
frequency perturbations. In the recent years, scientific literature ([24]..[27]) proved how
batteries, associated with variable renewables, represent a promising solution for
synthetic inertia supply that is expected deployed in tenths of seconds with proportion to
the time derivative of the power system frequency. Moreover converter-based WIND can
supply synthetic inertial response by increasing or decreasing the turbine speed, without
need of BES. Controller structures for Inertial Response are proposed by scientific
literature ([24], [25]), mainly in case of battery storage associated with wind. Proper
controls for fast frequency control of PV were already presented but in-depth studies
about that issue are still needed. This report has collected information about flexibility
resources and explained them. Future reports are expected to give the analysis of the
integration studies including the flexibility resources.

60
7 Recommendations
Operational flexibility and enhancement
Keeping in mind the minimum time interval for the activation of flexibility resources, the
operational planning and the eventual ancillary services market should be, as much as
possible, close to real time in order to get higher forecast reliability.
A large amount of RES generation requires probabilistic approaches for the assessment
of the needed balancing reserve, avoiding over-estimations.
Cross border balancing has to be endorsed in order to reduce the impact of RES variations,
sharing them within a larger power system instead of the single national ones.
Flexibility resources
New highly performant flexibility resources, which can be quickly available if needed,
such as demand response DR, are even more needed in order to compensate changes in
daily profile of net load due to high PV penetration.
A proper ancillary services market should be organized in order to incentivize higher
performances of plants enabled to supply these services.
Potential drivers of DR, beside a proper electricity market structure, may be: the average
retail price of electricity, the presence of a dedicated demand-side policy/regulation, the
generation mix with high level of renewables penetration and reduced reserve margins.
Demand Response, in addition to DG output management, involves the need of smart grids
based on ICT infrastructures. Many ICT solutions are or will be available in the next future,
therefore accurate studies need to be performed in order to highlight the advantages and
the drawbacks of each option (wireless communication internet; Low-Power Wide-Area
Networks; Power line Carriers; etc.).
Proper controls for fast frequency control of PV are already presented in scientific
literature but more in-depth studies about that issue are still needed in order to find
solution for lower system inertia due to traditional generation decommissioning.

61
References
[1] ENTSO-E, Yearly statistics & adequacy retrospect 2014.european electricity system
data, 5 February 2016. Report and background data are available at web adress: https://www.entsoe.eu/publications/statistics/yearly-statistics-and-adequacy-
retrospect/Pages/default.aspx.
[2] Ministry of Economy, Trade and Industry Website http://www.enecho.meti.go.jp/statistics/electric_power/ep002/results.html#headline2
http://www.enecho.meti.go.jp/category/saving_and_new/saiene/kaitori/
[3] IEA PVPS T1, 2014 Snapshot of Global PV Markets, 2015. Available at web address: http://www.iea-pvps.org/index.php?id=32.
[4] U.S. Energy Information Administration EIA, Statistics on electric power plants,
capacity, generation, fuel consumption, sales, prices and customers, December 24, 2015. Info at web address: https://www.eia.gov/electricity/data.cfm.
[5] National Energy Technology Laboratory, Frequency Instability Problems in North
American Interconnections, May 1, 2011. Available at web address http://www.netl.doe.gov/energy-
analyses/temp/FY11_FrequencyInstabilityProblemsinNorthAmericanInterconnections_06
0111.pdf.
[6] The Statistics Portal, Total electricity end use in the U.S. from 1975 to 2014. Information available at the web address: http://www.statista.com/statistics/201794/us-
electricity-consumption-since-1975/.
[7] ENTSO-E WGAS, Survey on Ancillary services procurement, Balancing market design
2014, January 2015. Available at web address: https://www.entsoe.eu/publications/market-reports/ancillary-services-
survey/Pages/default.aspx.
[8] Greek Regulatory Autority for Energy RAE, Wholesale Electricity Market, 18 April
2016. Information available on RAE website: http://www.rae.gr/site/en_US/categories/electricity/market/wholesale/intro.csp?viewMode
=full#1.
[9] Gennaro Niglio GSE, Previsione della produzione. L’esperienza del GSE, Milan 8 May
2014. Available at the web address: http://www.gse.it/it/salastampa/Primopiano/Interventi/Pages/default.aspx.
[10] ENTSO-E, 2015 SCENARIO OUTLOOK & ADEQUACY FORECAST, 30 June 2015. Available at web address https://www.entsoe.eu/publications/system-development-
reports/adequacy-forecasts/Pages/default.aspx.
[11] IEA PVPS Task 14, Power System Operation and Augmentation Planning with PV
Integration, report IEA PVPS T14-04:2014. Availble at web address: http://iea-
pvps.org/index.php?id=322.
[12] Jie Zhang1 et Ali, National Renewable Energy Laboratory NREL, Baseline and
Target Values for PV Forecasts: Toward Improved Solar Power Forecasting, July 26–30, 2015. IEEE Power and Energy Society General Meeting. Available at web address:
http://www.nrel.gov/docs/fy15osti/63876.pdf.
[13] Gennaro Niglio GSE, La previsione delle immissioni di energia elettrica da fonti
rinnovabili quale meccanismo di integrazione nelle reti di distribuzione, l'esperienza
del GSE, Catania (IT) 2010, AEIT Giornata di studio Smart Grids.
[14] TERNA annex 22 of the grid code: Procedura per la selezione delle risorse per la
fase di programmazione del MSD. Available at web address: http://www.terna.it/it-
it/sistemaelettrico/codicedirete.aspx#.

62
[15] IEA PVPS Task 14 , How an energy supply system with a high PV share handled a
solar eclipse, Report IEA-PVPS T14-06:2016. Available at web address: http://www.iea-pvps.org/index.php?id=9.
[16] Solar Power Europe, ENTSO-E, Solar Eclipse March 2015: The successful stress test
of Europe’s Power Grid – More Ahead. Policy brief, 15 July 2015.
[17] TERNA, annex A72 of the Grid Code (2014): Procedura per la RIduzione della
GEnerazione DIstribuita in condizioni di emergenza del Sistema Elettrico Nazionale
(RIGEDI). Available at the web address http://www.terna.it/LinkClick.aspx?fileticket=mfp5nLfWgZg%3d&tabid=106&mid=468.
[18] IEA PVPS Task 14, High Penetrations of PV in Local Distribution Grids, REPORT IEA PVPS T14-02:2014. Available at web address: http://iea-
pvps.org/index.php?id=295.
[19] TERNA, Piano di Sviluppo 2016. Document available, for public consultation and
consequent approval by italian regulatory authority AEGGSI, at web address:
http://www.autorita.energia.it/it/comunicati/16/160428pds.htm.
[20] Italian Regulatory Authority for Electricity Gas and Water AEEGSI, Rapporto
annuale 428/2014/I/EEL dell’autorità per l’energia elettrica il gas e il sistema idrico in materia di monitoraggio dei mercati elettrici a pronti, a termine e dei servizi di
dispacciamento. August 7 2014. Available at web address: http://www.autorita.energia.it/it/docs/14/428-14.htm.
[21] German Association for Electrical, Electronic & Information Technologies (VDE),
Guideline for the Connection and Parallel Operation of Generation Units at Low Voltage
Level, VDE-AR-N 4105:2011-08. Berlin, VDE, 2011.
[22] Italian Regulatory Authority for Electricity Gas and Water” (2012), resolution number 84/2012/R/eel, Interventi urgenti relativi agli impianti di produzione di
energia elettrica, con particolare riferimento alla generazione distribuita, per
garantire la sicurezza del sistema elettrico nazionale, available at the web address
http://www.autorita.energia.it/it/docs/12/084-12.htm.
[23] Italian Authority “AEEG” resolution 243/2013/R/eel (2013), Ulteriori interventi
relativi agli impianti di generazione distribuita per garantire la sicurezza del sistema
elettrico nazionale. Modifiche alla deliberazione dell’autorità per l’energia elettrica e il gas 84/2012/r/eel. Available at the web address:
http://www.autorita.energia.it/it/docs/13/243-13.htm.
[24] German Association of Energy and Water Industries (BDEW), Technical Guideline
for the Connection and Parallel Operation of Generators connected to the Medium
Voltage Network. Berlin, BDEW, 2008.
[25] German Association for Electrical, Electronic & Information Technologies (VDE),
Technical requirements for the connection and operation of customer installations to
the high voltage network, VDE-AR-N 4120:2015-01. Berlin, VDE, 2015.
[26] TERNA, annex A70 of the Grid Code (2012), Regolazione tecnica dei requisiti di
sistema della generazione distribuita. Available at the web address http://www.terna.it/default/Home/SISTEMA_ELETTRICO/codice_rete.aspx.
[27] TERNA, annex 68 of the Grid Code (2012), Impianti di produzione fotovoltaica
requisiti minimi per la connessione e l’esercizio in parallelo con la rete AT, Available at
the web address http://www.terna.it/it-it/sistemaelettrico/codicedirete.aspx.
[28] Italian Standard CEI 0-16 for users connection on MV and HV levels: “Regola tecnica di riferimento per la connessione di Utenti attivi e passivi alle reti AT ed MT delle imprese distributrici di energia elettrica”. September 2014. Available at web
address: http://www.ceiweb.it/doc/norme/13453.pdf.

63
[29] Italian Regulatory Authority for Electricity Gas and Water (2013), resolution
number 43/2013/R/EEL: Approvazione di progetti pilota relativi a sistemi di
accumulo da realizzarsi sulla rete di trasmissione nazionale, rientranti nel programma
di adeguamento dei sistemi di sicurezza e difesa 2012-2015. February 7 2013. Available at web address: http://www.autorita.energia.it/allegati/docs/13/043-13.pdf.
[30] Italian Regulatory Authority for Electricity Gas and Water (2013), document for
public consultation no. 557: Mercato dell’energia elettrica revisione delle regole per il
dispacciamento - orientamenti finali. Available at the web address: http://www.autorita.energia.it/it/docs/dc/13/557-13.jsp.
[31] IEA, The power of transformation, Paris: IEA, 2014. Available at web address: https://www.iea.org/publications/freepublications/publication/The_power_of_Transformat
ion.pdf.
[32] North American Electric Reliability Corporation (NERC) Glossary. http://www.nerc.com/files/glossary_of_terms.pdf.
[33] ENTSO-E operation handbook glossary. June 24 2004. Available at web address: https://www.entsoe.eu/fileadmin/user_upload/_library/publications/entsoe/Operation_Han
dbook/glossary_v22.pdf.
[34] ENTSO-E new draft network code. September 24 2013. Available at web address https://www.entsoe.eu/major-projects/network-code-development/operational-
security/Pages/default.aspx.
[35] ENTSO-E WGAS, Survey on Ancillary services procurement, Balancing market
design 2014, January 2015. Available at web address: https://www.entsoe.eu/publications/market-reports/ancillary-services-
survey/Pages/default.aspx.
[36] ENTSO-E Working Group, Survey on Ancillary Services Procurement & Balancing
market design, September 2012. Available at web address: https://www.entsoe.eu/publications/market-reports/ancillary-services-
survey/Pages/default.aspx.
[37] D.Caldas, M.Fischer, S.Engelken, Inertial Response Provided by Full-Converter Wind
Turbine. Wind Power Conference 2015, Rio De Janeiro (BR). Available at web address: http://www2.ctee.com.br/brazilwindpower/2015/papers/Danilo_Caldas.pdf.
[38] Hydro Quebec Transénergie (HQT), Transmission Provider Techincal
Requirements for the connection of power plants to the Hydro-Québec Transmission
System.February 2009. Availble at web address: http://www.hydroquebec.com/transenergie/fr/commerce/pdf/exigence_raccordement_fev_
09_en.pdf.
[39] CER Commission of Energy Regulation - Utiliy Regulator, DS3 System Services
Technical Definitions, Ireland, December 20 2013. Available at web address: https://www.semcommittee.com/news-centre/ds3-system-services-technical-definitions-
decision-paper.
[40] ENTSO_E, Network Code on Requirements for Grid Connection Applicable to all
Generators (RfG). April 14 2016. Available at web address: https://www.entsoe.eu/major-projects/network-code-development/requirements-for-
generators/Pages/default.aspx.
[41] Steven Saylors, Vestas ROS TSS BoP Engineering NCSA, Ancillary Services
Provided from Wind Power Plant Augmented with Energy Storage, 29 July 2014, IEEE‐PES GM 2014 – National Harbor MD. Available at web address: http://www.ieee-
pes.org/presentations/gm2014/PESGM2014P-000718.pdf.
[42] Philip C. Kjaer (Vestas Wind Systems Denmark), Rasmus Lærke, Germán C.
Tarnowski, Ancillary services provided from wind power plant augmented with energy

64
storage, Power Electronics and Applications (EPE), 2013 15th European Conference.
Available on IEEE Xplore® digital library (http://ieeexplore.ieee.org/Xplore/home.jsp).
[43] Altin, M, Dynamic Frequency Response of Wind Power Plants. PhD Thesis. Aalborg
University, Denmark, 2012. Available at web address http://vbn.aau.dk/files/76661450/Mufit_Altin.pdf.
[44] Tarnowski, G. C., Coordinated Frequency Control of Wind Turbines in Power
Systems with High Wind Power Penetration. PhD Thesis. Technical University of
Denmark, 2012. Available at web address: http://orbit.dtu.dk/files/75259610/gctarnowski_thesis1.pdf.
[45] Zarina, P.P.; Mishra, S.; Sekhar, P.C. Deriving inertial response from a non-inertial
PV system for frequency regulation. In Proceedings of the IEEE International
Conference on Power Electronics, Drives and Energy Systems, Karnataka, India, 16–19 December 2012.
[46] Zarina, P.P.; Mishra, S.; Sekhar, P.C. Photovoltaic system based transient
mitigation and frequency regulation. In Proceedings of the Annual IEEE India
Conference (INDICON), Kochi, India, 7–9 December 2012.
[47] McDonnel Burns, Implementing Smart Grid Communications: Managing Mountains
of Data Opens Up New Challenges for Electric Utilities. TECHBriefs, No. 4, jan. 2008.
[48] G. P. Incremona, F. Giandelli: “Protocolli di comunicazioni per le Smart Grid -
Standard IEC-61850”. Università degli Studi di Pavia, January 20th 2012. Available at the web address: http://www-
2.unipv.it/industriale/images/documenti/didattica/GCA201314/Allegato%205-
1%20Protocolli_Smart_Grid.pdf.
[49] Ministry of Economy, Trade and Instusty (METI), “Revision of the Current
Operation System for the Feed-in Tariff Scheme toward the Maximum Introduction of
Renewable Energy” Jan.,2015. Available at web address: http://www.meti.go.jp/english/press/2015/0122_02.html.
[50] METI, “Promulgation of the Partial Revision of the Act on Special Measures Concerning Procurement of Electricity from Renewable Energy Sources by Electricity
Utilities”, June 3rd, 2016. Available at web address: http://www.meti.go.jp/english/press/2016/0603_06.html.
[51] EU: Wind and Solar based Grid Support Services Project. Co-funded by the
Intelligent Energy Europe, Programme of the European Union. Web address: http://www.reservices-project.eu/.
[52] EnergiNET/DK: The ForskEL- program: Support for research and development of
environmentally friendly power generation technologies. Web address:
http://energinet.dk/EN/FORSKNING/ForskEL-programmet/Sider/default.aspx.
[53] European Forum of Grid Integration & Electricity Ancillary Services. Web address: http://www.prosperoevents.com/past-events/item/72-electricity-ancillary-
services.
[54] 13th European Energy Market Conference, EEM 2016. Web address: http://www.eem2016.com/.
[55] P. Denholm, K.Clark, M.O’Connell, 2016, Emerging Issues and Challenges in
Integrating High Levels of Solar into the Electrical Generation and Transmission
System. Golden, CO: NREL/TP-6A20-65800. Available at web address: http://www.nrel.gov/docs/fy16osti/65800.pdf.
[56] E. Ela, et al., 2014, Active Power Controls form Wind Power: Bridging the Gaps,
NREL/TP-5D00-60574. Available at web address:
http://www.nrel.gov/docs/fy14osti/60574.pdf

65
[57] V. Gevorgian, Y. Zhang, E. Ela, 2015, Investigating the Impacts of Wind Generation
Participation in Interconnection Frequency Response, IEEE Trans. Sustain. Energy, v.6,
no.3, pp. 1004-1012.
[58] K. Ogimoto, K. Ohbayashi, K. Asano, 2016, Progress and future of Japan’s PV deployment, Solar/Wind Integration Workshop
[59] K. Ogimoto, A. Yokoyama, J. Baba, S. Yamada, S. Sakano, S. Ashidate,
Demonstration Test of Integration of Centralized and Distributed Energy Management
for PV Integration, EUPVSEC,5CO.7.3 (2014)

1