Embed Size (px)
Citation preview

i
Economic Impact Analysis
Flinders Island Tourism Region
REPORT PREPARED FOR FLINDERS ISLAND REGIONAL
TOURISM ORGANISATION
June 2013
Flinders Island Tourism Region - Economic Impact Analysis
1
Economic Impact Analysis
Flinders Island Tourism Region
This project has been conducted by REMPLAN
Project Team
Matthew Nichol Principal Economist
Hui Shi Economist
Shayne Campi Research Analyst
June 2013
REMPLAN and Department of Economic Development, Tourism and the Arts hold all rights in relation to this document. Reproduction or distribution of this document in part, or as a whole,
requires the express permission of either of these parties.
DISCLAIMER
All figures and data presented in this document are based on data sourced from the Australia Bureau of Statistics (ABS), and
other government agencies. Tourism data are sourced from Tourism Tasmania, Tourism Research Australia and the
Australian Bureau of Statistics Tourism Satellite Account. Using ABS datasets, the regional economic modelling software
REMPLAN, developed by REMPLAN has been applied to generate industrial economic data estimates. This document is
provided in good faith with every effort made to provide accurate data and apply comprehensive knowledge. However,
REMPLAN does not guarantee the accuracy of data nor the conclusions drawn from this information. A decision to pursue
any actions based on information presented in the report is wholly the responsibility of the party concerned. REMPLAN
advises any party to conduct detailed feasibility studies and seek professional advice before proceeding with any action and
accepts no responsibility for the consequences of pursuing any of the findings or actions discussed in the document.
RESOURCES
All modelling has been undertaken using REMPLAN™
software that has been authored by Principal Research Fellow (ret.), Ian Pinge, at La Trobe University Bendigo.
Contact us:
REMPLAN
PO BOX 5006
SANDHURST EAST,
BENDIGO, VIC 3550
TEL: 1300 737 443
Email: [email protected]
Flinders Island Tourism Region - Economic Impact Analysis
2
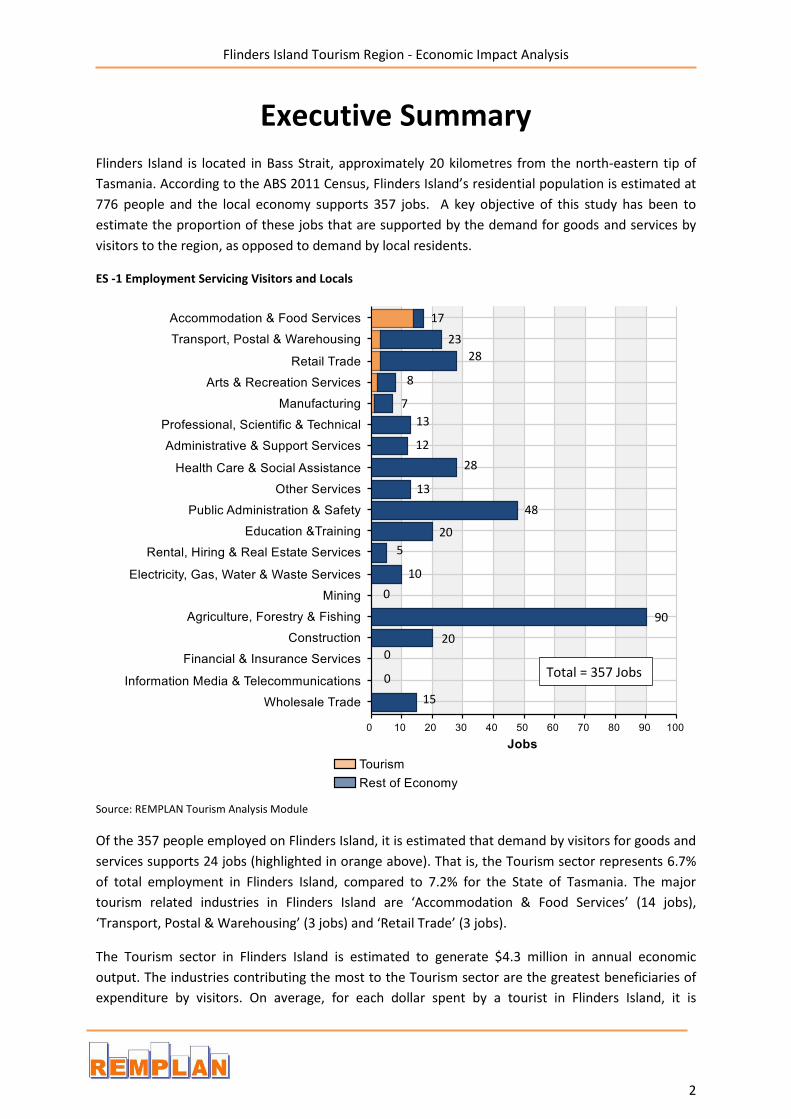
Executive Summary
Flinders Island is located in Bass Strait, approximately 20 kilometres from the north-eastern tip of
Tasmania. According to the ABS 2011 Census, Flinders Island’s residential population is estimated at
776 people and the local economy supports 357 jobs. A key objective of this study has been to
estimate the proportion of these jobs that are supported by the demand for goods and services by
visitors to the region, as opposed to demand by local residents.
ES -1 Employment Servicing Visitors and Locals
Source: REMPLAN Tourism Analysis Module
Of the 357 people employed on Flinders Island, it is estimated that demand by visitors for goods and
services supports 24 jobs (highlighted in orange above). That is, the Tourism sector represents 6.7%
of total employment in Flinders Island, compared to 7.2% for the State of Tasmania. The major
tourism related industries in Flinders Island are ‘Accommodation & Food Services’ (14 jobs),
‘Transport, Postal & Warehousing’ (3 jobs) and ‘Retail Trade’ (3 jobs).
The Tourism sector in Flinders Island is estimated to generate $4.3 million in annual economic
output. The industries contributing the most to the Tourism sector are the greatest beneficiaries of
expenditure by visitors. On average, for each dollar spent by a tourist in Flinders Island, it is
17
23 28
8
7 13
12
28
13
48
20 5
10
0
90
20
15
0
0 Total = 357 Jobs
Flinders Island Tourism Region - Economic Impact Analysis
3
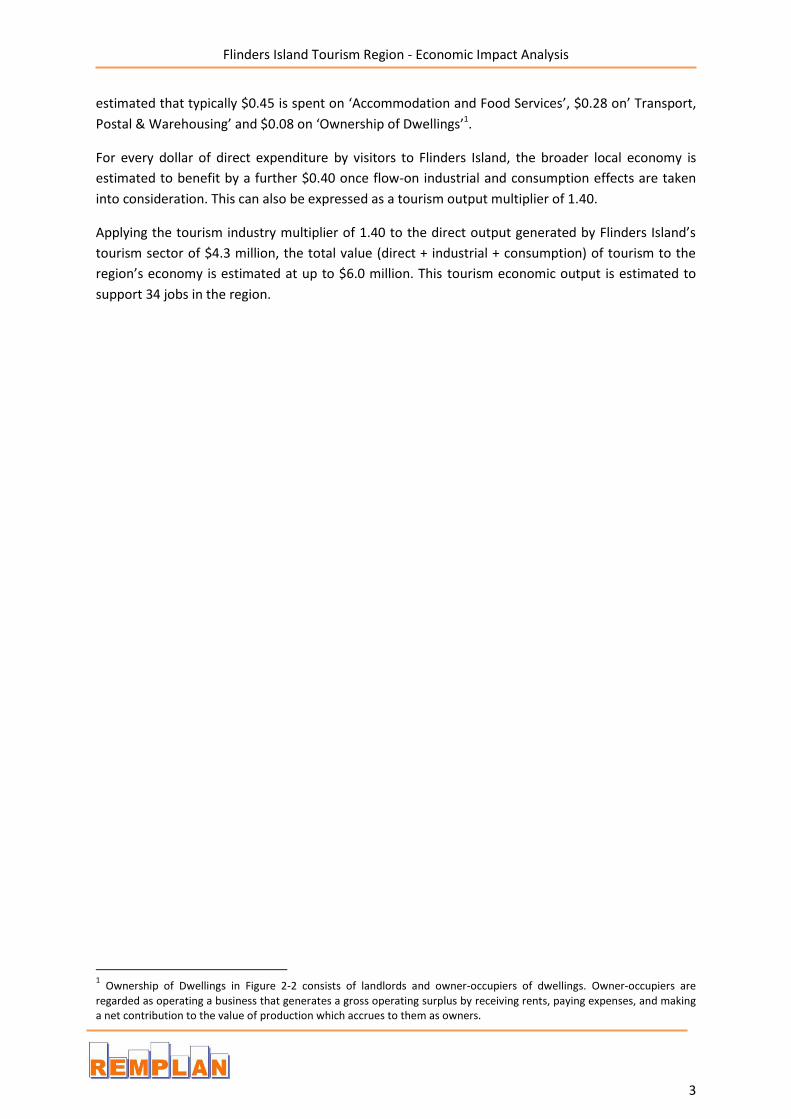
estimated that typically $0.45 is spent on ‘Accommodation and Food Services’, $0.28 on’ Transport,
Postal & Warehousing’ and $0.08 on ‘Ownership of Dwellings’1.
For every dollar of direct expenditure by visitors to Flinders Island, the broader local economy is
estimated to benefit by a further $0.40 once flow-on industrial and consumption effects are taken
into consideration. This can also be expressed as a tourism output multiplier of 1.40.
Applying the tourism industry multiplier of 1.40 to the direct output generated by Flinders Island’s
tourism sector of $4.3 million, the total value (direct + industrial + consumption) of tourism to the
region’s economy is estimated at up to $6.0 million. This tourism economic output is estimated to
support 34 jobs in the region.
1 Ownership of Dwellings in Figure 2-2 consists of landlords and owner-occupiers of dwellings. Owner-occupiers are
regarded as operating a business that generates a gross operating surplus by receiving rents, paying expenses, and making a net contribution to the value of production which accrues to them as owners.
Queenstown
Flinders Island Tourism Region - Economic Impact Analysis
4
Contents
Disclaimer 1
1. INTRODUCTION 5
1.1 Purpose and Aim 5
1.2 Data and Methodology 5
1.3 Region Definition 6
2. TOURISM – FLINDERS ISLAND 7
2.1 Tourism Employment 7
2.2 Tourism Output 9
2.3 Tourism Wages and Salaries 11
2.4 Tourism Value-Added 12
3. SUPPLY CHAINS 13
4. VALUE OF EVENTS, FESTIVALS AND PEAK SEASONS 16
Flinders Island Tourism Region - Economic Impact Analysis
5
1. Introduction
1.1 Purpose and Aim
This report has been prepared in response to a request from the Department of Development,
Tourism and the Arts to assess the economic benefits of tourism in Flinders Island, Tasmania.
Tourism is an amalgam of activities such as retail, accommodation, cafes & restaurants, cultural &
recreational services, and is unique to each region. This report will detail the unique structure of
tourism for Flinders Island in terms of employment, output, wages and salaries and value-added, and
will examine tourism’s contribution to the local economy relative to the other industry sectors. In
addition, the supply chain linkages between tourism and the other industry sectors in the local
economy will be identified. That is, for each dollar of output generated by tourism, the value of
intermediate goods and services that can be supplied in the local region will be identified. These
local supply chains will provide a basis for estimating the multiplying impact of tourism to local
economy.
1.2 Data and Methodology
For this report REMPLAN2 economic modelling has been applied to acquire area-specific industrial
economic data. REMPLAN models are built on the latest available datasets sourced from the
Australian Bureau of Statistics (ABS) and Tourism Research Australia (TRA). The main demographic
and economic datasets used in this report include:
ABS, Place of work data from the 2011 Census of Population and Housing
ABS, 2008/2009, ABS, National Input /Output Tables
ABS, June 2010, Tasmania’s Gross State Product
ABS, 2010, Tourism Satellite Account
2008/2009 and 2011/2012, Tourism Research Australia, Regional Tourism Profiles;
Launceston, Tamar and the North.
These datasets have been used to build REMPLAN Tourism datasets, detailing the economic
contributions of Tourism alongside estimates for other industry sectors for Flinders Island.
Under the methodological approach applied in this report, the economic contributions of the
Tourism sector are determined by the number of local/regional tourism related jobs as a proportion
of tourism related jobs at the national level. Therefore, the greater the number of local jobs in
tourism intensive sectors such as accommodation, the greater the estimate of the region’s tourism
product output, and the greater the region’s proportionate contribution to Australia’s tourism
product output.
Previous research that relies on visitor expenditure from Tourism Research Australia may
overestimate the value of tourism output relative to the output associated with servicing demand
for goods and services by local people. The employment based approach applied in this report
removes the potential for such anomalies to arise as the number of tourism jobs in an area is always
a sub-component of the overall level of employment.
2 www.remplan.com.au
Flinders Island Tourism Region - Economic Impact Analysis
6
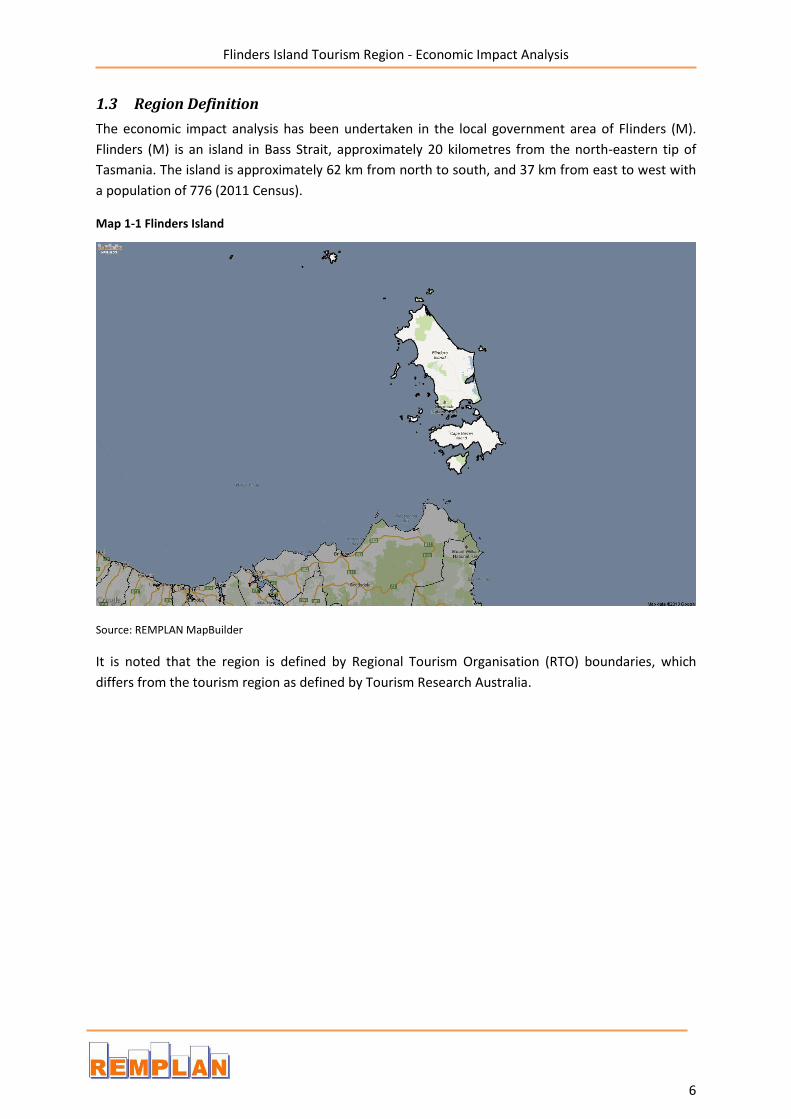
1.3 Region Definition
The economic impact analysis has been undertaken in the local government area of Flinders (M).
Flinders (M) is an island in Bass Strait, approximately 20 kilometres from the north-eastern tip of
Tasmania. The island is approximately 62 km from north to south, and 37 km from east to west with
a population of 776 (2011 Census).
Map 1-1 Flinders Island
Source: REMPLAN MapBuilder
It is noted that the region is defined by Regional Tourism Organisation (RTO) boundaries, which
differs from the tourism region as defined by Tourism Research Australia.

Flinders Island Tourism Region - Economic Impact Analysis
7
2. Tourism – Flinders Island Tourism is an amalgam of activities such as retail, accommodation, cafes & restaurants, cultural &
recreational services, and is unique to each region. The figure below shows the number of people
employed3 by industry sector that are estimated to service the demand from visitors to Flinders
Island. The remainder is the number of jobs that are attributable to servicing demand from local
businesses and consumers.
2.1 Tourism Employment
Figure 2-1 Employment by industry with tourism proportion – Flinders Island
Source: ABS 2011 Census of Population and Housing; REMPLAN Tourism Analysis Module
In total, the Flinders Island economy supports 357 jobs4, of which the total tourism related
employment estimate is 24 jobs. Within Flinders Island, the ‘Accommodation and Food Services’
industry sector employs 17 people, of which 14 (82%) of these jobs are attributable to the tourism
3 The employment data represents the number of people employed by businesses / organisations in each of the industry
sectors in the defined regions. In this report the employment data is place of work data and represents total numbers of employees without any conversions to full-time equivalence. 4 Employment figures are based on the Australian Bureau of Statistics place of work employment data from the 2011
Census.
17
23 28
8
7 13
12
28
13
48
20 5
10
0
90
20
15
0
0 Total = 357 Jobs

Flinders Island Tourism Region - Economic Impact Analysis
8
sector, which has the highest proportion of employees servicing demand for goods and services
from visitors to Flinders Island.
Figure 2-2 further breaks down the number of jobs servicing visitors in each industry sector in
Flinders Island. It is estimated that the Tourism sector employs 24 people in total, which represents
6.7% of total employment in the region.
By comparison, the Tourism sector in Tasmania is estimated to employ 15,137 people, which
represents 7.2% of total jobs across the State.
Figure 2-2 Employment attributable to Tourism – Flinders Island
Source: ABS 2011 Census of Population and Housing; REMPLAN Tourism Analysis Module
Total = 24 Jobs
Flinders Island Tourism Region - Economic Impact Analysis
9
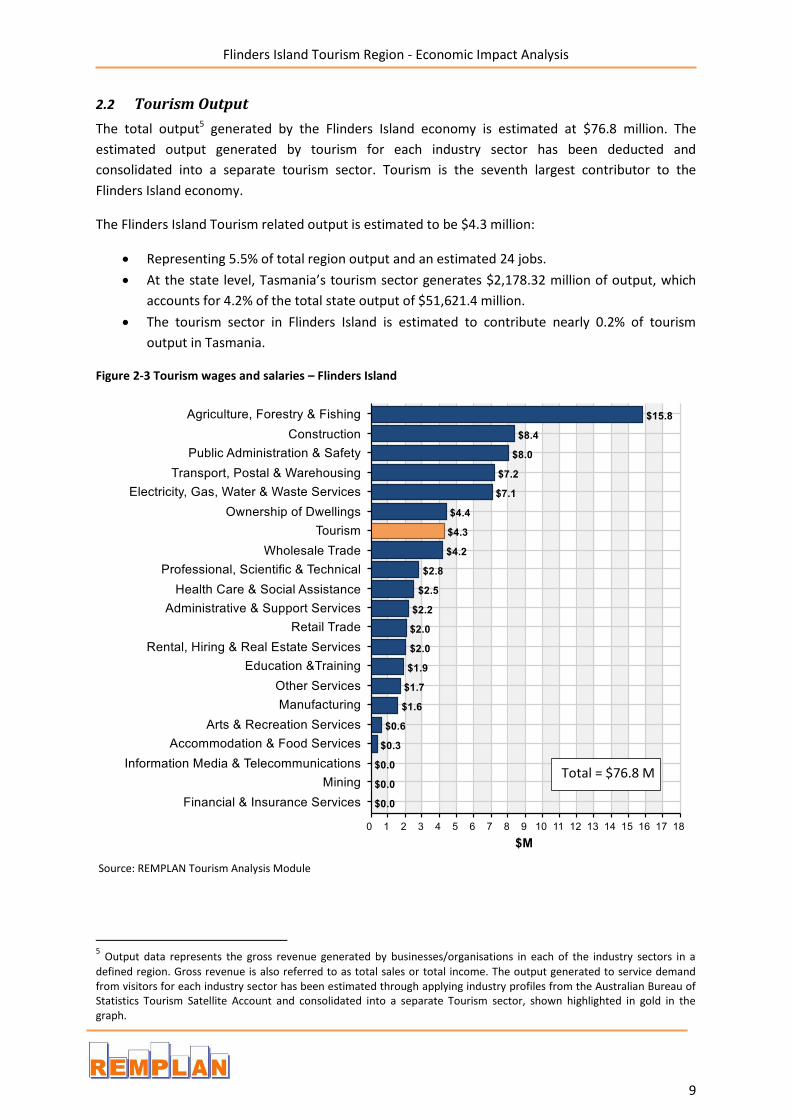
2.2 Tourism Output
The total output5 generated by the Flinders Island economy is estimated at $76.8 million. The
estimated output generated by tourism for each industry sector has been deducted and
consolidated into a separate tourism sector. Tourism is the seventh largest contributor to the
Flinders Island economy.
The Flinders Island Tourism related output is estimated to be $4.3 million:
Representing 5.5% of total region output and an estimated 24 jobs.
At the state level, Tasmania’s tourism sector generates $2,178.32 million of output, which
accounts for 4.2% of the total state output of $51,621.4 million.
The tourism sector in Flinders Island is estimated to contribute nearly 0.2% of tourism
output in Tasmania.
Figure 2-3 Tourism wages and salaries – Flinders Island
Source: REMPLAN Tourism Analysis Module
5 Output data represents the gross revenue generated by businesses/organisations in each of the industry sectors in a
defined region. Gross revenue is also referred to as total sales or total income. The output generated to service demand from visitors for each industry sector has been estimated through applying industry profiles from the Australian Bureau of Statistics Tourism Satellite Account and consolidated into a separate Tourism sector, shown highlighted in gold in the graph.
Total = $76.8 M
Flinders Island Tourism Region - Economic Impact Analysis
10
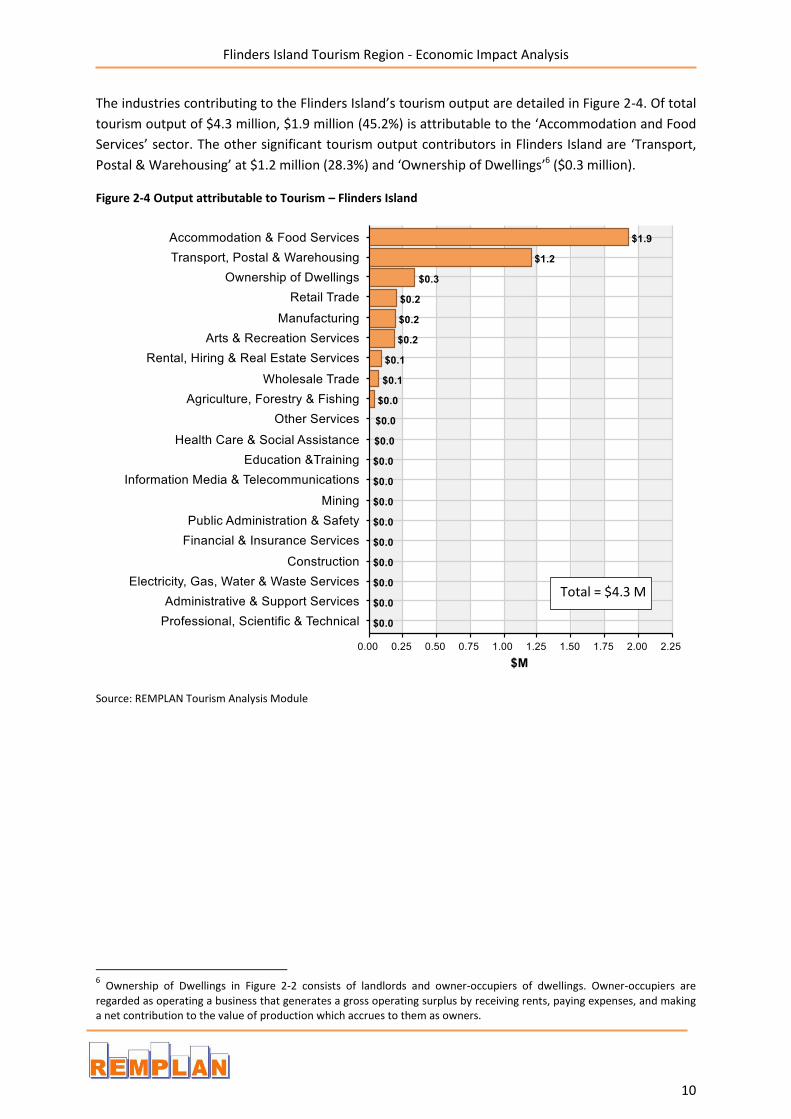
The industries contributing to the Flinders Island’s tourism output are detailed in Figure 2-4. Of total
tourism output of $4.3 million, $1.9 million (45.2%) is attributable to the ‘Accommodation and Food
Services’ sector. The other significant tourism output contributors in Flinders Island are ‘Transport,
Postal & Warehousing’ at $1.2 million (28.3%) and ‘Ownership of Dwellings’6 ($0.3 million).
Figure 2-4 Output attributable to Tourism – Flinders Island
Source: REMPLAN Tourism Analysis Module
6 Ownership of Dwellings in Figure 2-2 consists of landlords and owner-occupiers of dwellings. Owner-occupiers are
regarded as operating a business that generates a gross operating surplus by receiving rents, paying expenses, and making a net contribution to the value of production which accrues to them as owners.
Total = $4.3 M
Flinders Island Tourism Region - Economic Impact Analysis
11
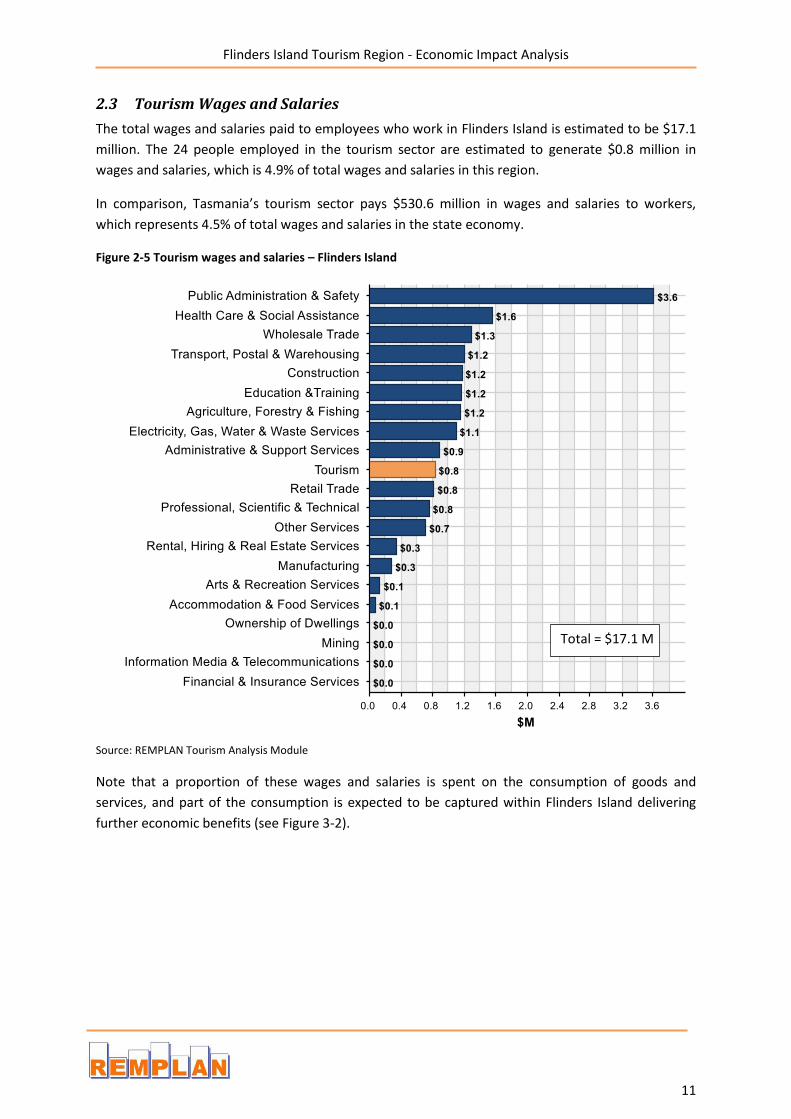
2.3 Tourism Wages and Salaries
The total wages and salaries paid to employees who work in Flinders Island is estimated to be $17.1
million. The 24 people employed in the tourism sector are estimated to generate $0.8 million in
wages and salaries, which is 4.9% of total wages and salaries in this region.
In comparison, Tasmania’s tourism sector pays $530.6 million in wages and salaries to workers,
which represents 4.5% of total wages and salaries in the state economy.
Figure 2-5 Tourism wages and salaries – Flinders Island
Source: REMPLAN Tourism Analysis Module
Note that a proportion of these wages and salaries is spent on the consumption of goods and
services, and part of the consumption is expected to be captured within Flinders Island delivering
further economic benefits (see Figure 3-2).
Total = $17.1 M

Flinders Island Tourism Region - Economic Impact Analysis
12
2.4 Tourism Value-Added
The value that is added by industry sectors in Flinders Island to intermediate goods and services is
presented in Figure 2-6. The total value-added7 in the Region is estimated at $34.9 million, of which
the tourism sector contributes $1.7 million or 5%.
In comparison, the tourism sector in Tasmania generates $979.8 million of value-added,
representing 4.4% of the State’s total value-added. The Flinders Island tourism sector contributes
0.17% ($1.7 million) of the State’s tourism value-added ($979.8 million).
Figure 2-6 Tourism value-added – Flinders Island
Source: REMPLAN Tourism Analysis Module
Value-added represents the contributions that industries make to Flinders Island’s Gross Regional
Product (GRP)8 and Tasmania’s Gross State Product.
7 Value-added represents the marginal economic value that is added by each industry sector in a defined region. Value-
added can be calculated by subtracting local expenditure and expenditure on regional imports from the output generated by an industry sector, or alternatively, by adding the Wages and Salaries paid to local employees, the gross operating surplus and taxes on products and production. Value-Added by industry sector is the major element in the calculation of Gross Regional Product (GRP).
8 GRP is the total value added to final goods and services produced in the region over the period of one year; this includes
exports but excludes imports. This methodology is the same as that used to calculate Gross Domestic Product (GDP) at a national level. GRP can be measured by using either the expenditure approach or the incomes approach.
Total = $34.9 M
Flinders Island Tourism Region - Economic Impact Analysis
13
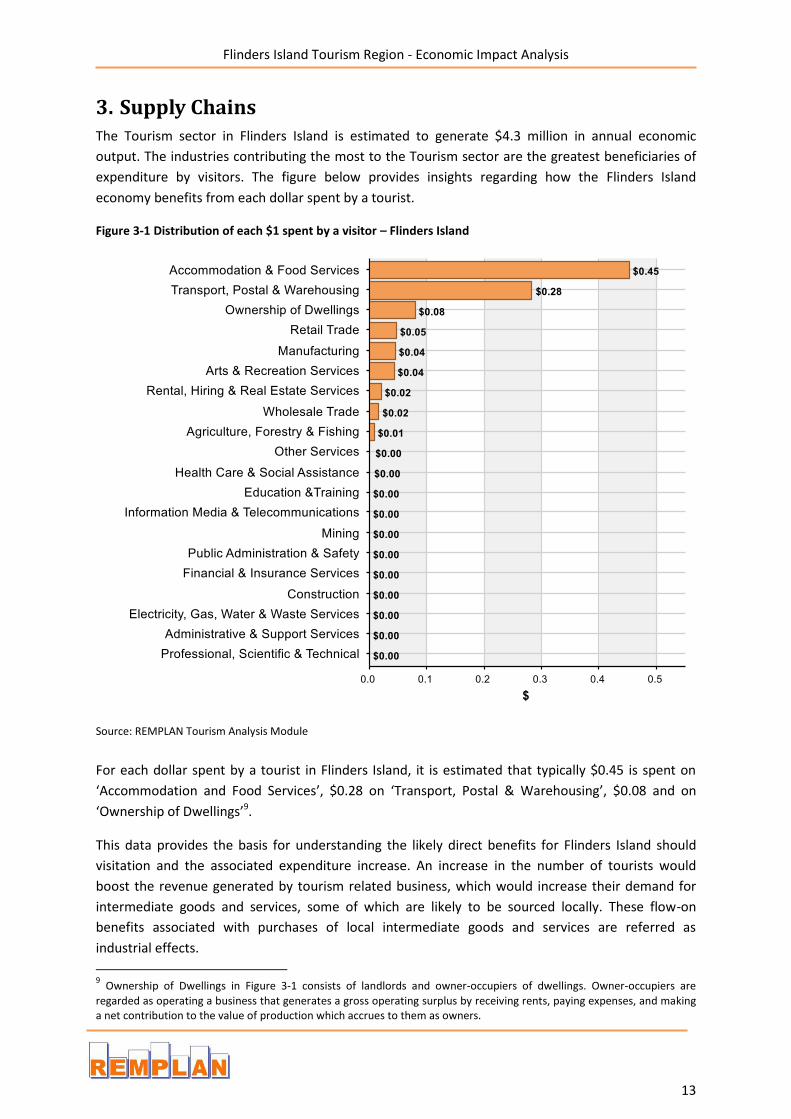
3. Supply Chains The Tourism sector in Flinders Island is estimated to generate $4.3 million in annual economic
output. The industries contributing the most to the Tourism sector are the greatest beneficiaries of
expenditure by visitors. The figure below provides insights regarding how the Flinders Island
economy benefits from each dollar spent by a tourist.
Figure 3-1 Distribution of each $1 spent by a visitor – Flinders Island
Source: REMPLAN Tourism Analysis Module
For each dollar spent by a tourist in Flinders Island, it is estimated that typically $0.45 is spent on
‘Accommodation and Food Services’, $0.28 on ‘Transport, Postal & Warehousing’, $0.08 and on
‘Ownership of Dwellings’9.
This data provides the basis for understanding the likely direct benefits for Flinders Island should
visitation and the associated expenditure increase. An increase in the number of tourists would
boost the revenue generated by tourism related business, which would increase their demand for
intermediate goods and services, some of which are likely to be sourced locally. These flow-on
benefits associated with purchases of local intermediate goods and services are referred as
industrial effects.
9 Ownership of Dwellings in Figure 3-1 consists of landlords and owner-occupiers of dwellings. Owner-occupiers are
regarded as operating a business that generates a gross operating surplus by receiving rents, paying expenses, and making a net contribution to the value of production which accrues to them as owners.
Flinders Island Tourism Region - Economic Impact Analysis
14
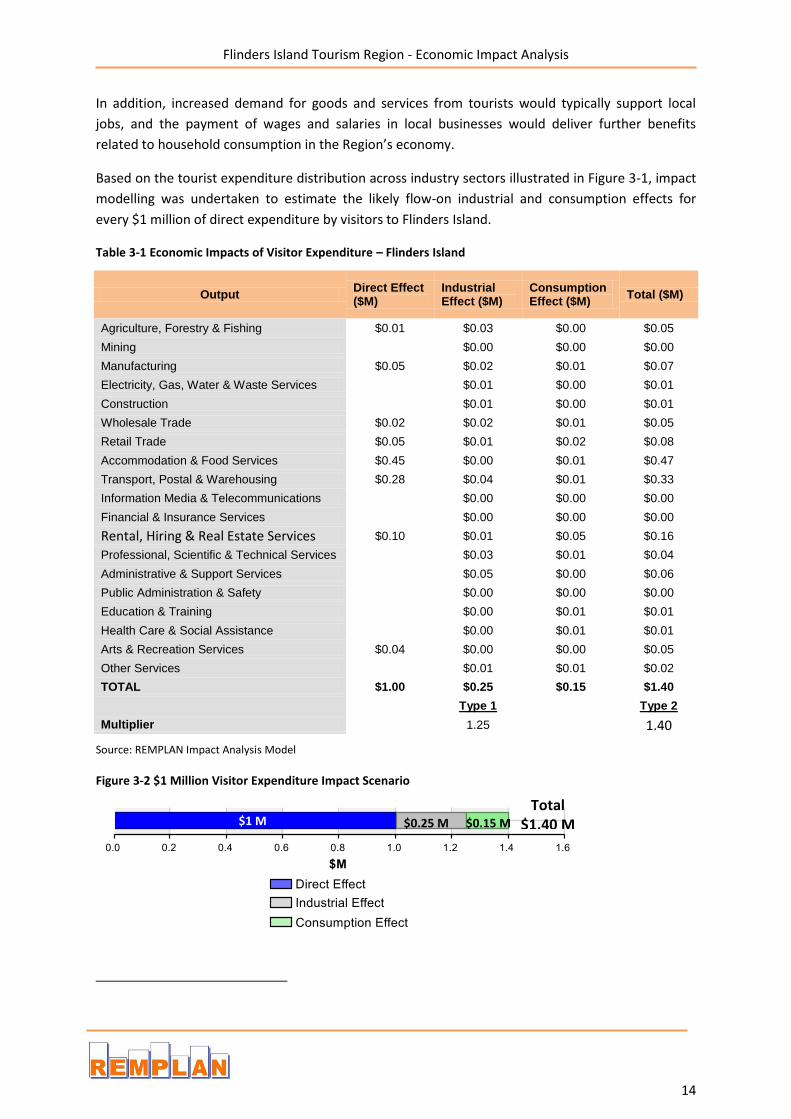
In addition, increased demand for goods and services from tourists would typically support local
jobs, and the payment of wages and salaries in local businesses would deliver further benefits
related to household consumption in the Region’s economy.
Based on the tourist expenditure distribution across industry sectors illustrated in Figure 3-1, impact
modelling was undertaken to estimate the likely flow-on industrial and consumption effects for
every $1 million of direct expenditure by visitors to Flinders Island.
Table 3-1 Economic Impacts of Visitor Expenditure – Flinders Island
Source: REMPLAN Impact Analysis Model
Figure 3-2 $1 Million Visitor Expenditure Impact Scenario
Output Direct Effect ($M)
Industrial Effect ($M)
Consumption Effect ($M)
Total ($M)
Agriculture, Forestry & Fishing $0.01 $0.03 $0.00 $0.05
Mining
$0.00 $0.00 $0.00
Manufacturing $0.05 $0.02 $0.01 $0.07
Electricity, Gas, Water & Waste Services
$0.01 $0.00 $0.01
Construction
$0.01 $0.00 $0.01
Wholesale Trade $0.02 $0.02 $0.01 $0.05
Retail Trade $0.05 $0.01 $0.02 $0.08
Accommodation & Food Services $0.45 $0.00 $0.01 $0.47
Transport, Postal & Warehousing $0.28 $0.04 $0.01 $0.33
Information Media & Telecommunications
$0.00 $0.00 $0.00
Financial & Insurance Services
$0.00 $0.00 $0.00
Rental, Hiring & Real Estate Services $0.10 $0.01 $0.05 $0.16
Professional, Scientific & Technical Services
$0.03 $0.01 $0.04
Administrative & Support Services
$0.05 $0.00 $0.06
Public Administration & Safety
$0.00 $0.00 $0.00
Education & Training
$0.00 $0.01 $0.01
Health Care & Social Assistance
$0.00 $0.01 $0.01
Arts & Recreation Services $0.04 $0.00 $0.00 $0.05
Other Services
$0.01 $0.01 $0.02
TOTAL $1.00 $0.25 $0.15 $1.40
Type 1
Type 2
Multiplier
1.25
1.40
$1 M $0.25 M $0.15 M
Total $1.40 M
Flinders Island Tourism Region - Economic Impact Analysis
15
For $1 million of direct expenditure by visitors to Flinders Island, the local economy is estimated to
benefit by a further $0.40 million once flow-on industrial and consumption effects are taken into
consideration. This can also be expressed as a tourism output multiplier of 1.40.
Applying the tourism industry multiplier of 1.40 to the direct output generated by Flinders Island’s
tourism sector of $4.3 million, the total value (direct + industrial + consumption) of tourism to the
region’s economy is estimated at up to $6.0 million. This economic output is estimated to support 34
jobs in the region.
In comparison to the state level impact modelling scenario, the Tourism sector output multiplier for
Tasmania is 2.10, which implies that $1 million of visitor expenditure captured by Tasmania’s
economy would deliver a further $1.1 million benefit to the state.
Flinders Island Tourism Region - Economic Impact Analysis
16
4. Value of Events, Festivals and Peak Seasons
Section 3 details how visitors’ expenditure is likely to flow through the Flinders Island economy to
benefit other industry sectors. A key question remaining is how much is each visitor to the area
likely to spend?
This information can be captured via visitor surveys or sourced from previous studies undertaken in
relation to similar events. Tourism Research Australia’s Regional Tourism profiles also provide broad
guidance regarding expenditure by visitor type.
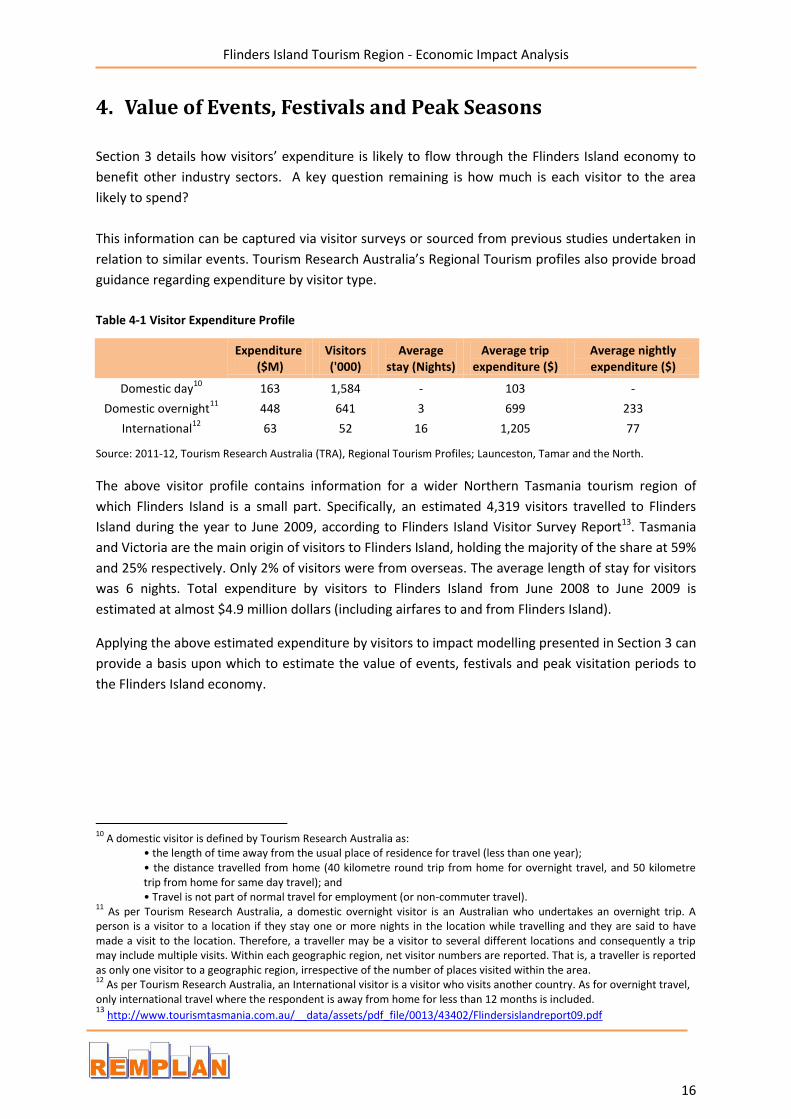
Table 4-1 Visitor Expenditure Profile
Expenditure ($M)
Visitors ('000)
Average stay (Nights)
Average trip expenditure ($)
Average nightly expenditure ($)
Domestic day10
163 1,584 - 103 -
Domestic overnight11
448 641 3 699 233
International12
63 52 16 1,205 77
Source: 2011-12, Tourism Research Australia (TRA), Regional Tourism Profiles; Launceston, Tamar and the North.
The above visitor profile contains information for a wider Northern Tasmania tourism region of
which Flinders Island is a small part. Specifically, an estimated 4,319 visitors travelled to Flinders
Island during the year to June 2009, according to Flinders Island Visitor Survey Report13. Tasmania
and Victoria are the main origin of visitors to Flinders Island, holding the majority of the share at 59%
and 25% respectively. Only 2% of visitors were from overseas. The average length of stay for visitors
was 6 nights. Total expenditure by visitors to Flinders Island from June 2008 to June 2009 is
estimated at almost $4.9 million dollars (including airfares to and from Flinders Island).
Applying the above estimated expenditure by visitors to impact modelling presented in Section 3 can
provide a basis upon which to estimate the value of events, festivals and peak visitation periods to
the Flinders Island economy.
10
A domestic visitor is defined by Tourism Research Australia as: • the length of time away from the usual place of residence for travel (less than one year); • the distance travelled from home (40 kilometre round trip from home for overnight travel, and 50 kilometre trip from home for same day travel); and • Travel is not part of normal travel for employment (or non-commuter travel).
11 As per Tourism Research Australia, a domestic overnight visitor is an Australian who undertakes an overnight trip. A
person is a visitor to a location if they stay one or more nights in the location while travelling and they are said to have made a visit to the location. Therefore, a traveller may be a visitor to several different locations and consequently a trip may include multiple visits. Within each geographic region, net visitor numbers are reported. That is, a traveller is reported as only one visitor to a geographic region, irrespective of the number of places visited within the area. 12
As per Tourism Research Australia, an International visitor is a visitor who visits another country. As for overnight travel, only international travel where the respondent is away from home for less than 12 months is included. 13
http://www.tourismtasmania.com.au/__data/assets/pdf_file/0013/43402/Flindersislandreport09.pdf