Embed Size (px)
Citation preview
1
2
3
4
5
67
89
10
11
12
13
14
15
16
17
18
19
20
21
22
23
24
2526
27
28
29
30
International Journal of Sustainable Built Environment (2016) xxx, xxx–xxx
IJSBE 141 No. of Pages 14
3 October 2016
HO ST E D BYGulf Organisation for Research and Development
International Journal of Sustainable Built Environment
ScienceDirectwww.sciencedirect.com
Original Article/Research
Flood hazard assessment under climate change scenarios in theYang River Basin, Thailand
Sangam Shrestha ⇑, Worapong Lohpaisankrit
Water Engineering and Management, School of Engineering and Technology, Asian Institute of Technology, P.O. Box 4, Klong Luang, Pathumthani
12120, Thailand
Received 27 May 2015; accepted 26 September 2016
Abstract
Climate change is expected to increase both the magnitude and frequency of extreme precipitation events, which may lead to moreintense and frequent river flooding. This study aims to assess the flood hazard potential under climate change scenarios in Yang RiverBasin of Thailand. A physically-based distributed hydrological model, Block-wise use of TOPMODEL using Muskingum-Cunge flowrouting (BTOPMC) and hydraulic model, HEC-RAS was used to simulate the floods under future climate scenarios. Future climate sce-narios were constructed from the bias corrected outputs of three General Circulation Models (GCMs) for 2020s, 2050s and 2080s.Results show that basin will get warmer and wetter in future. Both the minimum and maximum temperature of the basin is projectedto increase in future. Similarly average annual rainfall is also projected to increase in future, higher in near future and lower in far future.The extreme runoff pattern and synthetic inflow hydrographs for 25, 50 and 100 year return flood were derived from an extreme flood of2007 which were then fed into HEC-RAS model to generate the flood inundation maps in the basin. The intensity of annual floods isexpected increase for both RCP 4.5 and 8.5 scenarios. Compared to the baseline period, an additional 60 km2 area of basin is projectedto be flooded with the return period of 100 years. The results of this study will be helpful to formulate adaptation strategies to offset thenegative impacts of flooding on different land use activities in Yang River Basin.� 2016 The Gulf Organisation for Research and Development. Production and hosting by Elsevier B.V. All rights reserved.
Keywords: Climate change; RCP scenarios; Flood hazard; Thailand; Hydrological modeling; Hydraulic modeling
31
32
33
34
35
1. Introduction
Yang River Basin is one of the most flood prone basinsin Northeast Thailand (Kuntiyawichai et al., 2011a,b). Sev-eral studies on climate change impact assessment and flood
36
37
38
39
40
41
http://dx.doi.org/10.1016/j.ijsbe.2016.09.006
2212-6090/� 2016 The Gulf Organisation for Research and Development. Pro
⇑ Corresponding author. Fax: +66 2 524 6425.E-mail addresses: [email protected], [email protected]
(S. Shrestha).
Peer review under responsibility of The Gulf Organisation for Researchand Development.
Please cite this article in press as: Shrestha, S., Lohpaisankrit, W. Flood hazThailand. International Journal of Sustainable Built Environment (2016), h
management strategies have been conducted on its mainbasin, Chi River Basin, in recent years (Chaleeraktrakoonand Khwanket, 2013; Artlert et al., 2013; Kuntiyawichaiet al., 2011a,b). These studies reported that climate changeis consistent and it has strong implications on the basinscale hydrological cycle. Other studies done globally indi-cate the altercated meteorological variables have greatpotential to change the frequency and intensity of extremeevents specially floods (Dobler et al., 2012; Viviroli et al.,2011). The increase in temperature accelerates theevapotranspiration process which further influences the
duction and hosting by Elsevier B.V. All rights reserved.
ard assessment under climate change scenarios in the Yang River Basin,ttp://dx.doi.org/10.1016/j.ijsbe.2016.09.006
42
43
44
45
46
47
48
49
50
51
52
53
54
55
56
57
58
59
60
61
62
63
64
65
66
67
68
69
70
71
72
73
74
75
76
77
78
79
80
81
82
83
84
85
86
87
88
89
90
91
92
93
94
95
96
97
98
99
100
101
102
103
104
105
106
107
108
109
110
111
112
113
114
115
116
117
118
119
120
121
122
123
124
125
126
127
128
129
130
131
132
133
134
135
136
137
138
139
140
141
142
143
144
145
146
147
148
149
150
151
152
2 S. Shrestha, W. Lohpaisankrit / International Journal of Sustainable Built Environment xxx (2016) xxx–xxx
IJSBE 141 No. of Pages 14
3 October 2016
precipitation amount and ultimately contributes in modifi-cation of seasonal runoff. The present intra-annular vari-ability in the amount of runoff is expected to shift underclimate change scenarios at many regions of the worldincluding Thailand (Dobler et al., 2010).
In addition to the projected changes in the hydrologicalregime, the climate change will also have implications onthe extreme events. Studies have demonstrated that floodintensity is highly sensitive to temperature in many partsof the world (Prudhomme et al., 2013; Menzel et al.,2002; Panagoulia and Dimou, 1997). Several other studiesalso have argued that climate has been a contributing fac-tor to flood risk by raising the precipitation amount rela-tive to the average annual rainfall (Fleming et al., 2012;Hirabayashi et al., 2008). Therefore, basin scale assessmentof climate change impacts on flood plays a key role in for-mulation and evaluation of adaptation and mitigationstrategies for flood risk management.
Literature suggests that climate change impact assess-ment on extreme events has been less investigated and pos-sesses higher uncertainty (Dobler et al., 2012). In addition,whatsoever the research has been conducted, primary focusis on the basin of developed nations (Bauwens et al., 2011;Prudhomme et al., 2010; Steele-Dunne et al., 2008). Alsofocusing on Asian countries, many studies on floodsinduced by climate change have been conducted on severalbasins in China (Li et al., 2013; Zheng et al., 2012; Yanget al., 2012). This implies less focus on basins of developingcountries lying on the tropical regions which are evidentlymore susceptible to floods where the region has alreadyhigh precipitation and the hydrologic cycle is highly inter-linked and sensitive to its components (Kite, 2001).Although considerable studies on floods have been con-ducted in Northeast of Thailand yet only few of studieswere on the impact of climate change on extreme events(Jothityangkoon et al., 2013; Hunukumbura andThailand, 2012). Despite several flood events in Yang RiverBasin most of the studies focused on the management prac-tices and socio-economic impacts of floods(Keokhumcheng et al., 2012; Dutta, 2011; Hungspreuget al., 2000). Shrestha (2014) studied the climate changeimpact on flood hazard potential in Yang River Basin.However, the study used the climate change projectionsfrom Special Report on Emission Scenarios (SRES) andonly one Regional Climate Model, which poses greateruncertainty in flood hazard assessment. Hence the basinscale study of climate change impact on flood hazard usingfuture climate data from multiple climate models and newemission scenarios is important in Thailand.
Another important factor that has decisively influencedthe climate change impact studies is the use of Global Cir-culation Models (GCMs) and Regional Climate Models(RCMs) dataset for the future climate projection withoutbias correction (Cloke et al., 2013). Although RCMs per-form nested dynamic downscaling to the outputs of theGeneral Circulation Models (GCMs), yet the spatial reso-lution makes the data unreliable for basin scale impact
Please cite this article in press as: Shrestha, S., Lohpaisankrit, W. Flood hazThailand. International Journal of Sustainable Built Environment (2016), h
assessment studies and is necessary to be bias corrected(Muerth et al., 2013). A few studies have been conductedso far on analysis of different downscaling techniques withemphasis on extreme events. A comparison study of sixdownscaling technique with three RCMs suggests both sta-tistical and dynamic downscaling tends to have similarbias. However, the choice of method of downscalingdepends on variables to be downscaled (Schmidli et al.,2007). Leander and Buishand (2007) satisfactorily usedthe power law transformation method for RCM outputsat Western Europe for estimation of extreme events.
Many studies have adopted various climate change sce-narios to evaluate these effects. The scenarios presented inthe Special Report on Emission Scenarios (SRES) in theIntergovernmental Panel on Climate Change (IPCC)Fourth Assessment Report (AR4) (IPCC, 2007) have beenwidely applied to investigate hydrological responses to cli-mate change (Praskievicz and Chang, 2011; Moradkhaniet al.; 2010; Ficklin et al., 2009; Tu, 2009; Yoshimuraet al., 2009). The Fifth Assessment Report (AR5) of theIPCC published in 2014 includes new scenarios based onvarious technical developments. These new scenarios,called Representative Concentration Pathways (RCPs),are a set of greenhouse gas concentration and emissionpathways designed to support research on the impacts ofand potential policy responses to climate change (Riahiet al., 2011; Van Vuuren et al., 2011; Moss et al., 2010).The RCPs are also considered to include impacts causedby landuse and land cover (LULC) change.
The present study is conducted to assess the climatechange impact on flood hazard potential in Yang RiverBasin with the following objectives: (i) to developrainfall-runoff model of the Yang River Basin, (ii) to designsynthetic hydrographs with return periods of 25, 50 and100 years with regard to future climate conditions, and(iii) to simulate flood hazard potential representing returnperiods of 25, 50 and 100 years under future climate changescenarios. This study assumes that land use activities andpopulation remains the same in future. Although manyGCMs are available, only 3 GCMs and two RCPs wereselected to construct the future climate scenarios to addressthe uncertainty in climate change projections.
2. Materials and methods
2.1. Study area and data description
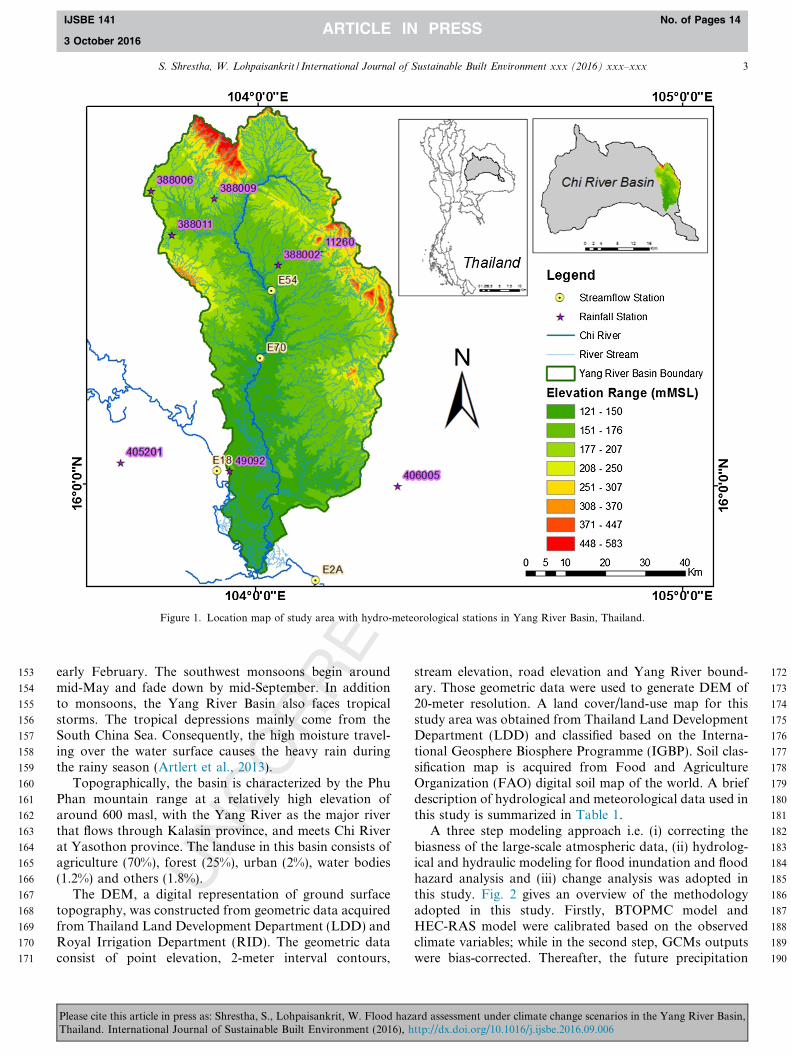
The Yang River Basin, a sub-basin of Chi River Basin,has a drainage area of approximately 4145 km2 whichreceives an average annual rainfall of 1390 mm (Fig. 1).The annual relative humidity and temperature are approx.71% and 26.7 �C respectively in the basin. The basin isinfluenced by two prominent wind systems, the northeastand southwest monsoons which are responsible for therainfall patterns and temperature variations. In the north-east monsoons, the dry cold wind picks up some moisturefrom the northeast, it takes place from mid-October to
ard assessment under climate change scenarios in the Yang River Basin,ttp://dx.doi.org/10.1016/j.ijsbe.2016.09.006
153
154
155
156
157
158
159
160
161
162
163
164
165
166
167
168
169
170
171
172
173
174
175
176
177
178
179
180
181
182
183
184
185
186
187
188
189
190
Figure 1. Location map of study area with hydro-meteorological stations in Yang River Basin, Thailand.
S. Shrestha, W. Lohpaisankrit / International Journal of Sustainable Built Environment xxx (2016) xxx–xxx 3
IJSBE 141 No. of Pages 14
3 October 2016
early February. The southwest monsoons begin aroundmid-May and fade down by mid-September. In additionto monsoons, the Yang River Basin also faces tropicalstorms. The tropical depressions mainly come from theSouth China Sea. Consequently, the high moisture travel-ing over the water surface causes the heavy rain duringthe rainy season (Artlert et al., 2013).
Topographically, the basin is characterized by the PhuPhan mountain range at a relatively high elevation ofaround 600 masl, with the Yang River as the major riverthat flows through Kalasin province, and meets Chi Riverat Yasothon province. The landuse in this basin consists ofagriculture (70%), forest (25%), urban (2%), water bodies(1.2%) and others (1.8%).
The DEM, a digital representation of ground surfacetopography, was constructed from geometric data acquiredfrom Thailand Land Development Department (LDD) andRoyal Irrigation Department (RID). The geometric dataconsist of point elevation, 2-meter interval contours,
Please cite this article in press as: Shrestha, S., Lohpaisankrit, W. Flood hazThailand. International Journal of Sustainable Built Environment (2016), h
stream elevation, road elevation and Yang River bound-ary. Those geometric data were used to generate DEM of20-meter resolution. A land cover/land-use map for thisstudy area was obtained from Thailand Land DevelopmentDepartment (LDD) and classified based on the Interna-tional Geosphere Biosphere Programme (IGBP). Soil clas-sification map is acquired from Food and AgricultureOrganization (FAO) digital soil map of the world. A briefdescription of hydrological and meteorological data used inthis study is summarized in Table 1.
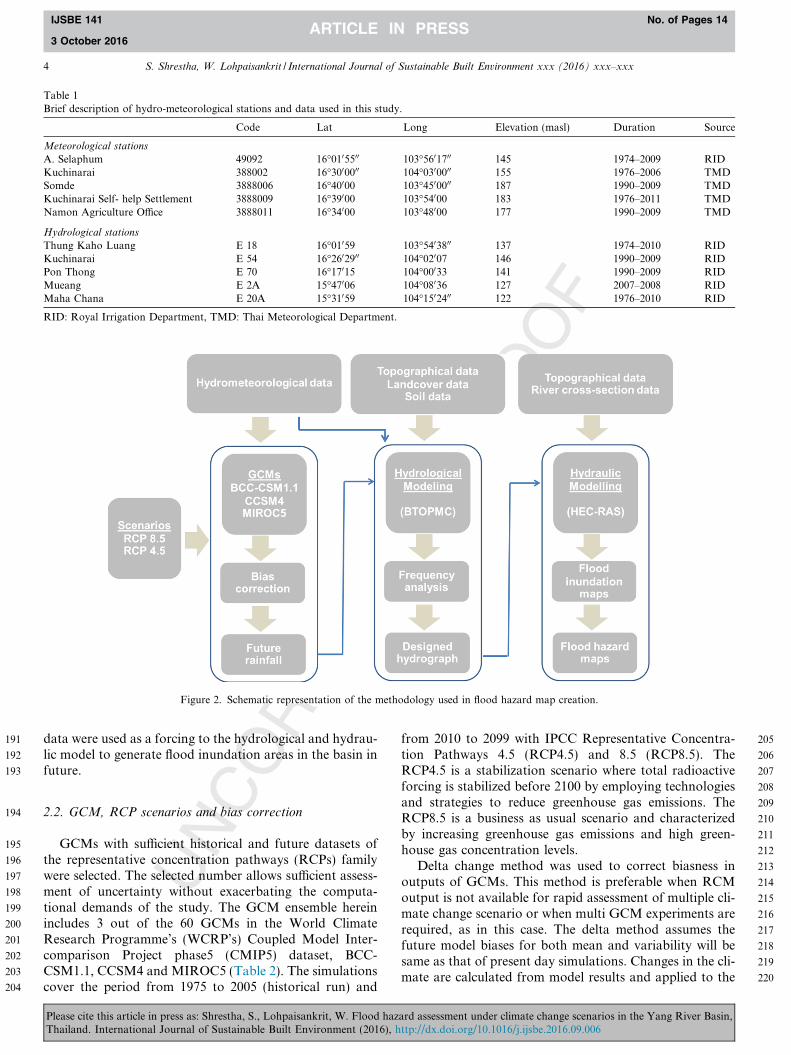
A three step modeling approach i.e. (i) correcting thebiasness of the large-scale atmospheric data, (ii) hydrolog-ical and hydraulic modeling for flood inundation and floodhazard analysis and (iii) change analysis was adopted inthis study. Fig. 2 gives an overview of the methodologyadopted in this study. Firstly, BTOPMC model andHEC-RAS model were calibrated based on the observedclimate variables; while in the second step, GCMs outputswere bias-corrected. Thereafter, the future precipitation
ard assessment under climate change scenarios in the Yang River Basin,ttp://dx.doi.org/10.1016/j.ijsbe.2016.09.006
191
192
193
194
195
196
197
198
199
200
201
202
203
204
205
206
207
Table 1Brief description of hydro-meteorological stations and data used in this study.
Code Lat Long Elevation (masl) Duration Source
Meteorological stations
A. Selaphum 49092 16�0105500 103�5601700 145 1974–2009 RIDKuchinarai 388002 16�3000000 104�0300000 155 1976–2006 TMDSomde 3888006 16�40000 103�4500000 187 1990–2009 TMDKuchinarai Self- help Settlement 3888009 16�39000 103�54000 183 1976–2011 TMDNamon Agriculture Office 3888011 16�34000 103�48000 177 1990–2009 TMD
Hydrological stations
Thung Kaho Luang E 18 16�01059 103�5403800 137 1974–2010 RIDKuchinarai E 54 16�2602900 104�02007 146 1990–2009 RIDPon Thong E 70 16�17015 104�00033 141 1990–2009 RIDMueang E 2A 15�47006 104�08036 127 2007–2008 RIDMaha Chana E 20A 15�31059 104�1502400 122 1976–2010 RID
RID: Royal Irrigation Department, TMD: Thai Meteorological Department.
Figure 2. Schematic representation of the methodology used in flood hazard map creation.
4 S. Shrestha, W. Lohpaisankrit / International Journal of Sustainable Built Environment xxx (2016) xxx–xxx
IJSBE 141 No. of Pages 14
3 October 2016
data were used as a forcing to the hydrological and hydrau-lic model to generate flood inundation areas in the basin infuture.
208
209
210
211
212
213
214
215
216
217
218
219
220
2.2. GCM, RCP scenarios and bias correction
GCMs with sufficient historical and future datasets ofthe representative concentration pathways (RCPs) familywere selected. The selected number allows sufficient assess-ment of uncertainty without exacerbating the computa-tional demands of the study. The GCM ensemble hereinincludes 3 out of the 60 GCMs in the World ClimateResearch Programme’s (WCRP’s) Coupled Model Inter-comparison Project phase5 (CMIP5) dataset, BCC-CSM1.1, CCSM4 and MIROC5 (Table 2). The simulationscover the period from 1975 to 2005 (historical run) and
Please cite this article in press as: Shrestha, S., Lohpaisankrit, W. Flood hazThailand. International Journal of Sustainable Built Environment (2016), h
from 2010 to 2099 with IPCC Representative Concentra-tion Pathways 4.5 (RCP4.5) and 8.5 (RCP8.5). TheRCP4.5 is a stabilization scenario where total radioactiveforcing is stabilized before 2100 by employing technologiesand strategies to reduce greenhouse gas emissions. TheRCP8.5 is a business as usual scenario and characterizedby increasing greenhouse gas emissions and high green-house gas concentration levels.
Delta change method was used to correct biasness inoutputs of GCMs. This method is preferable when RCMoutput is not available for rapid assessment of multiple cli-mate change scenario or when multi GCM experiments arerequired, as in this case. The delta method assumes thefuture model biases for both mean and variability will besame as that of present day simulations. Changes in the cli-mate are calculated from model results and applied to the
ard assessment under climate change scenarios in the Yang River Basin,ttp://dx.doi.org/10.1016/j.ijsbe.2016.09.006
221
222
223
224
225
226
227
228
229
230
231
232
233
234
235
236
237
238
239
240
241
Table 2A list of the climate models used in this study with a brief indication of their origin, resolution and the number of realizations available for each climatechange scenario.
Model’s name Resolution(�)
Grids (Long-Lat)
Scenarios Research center
Beijing Climate Center Climate System Model version 1.1 (BCC-CSM1.1)
2.81 � 2.81 128 � 64 RCP4.5RCP8.5
BCC, China MeteorologicalAdministration, China
The Community Climate System Model version 4 (CCSM4) 1.25 � 0.90 288 � 192 RCP4.5RCP8.5
National Center for AtmosphericResearch, USA
Model for Interdisciplinary Research on Climate-Earth System,version 5 (MIROC5)
1.40 � 1.40 256 � 128 RCP4.5RCP8.5
Atmosphere and Ocean ResearchInstitute, Japan
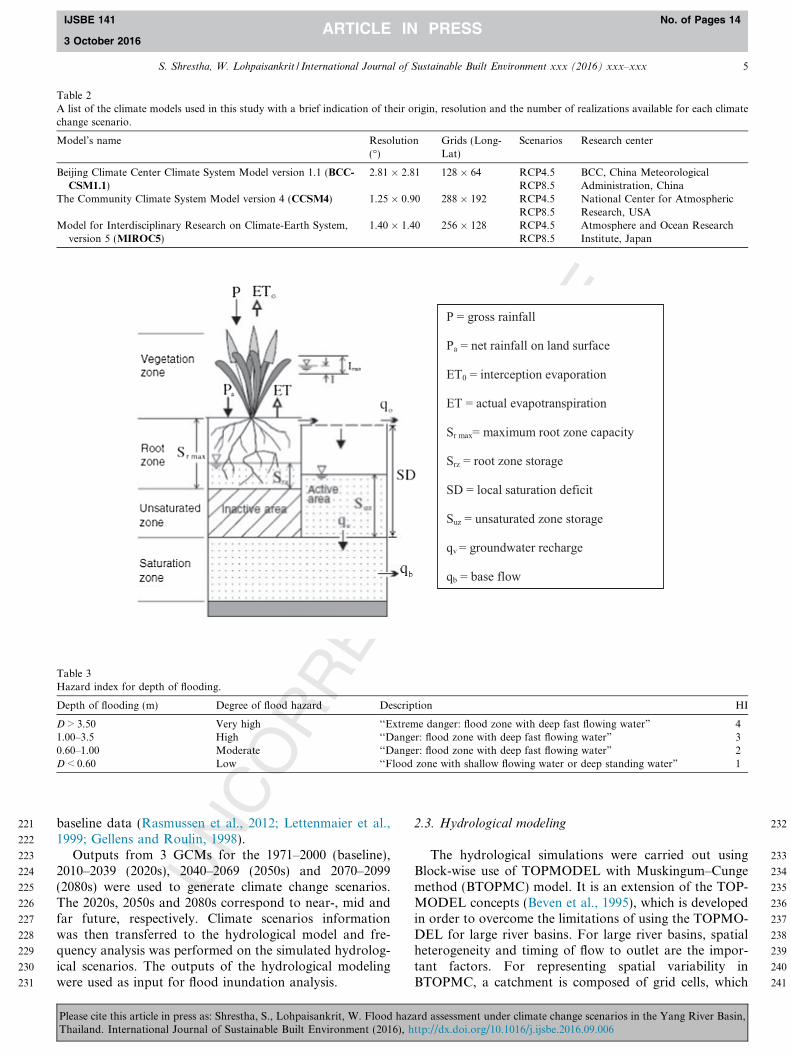
P = gross rainfall
Pa = net rainfall on land surface
ET0 = interception evaporation
ET = actual evapotranspiration
Sr max= maximum root zone capacity
Srz = root zone storage
SD = local saturation deficit
Suz = unsaturated zone storage
qv = groundwater recharge
qb = base flow
Table 3Hazard index for depth of flooding.
Depth of flooding (m) Degree of flood hazard Description HI
D > 3.50 Very high ‘‘Extreme danger: flood zone with deep fast flowing water” 41.00–3.5 High ‘‘Danger: flood zone with deep fast flowing water” 30.60–1.00 Moderate ‘‘Danger: flood zone with deep fast flowing water” 2D < 0.60 Low ‘‘Flood zone with shallow flowing water or deep standing water” 1
S. Shrestha, W. Lohpaisankrit / International Journal of Sustainable Built Environment xxx (2016) xxx–xxx 5
IJSBE 141 No. of Pages 14
3 October 2016
baseline data (Rasmussen et al., 2012; Lettenmaier et al.,1999; Gellens and Roulin, 1998).
Outputs from 3 GCMs for the 1971–2000 (baseline),2010–2039 (2020s), 2040–2069 (2050s) and 2070–2099(2080s) were used to generate climate change scenarios.The 2020s, 2050s and 2080s correspond to near-, mid andfar future, respectively. Climate scenarios informationwas then transferred to the hydrological model and fre-quency analysis was performed on the simulated hydrolog-ical scenarios. The outputs of the hydrological modelingwere used as input for flood inundation analysis.
Please cite this article in press as: Shrestha, S., Lohpaisankrit, W. Flood hazThailand. International Journal of Sustainable Built Environment (2016), h
2.3. Hydrological modeling
The hydrological simulations were carried out usingBlock-wise use of TOPMODEL with Muskingum–Cungemethod (BTOPMC) model. It is an extension of the TOP-MODEL concepts (Beven et al., 1995), which is developedin order to overcome the limitations of using the TOPMO-DEL for large river basins. For large river basins, spatialheterogeneity and timing of flow to outlet are the impor-tant factors. For representing spatial variability inBTOPMC, a catchment is composed of grid cells, which
ard assessment under climate change scenarios in the Yang River Basin,ttp://dx.doi.org/10.1016/j.ijsbe.2016.09.006
242
243
244
245246248248
249
250
251
252
253
254
255
256
257
258
259
260
261
262
263
264
265
266
267
268
269
270
271
272
273
274
275
276
277
278
279
280
281
282
283
284
285
286
287
288
289
290
291
292
293
294
295
296
297
298
299
300
301
302
303
304
305
306
Table 4Relative change in annual precipitation in future periods compared to baseline period of 1971–2000 in the YangRiver Basin.
Periods Scenarios Annual precipitation (mm)
Max Avg. Min
2020s RCP4.5 104.00 41.61 25.39RCP8.5 74.53 32.44 21.47
2050s RCP4.5 109.05 49.89 37.80RCP8.5 105.47 42.60 38.79
2080s RCP4.5 37.03 25.13 8.58RCP8.5 67.23 37.91 37.70
Table 5Percentage changes in annual average precipitation in future periods compared to baseline period (1971–2000) in the Yang River Basin.
GCMs Percentage change as compared to baseline
RCP4.5 RCP8.5
2020s 2050s 2080s 2020s 2050s 2080s
BCCCSM1.1 47.00 48.50 17.85 39.19 47.69 24.68CCSM4 26.46 30.14 6.90 21.9 25.11 36.81MIROC5 18.00 24.64 24.26 15.66 26.92 24.58
6 S. Shrestha, W. Lohpaisankrit / International Journal of Sustainable Built Environment xxx (2016) xxx–xxx
IJSBE 141 No. of Pages 14
3 October 2016
can be divided into sub-catchments, where each sub-catchment is considered as a block or a unit. The effectiveprecipitation for any sub basin, i, and soil layer, k, andtime, t is calculated based on Eq. (1).
Reði; tÞ ¼ Roði; tÞ � SrmaxðiÞ � Epði; tÞ ð1Þwhere Re represents the effective rainfall, Ro indicates totalprecipitation, Srmax is the maximum storage capacity inthe root zone and Ep denotes evapotranspiration.BTOPMC integrates Shuttleworth–Wallace model to cal-culate the potential evapotranspiration. Fig. 3 gives thedetails of the runoff generation for each grid cells inBTOPMC model. Further details are available in Aoet al. (2006) and Ishidaira et al. (2005). BTOPMC modelhas been successfully applied in many basins worldwidewith satisfactory performance (Manandhar et al., 2013;Phan et al., 2010; Bao et al., 2010; Wan et al., 2009;Shrestha et al., 2007). In addition, it has also been appliedsuccessfully to Mekong River basin which validates themodel’s ability to represent the hydrology of the basin(Kiem et al., 2008; Hapuarachchi et al., 2008).
The model was calibrated by adjusting saturated transi-tivity, decay coefficient and rooting depth for the period of2002–2006. The calibrated parameters were used as inputfor the validation period of 1997–2001 in order to checkfor the best goodness-of-fit with the observed dischargeat Kuchinarai, Kalasin station (E54).
2.4. Frequency analysis and designed hydrographs
In order to analyze and design the frequency of probablemaximum stream flow, annual maximum runoffs of 1980–2009 were used and a distributed hydrological model wasused to simulate the annual maximum runoffs for the
Please cite this article in press as: Shrestha, S., Lohpaisankrit, W. Flood hazThailand. International Journal of Sustainable Built Environment (2016), h
future periods of 2020s, 2050s and 2080s. A Gumbel distri-bution method was applied to illustrate the extreme floodfrequency. For the flood inundation modeling under cli-mate change conditions, several return periods such as25, 50 and 100 years of stream flow are considered.
Designed synthetic hydrographs were developed byapplying two methods, the dimensionless hydrographmethod and the flood frequency analysis. The dimension-less hydrograph was derived from the extreme runoff pat-tern in 2007. For flood frequency analysis, Gumbel’sdistribution was selected to analyze the historical runoffdata recorded from 1980 to 2009. Moreover, the Gumbelprobability distribution was also used to predict future run-off simulated by the distributed hydrological model byusing the bias corrected future climate data. The frequencyanalysis provided the probable maximum runoff with 25,50 and 100 year return period. The dimensionless hydro-graphs are used to derive synthetic inflow hydrographsfor the above mentioned return periods.
2.5. Hydraulic modeling
Flood inundation areas were simulated using HEC-RAS, a 1-D hydraulic model innovated by the US ArmyCorps of Engineers, under unsteady flow conditions (U.S.Corps of Engineers, 2002). The topography of channeland floodplain information was derived from HEC-GeoRAS software which is used as an extension in Arc-GIS, for processing geospatial data for use with HEC-RAS.
Discharge and river water level were set as upstream anddownstream boundaries. The upstream boundary in thisstudy is at Kuchinarai station (E.54)—a stream-flow gaug-ing station. In order to take backwater effect into the Yang
ard assessment under climate change scenarios in the Yang River Basin,ttp://dx.doi.org/10.1016/j.ijsbe.2016.09.006
307
308
309
310
311
312
313
314
315
316
317
318
319
320
321
322
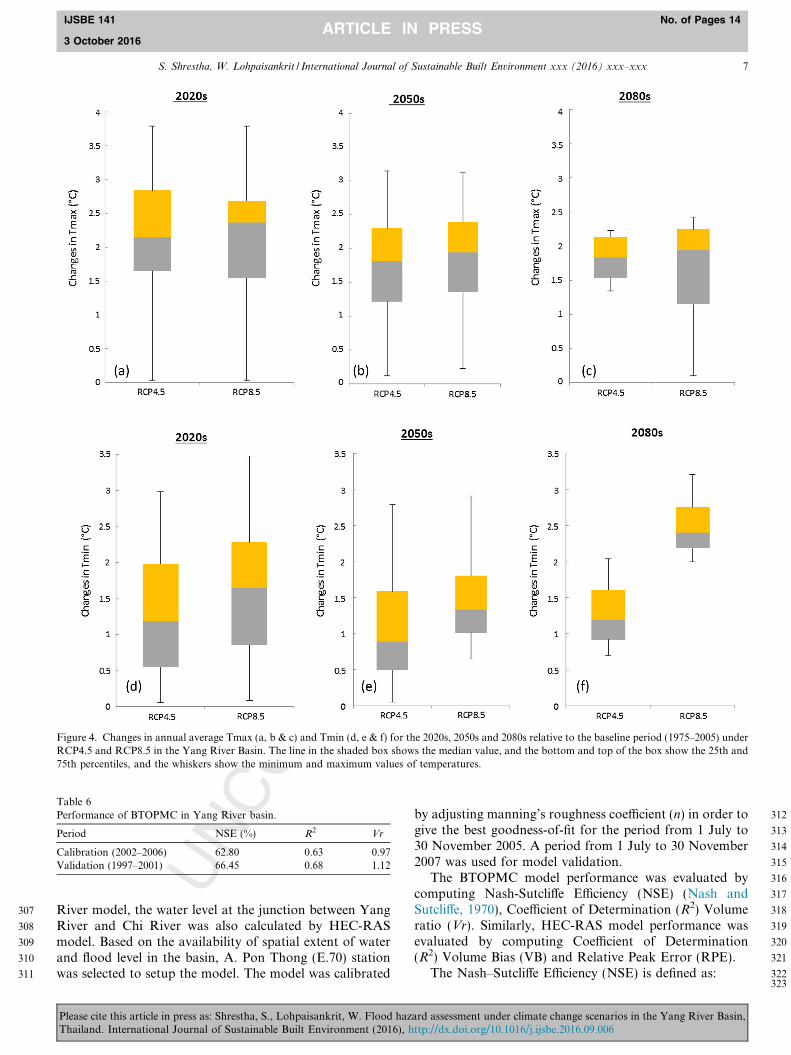
Figure 4. Changes in annual average Tmax (a, b & c) and Tmin (d, e & f) for the 2020s, 2050s and 2080s relative to the baseline period (1975–2005) underRCP4.5 and RCP8.5 in the Yang River Basin. The line in the shaded box shows the median value, and the bottom and top of the box show the 25th and75th percentiles, and the whiskers show the minimum and maximum values of temperatures.
Table 6Performance of BTOPMC in Yang River basin.
Period NSE (%) R2 Vr
Calibration (2002–2006) 62.80 0.63 0.97Validation (1997–2001) 66.45 0.68 1.12
S. Shrestha, W. Lohpaisankrit / International Journal of Sustainable Built Environment xxx (2016) xxx–xxx 7
IJSBE 141 No. of Pages 14
3 October 2016
River model, the water level at the junction between YangRiver and Chi River was also calculated by HEC-RASmodel. Based on the availability of spatial extent of waterand flood level in the basin, A. Pon Thong (E.70) stationwas selected to setup the model. The model was calibrated
323
Please cite this article in press as: Shrestha, S., Lohpaisankrit, W. Flood hazThailand. International Journal of Sustainable Built Environment (2016), h
by adjusting manning’s roughness coefficient (n) in order togive the best goodness-of-fit for the period from 1 July to30 November 2005. A period from 1 July to 30 November2007 was used for model validation.
The BTOPMC model performance was evaluated bycomputing Nash-Sutcliffe Efficiency (NSE) (Nash andSutcliffe, 1970), Coefficient of Determination (R2) Volumeratio (Vr). Similarly, HEC-RAS model performance wasevaluated by computing Coefficient of Determination(R2) Volume Bias (VB) and Relative Peak Error (RPE).
The Nash–Sutcliffe Efficiency (NSE) is defined as:
ard assessment under climate change scenarios in the Yang River Basin,ttp://dx.doi.org/10.1016/j.ijsbe.2016.09.006
325325
326
327
328
329
330
332332
333
334
0
20
40
60
80
100
1200
50
100
150
200
250
300
350
400
450
1/1/2002 1/1/2003 1/1/2004 12/31/2004 12/31/2005
Pre
cipi
tatio
n (m
m)
Dis
char
ge (m
³/s)
Simulated Discharge Observed Discharge Precipitation
0
20
40
60
80
100
1200
50
100
150
200
250
300
350
400
450
1/1/1997 1/1/1998 1/1/1999 1/1/2000 12/31/2000 12/31/2001
Pre
cipi
tatio
n (m
m)
Dis
char
ge (
m³/s
)
Simulated Discharge Observed Discharge Precipitation
(a)
(b)
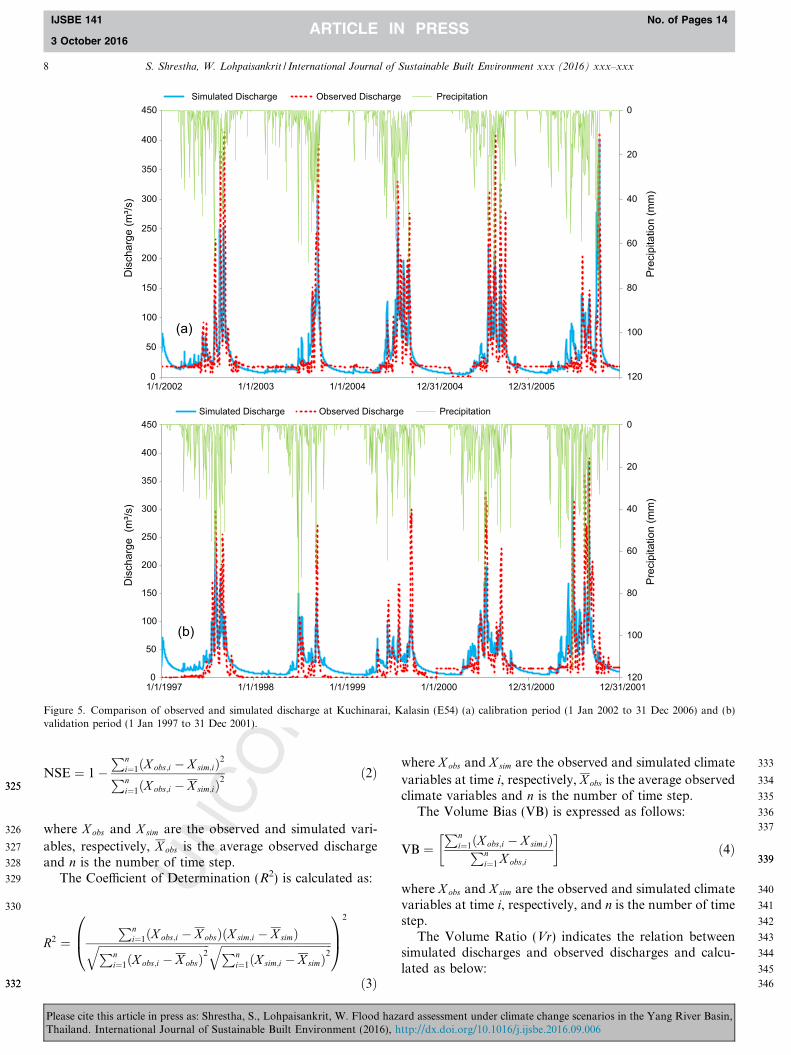
Figure 5. Comparison of observed and simulated discharge at Kuchinarai, Kalasin (E54) (a) calibration period (1 Jan 2002 to 31 Dec 2006) and (b)validation period (1 Jan 1997 to 31 Dec 2001).
8 S. Shrestha, W. Lohpaisankrit / International Journal of Sustainable Built Environment xxx (2016) xxx–xxx
IJSBE 141 No. of Pages 14
3 October 2016
NSE ¼ 1�Pn
i¼1ðXobs;i � X sim;iÞ2Pni¼1ðXobs;i � X sim;iÞ2
ð2Þ
335336
337
339339
where Xobs and X sim are the observed and simulated vari-
ables, respectively, Xobs is the average observed dischargeand n is the number of time step.
The Coefficient of Determination (R2) is calculated as:
340341
342
343
344
345
346
R2 ¼Pn
i¼1ðXobs;i � XobsÞðX sim;i � X simÞffiffiffiffiffiffiffiffiffiffiffiffiffiffiffiffiffiffiffiffiffiffiffiffiffiffiffiffiffiffiffiffiffiffiffiffiffiffiffiffiPni¼1ðXobs;i � XobsÞ2
q ffiffiffiffiffiffiffiffiffiffiffiffiffiffiffiffiffiffiffiffiffiffiffiffiffiffiffiffiffiffiffiffiffiffiffiffiffiffiffiffiPni¼1ðX sim;i � X simÞ2
q0B@
1CA
2
ð3Þ
Please cite this article in press as: Shrestha, S., Lohpaisankrit, W. Flood hazThailand. International Journal of Sustainable Built Environment (2016), h
where Xobs and X sim are the observed and simulated climate
variables at time i, respectively, Xobs is the average observedclimate variables and n is the number of time step.
The Volume Bias (VB) is expressed as follows:
VB ¼Pn
i¼1ðXobs;i � X sim;iÞPni¼1Xobs;i
� �ð4Þ
where Xobs and X sim are the observed and simulated climatevariables at time i, respectively, and n is the number of timestep.
The Volume Ratio (Vr) indicates the relation betweensimulated discharges and observed discharges and calcu-lated as below:
ard assessment under climate change scenarios in the Yang River Basin,ttp://dx.doi.org/10.1016/j.ijsbe.2016.09.006
348348
349
350
351
Table 7Probable peak discharge estimated for RCP 8.5 and RCP 4.5 of three GCMs at Kuchinarai station.
Time period Scenario GCM 25 years Relative change (%) 50 years Relative change (%) 100 years Relative change (%)
Baseline 552 612 670
2020s RCP 8.5 BCCCSM1.1 702 27 809 32 915 37CCSM4 692 25 790 29 870 30MIROC5 653 18 750 23 800 19
RCP 4.5 BCCCSM1.1 684 24 780 28 900 34CCSM4 663 20 760 24 880 31MIROC5 651 18 745 22 850 27
2050s RCP 8.5 BCCCSM1.1 721 31 852 39 980 46CCSM4 712 29 832 36 954 42MIROC5 702 27 802 31 930 39
RCP 4.5 BCCCSM1.1 691 25 780 28 900 34CCSM4 678 23 760 24 856 28MIROC5 653 18 742 21 843 26
2080s RCP 8.5 BCCCSM1.1 750 36 901 47 1040 55CCSM4 727 32 880 44 990 48MIROC5 700 27 847 38 950 42
RCP 4.5 BCCCSM1.1 708 28 856 40 985 47CCSM4 690 25 840 37 960 43MIROC5 650 18 813 33 912 36
Table 8Performance of HEC-RAS model in Yang River.
Period R2 RPE VB
Calibration (2005) 0.96 0.71 �0.01Validation (2007) 0.92 0.94 �0.01
131132133134135136137138139140141142
30-Jun 20-Jul 9-Aug 29-Aug
Wat
er L
evel
(mas
l)
Year (2
Observed Simulated
131132133134135136137138139140141142
30-Jun 20-Jul 9-Aug 29-Aug
Wat
er L
evel
(mas
l)
Year (2
Observed Simulated
(a)
(b)
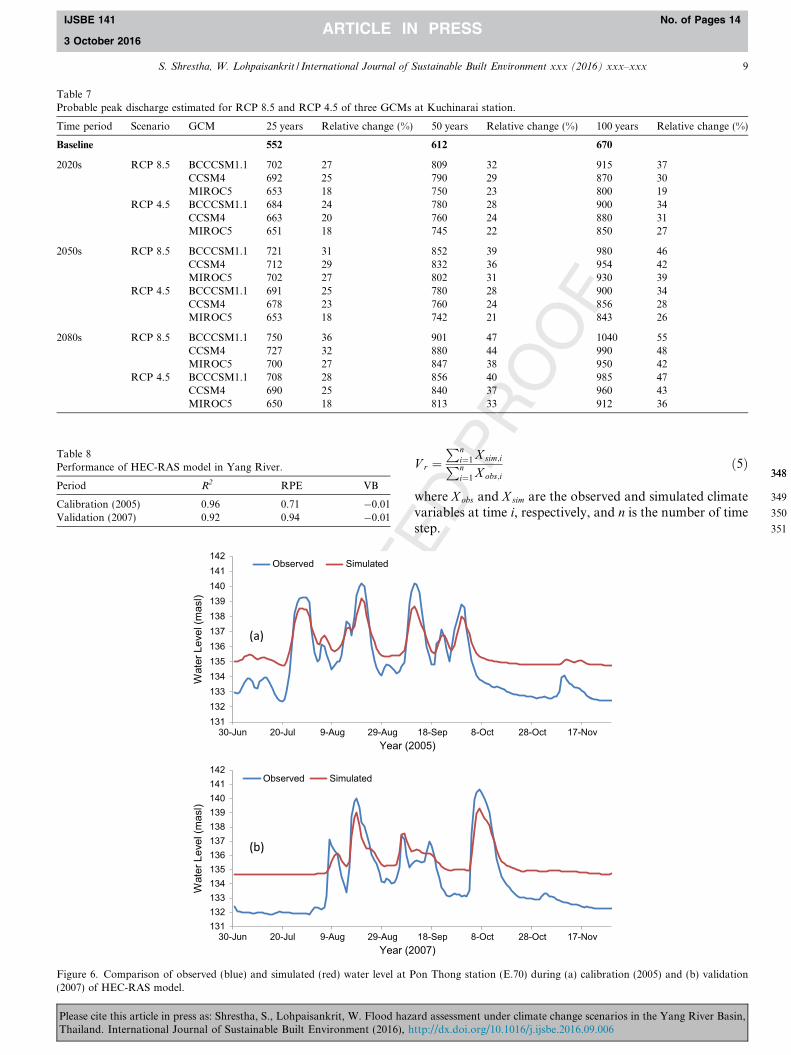
Figure 6. Comparison of observed (blue) and simulated (red) water level at P(2007) of HEC-RAS model.
S. Shrestha, W. Lohpaisankrit / International Journal of Sustainable Built Environment xxx (2016) xxx–xxx 9
IJSBE 141 No. of Pages 14
3 October 2016
Please cite this article in press as: Shrestha, S., Lohpaisankrit, W. Flood hazThailand. International Journal of Sustainable Built Environment (2016), h
V r ¼Pn
i¼1X sim;iPni¼1Xobs;i
ð5Þ
where Xobs and X sim are the observed and simulated climatevariables at time i, respectively, and n is the number of timestep.
18-Sep 8-Oct 28-Oct 17-Nov005)
18-Sep 8-Oct 28-Oct 17-Nov007)
on Thong station (E.70) during (a) calibration (2005) and (b) validation
ard assessment under climate change scenarios in the Yang River Basin,ttp://dx.doi.org/10.1016/j.ijsbe.2016.09.006
352
353
354
355
357357
358
359
360
361
362
363
364
365
366
367
368
369
370
371
372
373
374
375
376
377
378
379
380
381
382
383
384
385
386
387
388
389
390
391
392
Table 9Flood inundation areas in different return period floods for baseline period.
Degree of flood hazard Simulated flood area in km2 (in %)
25-year 50-year 100-year
Low 25.44 (12.38) 28.01 (12.51) 28.79 (12.02)Moderate 19.25 (9.37) 17.32 (7.73) 17.73 (7.40)High 141.66 (68.95) 151.63 (67.71) 154.31 (64.42)Very high 19.10 (9.30) 26.99 (12.05) 38.69 (16.15)Total 205.44 223.94 239.51
10 S. Shrestha, W. Lohpaisankrit / International Journal of Sustainable Built Environment xxx (2016) xxx–xxx
IJSBE 141 No. of Pages 14
3 October 2016
The Relative Peak Error (RPE) is applied to measurethe relative difference between observed and simulatedpeaks. It is calculated as:
393
394
395
396
397
398
399
RPE ¼ Xobs � X sim
X obs� 100% ð6Þ
where Xobs and X sim are the observed and simulated climatevariables at time i, respectively, and n is the number of timestep.
400
401
402
403
404
405
406
407
408
409
410
411
412
413
414
415
416
417
418
419
420
421
422
423
424
425
426
427
428
429
430
431
432
2.6. Flood frequency analysis
The objective of flood frequency analysis was to relatethe magnitude of floods to their frequency of occurrenceusing probability distribution. In order to commence thisobjective, the calculation of the statistical parameters ofthe proposed distribution was made by the method ofmoments from the given data. In this study the annualmaximum runoffs for four different periods (1990s, 2020s,2050s and 2080s) were calculated for different return periodfloods.
2.7. Flood hazard mapping
Flood hazard mapping is to determine areas with aprobability of a flooding event for a defined return period(Han, 2011). With the results of hydraulic calculations, theflood outline can be calculated. The degree of flood hazarddepends on several hydrological factors such as floodvelocity and inundated depths. Since this study appliedthe 1-D hydraulic model, the hazard index was assignedwith corresponding to different inundated depths. Thedegree of flood hazard was classified into four hazard cat-egories based on inundation depth classes corresponding tothree critical inundated depths 0.6, 1.0 and 3.5 m as sug-gested by Tu and Tingsanchali (2010) which is describedin Table 3.
3. Results and discussion
3.1. Changes in mean temperature and rainfall
Table 4 shows the absolute changes in annual rainfallfrom ensemble of three GCMs and Table 5 shows the per-centage change in rainfall for the 2020s, 2050s and 2080s in
Please cite this article in press as: Shrestha, S., Lohpaisankrit, W. Flood hazThailand. International Journal of Sustainable Built Environment (2016), h
comparison to baseline period (1971–2000). The annualrainfall is projected to increase in near and mid futureand comparatively higher under RCP 4.5 whereas the rain-fall is projected to increase in the lower magnitude in farfuture under both scenarios (Table 4). Similarly, percent-age change in annual rainfall differs among the GCMs,higher change is projected by BCCCSM1.1 and lower byMIROC5 under both RCP scenarios (Table 5).
As shown in Fig. 4, the minimum and maximum annualtemperature was projected to increase in all future periods.Considering the median values of ensembles, the highestincreases in temperature were predicted for the RCP8.5,while the lowest were predicted for RCP 4.5. The differ-ences between the predicted changes in temperature forthe different emissions scenario will also increase in thefuture. This sharp difference is because of the significantincrease in differences among the different emission scenar-ios themselves. The median values of the projections justifythis finding. During 2080s, for Tmax, the median value asprojected under the RCP8.5 scenario is 1.1 �C higher thanas projected under the RCP4.5 scenario shown in the fol-lowing box plot (Fig. 4). Similarly, during the same period,change in Tmin is 2.2 �C higher for RCP8.5 than RCP4.5as projected by median values.
3.1.1. Performance of the BTOPMC
During the calibration, BTOPMC uses observed rainfalldata of 2002–2006 as input into a systematic search formodel parameters which produce the best goodness-of-fitbetween the simulated discharge and observed dischargeat Kuchinarai, Kalasin (E54) station. Thereafter, 5 yearsfrom 1997 to 2001 were used for validation purposes whereboth calibration and validation periods cover extremeflood events in the study area. The performance of themodel during calibration and validation period is summa-rized in Table 6 and Fig. 5. The low flow periods are under-estimated during calibration whereas overestimated duringvalidation for the first three years followed by underestima-tion. In addition, it can also be noticed that the model isable to simulate the low peaks very well however it isunable to fetch the high peak flow during heavy rainfallevents during validation period. Nonetheless, the modelevaluation by NSE, R2 and Vr indicates that the model per-forms reasonably well in the basin.
ard assessment under climate change scenarios in the Yang River Basin,ttp://dx.doi.org/10.1016/j.ijsbe.2016.09.006
433
434
435
436
437
438
439
440
441
442
443
444
445
446
447
448
449
450
S. Shrestha, W. Lohpaisankrit / International Journal of Sustainable Built Environment xxx (2016) xxx–xxx 11
IJSBE 141 No. of Pages 14
3 October 2016
3.1.2. Performance of hydrological analysis and design
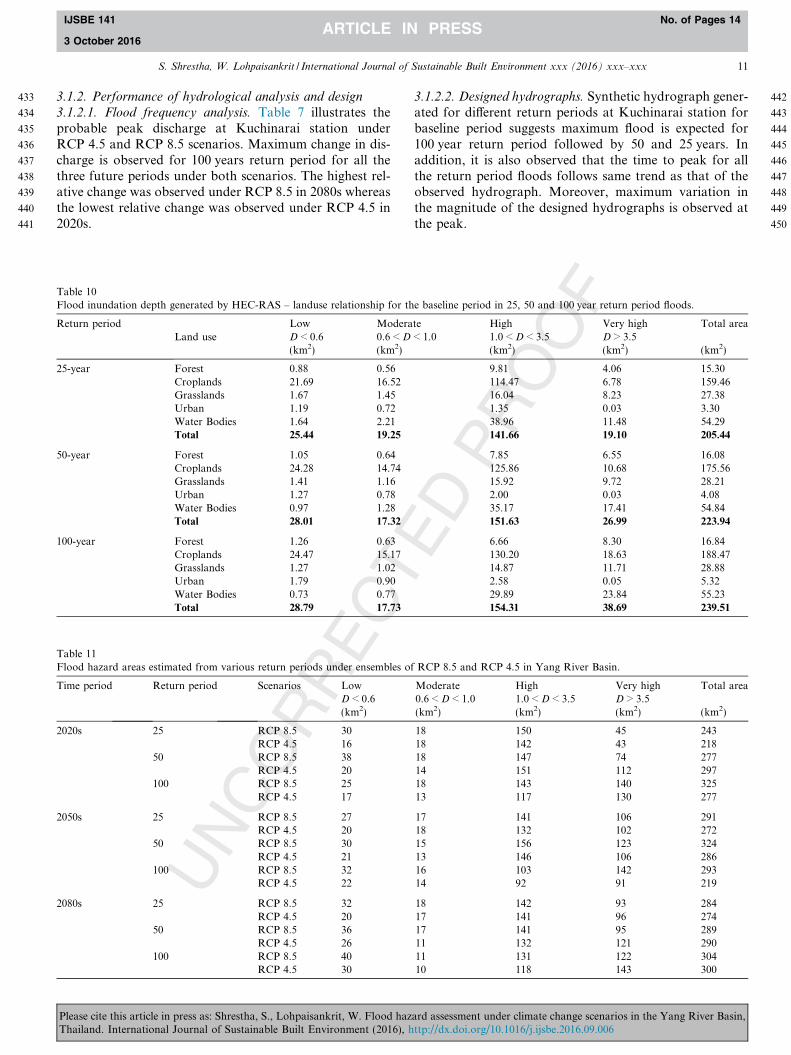
3.1.2.1. Flood frequency analysis. Table 7 illustrates theprobable peak discharge at Kuchinarai station underRCP 4.5 and RCP 8.5 scenarios. Maximum change in dis-charge is observed for 100 years return period for all thethree future periods under both scenarios. The highest rel-ative change was observed under RCP 8.5 in 2080s whereasthe lowest relative change was observed under RCP 4.5 in2020s.
Table 10Flood inundation depth generated by HEC-RAS – landuse relationship for th
Return period Low ModeraLand use D < 0.6 0.6 < D
(km2) (km2)
25-year Forest 0.88 0.56Croplands 21.69 16.52Grasslands 1.67 1.45Urban 1.19 0.72Water Bodies 1.64 2.21Total 25.44 19.25
50-year Forest 1.05 0.64Croplands 24.28 14.74Grasslands 1.41 1.16Urban 1.27 0.78Water Bodies 0.97 1.28Total 28.01 17.32
100-year Forest 1.26 0.63Croplands 24.47 15.17Grasslands 1.27 1.02Urban 1.79 0.90Water Bodies 0.73 0.77Total 28.79 17.73
Table 11Flood hazard areas estimated from various return periods under ensembles of
Time period Return period Scenarios LowD < 0.6(km2)
2020s 25 RCP 8.5 30RCP 4.5 16
50 RCP 8.5 38RCP 4.5 20
100 RCP 8.5 25RCP 4.5 17
2050s 25 RCP 8.5 27RCP 4.5 20
50 RCP 8.5 30RCP 4.5 21
100 RCP 8.5 32RCP 4.5 22
2080s 25 RCP 8.5 32RCP 4.5 20
50 RCP 8.5 36RCP 4.5 26
100 RCP 8.5 40RCP 4.5 30
Please cite this article in press as: Shrestha, S., Lohpaisankrit, W. Flood hazThailand. International Journal of Sustainable Built Environment (2016), h
3.1.2.2. Designed hydrographs. Synthetic hydrograph gener-ated for different return periods at Kuchinarai station forbaseline period suggests maximum flood is expected for100 year return period followed by 50 and 25 years. Inaddition, it is also observed that the time to peak for allthe return period floods follows same trend as that of theobserved hydrograph. Moreover, maximum variation inthe magnitude of the designed hydrographs is observed atthe peak.
e baseline period in 25, 50 and 100 year return period floods.
te High Very high Total area< 1.0 1.0 < D < 3.5 D > 3.5
(km2) (km2) (km2)
9.81 4.06 15.30114.47 6.78 159.4616.04 8.23 27.381.35 0.03 3.3038.96 11.48 54.29141.66 19.10 205.44
7.85 6.55 16.08125.86 10.68 175.5615.92 9.72 28.212.00 0.03 4.0835.17 17.41 54.84151.63 26.99 223.94
6.66 8.30 16.84130.20 18.63 188.4714.87 11.71 28.882.58 0.05 5.3229.89 23.84 55.23154.31 38.69 239.51
RCP 8.5 and RCP 4.5 in Yang River Basin.
Moderate High Very high Total area0.6 < D < 1.0 1.0 < D < 3.5 D > 3.5(km2) (km2) (km2) (km2)
18 150 45 24318 142 43 21818 147 74 27714 151 112 29718 143 140 32513 117 130 277
17 141 106 29118 132 102 27215 156 123 32413 146 106 28616 103 142 29314 92 91 219
18 142 93 28417 141 96 27417 141 95 28911 132 121 29011 131 122 30410 118 143 300
ard assessment under climate change scenarios in the Yang River Basin,ttp://dx.doi.org/10.1016/j.ijsbe.2016.09.006
451
452
453
454
455
456
457
458
459
460
461
462
463
464
465
466
467
468
469
470
471
472
473
474
475
476
477
478
479
480
481
482
483
484
485
486
487
488
489
490
491
492
493
494
495
496
497
498
499
500
501
502
503
504
505
506
507
508
509
510
511
512
12 S. Shrestha, W. Lohpaisankrit / International Journal of Sustainable Built Environment xxx (2016) xxx–xxx
IJSBE 141 No. of Pages 14
3 October 2016
3.1.3. Performance of HEC-RAS model
The calibration and validation statistics suggests themodel simulates the observed flood in good agreement(Table 8). Fig. 6 demonstrates the simulated water levelcompared to the observed water level at Pon Thing station(E.70). The validation results suggest the maximumobserved water surface level at 141 masl on 7 October,2007. The simulated water level is 139 masl on the sameday illustrating the model’s ability to fetch the time to peakat the same time.
513
514
515
516
517
518
519
520
521
522
523
524
525
526
527
528
529
530
531
532
533
534
535
536
537
538
539
540
541
542
543
544
545
546
547
3.2. Projected changes in floods
3.2.1. Flood inundated areas for baseline period (1980–
2009)
Table 9 illustrates the areas of inundation under differ-ent degrees of flood hazard. Based on the assigned degreeof flood hazard, although all class of flood hazards showsan increase trend, yet the spatial coverage of high flooddepth is observed to be maximum under present climate.In case of moderate and high flood depth events highestspatial coverage is observed for 25 year return period. Inaddition, very high flood depth is noted to have maximumcoverage of 38.69 km2 which includes 16.15% of total areafor 100-year return period. It is also noteworthy that thetrend in the area of inundation for degree of flood hazardreduces from 25- to 100-years return period for low, mod-erate and high flood depth. However, for very high flooddepth, area of inundation is observed to follow increasingtrend for the corresponding return periods. For the totalarea of inundation, flood of 100-year return period hasthe maximum area of inundation about 239.51 km2 imply-ing the severity of extreme floods in the region under pre-sent climate.
The different landuse under flood inundation was alsoanalyzed and found that cropland areas are significantlyaffected. The area increases from 159.46 to 188.47 km2
for 25 to 100 year return period (Table 10). It is also evi-dent that, only change in inundation area for high and veryhigh flood depth influences the total area for croplandsindicating agricultural vulnerability. This implies thatfarming lands acts as retention areas for flood water inthe region. It can also be noticed that forests experienceshigh and very high flood depth of all return periods com-pared to low and moderate flood depth. In addition, thespatial extent of high flood depth declines with increasedreturn period.
548
549
550
551
552
553
3.2.2. Changes in future flood inundation area
The simulation was carried out for the present andfuture scenarios of extreme rainfall events. Future floodinundation areas were simulated for 2020s, 2050s and2080s with respect to RCP 4.5 and RCP 8.5 scenarios(Table 11). It is noticed that under RCP 8.5 scenarios,the spatial coverage of flooded area increases noticeably
Please cite this article in press as: Shrestha, S., Lohpaisankrit, W. Flood hazThailand. International Journal of Sustainable Built Environment (2016), h
for all return periods and three future periods relative tothe baseline period. The total flooded areas ranges from243 to 291 km2 for 25 year return period, 277 to 324 km2
for 50 year return period and 293 to 325 km2 for 100 yearreturn period. Under RCP 4.5 scenarios the total areasunder floods are 218–274 km2 for 25 year return period,286–290 km2 under 50 year return period and 219 to300 km2 under 100 year return period.
Similar studies done in Mekong delta region of Vietnamsuggest under climate change high and very high floods areexpected to be more intense (Dinh et al., 2012). Moreover,studies on streamflow under climate change on Mekongriver basin suggests the frequency of peak discharge isexpected to change from 75 year return period to 25 yearfor future climate by 2045s (Lauri et al., 2012) whichimplies the results of the present research are in line withother studies done in the region.
4. Conclusions
In this study, climate change impacts on flood hazardpotential was examined using three GCMs and hydrologi-cal and hydraulic models in the Yang River Basin of Thai-land. The hydrological and hydraulic models werecalibrated and validated satisfactorily against runoff dataand future flows were generated. There was a considerableuncertainty in the results; however, several inferences canbe made based on this study. Generally, temperature andrainfall is expected to increase in future. Different GCMsprojected the increase in temperature and rainfall in differ-ent range. Area inundated by flood under future climatesuggests 100 year return period floods are most severe. Itshowed that approximately 300–325 km2 area will beflooded under future climate change scenarios of which sig-nificant areas are under croplands. In addition, for a partic-ular return period of flood, a shift from very high underbaseline period to moderate flood is expected for future cli-mate under RCP 8.5 scenario. Furthermore, 100 yearreturn period flood is expected to be 25 years in near future(2020s) for both climate scenarios which signifies the severethreat of flood in future under climate change. The outputof this study not only indicates the severity of flood in theregion but also indicates potential damage in food produc-tion and negative effects on the livelihoods of local people.Therefore, proper land use planning and risk-based designof hydraulic structures must be integral part of mitigationplan when addressing vulnerabilities to future flood dam-ages in the basin.
5. Uncited references
Bao (2006), Graiprab et al. (2010), Hoanh et al. (2010),Jones et al. (2004), Mainuddin et al. (2011, 2013), Tuan andChinvanno (2011), Ty et al. (2012), and Willmott (1984,1981).
ard assessment under climate change scenarios in the Yang River Basin,ttp://dx.doi.org/10.1016/j.ijsbe.2016.09.006
554
555
556
557
558
559
560561562563564565566567568569570571572573574575576577578579580581582583584585586587588589590591592593594595596597598599600601602603604605606607608609610611612613614
615616617618619620621622623624625626627628629630631632633634635636637638639640641642643644645646647648649650651652653654655656657658659660661662663664665666667668669670671672673674675676677678679680
S. Shrestha, W. Lohpaisankrit / International Journal of Sustainable Built Environment xxx (2016) xxx–xxx 13
IJSBE 141 No. of Pages 14
3 October 2016
Acknowledgements
The authors would like to appreciate Dr. Jun Magomeand the BTOPMC Development Team of YamanashiUniversity, Japan for providing the model to conduct thisstudy.
References
Ao, T., Ishidaira, H., Takeuchi, K., Kiem, A.S., Yoshitari, J., Fukami, K.,Magome, J., 2006. Relating BTOPMC model parameters to physicalfeatures of MOPEX basins. J. Hydrol. 320, 84–102.
Artlert, K., Chaleeraktrakoon, C., Nguyen, V.T.V., 2013. Modeling andanalysis of rainfall processes in the context of climate change forMekong, Chi and Mun River Basins (Thailand). J. Hydro-Environ.Res. 7 (1), 2–17.
Bao, H.J., Wang, L.L., Li, Z.J., Zhao, L.N., Zhang, G.P., 2010.Hydrological daily rainfall-runoff simulation with BTOPMC modeland comparison with Xin’anjiang model. Water. Sci. Eng. 3 (2), 121–131.
Bao, W.M., 2006. Hydrologic Forecasting, third ed. China WaterConservancy and Water Power Press, Beijing (in Chinese).
Bauwens, A., Sohier, C., Degre, A., 2011. Hydrological response toclimate change in the Lesse and the Vesdre catchments: contribution ofa physically based model (Wallonia, Belgium). Hydrol. Earth Syst. Sci.15 (6), 1745–1756.
Beven, K.J., Lamb, R., Quinn, P.F., Romanowicz, R., Freer, J., 1995.TOPMODEL. In: Singh, V.P. (Ed.), Computer Models of WatershedHydrology. Water Resources Publications, pp. 627–668.
Chaleeraktrakoon, C., Khwanket, U., 2013. A statistical downscalingmodel for extreme daily rainfalls at a single site. In: World Environ-mental and Water Resources Congress 2013: Showcasing the Future –Proceedings of the 2013 Congress, pp. 1058–1067.
Cloke, H.L., Wetterhall, F., He, Y., Freer, J.E., Pappenberger, F., 2013.Modelling climate impact on floods with ensemble climate projections.Quart. J. Roy. Met. Soc. 139, 282–297.
Dinh, Q., Balica, S., Popescu, I., Jonoski, A., 2012. Climate change impacton flood hazard, vulnerability and risk of the Lonng XuyenQuadrangle in the Mekong Delta. Int. J. River Basin Manage. 10(1), 103–120.
Dobler, C., Burger, G., Stotter, J., 2012. Assessment of climate changeimpacts on flood hazard potential in the Alpine Lech watershed. J.Hydrol. 460–461, 29–39.
Dobler, C., Stotter, J., Schoberl, F., 2010. Assessment of climate changeimpacts on the hydrology of the Lech Valley in northern Alps. J. WaterClim. Change 1 (3), 207–218.
Dutta, D., 2011. An integrated tool for assessment of flood vulnerabilityof coastal cities to sea-level rise and potential socio-economic impacts:a case study in Bangkok, Thailand. Hydrol. Sci. J. 56 (5), 805–823.
Fleming, K.M., Tregoning, P., Kuhn, M., Purcell, A., McQueen, H., 2012.The effect of melting land-based ice masses on sea-level around theAustralian coastline. Aust. J. Earth Sci. 59 (4), 457–467.
Gellens, D., Roulin, E., 1998. Streamflow response of Belgian catchmentsto IPCC climate change scenarios. J. Hydrol. 210, 242–258.
Graiprab, P., Pongput, K., Tangtham, N., Gassman, P.W., 2010.Hydrologic evaluation and effect of climate change on the Samatwatershed, Northeastern Region, Thailand. Int. Agric. Eng. J. 19 (2),12–22.
Han, D., 2011. Flood Risk Assessment and Management. BenthamPublishers.
Hapuarachchi, H.A.P., Zhou, M.C., Kiem, A.S., Geogievsky, M.V.,Magome, J., Ishidaira, H., 2008. Investigation of the Mekong Riverbasin hydrology for 1980–2000 using YHyM. Hydrol. Process. 22,1246–1256.
681
Please cite this article in press as: Shrestha, S., Lohpaisankrit, W. Flood hazThailand. International Journal of Sustainable Built Environment (2016), h
Hirabayashi, Y., Kanae, S., Emori, S., Oki, T., Kimoto, M., 2008. Globalprojections of changing risks of floods and droughts in a changingclimate. Hydrol. Sci. J. 53 (4), 754–772.
Hoanh, C.T., Jirayoot, K., Lacombe, G., Srinetr, V., 2010. Comparison ofclimate change impacts and development effects on future Mekongflow regime. In: Swayne, D.A., Yang, W., Voinov, A.A., Rizzoli, A.,Filatova, T. (Eds.), Fifth Biennial Meeting in Modeling for Environ-ment’s Sake. Ottawa, Canada.
Hungspreug, S., Khao-uppatum, W., Thanopanuwat, S., 2000. Floodmanagement in Chao Phraya river basin. In: Chao, The. (Ed.), PhrayaDelta: Historical Development, Dynamics and Challenges of Thai-land’s Rice Bowl: Proceedings of the International Conference, 12–15December 2000, Kasetsart University, Bangkok. Kasetsart University,Bangkok, Thailand.
Hunukumbura, P.B., Tachikawa, Y., 2012. River discharge projectionunder climate change in the Chao Phraya River Basin, Thailand, usingthe MRI-GCM3. 1S Dataset. J. Meteorol. Soc. Jpn. 90(A), 137–150.
IPCC, 2007. Climate Change 2007: The Physical Science Basis. Contri-bution of Working Group I to the Fourth Assessment Report of theIntergovernmental Panel on Climate Change [Solomon, S., Qin, D.,Manning, M., Marquis, M., Averyt, K., Tignor, M., Miller, H.L.,Chen, Z. (Eds.)]. Cambridge University Press, Cambridge, U.K. andNew York, N.Y., U.S.A.
Ishidaira, H., Takeuchi, K., Magome, J., Hapuarachchi, P., Zhou, M.,2005. Application of distributed hydrological model YHyM to largeriver basins in Southeast Asia. In: Proceedings of InternationalSymposium on Southeast Asian Water Environment, vol. 3.
Jones, R.G., Noguer, M., Hassell, D.C., Hudson, D., Wilson, S.S.,Jenkins, G.J., Mitchell, J.F.B., 2004. Generating High ResolutionClimate Change Scenarios using PRECIS. Met Office Hadley Centre,Exeter.
Jothityangkoon, C., Hirunteeyakul, C., Boonrawad, K., Sivapalan, M.,2013. Assessing the impact of climate and land use changes on extremefloods in a large catchment. J. Hydrol. 490, 88–105.
Keokhumcheng, Y., Tingsanchali, T., Clemente, R.S., 2012. Flood riskassessment in the region surrounding the Bangkok SuvarnabhumiAirport. Water Int. 37 (3), 201–217.
Kiem, A.S., Ishidaira, H., Hapuarachchi, H.P., Zhou, M.C., Hirabayashi,Y., Takeuchi, K., 2008. Future hydroclimatology of the Mekong Riverbasin simulated using the high-resolution Japan MeteorologicalAgency (JMA) AGCM. Hydrol. Process. 22 (9), 1382–1394.
Kite, G., 2001. Modeling the Mekong: hydrological simulation forenvironmental impact studies. J. Hydrol. 253 (1–4), 1–13.
Kuntiyawichai, K., Schultz, B., Uhlenbrook, S., Suryadi, F.X., Griensven,A.V., 2011a. Comparison of flood management option for the YangRiver Basin, Thailand. Irrig. Drain. 60, 526–543.
Kuntiyawichai, K., Schultz, B., Uhlenbrook, S., Suryadi, F.X., Corzo, G.A., 2011b. Comprehensive flood mitigation and management in the HiRiver Basin, Thailand. Lowland Tech. Int. 13 (1), 10–18.
Lauri, H., de Moel, H., Ward, P.J., Rasanen, T.A., Keskinen, M.,Kummu, M., 2012. Future changes in Mekong River hydrology:impact of climate change and reservoir operation on discharge.Hydrol. Earth Syst. Sci. 16, 4603–4619.
Leander, R., Buishand, T.A., 2007. Resampling of regional climate modeloutput for the simulation of extreme river flows. J. Hydrol. 332, 487–496.
Lettenmaier, D.P., Wood, A.W., Palmer, R.N., Wood, E.F., Stakhiv, E.Z., 1999. Water resources implications of global warming: a U.S.regional perspective. Clim. Change 43, 537–579.
Li, Y., Guo, Y., Yu, G., 2013. An analysis of extreme flood events duringthe past 400 years at Taihu Lake, China. J. Hydrol. 500, 217–225.
Mainuddin, M., Kirby, M., Hoanh, C.T., 2013. Impact of climate changeon rainfed rice and options for adaptation in the lower Mekong Basin.Nat. Hazards 66, 905–938.
Mainuddin, M., Kirby, M., Hoanh, C.T., 2011. Adaptation to climatechange for food security in the lower Mekong Basin. Food Sec. 3, 433–450.
ard assessment under climate change scenarios in the Yang River Basin,ttp://dx.doi.org/10.1016/j.ijsbe.2016.09.006
682683684685686687688689690691692693694695696697698699700701702703704705706707708709710711712713714715716717718719720721722
723724725726727728729730731732733734735736737738739740741742743744745746747748749750751752753754755756757758759760761762
763
14 S. Shrestha, W. Lohpaisankrit / International Journal of Sustainable Built Environment xxx (2016) xxx–xxx
IJSBE 141 No. of Pages 14
3 October 2016
Manandhar, S., Pandey, V.P., Ishidaira, H., Kazama, F., 2013. Pertur-bation study of climate change impacts in a snow-fed river basin.Hydrol. Process. 27 (24), 3461–3474.
Menzel, L., Niehoff, D., Burger, G., Bronstert, A., 2002. Climate changeimpacts on river flooding: a modelling study of three meso-scalecatchments. In: Beniston, M. (Ed.), Climatic Change: Implications forthe Hydrological Cycle and for Water Management, 10 Springer,Netherlands, pp. 249–269.
Muerth, M.J., St-Denis, B.G., Ricard, S., Velazquez, J.A., Schmid, J.,Minville, M., Caya, D., Chaumount, D., Ludwig, R., Turcotte, R.,2013. On the need for bias correction in regional climate scenarios toassess climate change impacts on river runoff. Hydrol. Earth Syst. Sci.17, 1189–1204.
Nash, J.E., Sutcliffe, J.V., 1970. River flow forecasting through conceptualmodels 1: Discussion of principles. J. Hydrol. 10, 282–290.
Panagoulia, D., Dimou, G., 1997. Sensitivity of flood events to globalclimate change. J. Hydrol. 191 (1–4), 208–222.
Phan, T.T.H., Sunada, K., Oishi, S., Sakamoto, Y., 2010. River dischargein the Kone River Basin (Central Vietnam) under climate change byapplying the BTOPMC distributes hydrological model. J. Water Clim.Change 1 (4), 269–279.
Prudhomme, C., Crooks, S., Kay, A.L., Reynard, N., 2013. Climatechange and river flooding: part 1 classifying the sensitivity of Britishcatchments. Clim. Change 119, 933–948.
Prudhomme, C., Wilby, R.L., Crooks, S., Kay, A.L., Reynard, N.S., 2010.Scenario-neutral approach to climate change impact studies: applica-tion to flood risk. J. Hydrol. 390 (3–4), 198–209.
Rasmussen, J., Sonnenborg, T.O., Stisen, S., Seaby, L.P., Christensen, B.S.B., Hinsby, K., 2012. Climate change effects on irrigation demandsand minimum stream discharge: impact of bias-correction method.Hydrol. Earth Syst. Sci. 16, 4675–4691.
Schmidli, J., Goodess, C.M., Frei, C., Haylock, M.R., Hundecha, Y.,Ribalaygua, J., Schmith, T., 2007. Statistical and dynamical down-scaling of precipitation: an evaluation and comparison of scenarios forthe European Alps. J. Geophys. Res. http://dx.doi.org/10.1029/2005JD007026.
Shrestha, S., 2014. Climate Change Impacts and Adaptation in WaterResources and Water Use Sectors: Case Studies from Southeast Asia.Springer International Publishing Switzerland.
Shrestha, S., Bastola, S., Babel, M.S., Dulal, K.N., Magome, J.,Hapuarachchi, H.A.P., Kazama, F., Ishidaira, H., Takeuchi, K.,
Please cite this article in press as: Shrestha, S., Lohpaisankrit, W. Flood hazThailand. International Journal of Sustainable Built Environment (2016), h
2007. The assessment of spatial and temporal transferability of aphysically based distributed hydrological model parameters in differentphysiographic regions of Nepal. J. Hydrol. 347 (1–2), 153–172.
Steele-Dunne, S., Lynch, P., McGrath, R., Semmler, T., Wang, S.,Hanafin, J., Nolan, P., 2008. The impacts of climate change onhydrology in Ireland. J. Hydrol. 356 (1–2), 28–45.
Tu, V., Tingsanchali, T., 2010. Flood hazard and risk assessment ofHoang Long River basin, Vietnam. In: Proceedings of the Interna-tional MIKE by DHI Conference.
Tuan, L.A., Chinvanno, S., 2011. Climate change in the Mekong RiverDelta and key concerns on future climate threats. In: Stewart, M.A.,Coclanis, P.A. (Eds.), Environmental Change and AgriculturalSustainability in the Mekong Delta. Adv. Global Change Res., vol.45, pp. 207–217.
Ty, T.V., Sunada, K., Ichikawa, Y., Oishi, S., 2012. Scenario-based impactassessment of land use/cover and climate changes on water resourcesand demand: a case study in the Srepok River Basin, Vietnam-Cambodia. Water Resour. Manage. 26, 1387–1407.
U.S. Corps of Engineers, 2002. HEC-RAS River Analysis System,Hydraulic Reference Manual. Hydraulic Engineering Center ReportCPD-69, Davis, CA.
Viviroli, D., Archer, D.R., Buytaert, W., Fowler, H.J., Greenwood, G.B.,Hamlet, A.F., Huang, Y., Koboltschnig, G., Litaor, M.I., Lopez-Moreno, J.I., Lorentz, S., Schadler, B., Schreier, H., Schwaiger, K.,Vuille, M., Woods, R., 2011. Climate change and mountain waterresources: overview and recommendations for research, managementand policy. Hydrol. Earth Syst. Sci. 15 (2), 471–504.
Wan, Y.A., Yin, F., Liu, Z.Z., Cui, W.C., Ao, T.Q., 2009. Study on theeffect of DEM spatial resolution and sampling algorithms on runoffsimulation by BTOPMC. IAHS-AISH Publ. 335, 130–136.
Willmott, C.J., 1984. On the evaluation of model performance in physicalgeography. In: Gaile, G.L., Willmott, C.J. (Eds.), Spatial Statistics andModels. D. Reidel, Dordrecht, Holland, pp. 443–460.
Willmott, C.J., 1981. On the validation of models. Phys. Geogr. 2, 184–194.
Yang, C., Yu, Z., Hao, Z., Zhang, J., Zhu, J., 2012. Impact of climatechange on flood and drought events in Huaihe River Basin, China.Hydrol. Res. 43 (1–2), 14–22.
Zheng, P., Li, Z., Bai, Z., Wan, L., Li, X., 2012. Influence of climatechange to drought and flood. Disaster Adv. 5 (4), 1331–1334.
ard assessment under climate change scenarios in the Yang River Basin,ttp://dx.doi.org/10.1016/j.ijsbe.2016.09.006
![Flood Rapid Assessment Model (F-RAM) Development 2008€¦ · Flood Rapid Assessment Model (F-RAM) Development. 2008. NOVEMBER 2008. ... Flood Damage Analysis [HEC-FIA], Hazard US](https://img.pdfslide.net/doc/110x75/5e9ca1f36d26ba4bac70a8a6/flood-rapid-assessment-model-f-ram-development-2008-flood-rapid-assessment-model.jpg)