Embed Size (px)
Citation preview
Florida Medicaid Inpatient Prospective Payment System
Justin Senior Deputy Secretary for Medicaid, Agency for Health Care Administration
Malcolm Ferguson
Associate Director, Navigant Healthcare
Senate Health Policy Committee February 6, 2013
Topics
2
Project Overview
What is a Diagnosis Related Group (DRG)?
Selection of APR-DRGs
DRG Pricing Calculation
Payment Design Decisions
Budget and Pay-to-Cost Goals
Detailed Results of Current Payment Simulation
Results of Simulation Excluding IGTs
Summary
Project Overview Project Basics
• Legislation – Section 409.905(5)(f), Florida Statutes, as amended by
House Bill 5301, 2012 session – Convert Medicaid fee-for-service inpatient hospital
reimbursement to a prospective payment system (PPS) which categorizes stays using Diagnosis Related Groups (DRGs)
• Timing – Submit a Medicaid DRG plan no later than January 1, 2013 – Implement DRG pricing by July 1, 2013
• AHCA engaged MGT of America, and its subcontractor Navigant Healthcare, for project
3
Project Overview Public Input
• Five public meetings were held between August 2012 and January 2013. • Public comments, presentations and questions were received during each
meeting • Individual meetings were held with stakeholders, including: the Florida
Hospital Association, the Safety Net Hospital Alliance, HCA Healthcare, H. Lee Moffitt Cancer Center, Orlando Health, representatives of stand-alone children's hospitals, representatives of rehabilitation hospitals, the Florida Association of Health Plans and individual health plans including United Health Plan , Amerigroup and Wellcare, and others stakeholders.
• All supplemental information received from stakeholders was forwarded to Navigant and provided to the Governance committee for consideration
• Historical hospital claims data, used by Navigant in the DRG simulations, was provided to the Florida Hospital Association, and is being provided to other parties at this time now that legal agreements are in place allowing that data sharing.
4
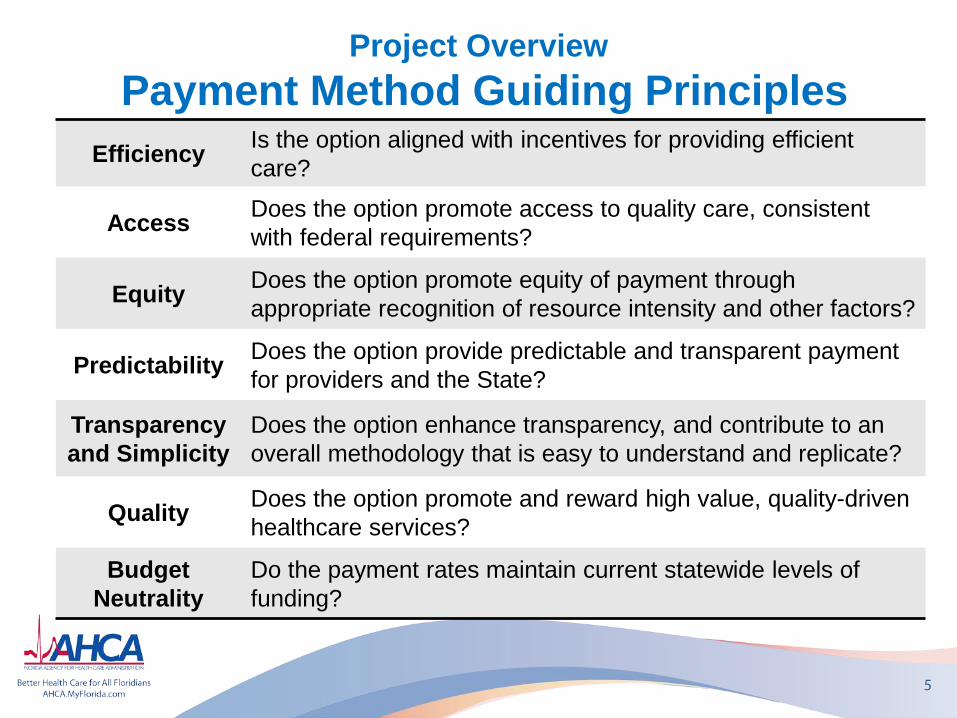
Project Overview Payment Method Guiding Principles
5
Efficiency Is the option aligned with incentives for providing efficient care?
Access Does the option promote access to quality care, consistent with federal requirements?
Equity Does the option promote equity of payment through appropriate recognition of resource intensity and other factors?
Predictability Does the option provide predictable and transparent payment for providers and the State?
Transparency and Simplicity
Does the option enhance transparency, and contribute to an overall methodology that is easy to understand and replicate?
Quality Does the option promote and reward high value, quality-driven healthcare services?
Budget Neutrality
Do the payment rates maintain current statewide levels of funding?
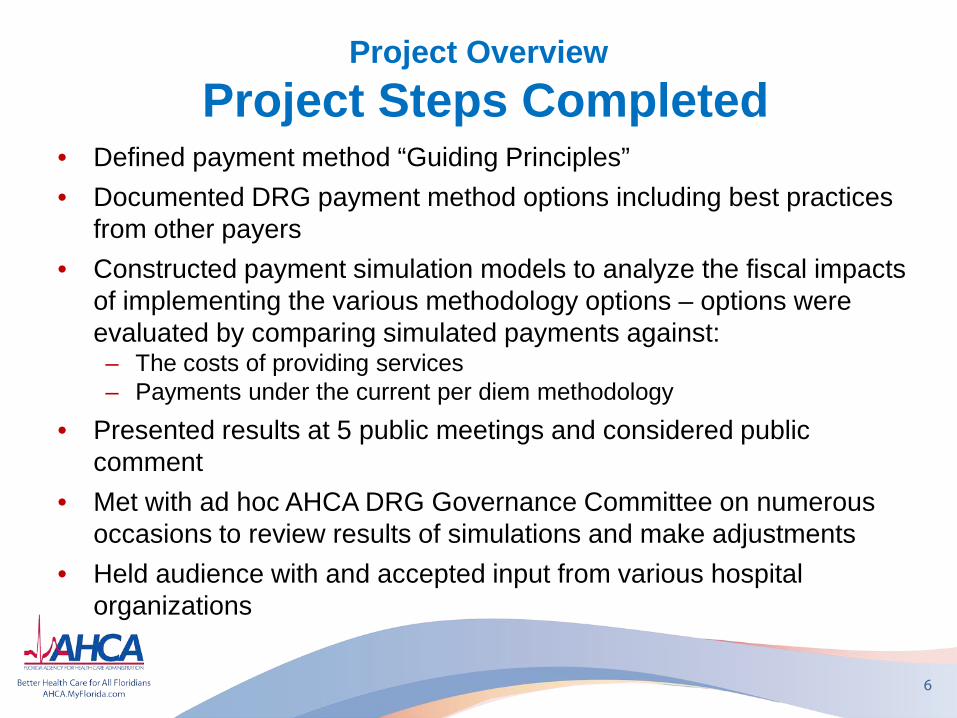
Project Overview Project Steps Completed
• Defined payment method “Guiding Principles” • Documented DRG payment method options including best practices
from other payers • Constructed payment simulation models to analyze the fiscal impacts
of implementing the various methodology options – options were evaluated by comparing simulated payments against: – The costs of providing services – Payments under the current per diem methodology
• Presented results at 5 public meetings and considered public comment
• Met with ad hoc AHCA DRG Governance Committee on numerous occasions to review results of simulations and make adjustments
• Held audience with and accepted input from various hospital organizations
6
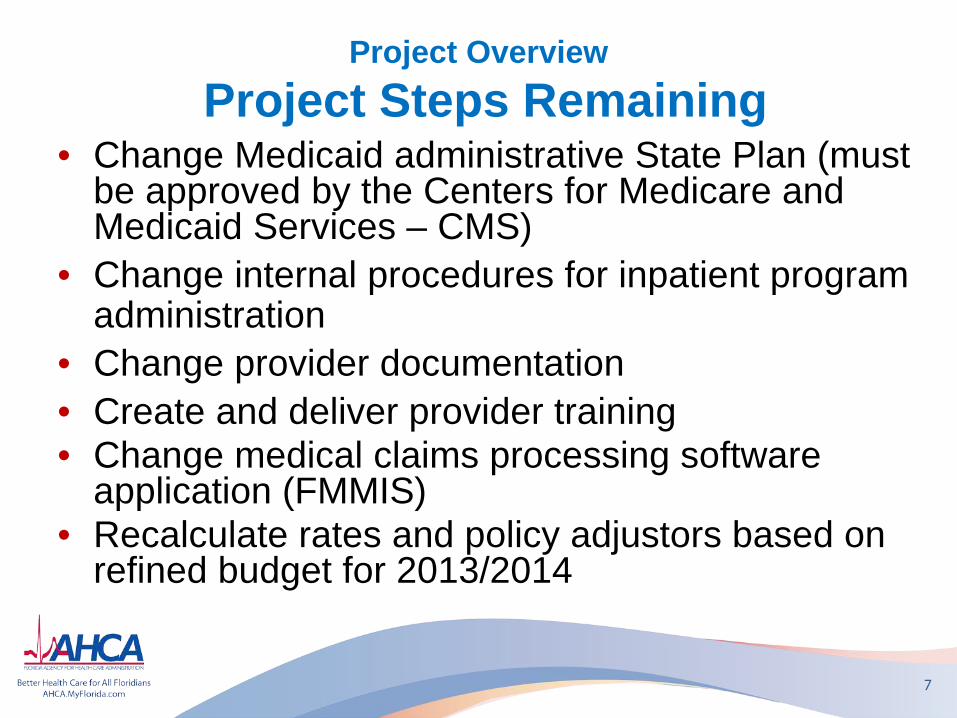
Project Overview Project Steps Remaining
• Change Medicaid administrative State Plan (must be approved by the Centers for Medicare and Medicaid Services – CMS)
• Change internal procedures for inpatient program administration
• Change provider documentation • Create and deliver provider training • Change medical claims processing software
application (FMMIS) • Recalculate rates and policy adjustors based on
refined budget for 2013/2014
7
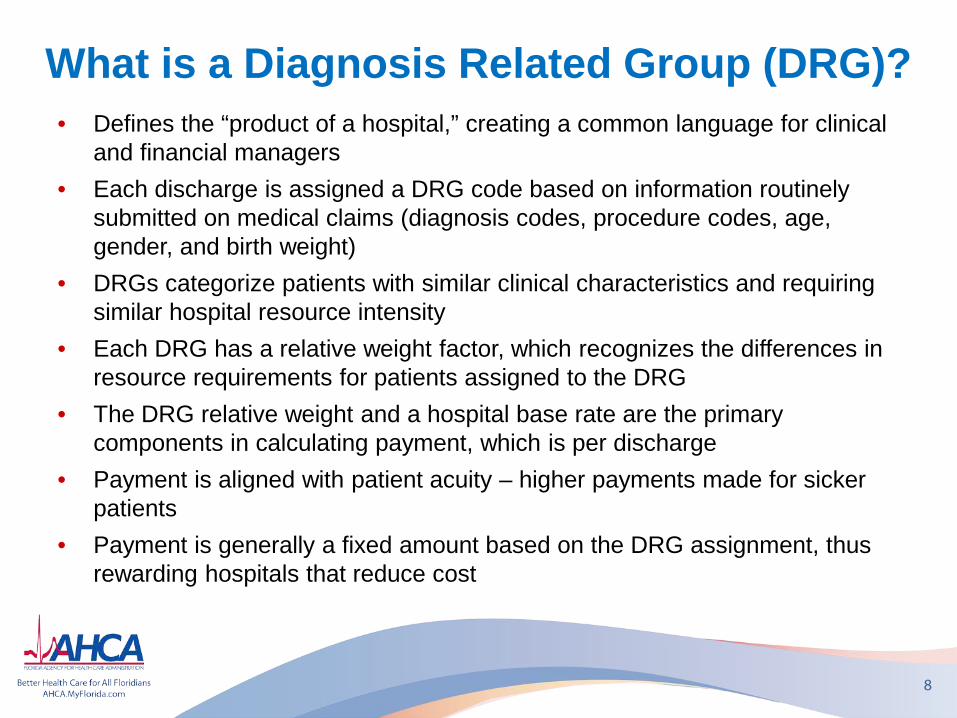
What is a Diagnosis Related Group (DRG)? • Defines the “product of a hospital,” creating a common language for clinical
and financial managers • Each discharge is assigned a DRG code based on information routinely
submitted on medical claims (diagnosis codes, procedure codes, age, gender, and birth weight)
• DRGs categorize patients with similar clinical characteristics and requiring similar hospital resource intensity
• Each DRG has a relative weight factor, which recognizes the differences in resource requirements for patients assigned to the DRG
• The DRG relative weight and a hospital base rate are the primary components in calculating payment, which is per discharge
• Payment is aligned with patient acuity – higher payments made for sicker patients
• Payment is generally a fixed amount based on the DRG assignment, thus rewarding hospitals that reduce cost
8
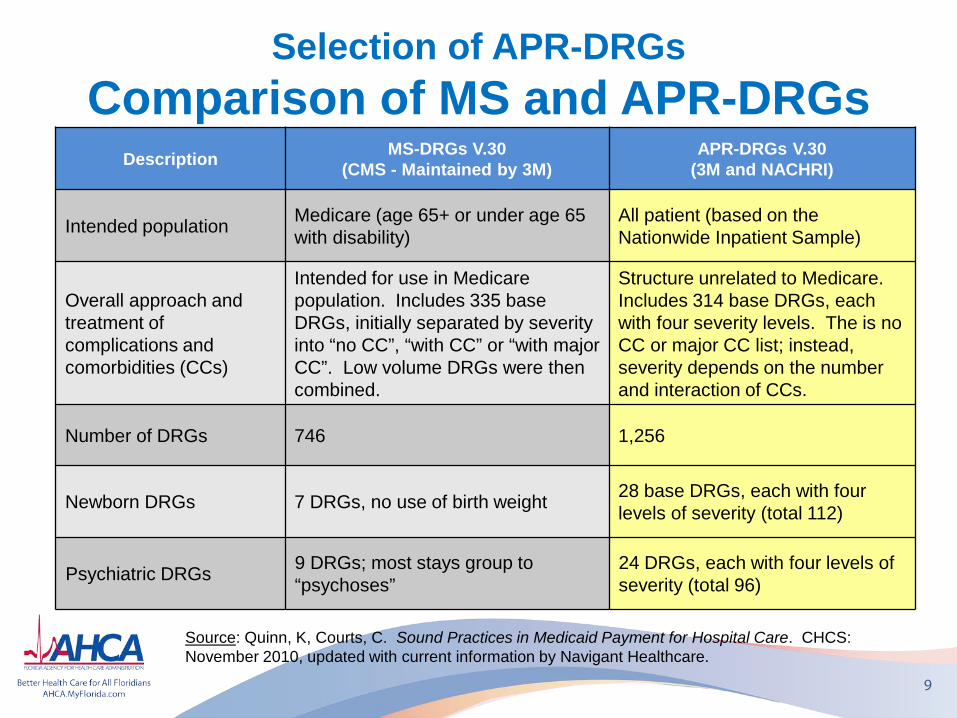
Selection of APR-DRGs Comparison of MS and APR-DRGs
9
Source: Quinn, K, Courts, C. Sound Practices in Medicaid Payment for Hospital Care. CHCS: November 2010, updated with current information by Navigant Healthcare.
Description MS-DRGs V.30 (CMS - Maintained by 3M)
APR-DRGs V.30 (3M and NACHRI)
Intended population Medicare (age 65+ or under age 65 with disability)
All patient (based on the Nationwide Inpatient Sample)
Overall approach and treatment of complications and comorbidities (CCs)
Intended for use in Medicare population. Includes 335 base DRGs, initially separated by severity into “no CC”, “with CC” or “with major CC”. Low volume DRGs were then combined.
Structure unrelated to Medicare. Includes 314 base DRGs, each with four severity levels. The is no CC or major CC list; instead, severity depends on the number and interaction of CCs.
Number of DRGs 746 1,256
Newborn DRGs 7 DRGs, no use of birth weight 28 base DRGs, each with four levels of severity (total 112)
Psychiatric DRGs 9 DRGs; most stays group to “psychoses”
24 DRGs, each with four levels of severity (total 96)
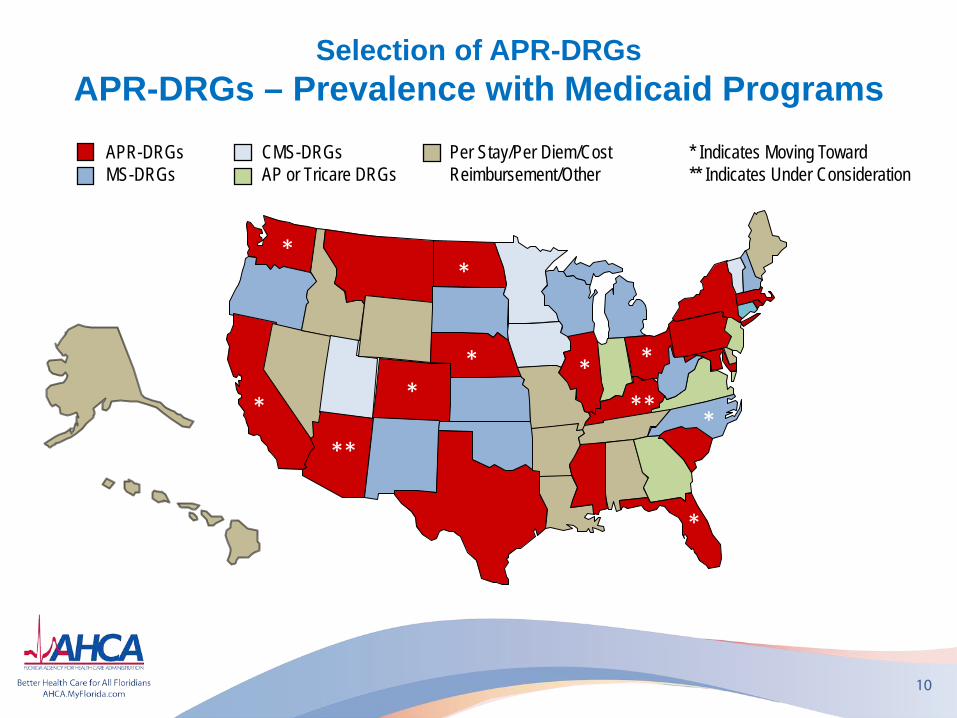
Selection of APR-DRGs APR-DRGs – Prevalence with Medicaid Programs
10
APR-DRGs MS-DRGs
*
*
CMS-DRGs AP or Tricare DRGs
Per Stay/Per Diem/Cost Reimbursement/Other
* * *
* Indicates Moving Toward ** Indicates Under Consideration
* **
*
*
**
*
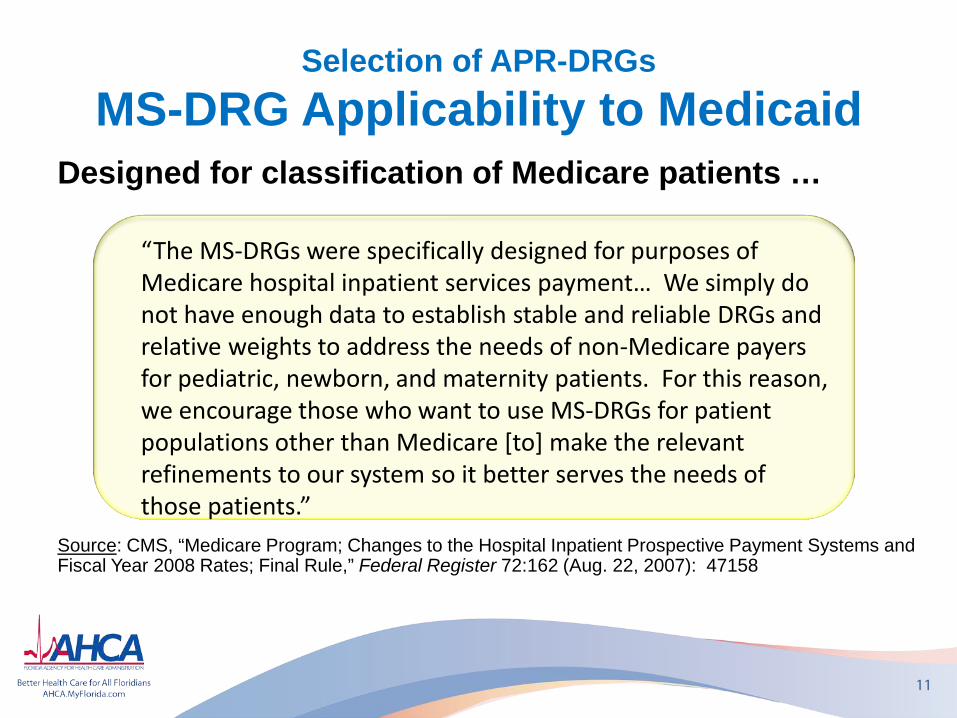
Selection of APR-DRGs MS-DRG Applicability to Medicaid
11
Designed for classification of Medicare patients …
Source: CMS, “Medicare Program; Changes to the Hospital Inpatient Prospective Payment Systems and Fiscal Year 2008 Rates; Final Rule,” Federal Register 72:162 (Aug. 22, 2007): 47158
“The MS-DRGs were specifically designed for purposes of Medicare hospital inpatient services payment… We simply do not have enough data to establish stable and reliable DRGs and relative weights to address the needs of non-Medicare payers for pediatric, newborn, and maternity patients. For this reason, we encourage those who want to use MS-DRGs for patient populations other than Medicare [to] make the relevant refinements to our system so it better serves the needs of those patients.”
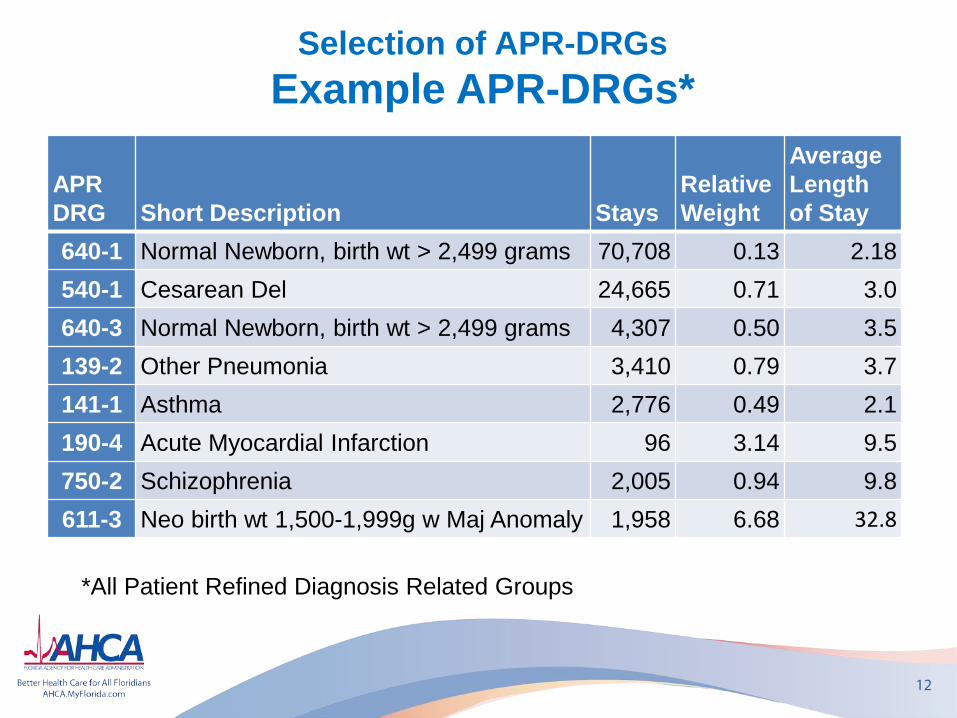
Selection of APR-DRGs Example APR-DRGs*
APR DRG Short Description Stays
Relative Weight
Average Length of Stay
640-1 Normal Newborn, birth wt > 2,499 grams 70,708 0.13 2.18 540-1 Cesarean Del 24,665 0.71 3.0 640-3 Normal Newborn, birth wt > 2,499 grams 4,307 0.50 3.5 139-2 Other Pneumonia 3,410 0.79 3.7 141-1 Asthma 2,776 0.49 2.1 190-4 Acute Myocardial Infarction 96 3.14 9.5 750-2 Schizophrenia 2,005 0.94 9.8 611-3 Neo birth wt 1,500-1,999g w Maj Anomaly 1,958 6.68 32.8
12
*All Patient Refined Diagnosis Related Groups
DRG Pricing Calculation Basics
13
• Payment is generally determined by multiplying a hospital’s “base rate” by the assigned DRG’s relative weight factor
• An “outlier” payment provision is typically incorporated to provide additional payments where the base DRG amount is not appropriate – generally cases with extraordinarily high costs
• Payment models are also commonly modified to affect payment for specialty services or providers, including behavioral health, rehabilitation, neonatal, pediatric and others
DRG Pricing Calculation Formula
14
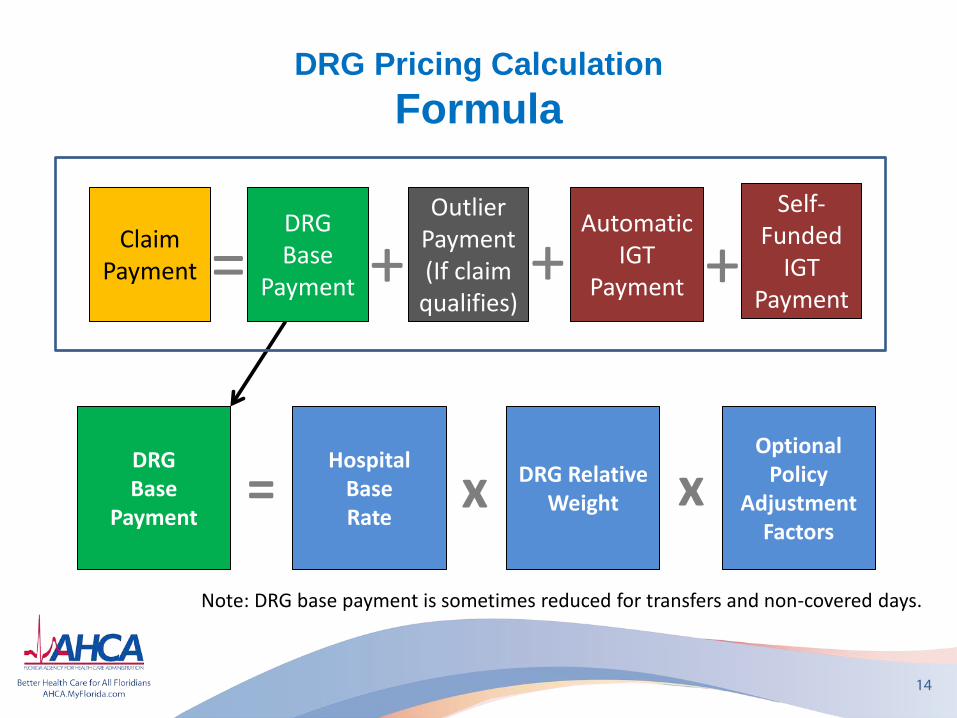
DRG Base
Payment
DRG Relative Weight
Hospital Base Rate
x = x Optional
Policy Adjustment
Factors
Note: DRG base payment is sometimes reduced for transfers and non-covered days.
DRG Base
Payment
Outlier Payment (If claim
qualifies)
Claim Payment + =
Automatic IGT
Payment + + Self-
Funded IGT
Payment
DRG Pricing Calculation Examples
15
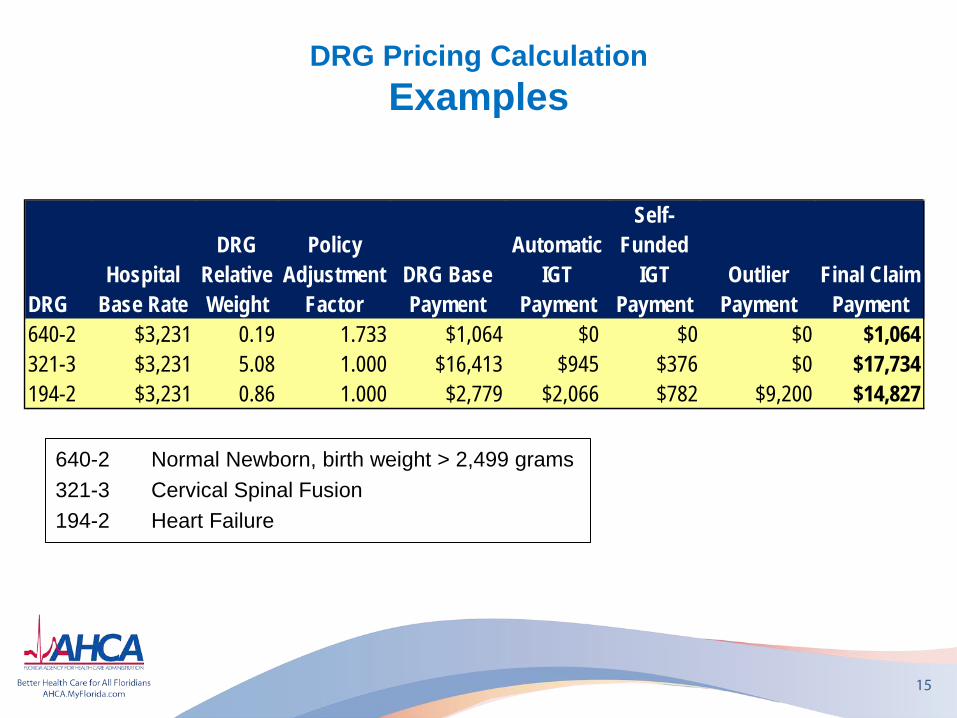
DRGHospital
Base Rate
DRG Relative Weight
Policy Adjustment
FactorDRG Base Payment
Automatic IGT
Payment
Self-Funded
IGT Payment
Outlier Payment
Final Claim Payment
640-2 $3,231 0.19 1.733 $1,064 $0 $0 $0 $1,064321-3 $3,231 5.08 1.000 $16,413 $945 $376 $0 $17,734194-2 $3,231 0.86 1.000 $2,779 $2,066 $782 $9,200 $14,827
640-2 Normal Newborn, birth weight > 2,499 grams 321-3 Cervical Spinal Fusion 194-2 Heart Failure
Payment Design Decisions Affected Providers and Services
16
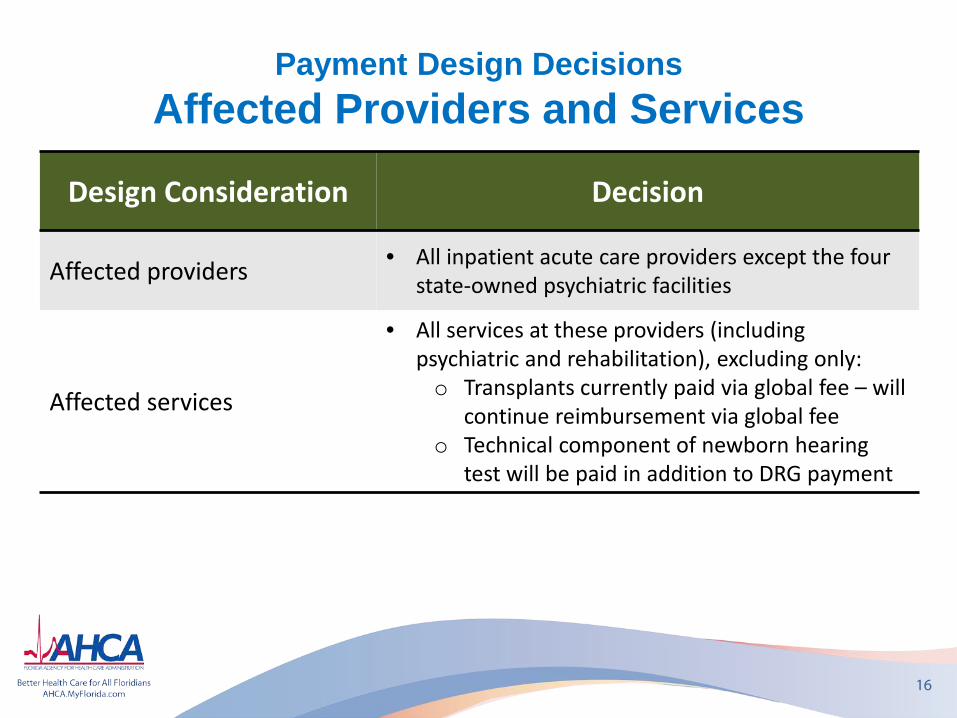
Design Consideration Decision
Affected providers • All inpatient acute care providers except the four state-owned psychiatric facilities
Affected services
• All services at these providers (including psychiatric and rehabilitation), excluding only: o Transplants currently paid via global fee – will
continue reimbursement via global fee o Technical component of newborn hearing
test will be paid in addition to DRG payment
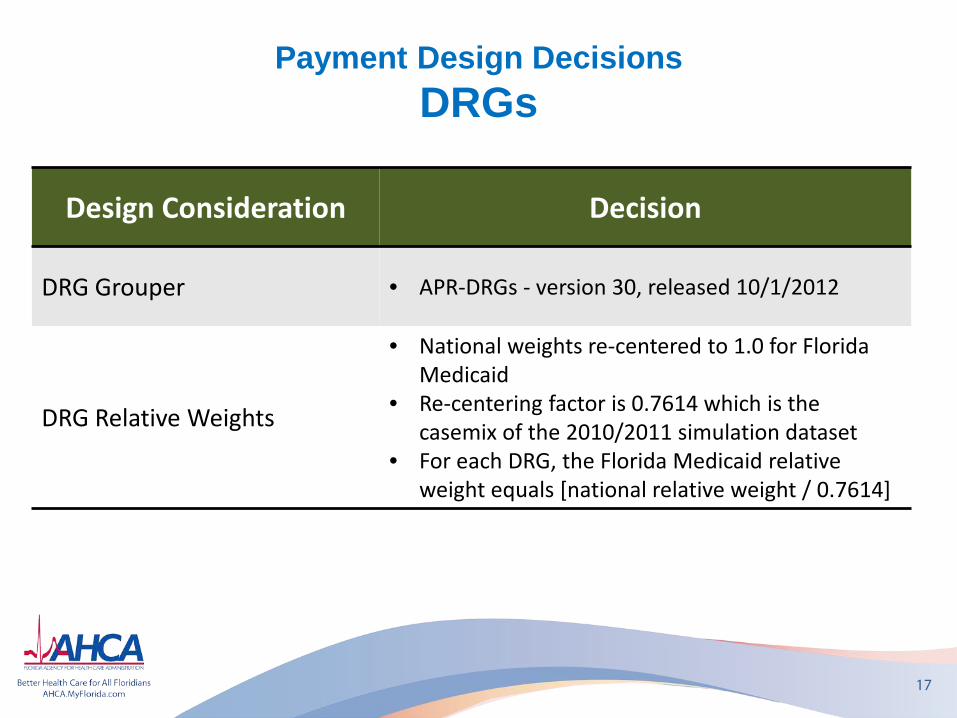
Payment Design Decisions DRGs
17
Design Consideration Decision
DRG Grouper • APR-DRGs - version 30, released 10/1/2012
DRG Relative Weights
• National weights re-centered to 1.0 for Florida Medicaid
• Re-centering factor is 0.7614 which is the casemix of the 2010/2011 simulation dataset
• For each DRG, the Florida Medicaid relative weight equals [national relative weight / 0.7614]
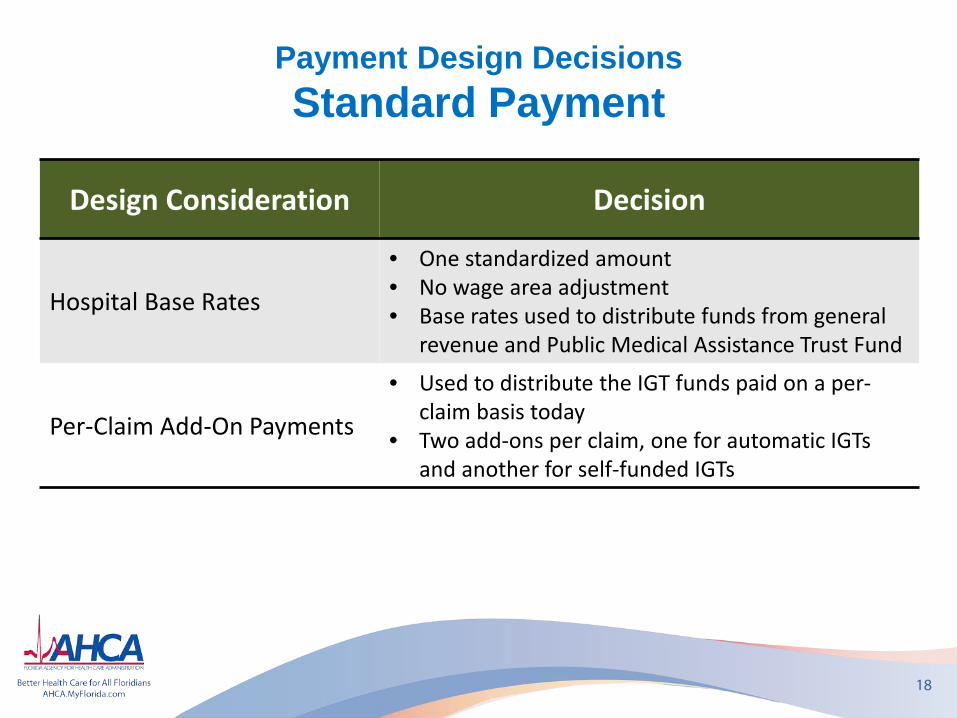
Payment Design Decisions Standard Payment
18
Design Consideration Decision
Hospital Base Rates
• One standardized amount • No wage area adjustment • Base rates used to distribute funds from general
revenue and Public Medical Assistance Trust Fund
Per-Claim Add-On Payments
• Used to distribute the IGT funds paid on a per-claim basis today
• Two add-ons per claim, one for automatic IGTs and another for self-funded IGTs
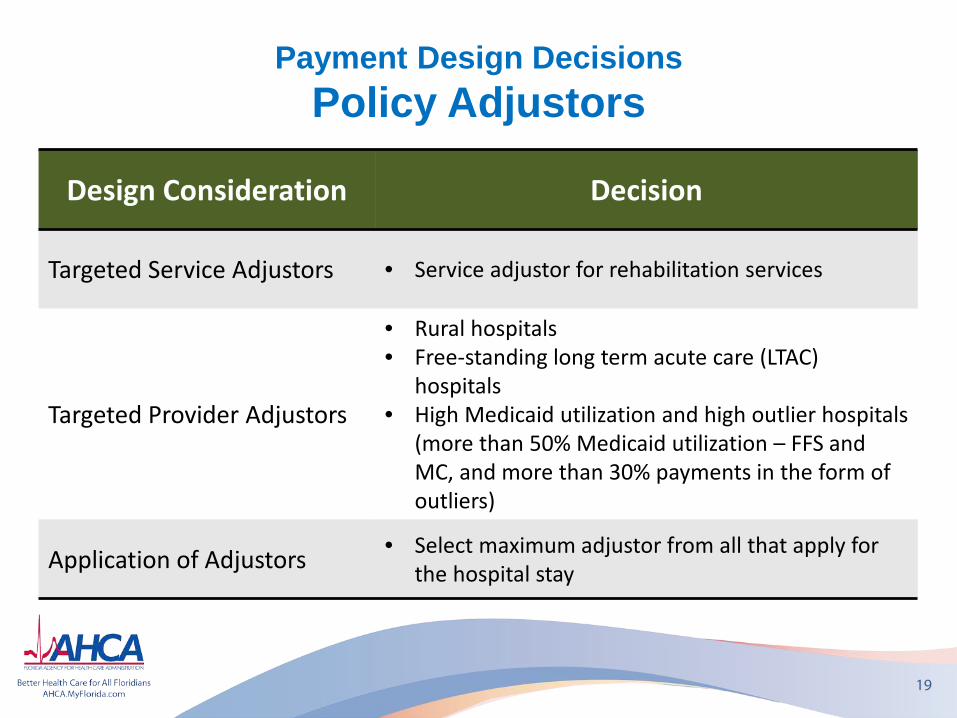
Payment Design Decisions Policy Adjustors
19
Design Consideration Decision
Targeted Service Adjustors • Service adjustor for rehabilitation services
Targeted Provider Adjustors
• Rural hospitals • Free-standing long term acute care (LTAC)
hospitals • High Medicaid utilization and high outlier hospitals
(more than 50% Medicaid utilization – FFS and MC, and more than 30% payments in the form of outliers)
Application of Adjustors • Select maximum adjustor from all that apply for the hospital stay
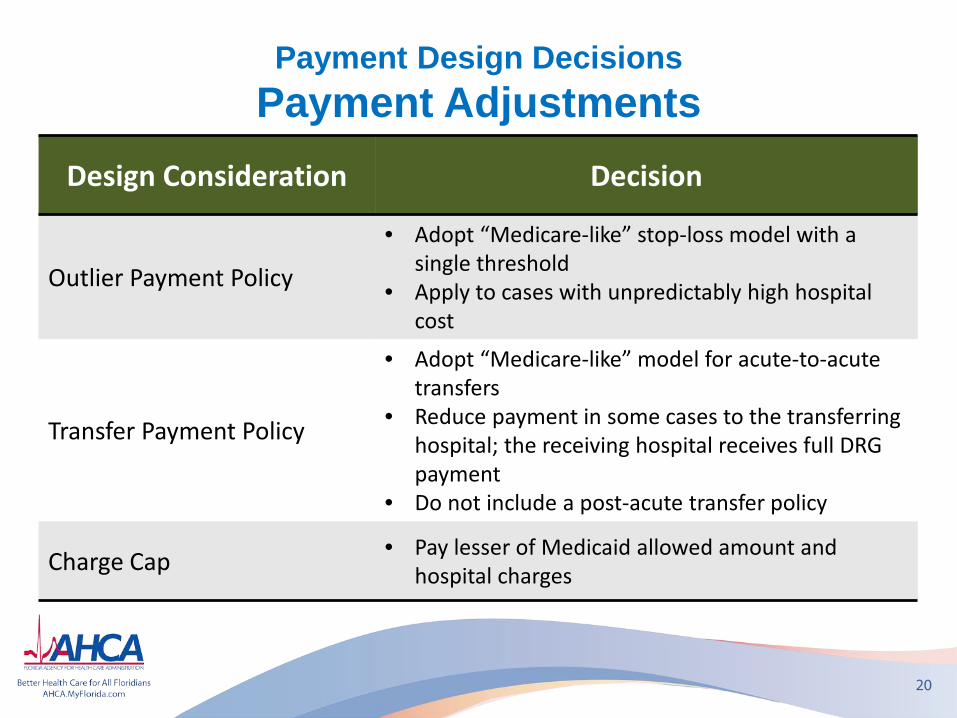
Payment Design Decisions Payment Adjustments
20
Design Consideration Decision
Outlier Payment Policy
• Adopt “Medicare-like” stop-loss model with a single threshold
• Apply to cases with unpredictably high hospital cost
Transfer Payment Policy
• Adopt “Medicare-like” model for acute-to-acute transfers
• Reduce payment in some cases to the transferring hospital; the receiving hospital receives full DRG payment
• Do not include a post-acute transfer policy
Charge Cap • Pay lesser of Medicaid allowed amount and hospital charges
Payment Design Decisions Payment Adjustments, cont’d
21
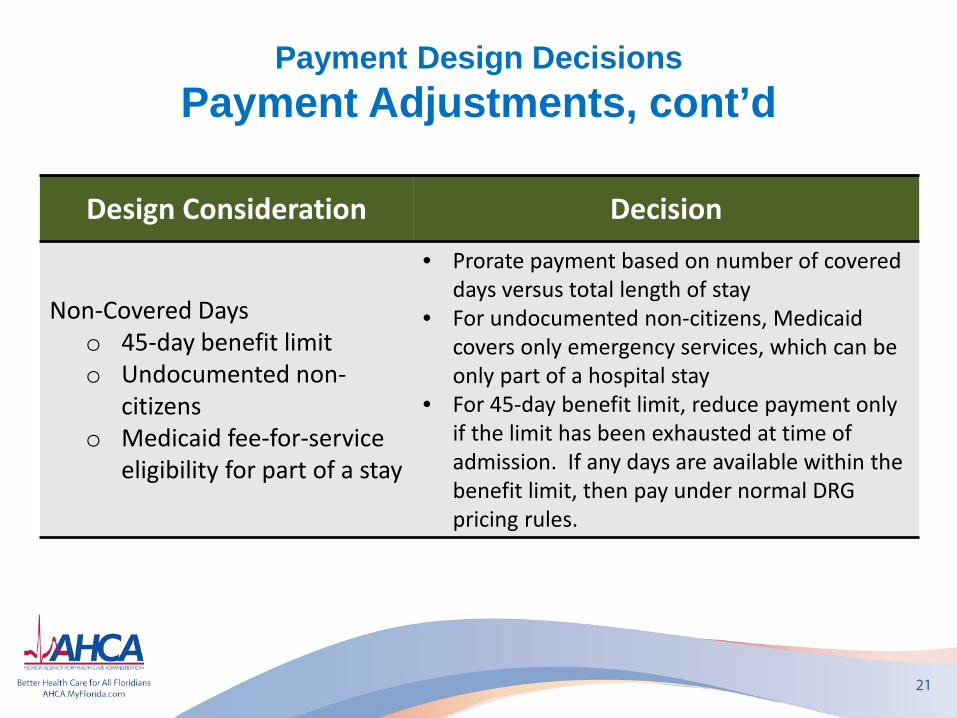
Design Consideration Decision
Non-Covered Days o 45-day benefit limit o Undocumented non-
citizens o Medicaid fee-for-service
eligibility for part of a stay
• Prorate payment based on number of covered days versus total length of stay
• For undocumented non-citizens, Medicaid covers only emergency services, which can be only part of a hospital stay
• For 45-day benefit limit, reduce payment only if the limit has been exhausted at time of admission. If any days are available within the benefit limit, then pay under normal DRG pricing rules.
Payment Design Decisions Policy Decisions
22
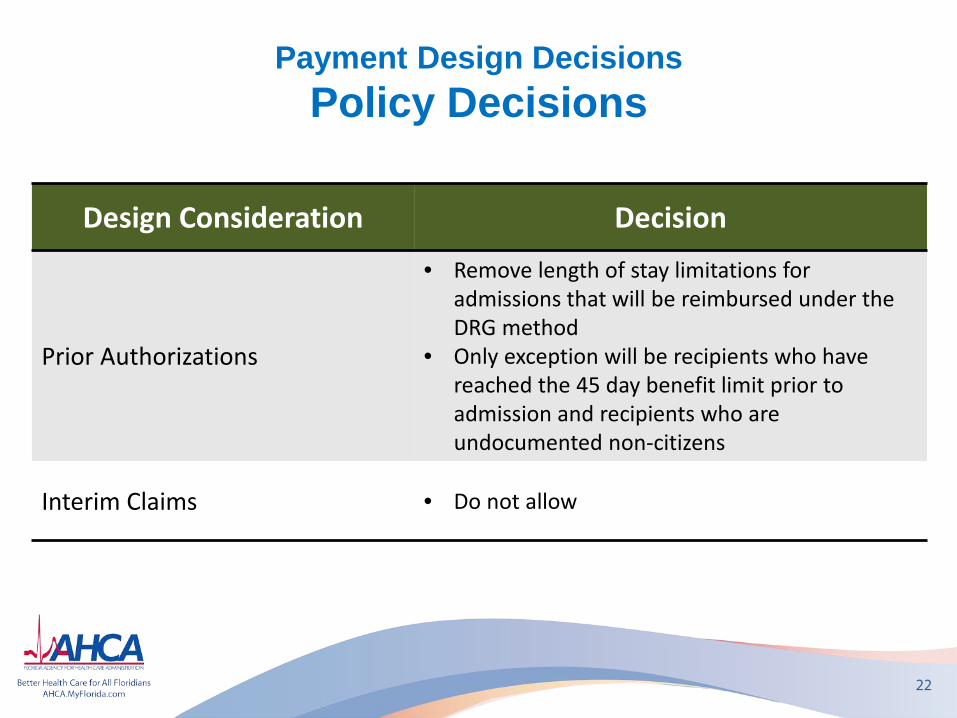
Design Consideration Decision
Prior Authorizations
• Remove length of stay limitations for admissions that will be reimbursed under the DRG method
• Only exception will be recipients who have reached the 45 day benefit limit prior to admission and recipients who are undocumented non-citizens
Interim Claims • Do not allow
Payment Design Decisions Initial Implementation Decisions
23
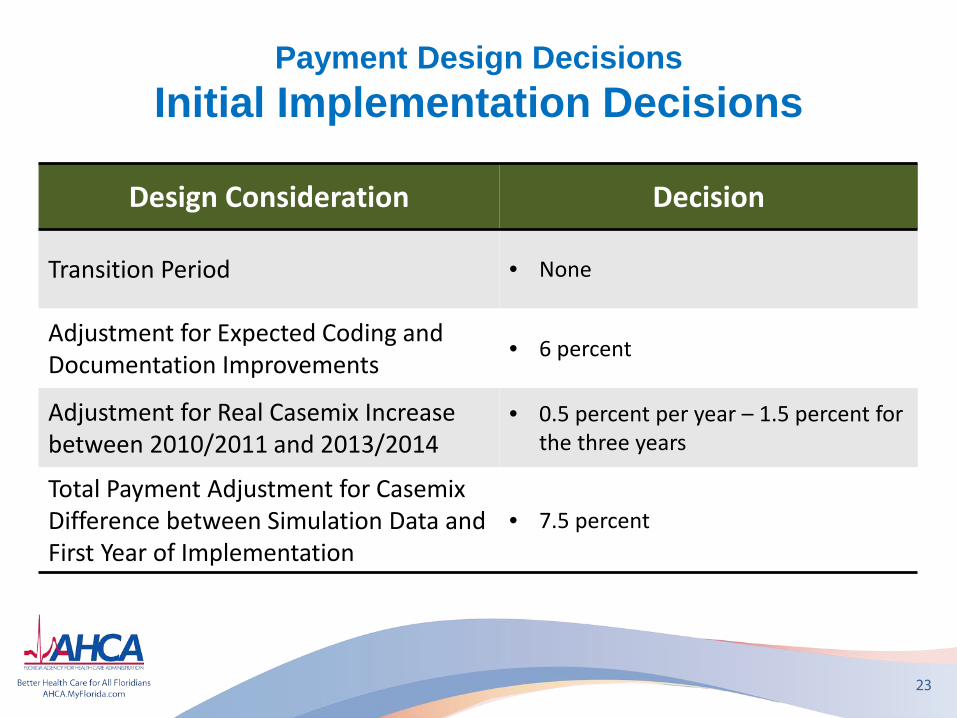
Design Consideration Decision
Transition Period • None
Adjustment for Expected Coding and Documentation Improvements
• 6 percent
Adjustment for Real Casemix Increase between 2010/2011 and 2013/2014
• 0.5 percent per year – 1.5 percent for the three years
Total Payment Adjustment for Casemix Difference between Simulation Data and First Year of Implementation
• 7.5 percent
Budget and Pay-to-Cost Goals Tentative Inpatient Budget 2013/2014
24
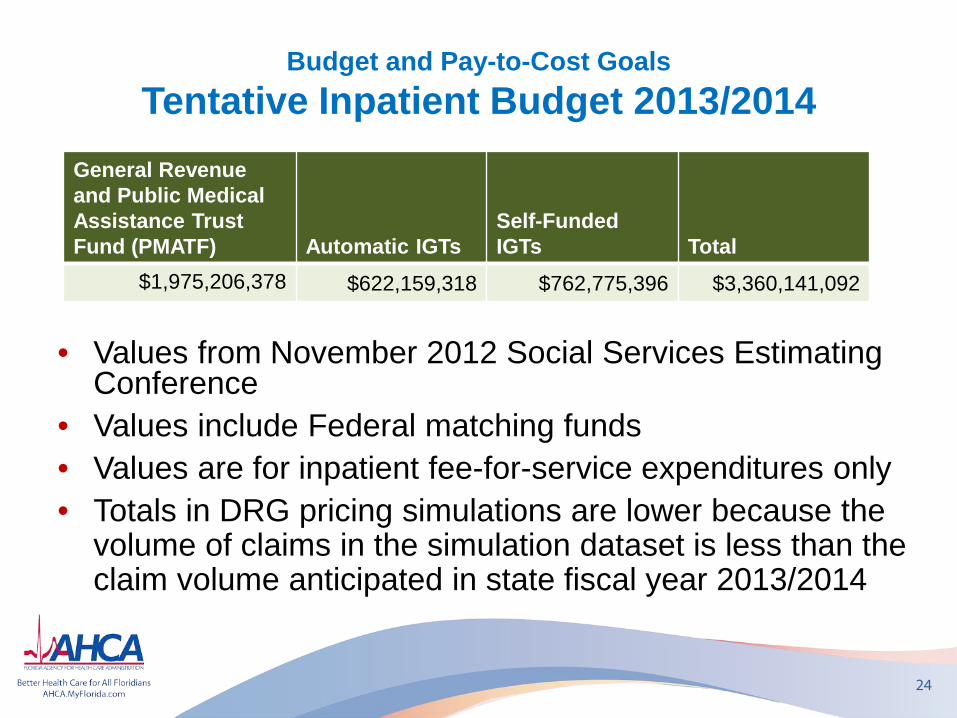
General Revenue and Public Medical Assistance Trust Fund (PMATF) Automatic IGTs
Self-Funded IGTs Total
$1,975,206,378 $622,159,318 $762,775,396 $3,360,141,092
• Values from November 2012 Social Services Estimating Conference
• Values include Federal matching funds • Values are for inpatient fee-for-service expenditures only • Totals in DRG pricing simulations are lower because the
volume of claims in the simulation dataset is less than the claim volume anticipated in state fiscal year 2013/2014
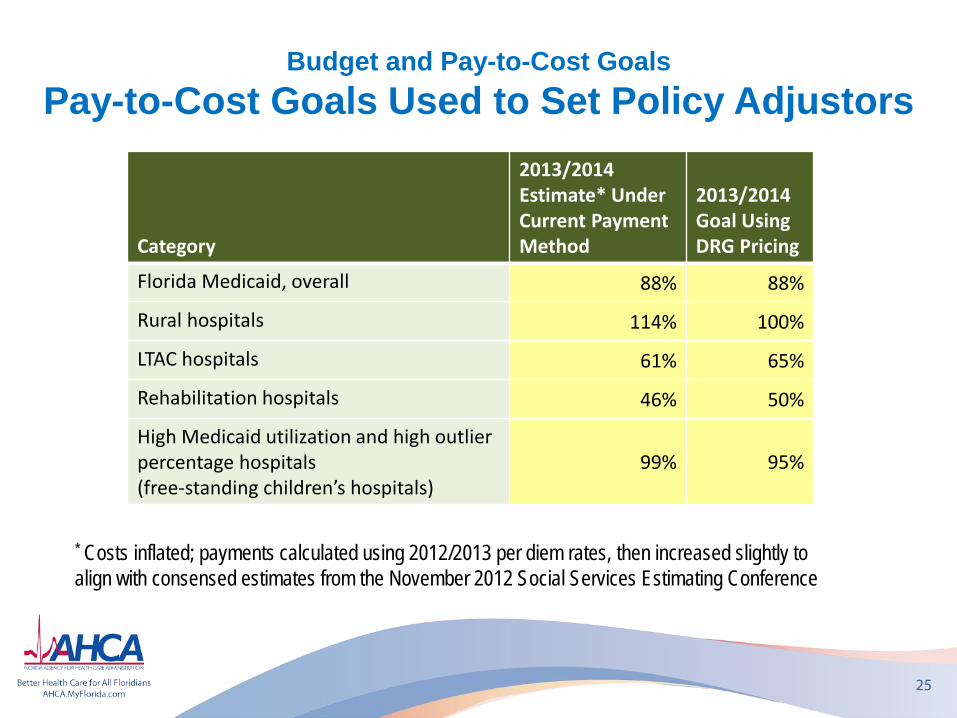
Budget and Pay-to-Cost Goals Pay-to-Cost Goals Used to Set Policy Adjustors
25
Category
2013/2014 Estimate* Under Current Payment Method
2013/2014 Goal Using DRG Pricing
Florida Medicaid, overall 88% 88%
Rural hospitals 114% 100%
LTAC hospitals 61% 65%
Rehabilitation hospitals 46% 50%
High Medicaid utilization and high outlier percentage hospitals (free-standing children’s hospitals)
99% 95%
* Costs inflated; payments calculated using 2012/2013 per diem rates, then increased slightly to align with consensed estimates from the November 2012 Social Services Estimating Conference
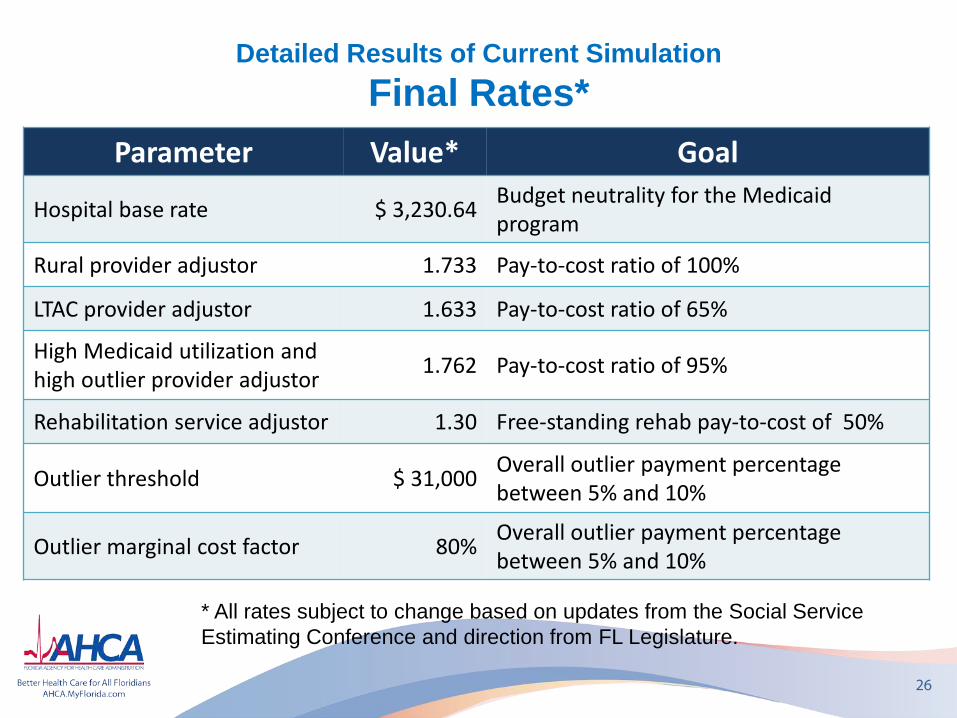
Detailed Results of Current Simulation Final Rates*
26
Parameter Value* Goal
Hospital base rate $ 3,230.64 Budget neutrality for the Medicaid program
Rural provider adjustor 1.733 Pay-to-cost ratio of 100%
LTAC provider adjustor 1.633 Pay-to-cost ratio of 65%
High Medicaid utilization and high outlier provider adjustor 1.762 Pay-to-cost ratio of 95%
Rehabilitation service adjustor 1.30 Free-standing rehab pay-to-cost of 50%
Outlier threshold $ 31,000 Overall outlier payment percentage between 5% and 10%
Outlier marginal cost factor 80% Overall outlier payment percentage between 5% and 10%
* All rates subject to change based on updates from the Social Service Estimating Conference and direction from FL Legislature.
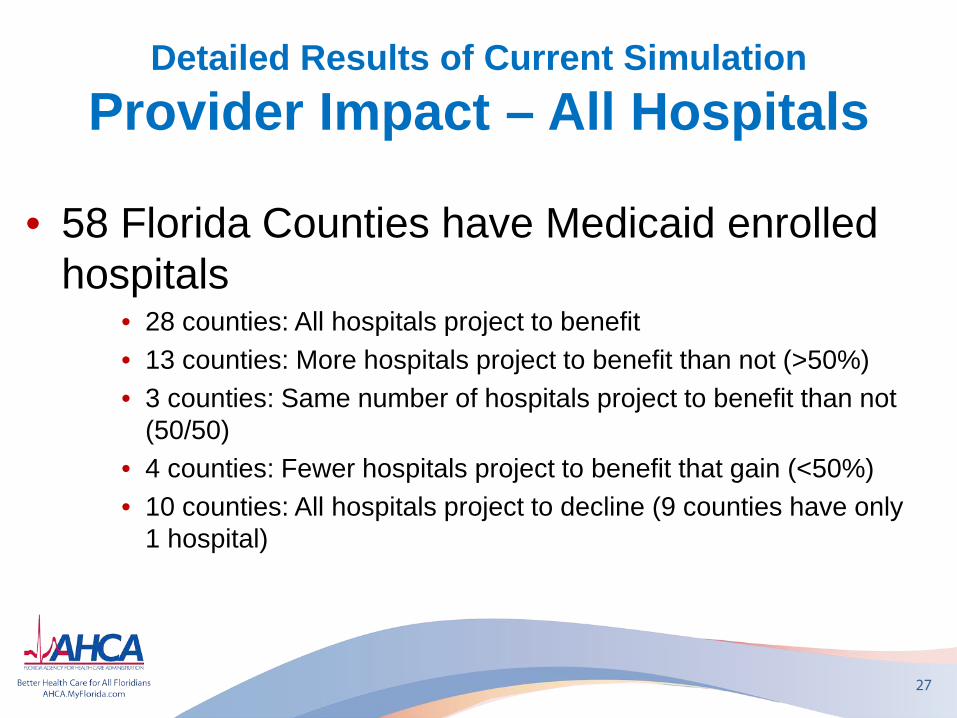
Detailed Results of Current Simulation Provider Impact – All Hospitals
• 58 Florida Counties have Medicaid enrolled hospitals
• 28 counties: All hospitals project to benefit • 13 counties: More hospitals project to benefit than not (>50%) • 3 counties: Same number of hospitals project to benefit than not
(50/50) • 4 counties: Fewer hospitals project to benefit that gain (<50%) • 10 counties: All hospitals project to decline (9 counties have only
1 hospital)
27
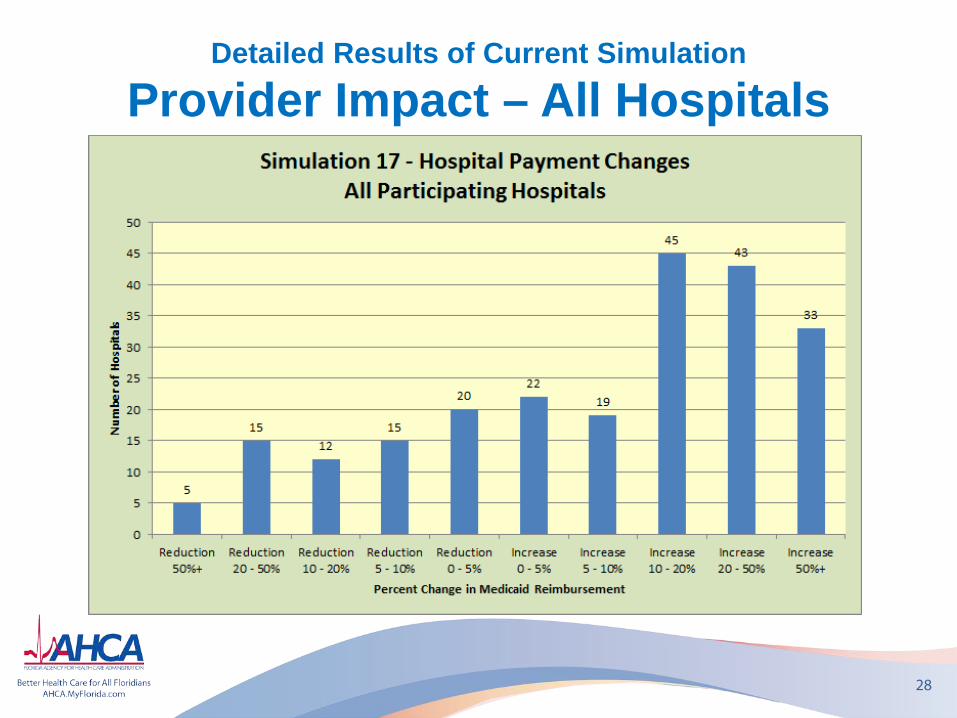
Detailed Results of Current Simulation
Provider Impact – All Hospitals
28
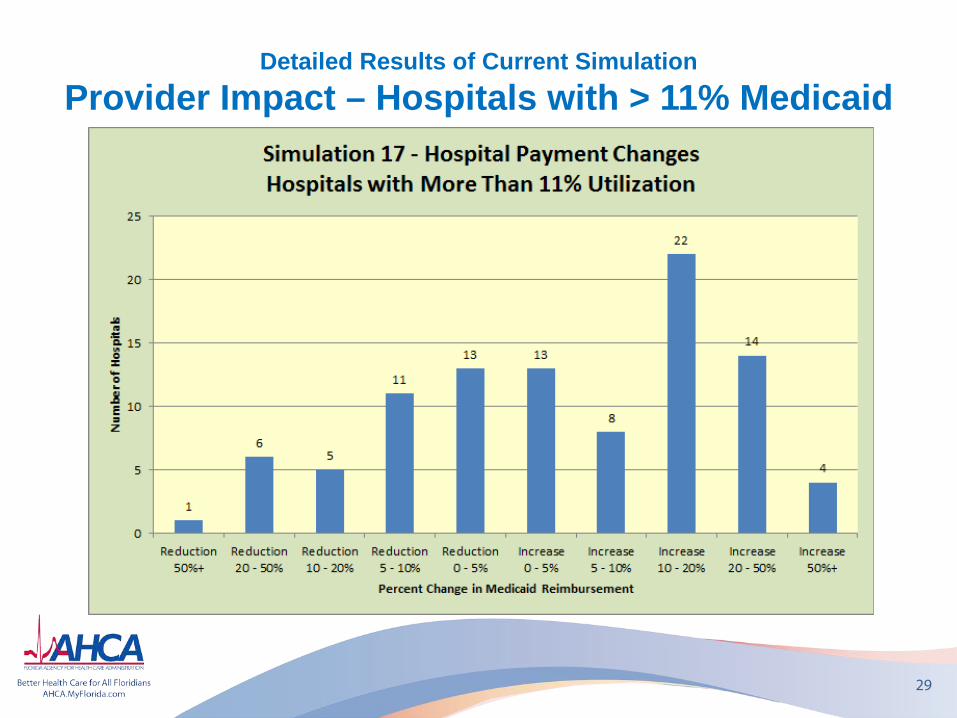
Detailed Results of Current Simulation Provider Impact – Hospitals with > 11% Medicaid
29
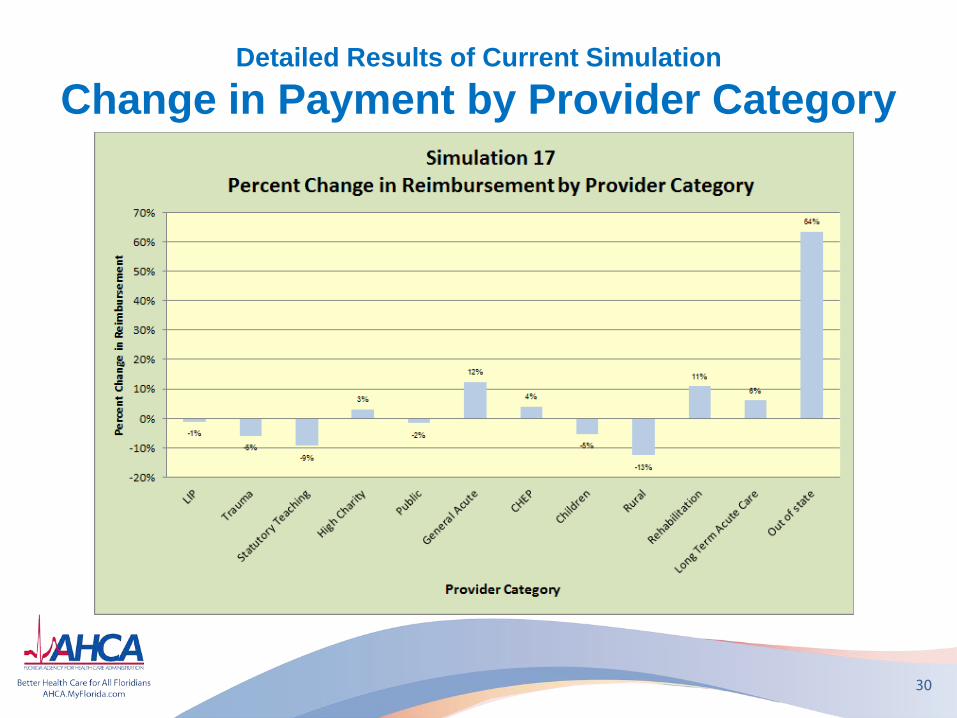
Detailed Results of Current Simulation
Change in Payment by Provider Category
30
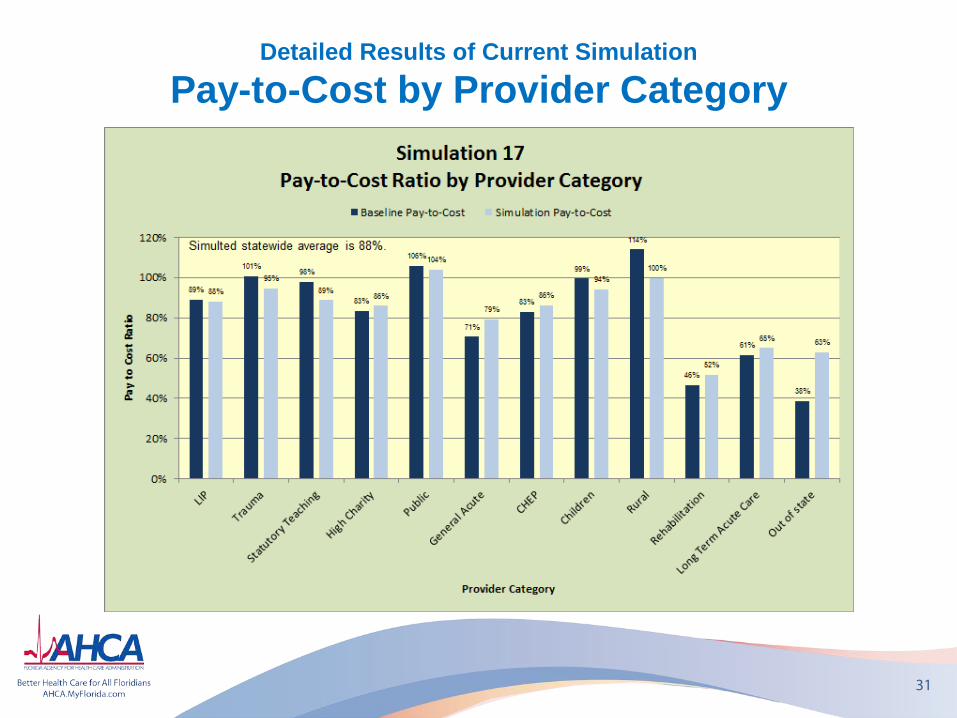
Detailed Results of Current Simulation
Pay-to-Cost by Provider Category
31
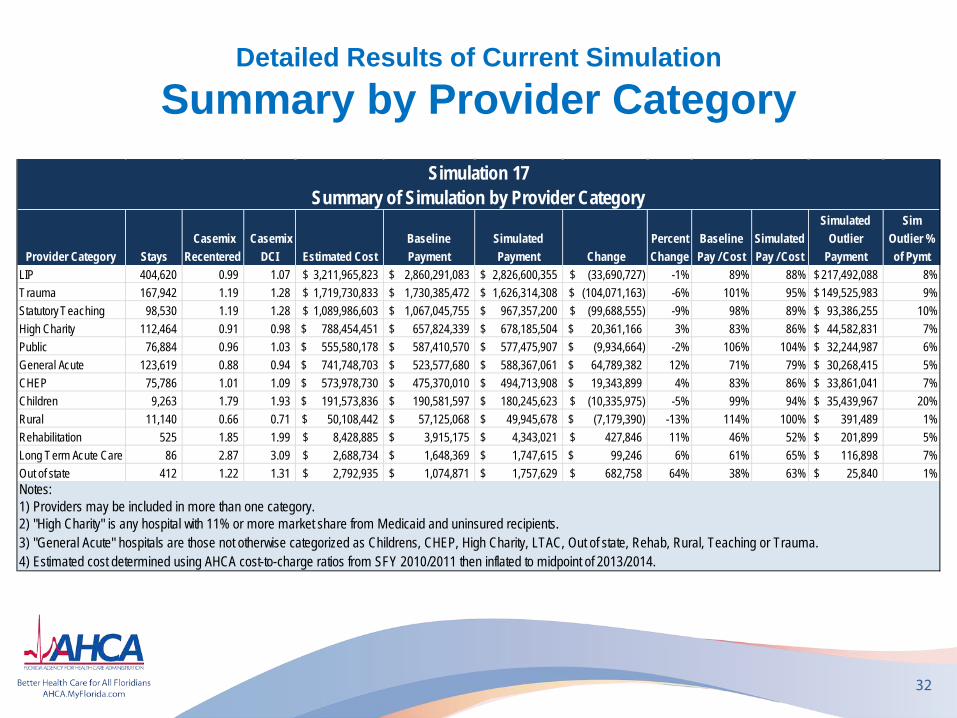
Detailed Results of Current Simulation
Summary by Provider Category
32
Provider Category Stays Casemix
Recentered Casemix
DCI Estimated CostBaseline Payment
Simulated Payment Change
Percent Change
Baseline Pay / Cost
Simulated Pay / Cost
Simulated Outlier
Payment
Sim Outlier % of Pymt
LIP 404,620 0.99 1.07 3,211,965,823$ 2,860,291,083$ 2,826,600,355$ (33,690,727)$ -1% 89% 88% 217,492,088$ 8%Trauma 167,942 1.19 1.28 1,719,730,833$ 1,730,385,472$ 1,626,314,308$ (104,071,163)$ -6% 101% 95% 149,525,983$ 9%Statutory Teaching 98,530 1.19 1.28 1,089,986,603$ 1,067,045,755$ 967,357,200$ (99,688,555)$ -9% 98% 89% 93,386,255$ 10%High Charity 112,464 0.91 0.98 788,454,451$ 657,824,339$ 678,185,504$ 20,361,166$ 3% 83% 86% 44,582,831$ 7%Public 76,884 0.96 1.03 555,580,178$ 587,410,570$ 577,475,907$ (9,934,664)$ -2% 106% 104% 32,244,987$ 6%General Acute 123,619 0.88 0.94 741,748,703$ 523,577,680$ 588,367,061$ 64,789,382$ 12% 71% 79% 30,268,415$ 5%CHEP 75,786 1.01 1.09 573,978,730$ 475,370,010$ 494,713,908$ 19,343,899$ 4% 83% 86% 33,861,041$ 7%Children 9,263 1.79 1.93 191,573,836$ 190,581,597$ 180,245,623$ (10,335,975)$ -5% 99% 94% 35,439,967$ 20%Rural 11,140 0.66 0.71 50,108,442$ 57,125,068$ 49,945,678$ (7,179,390)$ -13% 114% 100% 391,489$ 1%Rehabilitation 525 1.85 1.99 8,428,885$ 3,915,175$ 4,343,021$ 427,846$ 11% 46% 52% 201,899$ 5%Long Term Acute Care 86 2.87 3.09 2,688,734$ 1,648,369$ 1,747,615$ 99,246$ 6% 61% 65% 116,898$ 7%Out of state 412 1.22 1.31 2,792,935$ 1,074,871$ 1,757,629$ 682,758$ 64% 38% 63% 25,840$ 1%
4) Estimated cost determined using AHCA cost-to-charge ratios from SFY 2010/2011 then inflated to midpoint of 2013/2014.
Simulation 17Summary of Simulation by Provider Category
Notes:1) Providers may be included in more than one category.2) "High Charity" is any hospital with 11% or more market share from Medicaid and uninsured recipients.3) "General Acute" hospitals are those not otherwise categorized as Childrens, CHEP, High Charity, LTAC, Out of state, Rehab, Rural, Teaching or Trauma.
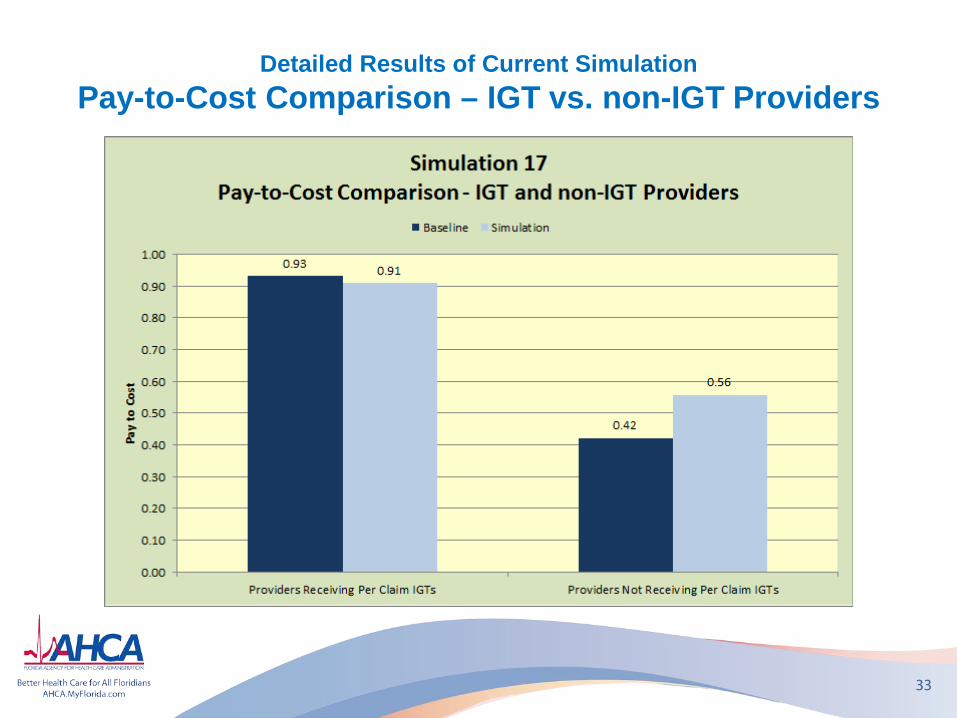
Detailed Results of Current Simulation Pay-to-Cost Comparison – IGT vs. non-IGT Providers
33
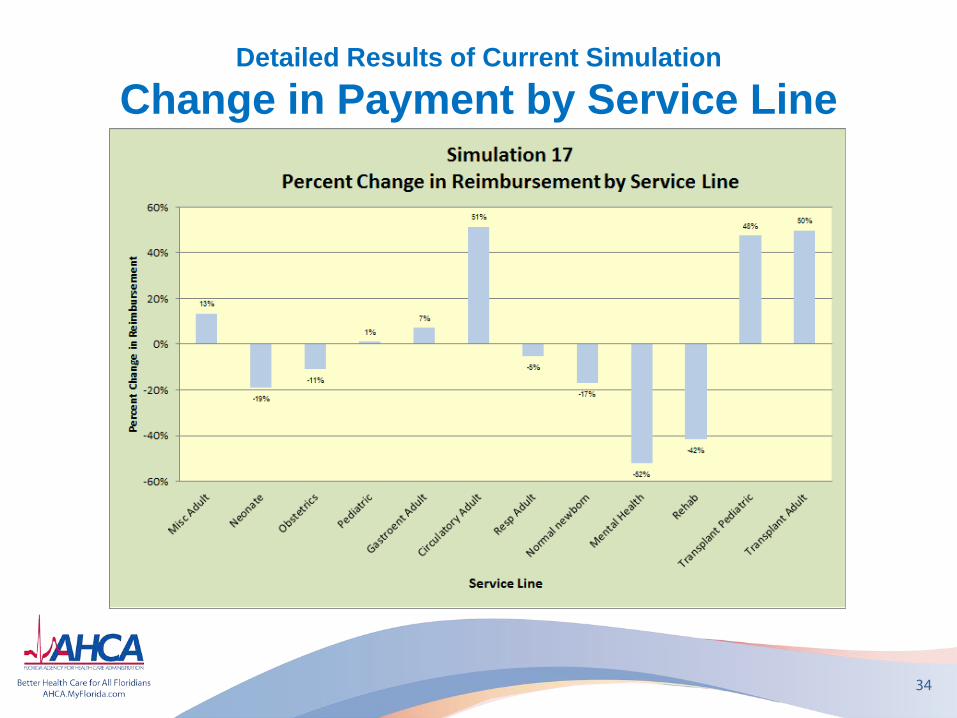
Detailed Results of Current Simulation
Change in Payment by Service Line
34
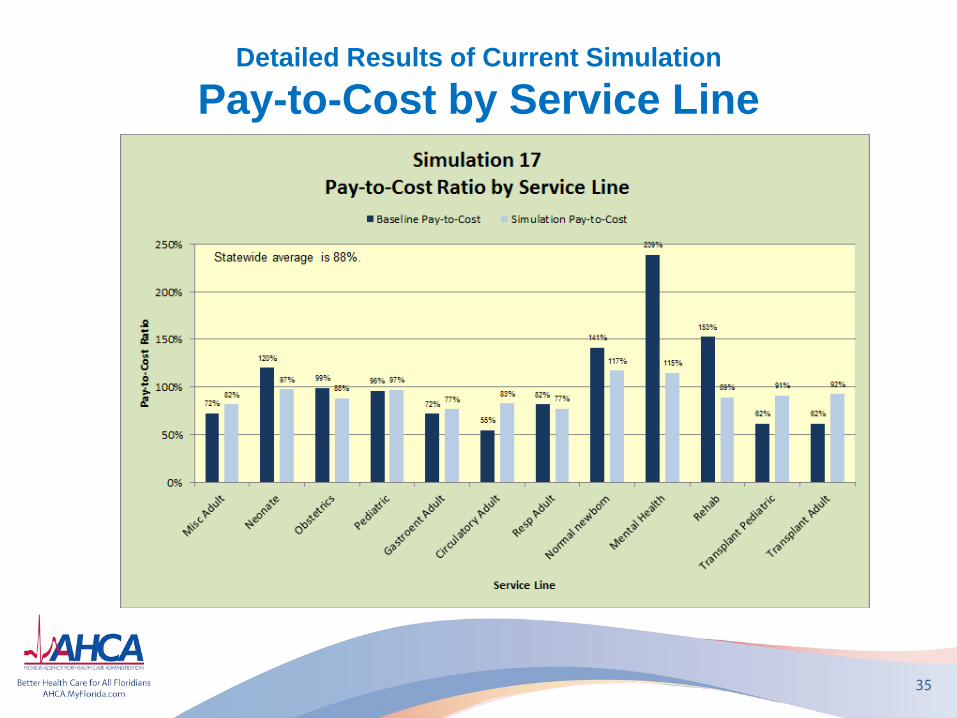
Detailed Results of Current Simulation
Pay-to-Cost by Service Line
35
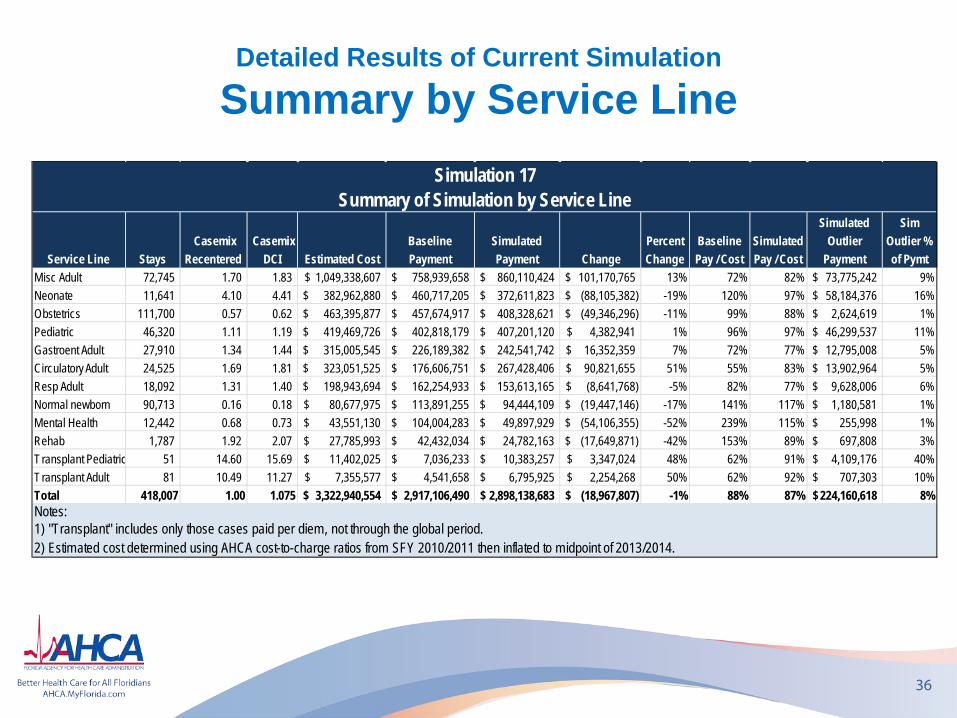
Detailed Results of Current Simulation
Summary by Service Line
36
Service Line Stays Casemix
Recentered Casemix
DCI Estimated CostBaseline Payment
Simulated Payment Change
Percent Change
Baseline Pay / Cost
Simulated Pay / Cost
Simulated Outlier
Payment
Sim Outlier % of Pymt
Misc Adult 72,745 1.70 1.83 1,049,338,607$ 758,939,658$ 860,110,424$ 101,170,765$ 13% 72% 82% 73,775,242$ 9%Neonate 11,641 4.10 4.41 382,962,880$ 460,717,205$ 372,611,823$ (88,105,382)$ -19% 120% 97% 58,184,376$ 16%Obstetrics 111,700 0.57 0.62 463,395,877$ 457,674,917$ 408,328,621$ (49,346,296)$ -11% 99% 88% 2,624,619$ 1%Pediatric 46,320 1.11 1.19 419,469,726$ 402,818,179$ 407,201,120$ 4,382,941$ 1% 96% 97% 46,299,537$ 11%Gastroent Adult 27,910 1.34 1.44 315,005,545$ 226,189,382$ 242,541,742$ 16,352,359$ 7% 72% 77% 12,795,008$ 5%Circulatory Adult 24,525 1.69 1.81 323,051,525$ 176,606,751$ 267,428,406$ 90,821,655$ 51% 55% 83% 13,902,964$ 5%Resp Adult 18,092 1.31 1.40 198,943,694$ 162,254,933$ 153,613,165$ (8,641,768)$ -5% 82% 77% 9,628,006$ 6%Normal newborn 90,713 0.16 0.18 80,677,975$ 113,891,255$ 94,444,109$ (19,447,146)$ -17% 141% 117% 1,180,581$ 1%Mental Health 12,442 0.68 0.73 43,551,130$ 104,004,283$ 49,897,929$ (54,106,355)$ -52% 239% 115% 255,998$ 1%Rehab 1,787 1.92 2.07 27,785,993$ 42,432,034$ 24,782,163$ (17,649,871)$ -42% 153% 89% 697,808$ 3%Transplant Pediatric 51 14.60 15.69 11,402,025$ 7,036,233$ 10,383,257$ 3,347,024$ 48% 62% 91% 4,109,176$ 40%Transplant Adult 81 10.49 11.27 7,355,577$ 4,541,658$ 6,795,925$ 2,254,268$ 50% 62% 92% 707,303$ 10%Total 418,007 1.00 1.075 3,322,940,554$ 2,917,106,490$ 2,898,138,683$ (18,967,807)$ -1% 88% 87% 224,160,618$ 8%
Simulation 17Summary of Simulation by Service Line
Notes:1) "Transplant" includes only those cases paid per diem, not through the global period.2) Estimated cost determined using AHCA cost-to-charge ratios from SFY 2010/2011 then inflated to midpoint of 2013/2014.
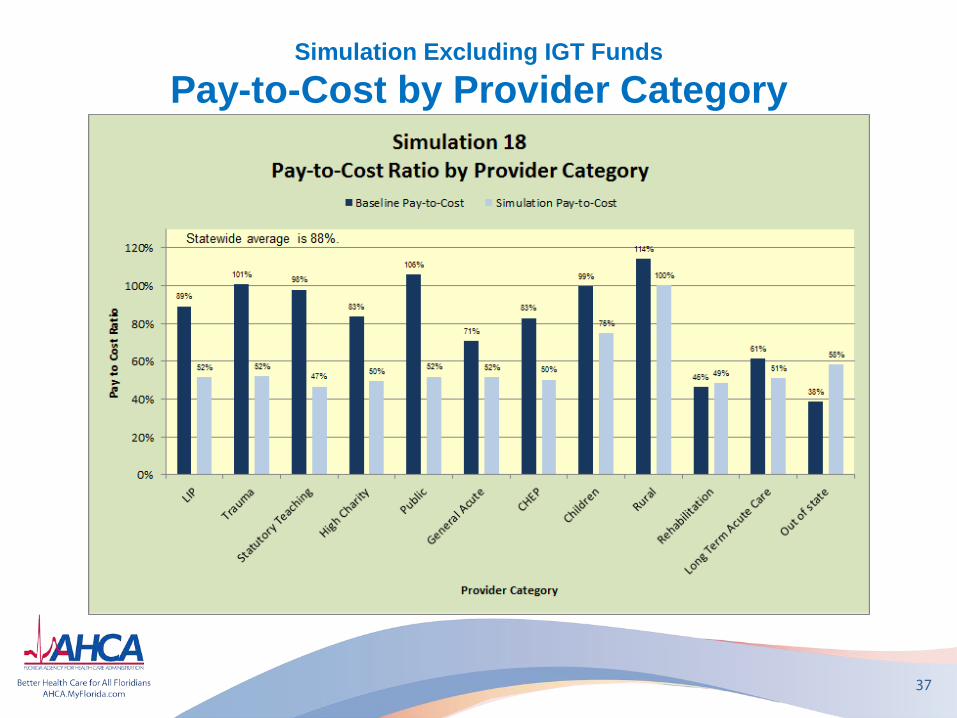
Simulation Excluding IGT Funds
Pay-to-Cost by Provider Category
37
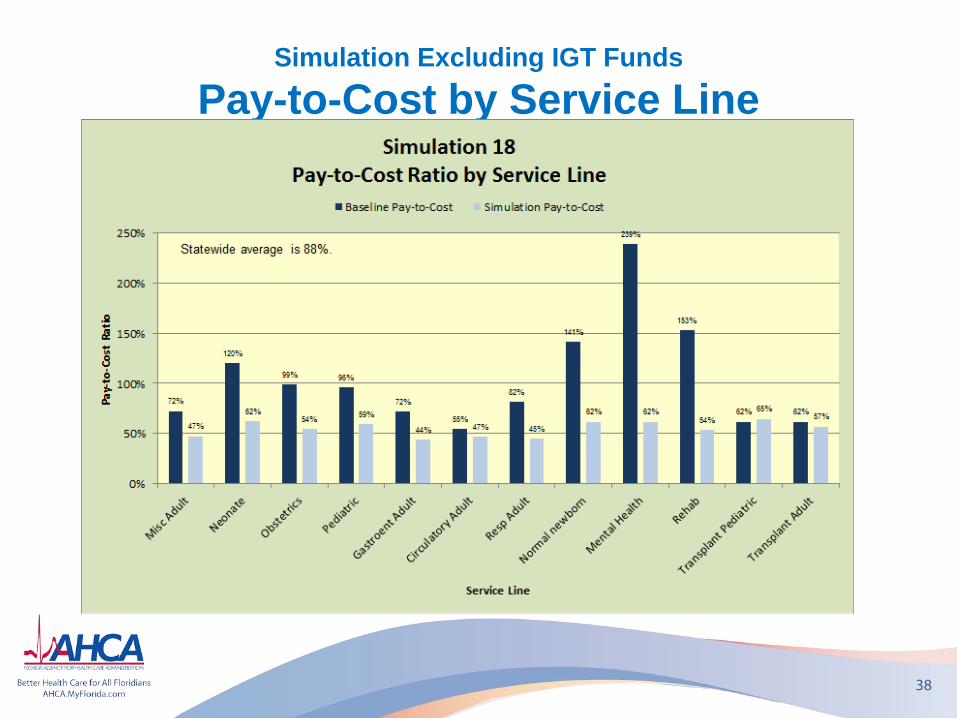
Simulation Excluding IGT Funds
Pay-to-Cost by Service Line
38
Project Summary
39
• Anticipating implementation on July 1, 2013
• New payment method gets away from cost-based reimbursement
• With this change, some hospitals will see increases in Medicaid reimbursement; others will see decreases
• Inter-Governmental Transfer (IGT) funds will be distributed as supplemental payments in addition to DRG payment

Questions?
40