Embed Size (px)
Citation preview
Florida’s Implementatio
n of NCLBJohn L. WinnDeputy CommissionerFlorida Department of Education

No Child Left Behind Act
• Accountability for Results• Flexibility and Local Control• Resources for Reform• Parental Options and
Responsibility

NCLB Act Calls For:
• Annual testing of all public school students in reading and math
• A quality teacher in every public school classroom
• Annual report cards on school performance
• Ensuring that every child reads by the 3rd grade
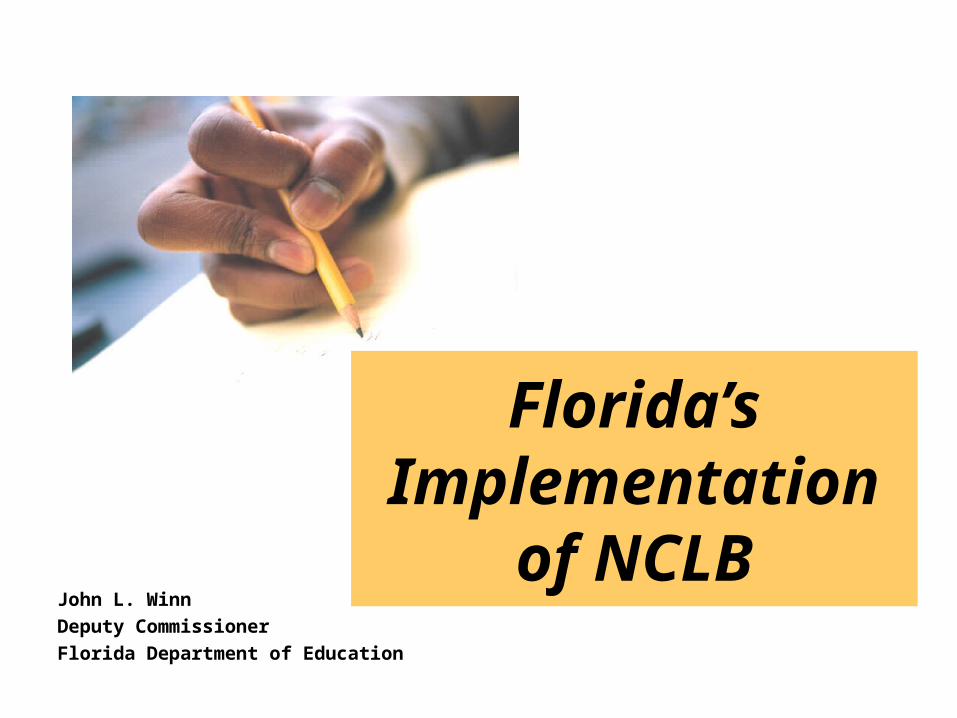
Accountability (AYP)
• Single Accountability System• All Schools Included• Continuous Growth to 100%
Proficiency• Annual Determination of Adequate
Yearly Progress (AYP• Accountability for All Subgroups

Accountability (AYP) cont.
• Primarily Based on Academics• Includes Graduation Rates and
Additional Indicator• Based on Separate Math and
Reading Objectives• 95% of Students in all Subgroups
Assessed

Safe Schools
• Criteria for Unsafe Schools• Transfer Policy for Students in
Unsafe Schools• Transfer Policy for Victims of
Violent Crime
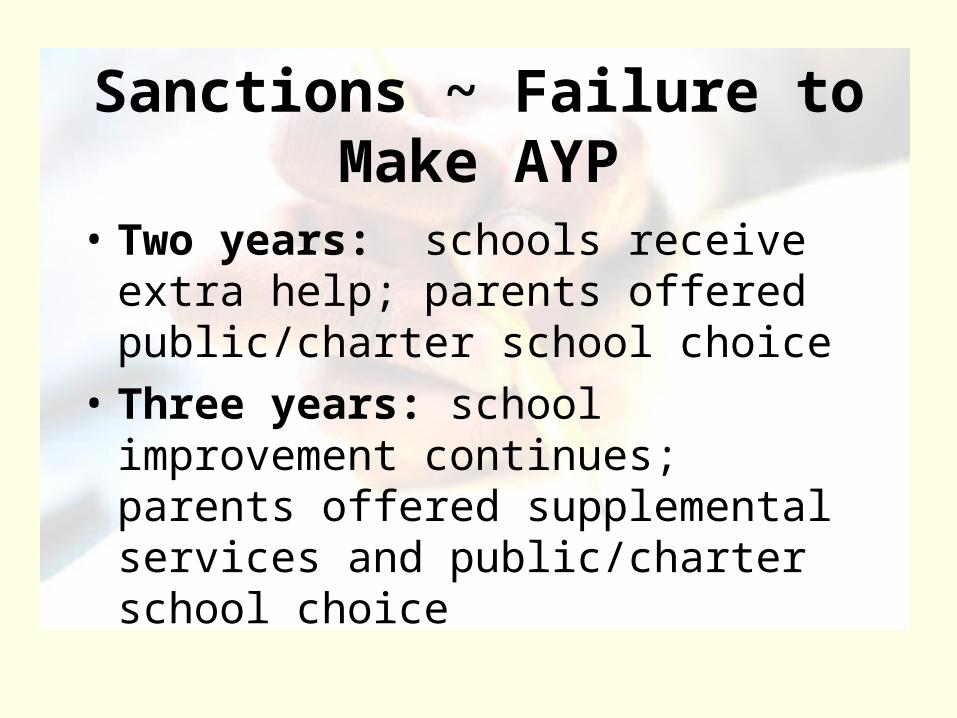
Sanctions ~ Failure to Make AYP
• Two years: schools receive extra help; parents offered public/charter school choice
• Three years: school improvement continues; parents offered supplemental services and public/charter school choice

Sanctions ~ Failure to Make AYP cont.
• Four years: school enters into corrective action; parental options continue
• Five years: school identified for restructuring; parental options continue
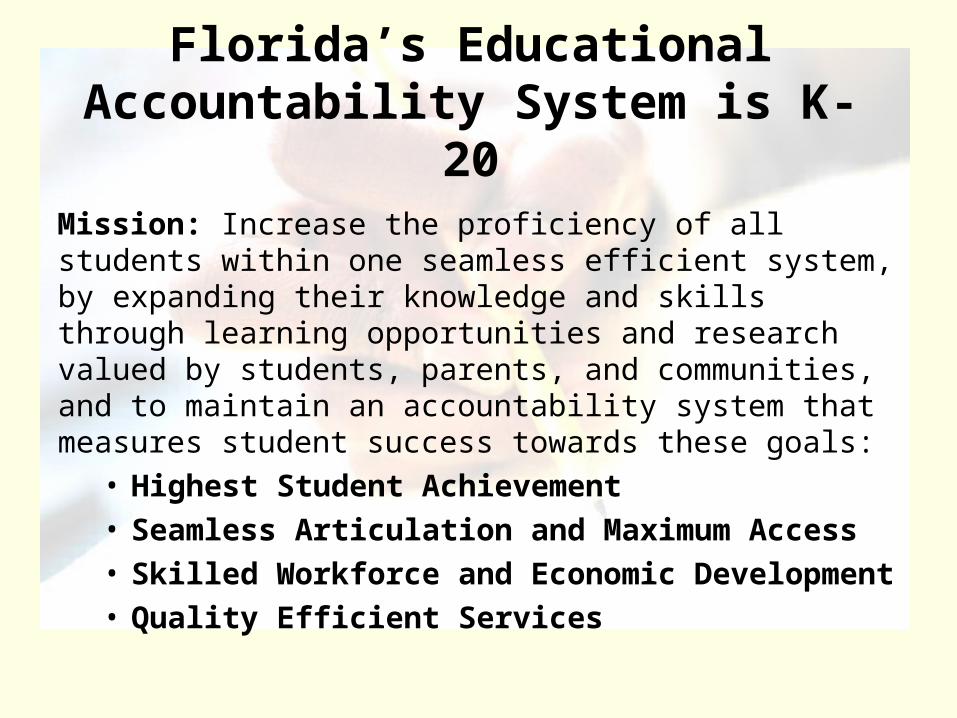
Florida’s Educational Accountability System is K-
20Mission: Increase the proficiency of all students within one seamless efficient system, by expanding their knowledge and skills through learning opportunities and research valued by students, parents, and communities, and to maintain an accountability system that measures student success towards these goals:
• Highest Student Achievement• Seamless Articulation and Maximum Access• Skilled Workforce and Economic
Development• Quality Efficient Services

Florida Currently:• Assesses all students• Reports progress on all students and
disaggregates data• Rewards high performance• Provides interventions• Provides sanctions including school
choice• Releases data before beginning of
next school year

Florida’s Accountability System Includes Many Pieces
School Grades
(1008.34)
Elimination of Social Promotion (1008.25)
Statewide Assessment Program —All students grades 3-10
(1008.22)
School Readiness Screening (1008.21)
K-20 Accountability System (1008.31)
School Recognition
(1008.36)School
Improvement (1008.345)
School Choice (1002.31 – 1002.39)
Annual Reports (1008.25)
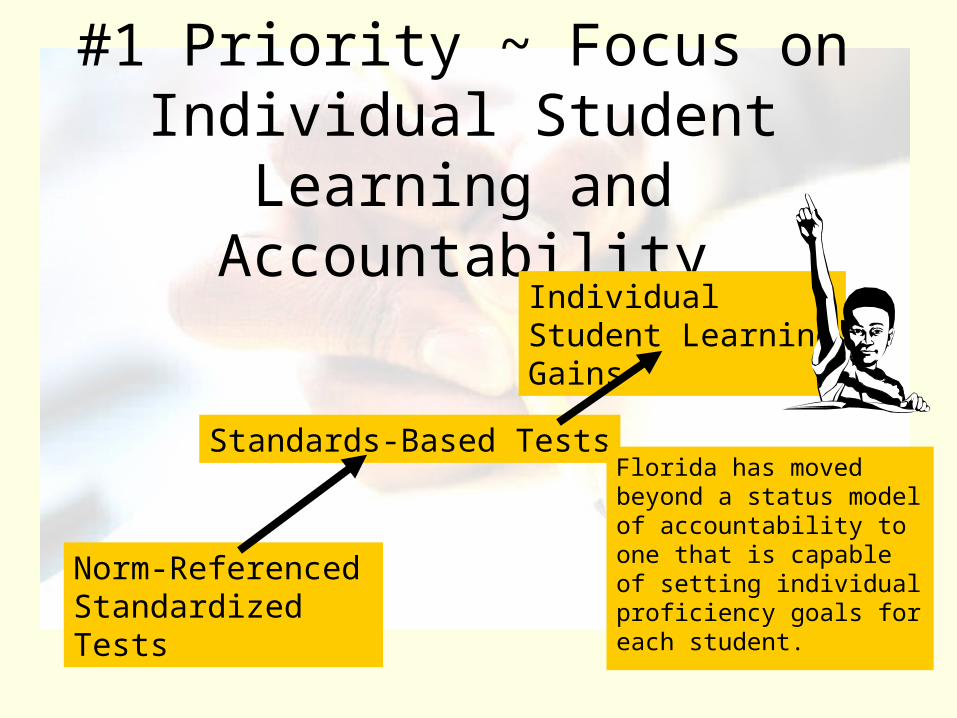
#1 Priority ~ Focus on Individual Student
Learning and Accountability
Norm-Referenced Standardized Tests
Standards-Based Tests
Individual Student Learning Gains
Florida has moved beyond a status model of accountability to one that is capable of setting individual proficiency goals for each student.

Differences Between A+
and NCLBNCLB:
“Status” Model
Student achievement within a school, district or state is measured during the current academic year and the results compared to the achievement in the following year.
A+:“Status” and
“Growth” Model
Student achievement is measured through the academic growth of individual students using a vertical score scale.

2003 “Status”
and “Growth” Model
Developmental Scale for Reading with Achievement Level Cut Points
0
500
1000
1500
2000
2500
3000
3500
3 4 5 6 7 8 9 10
Grade
Sca
le S
core
Level 1
Level 2
Level 3
Level 4
Level 5
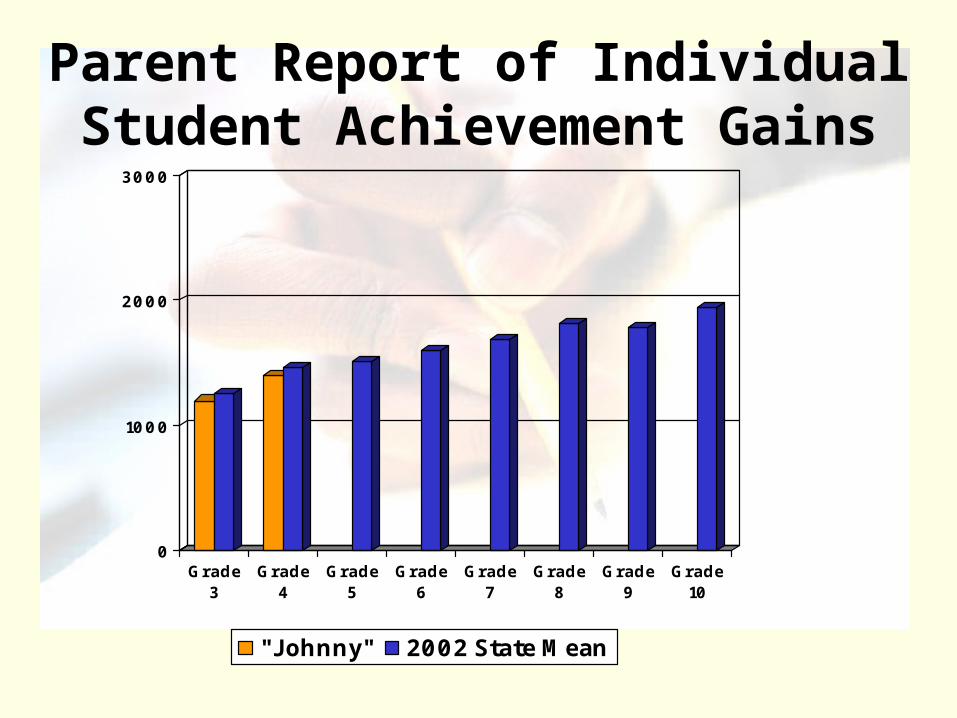
Parent Report of Individual Student Achievement Gains
0
1000
2000
3000
Grade3
Grade4
Grade5
Grade6
Grade7
Grade8
Grade9
Grade10
"Johnny" 2002 State Mean

Differences Between A+
and NCLBNCLB:Focus on
Subgroups
Special attention is paid to status measurements of subgroups—limited by population sizes at each school.
A+:Focus on Lowest Achieving 25%
Special attention is paid to students who are in the lowest 25% of students in FCAT Levels 1, 2, and 3 in each school—capturing all students in need regardless of race.
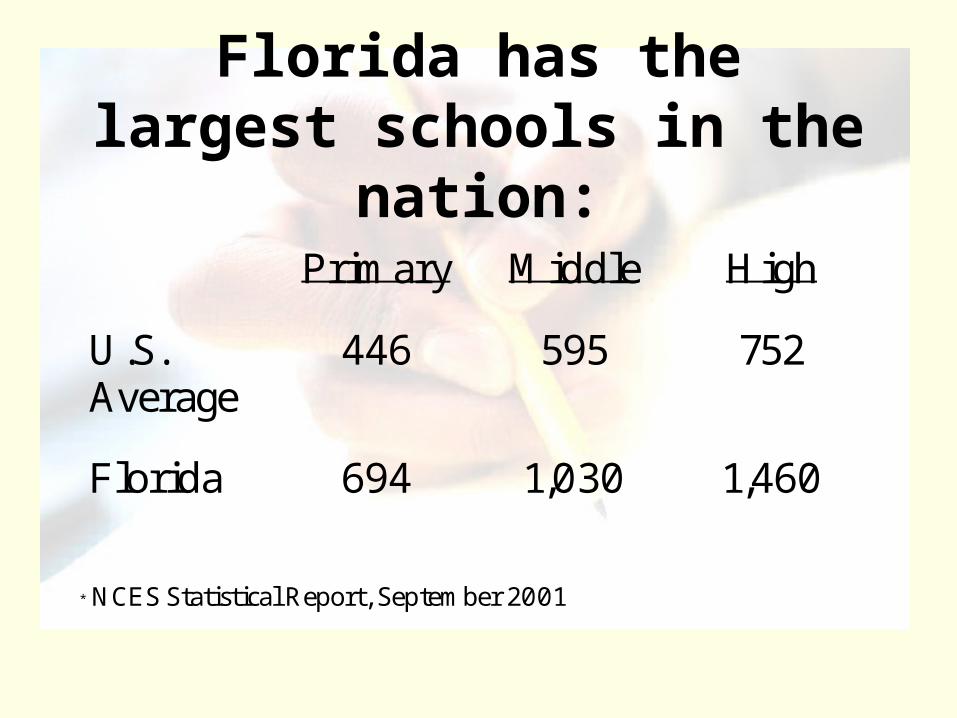
Florida has the largest schools in the nation:
Primary Middle High
U.S. Average
446 595 752
Florida 694 1,030 1,460
* NCES Statistical Report, September 2001
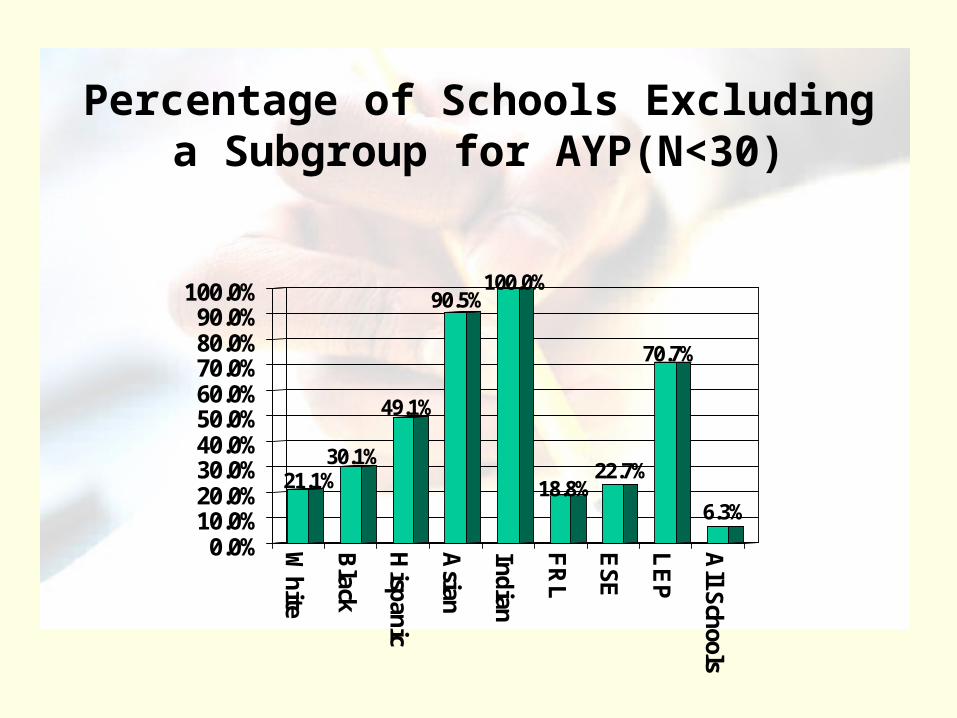
Percentage of Schools Excluding a Subgroup for AYP(N<30)
21.1%30.1%
49.1%
90.5%100.0%
18.8%22.7%
70.7%
6.3%
0.0%10.0%20.0%30.0%40.0%50.0%60.0%70.0%80.0%90.0%
100.0%
Wh
ite
Black
Hisp
anic
Asian
Indian
FR
L
ESE
LE
P
All S
chools
Holding the lowest 25% of students accountable will
hold schools more accountable for leaving no
child left behind
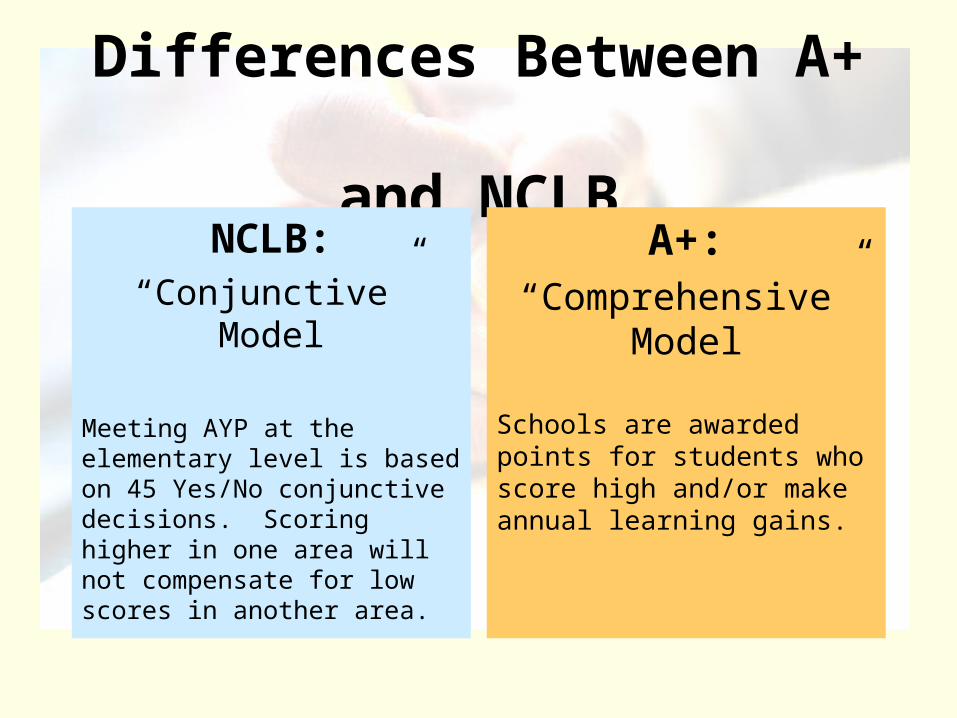
Differences Between A+
and NCLBNCLB:
“Conjunctive” Model
Meeting AYP at the elementary level is based on 45 Yes/No conjunctive decisions. Scoring higher in one area will not compensate for low scores in another area.
A+:“Comprehensive”
Model
Schools are awarded points for students who score high and/or make annual learning gains.

Example Report 2002
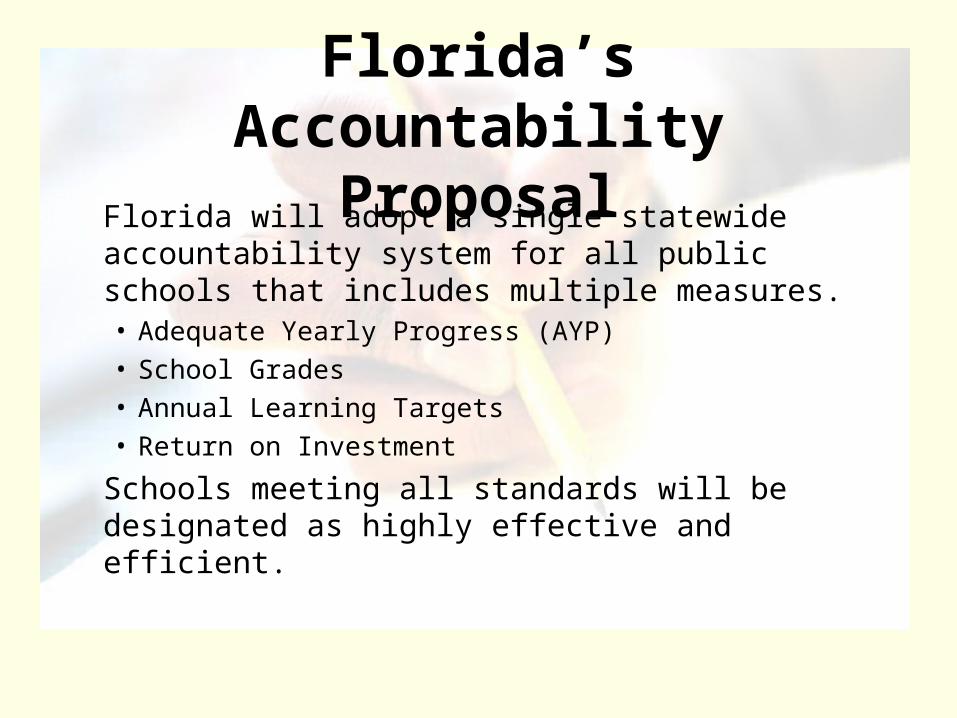
Florida’s Accountability Proposal
Florida will adopt a single statewide accountability system for all public schools that includes multiple measures. • Adequate Yearly Progress (AYP)• School Grades• Annual Learning Targets• Return on Investment
Schools meeting all standards will be designated as highly effective and efficient.
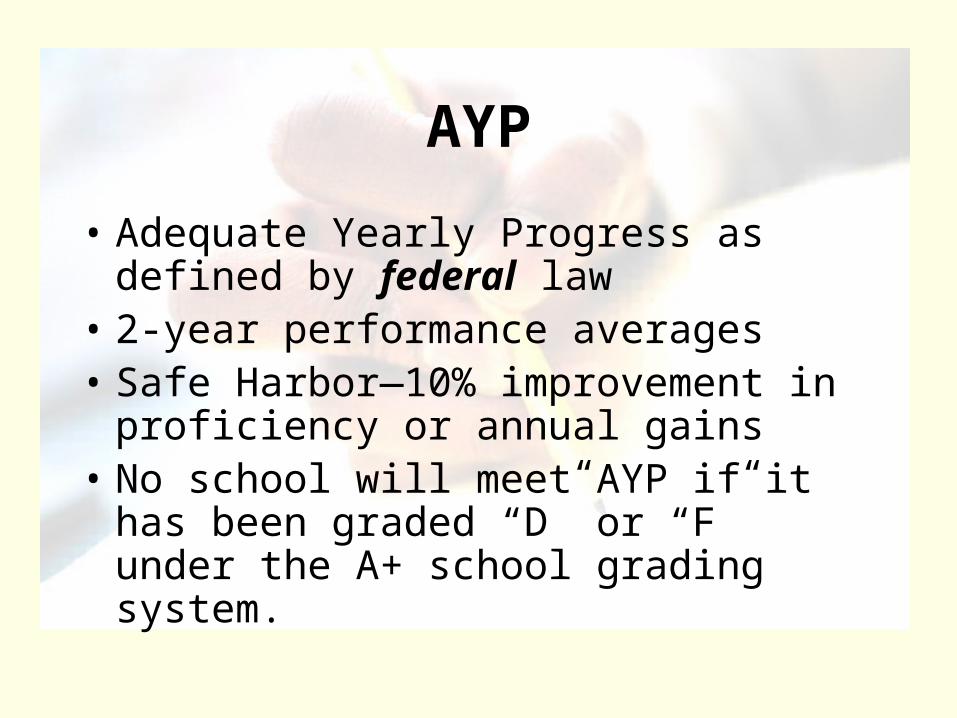
AYP
• Adequate Yearly Progress as defined by federal law
• 2-year performance averages• Safe Harbor—10% improvement in
proficiency or annual gains• No school will meet AYP if it has
been graded “D” or “F” under the A+ school grading system.

Annual Progress Objectives
Starting Point and Annual Objectives forReading, 2001-02 - 2013-04
0
20
40
60
80
100
120
1 2 3 4 5 6 7 8 9 10 11 12 13
Years
% P
rofi
cie
nt
or
Ab
ov
e

Annual Progress Objectives
Starting Point and Annual Objectives forMathematics, 2001-02 - 2013-04
0
20
40
60
80
100
120
1 2 3 4 5 6 7 8 9 10 11 12 13
Years
% P
rofi
cie
nt
or
Ab
ov
e
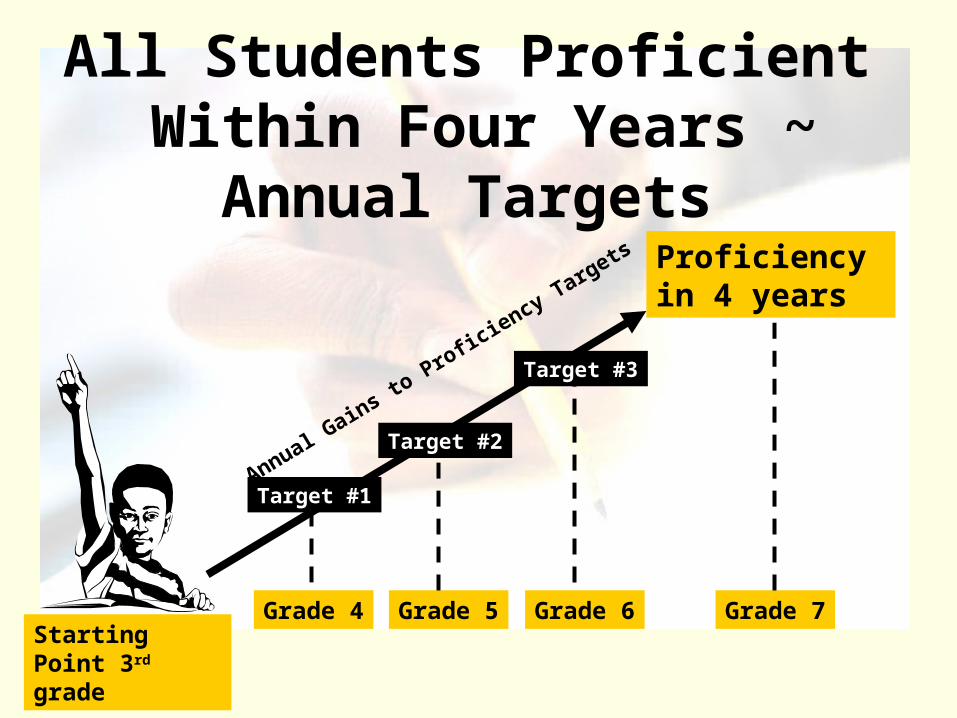
All Students Proficient Within Four Years ~
Annual Targets
Starting Point 3rd grade
Proficiency in 4 years
Grade 4 Grade 6Grade 5 Grade 7
Target #1
Target #3
Target #2Annual G
ains to Pro
ficiency
Targets

Return on Investment
• A comprehensive system for calculating “return on investment” based on indicators of institutional efficiency and effectiveness is under development.
• Strongly supports state goal “Quality Efficient Services” and measures “cost per graduate” and “cost disparity across institutions”
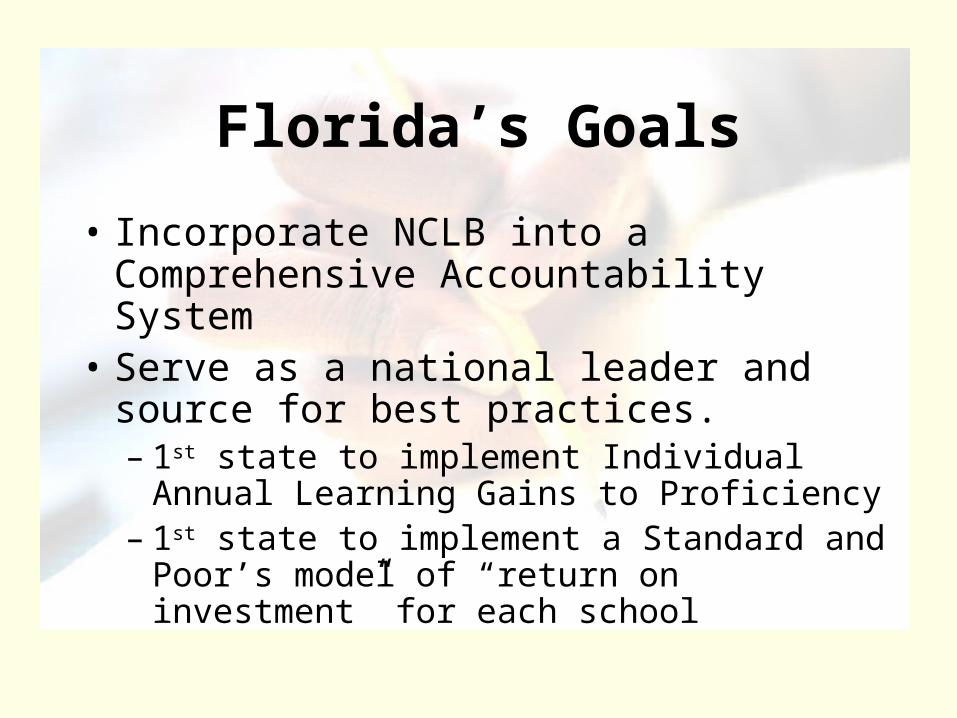
Florida’s Goals
• Incorporate NCLB into a Comprehensive Accountability System
• Serve as a national leader and source for best practices.– 1st state to implement Individual Annual
Learning Gains to Proficiency– 1st state to implement a Standard and
Poor’s model of “return on investment” for each school