Embed Size (px)
Citation preview
Flow cytometry on disaggregated tissues: Detecting cancer stem cell candidates in
epithelial tumorsAlbert D. Donnenberg and Vera S. Donnenberg. University of Pittsburgh, Pittsburgh PA.
This tutorial will review the cancer stem cell controversy: Does it make sense to think of clonogenic self‐replicating tumor cells as stem cells? Do clonogenic self‐replicating tumor cells have unique phenotypic markers that distinguish them from nontumorigenic tumor‐derived cells? Do clonogenic self‐replicating tumor cells share other tissue stem cell characteristics, such as the ability to persist in a dormant state and resist cytotoxic drugs and radiation? Must a cell be rare or multipotent to be considered a stem cell? What is the difference between a stem cell and a progenitor cell and does it matter when discussing cancer? What markers have been used to detect stem cells in normal and malignant epithelial tissues and do they define unique populations? This discussion will be accompanied by a technical tutorial in which we will provide practical suggestions for disaggregation of tumors and normal tissues into single cell suspensions. We will focus on avoiding some of the technical pitfalls encountered when performing multi‐color flow cytometry on disaggregated tissues. Specifically, these include recognizing sources of bias in cell recovery, use of doublet discrimination, use of DAPI to detect and remove hypodiploid events, coping with autofluorescence, and optimal use of dump gates.

Does it make sense to think of clonogenic self‐replicating epithelial tumor cells as stem cells?
• Like normal tissues, tumors are heterogeneous with respect to stromal cells, vascular cells, infiltrating immune cells and the epithelial cells themselves
• Depending on tumor grade, many of the tumor cells may be non‐clonogenic progeny of clonogenic cells
• Clonogenicity and self‐replication are primary attributes that we associate with normal stem cell behavior
• The thought that in some cases, tumors may derive from mutated adult tissue stem cells (chronic myelogenous leukemia), even embryonic stem cells (developmental tumors) or germ cells is an additional link between clonogenic tumor cells and stem cells.
• Caveat: A tumor cell does not have to derive from a mutated stem cell to acquire stem cell attributes. Mutation and epigenetic reprogramming can produce any phenotype that offers selective advantage to the cancer cell.

Do clonogenic self‐replicating tumor cells have unique phenotypic markers that distinguish them from nonclonogenic tumor‐derived cells?
• The answer has two parts:
• First, the majority of cells within a tumor are often not tumor cells per se. They are stromal cells, immune cells, reactive cells, vascular cells, normal and dysplastic epithelial cells. These cells are clearly non‐tumorigenic. With the exception of normal and dysplastic epithelial cells within the tumor mass, they are easily distinguished from clonogenic tumor cells and can be eliminated in experimental preparations by cell sorting if necessary.
• Second, Yes. A variety of markers have been proposed which enrich clonogenic tumor cells in an experimental preparation. The caveat is that any marker that depletes the cells described above will “enrich” for clonogenicity. Correctly designed experiments divide the epithelial component of the tumor into those positive and negative for the marker of interest. CD44, CD133, CD90, CD117, CD34, CD49, aldehyde dehydrogenase activity and MDR activity (side population) have all been proposed to identify (sometimes exclusively) the clonogenic, self‐renewing tumor cell. Caveat Emptor!
Do clonogenic self‐replicating tumor cells share other tissue stem cell characteristics, such as the ability to persist in a dormant state and resist cytotoxic drugs and radiation?
• The principal distinctions between stem and progenitor cells is that the former retain the ability to self‐renew throughout the life of the organism, and characteristically persist in a dormant state. Dormancy means either out of cell‐cycle, or balanced with respect to proliferation and death or differentiation. Dormancy is a characteristic of tumors which may persist in a subclinical state after therapy and reactivate at a later time.
• Normal tissue stem cells, and a subset of epithelial tumor cells share a battery of protective mechanisms. In normal stem cells, the expression of multiple drug resistance transporters, detoxifying pathways, and other protective mechanisms is inducible. At any given time some stem cells are positive and some negative, and negative cells can give rise to positive cells and vice versa. These mechanisms contribute to the stability of the normal stem cell pool. Caveat: None of these mechanisms are unique to stem cells. SP+, ALDH+ and GSH+ cells serve important functions in differentiated tissues too.
• Cancer is dysregulation and the mechanisms which protect stem cells against toxic injury are hijacked to protect tumor as well.
Must a cell be multipotent or rare to be considered a stem cell?
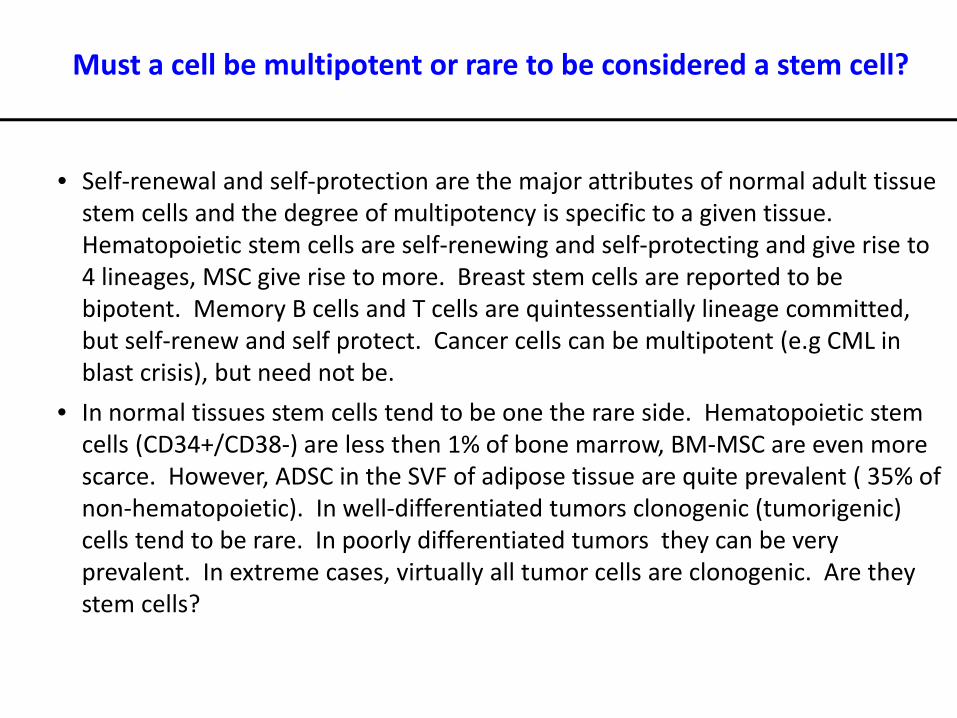
• Self‐renewal and self‐protection are the major attributes of normal adult tissue stem cells and the degree of multipotency is specific to a given tissue. Hematopoietic stem cells are self‐renewing and self‐protecting and give rise to 4 lineages, MSC give rise to more. Breast stem cells are reported to be bipotent. Memory B cells and T cells are quintessentially lineage committed, but self‐renew and self protect. Cancer cells can be multipotent (e.g CML in blast crisis), but need not be.
• In normal tissues stem cells tend to be one the rare side. Hematopoietic stem cells (CD34+/CD38‐) are less then 1% of bone marrow, BM‐MSC are even more scarce. However, ADSC in the SVF of adipose tissue are quite prevalent ( 35% of non‐hematopoietic). In well‐differentiated tumors clonogenic (tumorigenic) cells tend to be rare. In poorly differentiated tumors they can be very prevalent. In extreme cases, virtually all tumor cells are clonogenic. Are they stem cells?

What is the difference between a stem cell and a progenitor cell and does it matter when discussing cancer?
Adult Stem Cells Progenitor Cells
Stationary (niche) Transiting
Resting Proliferating
Self renewing Limited self renewal
Some are protected (MDR, ALDH, GSH)
Limited protection
More rare More prevalent
Relatively undifferentiated Some lineage commitment
• In cancers the distinction is blurred, and sometimes obscured altogether. In high grade malignancies, self‐renewal, self‐protection, high proliferative capacity and mobility are all present in the same stem/progenitor cell.
What markers have been used to detect stem cells in normal and malignant epithelial tissues and do they define unique populations?
• In breast, lung, and esophageal cancers we have experience with CD44, CD117, CD90, CD133, ABCG2 and ABCB1 used in conjunction with epithelial differentiation antigens cytokeratin, EpCAM, E‐Cadherin, MUC‐1.
• With the exception of metastatic pleural effusions, it is usually not possible to distinguish normal and malignant tissue on the basis of prevalence of these markers.
• There is a suggestion that discordant expression of these markers may uniquely identify clonogenic tumor cells.

Technical Aspects
Technical pitfalls encountered when performing multi‐color flow cytometry on disaggregated tissues:
• Collection of viable tissue• Mechanics of tissue digestion• Sources of bias in cell recovery• Use of doublet discrimination• Use of DAPI to detect and remove hypodiploid events • Coping with autofluorescence• Optimal use of dump gates
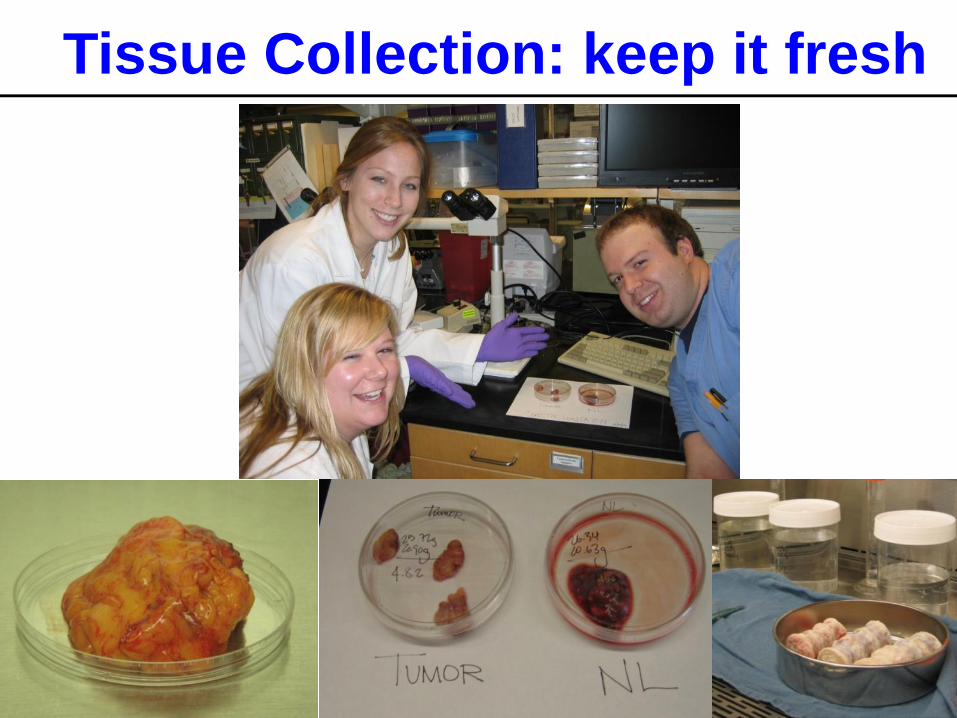
Tissue Collection: keep it fresh

Tissue Collection
• Weigh tissues for yield calculations
• Reserve tissue for paraffin and frozen sections
• Maintain sterility. Can dip nonsterile tissues in bleach and rinse in sterile PBS (esophagus, vertebral bodies, foreskin)

Immunohistochemical Detection of Antigens in Solid Tissues
Understanding histologic location of markers aids in interpretation of antigen localizationAllows extrapolation from normal to abnormal (tumor)One antigen/section (no co‐expression), fixed tissue
Donnenberg et al, Clinical Cytometry 2010

• Simultaneously detect multiple parameters on rare cells without pre‐enrichment
• Understand heterogeneity of tumor and normal tissue
• Identify and sort tumorigenic/clonogenic cells
• Quantify metastatic tumorigenic cells
• Determine whether tumorigenic cells circulate
• Isolate and purify these cells for further studies
Why to do flow cytometry on solid tissues?

Tissue Digestion
Collagenase DNAse digestion
Mince tissue
1 hour
100 mesh screen
1 hour
Collagenase DNAse digestion
Ficoll ‐Hypaque gradient
Stain surface markers for
Flow Cytometry©VSD 2006 Collagenase
DNAse digestion
Mince tissue
1 hour
100 mesh screen
1 hour
Collagenase DNAse digestion
Ficoll ‐Hypaque gradient
©VSD 2006
Use enzymatic and mechanical disaggregation; include DNAse with collagenases
Examine microscopically: Count cells, check viability by trypan blue exclusion, check for undigested cell clumps
Donnenberg et al. International Drug Discovery 2009Zimmerlin L, et al Methods in Molecular Biology: Flow Cytometry Protocols. 2010 In press

Cell recoveries from Fat, NB, BrCA, NL, NSCLCa
Tissue Cells/Gram Viability
Normal Breast 8.89 ± 1.67 x 10⁵ 71.3 ± 0.6%
AdenoCa Breast 72.0 ± 28.6 x 10⁵ 66.2 ± 6.3%
Normal Lung 32.9 ± 4.57 x 10⁵ 62.8 ± 15%
NSC Ca Lung 226 ± 60.3 x 10⁵ 72.8 ± 3.2%
Whole Adipose 2.98 ± 0.87 x 10⁵ 57.6 ± 6.8%

Multiparameter Staining
9‐10 color flow cytometry (3‐laser CyAn and Gallios cytometers):
Surface markers: EpCAM/HEA, CD44, CD90, CD133, CD117
Lineage (hematopoietic): CD14, CD33, Glycophorin, CD45, CD31
Intracellular markers: Cytokeratinnuclear stain – DAPItranscription factors
DAPI: (200ug/ml: 8ul of stock to 5million cells in 200uL: [8ug/mL])
This dataset: 13‐16 parameters

Multiparameter Staining Design
Remove Sources of ArtifactDoublets :FS pulse height vs FS areaDNA content cell debris/apoptotic cells <2N DNA (nuclear stain – DAPI, log scale)Clean denominator “healthy cell scatter of all populations”
Classifiers: Known expression identifies populations of interestCD45, CD31 and hematopoietic lineage CD14, CD33, GlyAintracellular cytokeratin, extracellular HEA/EpCAM/CD326
Outcomes: Measurement made on populations of interestKnow something about them but may not know their exact level of
expression (isotype controls): Cytokeratin, DNA content (linear), CD44, CD90
Unknown profile: morphology FS , SSC, DNA content, CD133, CD117, transcription factors and their localization

Efficient Flow Cytometric Staining
Remove and discard supernatant
Block NSB by adding 5uL of neat mouse serum
Incubate 5 minutes, spin down and remove residual liquid
Centrifuge cell suspension down to a pellet
Add MAB 2uL/antibody, dimmest and lowest abundance epitope add first
Incubate 15 minutes, add buffer 100uL/condition and split
BULK staining: antibodies common to all tubes
OUTCOME staining: antibodies unique to each tube
Cell suspension to be stained 15mL conical
FMO

Elimination of sources of artifactRemove doublets, hypodiploid cells and cell debris, autofluorescent/NSB events
Classifiers Identify population(s) of interest (known marker expression profile)
OutcomesMeasurements made on populations of interest
Data Analysis“We must learn to love complexity”
George Klein, Karolinska Institute

NB00240x
Case Studies: NB002
25um

Case Studies: NB002
0 25 50 65.54(x 1,000)
0
250
500
FS
60.2%
Puls
e W
idth
010 110 210 310 410
0
25
50
65.54(x 1,000)
DAPI Log
Gate Singlets
B: 36.02%
FS010 110 210 310 410
10 0
10 1
10 2
10 3
10 4
CD45 APC-Cy7
Gate A&B
41.8%Ly 7.6%
CD
14-3
3-G
lyA
PE-C
y7
Artifact Removal

Case Studies: NB002
Lymphocyte Gate
0 25 50 65.54(x 1,000)
0
100
200
300
396
DAPI Lin0 25 50 65.54
(x 1,000)
10 0
10 1
10 2
10 3
10 4
FS
SS

Case Studies: NB002
Artifact: Gated on Doublets/Clusters
010 110 210 310 410
0
25
50
65.54(x 1,000)
DAPI Log
FSDoublets
6.6%
010 110 210 310 410
10 0
10 1
10 2
10 3
10 4
CD45 APC-Cy7
27.8%
CD
14-3
3-G
lyA
PE-C
y7
0 25 50 65.54(x 1,000)
0
25
50
75
100
DAPI Lin
Heme Lineage Negative
010 110 210 310 410
10 0
10 1
10 2
10 3
10 4
iCYTOK FITC
SS
1.4%
010 110 210 310 410
10 0
10 1
10 2
10 3
10 4
CD44 PEC
D90
bs E
CD
CTK+Lin- Doublets
57.4% 17.6%
8.1% 16.9%
In this example 93% of clusters are low FSc and hypodiploid

Case Studies: NB002
010 110 210 310 410
10 0
10 1
10 2
10 3
10 4
CD45 APC-Cy7
57.1%
CD
14-3
3-G
lyA
PE-C
y7
010 110 210 310 410
10 0
10 1
10 2
10 3
10 4
iCYTOK FITCSS
0.3%
010 110 210 310 410
10 0
10 1
10 2
10 3
10 4
CD44 PECD
90bs
EC
D
59.0% 24.6%
1.2% 15.3%
0 25 50 65.54(x 1,000)
0
2
4
6
8
10
12
DAPI Lin
Hypodiploid Cells/Debris
These events have little or no DNA but appear to bind antibody

Case Studies: NB002
0 25 50 65.54(x 1,000)
10 0
10 1
10 2
10 3
10 4
FS
SS
010 110 210 310 410
10 0
10 1
10 2
10 3
10 4
iCYTOK FITC
SS
1.9%
010 110 210 310 410
10 0
10 1
10 2
10 3
10 4
CD44 PE
SS
48.8%
0 25 50 65.54(x 1,000)
0
10
20
30
40
DAPI Lin
E
010 110 210 310 410
10 0
10 1
10 2
10 3
10 4
CD44 PE
E
86.6% 7.6%
3.6% 2.2%
CD
90bs
EC
D
010 110 210 310 410
10 0
10 1
10 2
10 3
10 4
CD133 APC
E
0.1%
40.0%
5.0%
CD
90bs
EC
D
25um
Primary Classifier: Clean Heme Lineage Negative

Case Studies: Adipose stromal vascular fraction
0 25 50 65.54(x 1,000)
0
250
500
FS Lin - FSP
ulse
Wid
th
A: 96.66%
010
110
210
310
410
100
101
102
103
104
Violet 2
SS
singlets
C: 78.90%0 25 50 65.54
(x 1,000)
100
101
102
103
104
FS Lin - FS
SS
AC
B: 89.19%
010 110 210 310 410100
101
102
103
104
CD146 PE
CD
3FI
TC
ABCG: 30.40%
010 110 210 310 410100
101
102
103
104
CD34 ECD
CD
3FI
TC
ABCH: 12.48%
010 110 210 310 410100
101
102
103
104
CD34 ECD
CD
146
PE
ABCI: 15.30%
010 110 210 310 410100
101
102
103
104
CD146 PE
CD
3F I
T C
ABC not autofluo
010 110 210 310 410100
101
102
103
104
CD34 ECD
CD
3F I
T C
ABC not autofluo
010 110 210 310 410100
101
102
103
104
CD34 ECD
CD
146
PE
ABC not autofluo
010 110 210 310 4100
250
500
750
941
CD90 PE-Cy5
ABC
D: 17.17%
010 110 210 310 4100
250
500
750
1000
1250
CD117 PE-Cy7
ABC
E: 0.40%010 110 210 310 410
0
2
3.75(x 1,000)
CD31 APC
ABC
F: 3.10%
010 110 210 310 4100
250
500
750
1000
1233
CD45 APC-Cy7
ABC
010 110 210 310 4100
250
500
750
941
CD90 PE-Cy5
ABC not too bright
010 110 210 310 4100
100
200
300
400
CD117 PE-Cy7
ABC not too bright
010 110 210 310 4100
100
200
300
400
CD31 APC
ABC not too bright
010 110 210 310 4100
250
500
CD45 APC-Cy7
ABC not too bright
Selection of singlets, nucleated cells, elimination of debris
3 first channels autofluorescence
Remaining channelsArtifacts and off scale (too bright) events
fatSC04‐12‐07
010 110 210 310 410100
101
102
103
104
CD146 PE
CD
3FI
TC
non heme
010 110 210 310 410100
101
102
103
104
CD34 ECD
CD
3FI
TC
non heme
010 110 210 310 410100
101
102
103
104
CD34 ECD
CD
146
PE
non heme
010 110 210 310 410100
101
102
103
104
CD146 PE
CD
3F
I TC
non heme without dump
010 110 210 310 410100
101
102
103
104
CD34 ECD
CD
3F
I TC
non heme without dump
010 110 210 310 410100
101
102
103
104
CD34 ECD
CD
146
PE
non heme without dump
010 110 210 310 410100
101
102
103
104
CD34 ECD
CD
31AP
C
non heme
AE3:2.49% AE4:65.20%
AE1:2.55% AE2:29.77%
010 110 210 310 410100
101
102
103
104
CD34 ECD
CD
31AP
C
non heme w tooB
010
110
210
310
410
100
101
102
103
104
CD45 APC-Cy7
CD
3FI
TC
cleanABCnot Autofluo
J: 4.63%
K: 68.44%
AD: 18.84%
AJ: 76.43%
010 110 210 310 410100
101
102
103
104
CD146 PE
CD
90PE
-Cy5
non heme
AK3:5.95% AK4:1.65%
AK1:91.28% AK2:1.12%
010 110 210 310 410100
101
102
103
104
CD146 PE
CD
90PE
- Cy5
non heme w tooB
AN3:5.01% AN4:1.39%
AN1:92.47% AN2:1.13%
Selection of non hematopoietic cells, FITC dump gate
010 110 210 310 410100
101
102
103
104
CD45 APC-Cy7
CD1
17PE
-Cy7
cleanABCnot Autofluo
AO3:74.75% AO4:23.04%
AO1:0.06% AO2:2.14%
010 110 210 310 410100
101
102
103
104
CD45 APC-Cy7
CD
117
PE-C
y7
ABC not autofluo
AP3:64.49% AP4:18.03%
AP1:10.39% AP2:7.08%

EndothelialMature
CD31+ CD34-CD45-
EndothelialProgenitor
CD31+ CD34+CD45-
Supra Adventitial
ASCCD31- CD34+
CD146-CD45-
PericyteCD31- CD146+
CD45-
SA
FS Lin
SS
100
101
102
103
104
0 25 50 65.54(x 1,000)
FS Lin
SS
100
101
102
103
104
0 25 50 65.54(x 1,000)
Pe
FS Lin
SS100
101
102
103
104
0 25 50 65.54(x 1,000)
EPFS Lin
SS
100
101
102
103
104
0 25 50 65.54(x 1,000)
EMC
D14
6 PE
CD90 PE-Cy5100 101 102 103 104100
101
102
103
104
52.1% 18.5%
15.6% 13.7%EM
CD
146
PE
CD90 PE-Cy5
EP
100 101 102 103 104100
101
102
103
104
0.2% 94.2%
0.4% 5.2%
Pe
CD
34
ECD
CD90 PE-Cy540.9% 42.5%
0.0% 16.6%
100 101 102 103 104100
101
102
103
104
SA
CD
117
PE-
Cy7
CD90 PE-Cy50.6% 99.4%
0.0% 0.0%
100 101 102 103 104100
101
102
103
104
CD146 PE
CD
3 FI
TC
A+B+CD:
8.8%
100 101 102 103 104100
101
102
103
104
CD34 ECD
CD
3FI
TC
A+B+CE: 13.2%
100 101 102 103 104100
101
102
103
104
CD34 ECD
CD
146
PE
A+B+CF: 14.4%
100 101 102 103 104100
101
102
103
104
Artifact removalA
B: 50.5%100 101 102 103 104100
101
102
103
104
DAPI
SS
0 25 50 65.54(x 1,000)
0
250
500
FS Lin
Pul
se
Wid
th
A: 94.3%
FS Lin
SS
100
101
102
103
104
0 25 50 65.54(x 1,000)
A+B
C: 87.6%
Classification of cell populations
CD45APC-Cy7
CD
3 FI
TC
A+B+C – (D+E+F)NH: 76.5%
Ly
100 101 102 103 104100
101
102
103
104
H: 20.0%
CD34 ECD
CD
31 A
PC
NHEM:1.5%
EP: 16.8%
100 101 102 103 104100
101
102
103
104
NE: 80.5%
CD34 ECD
NEPe: 4.0%
CD
146
PE100 101 102 103 104
100
101
102
103
104
SA: 35.3%

Using “SP” to Identify and Isolate Tumor SC as is done for Tissue Stem Cells
MDR has been used for tissue SC identification and isolation in the absence of specific tiss.SC markers: Any tissue contains a rare population of “SP” cells. When sorted these cells are highly clonogenic (Margaret Goodel, 1998)
Caution: Not all SC have MDR activity and not all MDR active cells are SC! (MDR in BBB, kidney, small gut, T cells)
Donnenberg VS, Meyer EM, Donnenberg AD. Measurement of Multiple Drug Resistance Transporter Activity in Putative Cancer Stem/Progenitor Cells. In: Yu J, ed. Methods in Molecular Biology. Vol. Cancer Stem Cells. New York: Humana Press, Springer; 2009.
MDR10%
ClonogenicityTumorigenicity10%
Overlap 80%

Use of Inhibitors to Confirm Transporter Specificity
K56
2 Pa
rent
Ho33342 RED
No Inhibitor CsA Vincristine Fumitr
K56
2 G
185
Ho 3
334 2
BL U
E
Ho33342 RED
Vera
Ho3
3342
BL U
E
0.??%71% 98%INH 0%INH 0%INH 66%INH
3.36% 74%INH 0%INH 72%INH 80%INH
No Inhibitor CsA Vincristine Fumitr
R123
Vera
R123
4%
99%INH 0%INH 0%INH 88%INH
96.5%
0%INH 0%INH 0%INH 0%INH
96%
3.5%
MDR50% Tumorigenicity
10%
Overlap 10%
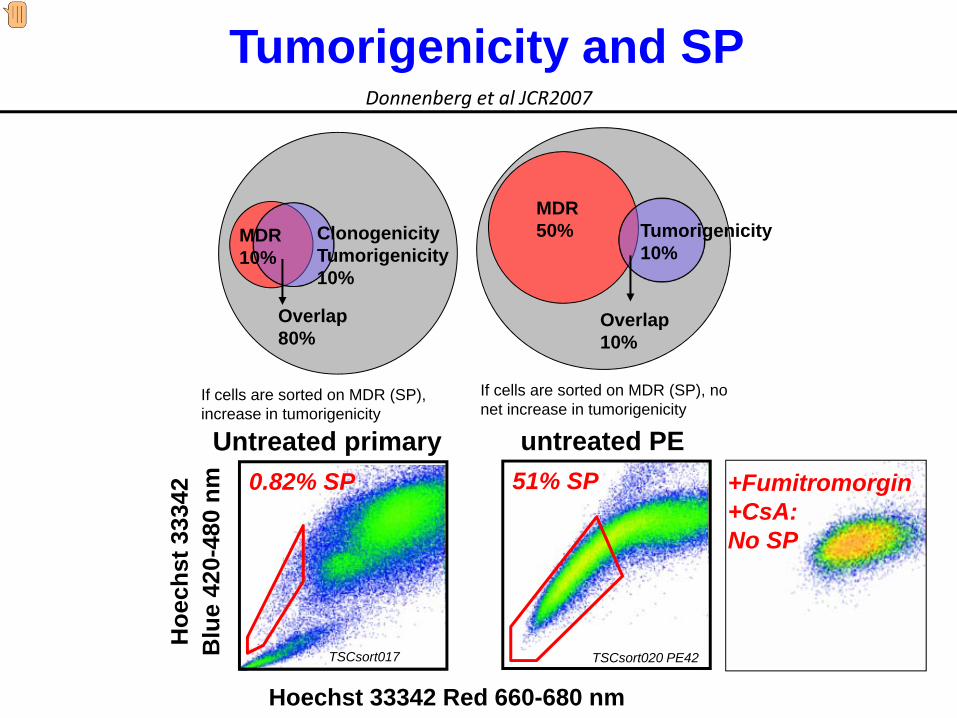
If cells are sorted on MDR (SP), no net increase in tumorigenicity
MDR10%
ClonogenicityTumorigenicity10%
Overlap 80%
If cells are sorted on MDR (SP), increase in tumorigenicity
Tumorigenicity and SP
Untreated primary
TSCsort017
0.82% SP
Hoechst 33342 Red 660-680 nm
Hoe
chst
333
42B
lue
420-
480
nm
TSCsort020 PE42
51% SPuntreated PE
Donnenberg et al JCR2007
+Fumitromorgin+CsA:No SP

• We have characterized a subset of highly tumorigenic breast cancer cells expressing CD90, CD44 and resting morphology.
• These cells were detected in previously untreated primary tumors.
• Which cells survive a “partial response” to chemotherapy?
Epithelial Tumors on Therapy: MRD

Singlets Nucleated CD45‐CD14‐CD33‐GlyA‐
FS peak height
FS peak width
DAPI Log
FS
CD45 APC‐Cy7
CD14,33,Gly PC5
FS
SS Log
SingletsSingletsNucleatedUngated
CTK FITC
EpCA
M APC
PE73
BrCA
19 pre
PE75
BrCA
19 post
Cytospin
97% 90% 0.45% 24%
97% 92% 0.75% 3.2%
Pre
Post
Analysis of Tumor Cell Survival After Therapy
Donnenberg et al. Therapeutic Index and the Cancer Stem Cell Paradigm. In: Bagley R, Teicher B, eds. Stem Cells and Cancer Series: Cancer Drug Discovery and Development. New York: Springer, Humana Press; 2009.

Which Cells are Targeted by Cytotoxic Therapy?
Cancer Stem Cell
Drug Resistant Bulky Tumor
Cancer Progenitor
Constitutive MDR
Acquired MDR
Bulky Disease
Drug Selection
Genetic Instability
CHEMOTHERAPY Shrinks the tumor!


![Monetary Policy and Real Estate Prices: A Disaggregated ... · PDF fileReal Estate Prices: A Disaggregated Analysis for Switzerland ... Dupor [2005] analyzes in ... A Disaggregated](https://img.pdfslide.net/doc/110x75/5a79a5d87f8b9ae1468d0da8/monetary-policy-and-real-estate-prices-a-disaggregated-estate-prices-a-disaggregated.jpg)