Embed Size (px)
Citation preview
Introduction to Flowcharting

The Flowchart
• (Dictionary) A schematic representation of a sequence of operations, as in a manufacturing process or computer program.
• (Technical) A graphical representation of the sequence of operations in an information system or program. Information system flowcharts show how data flows from source documents through the computer to final distribution to users. Program flowcharts show the sequence of instructions in a single program or subroutine. Different symbols are used to draw each type of flowchart.

The Flowchart
A Flowchart– shows logic of an algorithm
– emphasizes individual steps and their interconnections
– e.g. control flow from one action to the next

Flowchart Symbols Basic

Basic Flowchart Symbols
• Notice there are three types of symbols in this flowchart:– rounded rectangles
– parallelograms– a rectangle
• Each symbol represents a different type of operation.
START
Display message “How many
hours did you work?”
Read Hours
Display message “How much do you get paid per
hour?”
Read Pay Rate
Multiply Hours by Pay Rate.
Store result in Gross Pay.
Display Gross Pay
END
Rounded Rectangle
Parallelogram
Rectangle
Rounded Rectangle

Basic Flowchart Symbols
• Terminals– represented by rounded
rectangles– indicate a starting or
ending point
START
Display message “How many
hours did you work?”
Read Hours
Display message “How much do you get paid per
hour?”
Read Pay Rate
Multiply Hours by Pay Rate.
Store result in Gross Pay.
Display Gross Pay
END
Terminal
START
END Terminal

Basic Flowchart Symbols
• Input/Output Operations– represented by
parallelograms– indicate an input or output
operation
START
Display message “How many
hours did you work?”
Read Hours
Display message “How much do you get paid per
hour?”
Read Pay Rate
Multiply Hours by Pay Rate.
Store result in Gross Pay.
Display Gross Pay
END
Display message “How many
hours did you work?”
Read Hours
Input/Output Operation

Basic Flowchart Symbols
• Processes– represented by rectangles– indicates a process such as
a mathematical computation or variable assignment
START
Display message “How many
hours did you work?”
Read Hours
Display message “How much do you get paid per
hour?”
Read Pay Rate
Multiply Hours by Pay Rate.
Store result in Gross Pay.
Display Gross Pay
END
Multiply Hours by Pay Rate.
Store result in Gross Pay.
Process

Stepping Through the Flowchart
START
Display message “How many
hours did you work?”
Read Hours
Display message “How much do you get paid per
hour?”
Read Pay Rate
Multiply Hours by Pay Rate.
Store result in Gross Pay.
Display Gross Pay
END
Variable Contents:Hours: ?Pay Rate: ?Gross Pay: ?
Output Operation
Stepping Through the Flowchart
Stepping Through the Flowchart
START
Display message “How many
hours did you work?”
Read Hours
Display message “How much do you get paid per
hour?”
Read Pay Rate
Multiply Hours by Pay Rate.
Store result in Gross Pay.
Display Gross Pay
END
Variable Contents:Hours: 40Pay Rate: ?Gross Pay: ?
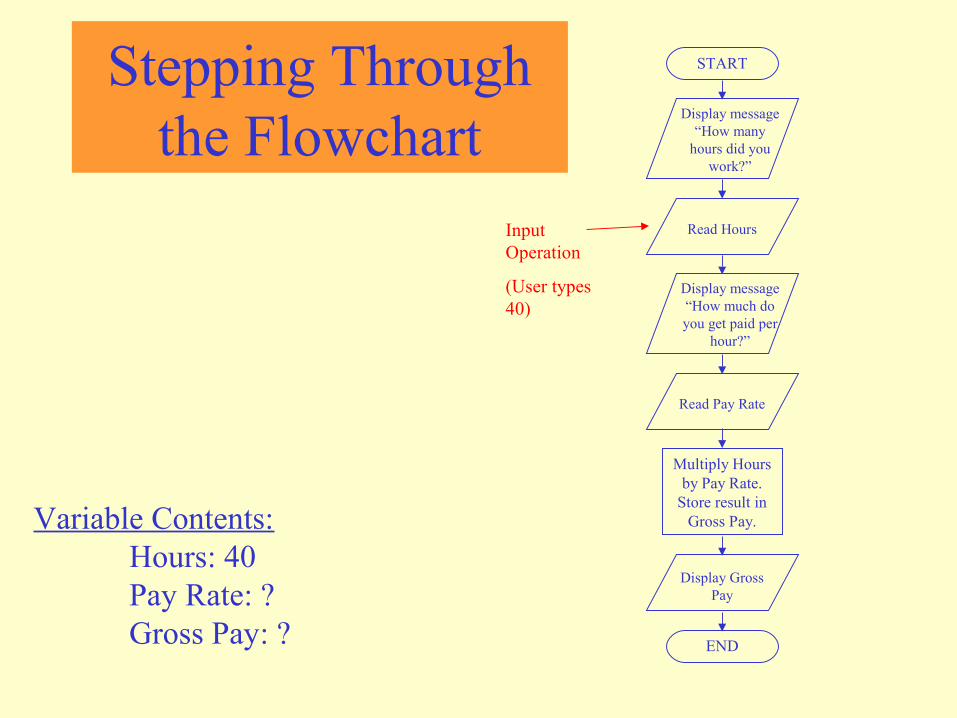
Input Operation
(User types 40)
Stepping Through the Flowchart

Stepping Through the Flowchart
START
Display message “How many
hours did you work?”
Read Hours
Display message “How much do you get paid per
hour?”
Read Pay Rate
Multiply Hours by Pay Rate.
Store result in Gross Pay.
Display Gross Pay
END
Variable Contents:Hours: 40Pay Rate: ?Gross Pay: ?
Output Operation
Stepping Through the Flowchart

Stepping Through the Flowchart
How much do you get paid per hour? 20
START
Display message “How many
hours did you work?”
Read Hours
Display message “How much do you get paid per
hour?”
Read Pay Rate
Multiply Hours by Pay Rate.
Store result in Gross Pay.
Display Gross Pay
END
Variable Contents:Hours: 40Pay Rate: 20Gross Pay: ?
Input Operation
(User types 20)
Stepping Through the Flowchart
START
Display message “How many
hours did you work?”
Read Hours
Display message “How much do you get paid per
hour?”
Read Pay Rate
Multiply Hours by Pay Rate.
Store result in Gross Pay.
Display Gross Pay
END
Variable Contents:Hours: 40Pay Rate: 20Gross Pay: 800
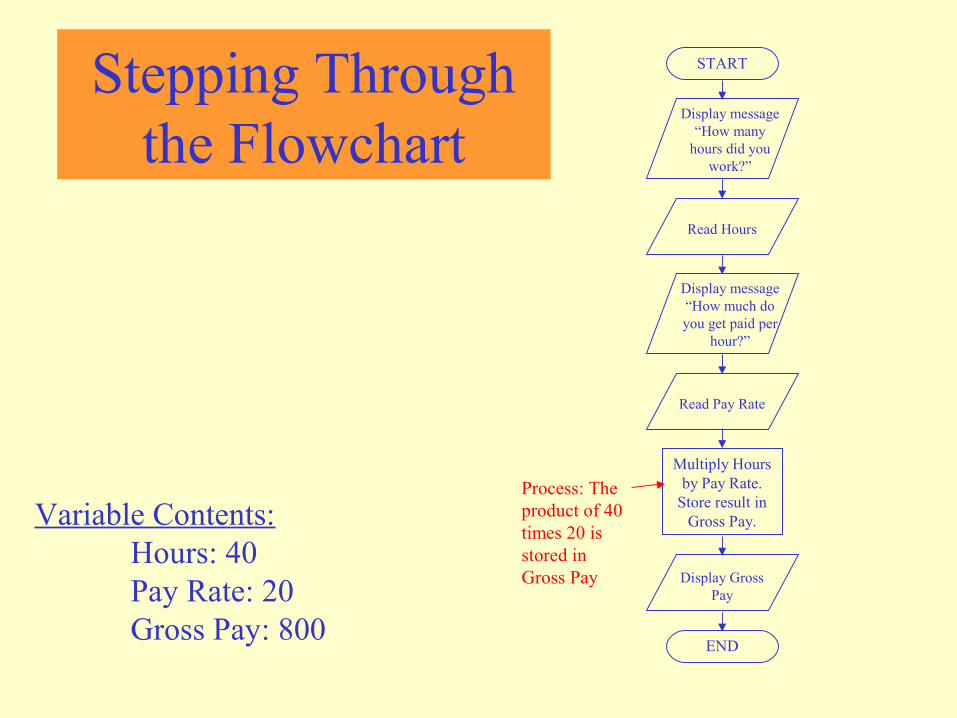
Process: The product of 40 times 20 is stored in Gross Pay
Stepping Through the Flowchart

Stepping Through the Flowchart
START
Display message “How many
hours did you work?”
Read Hours
Display message “How much do you get paid per
hour?”
Read Pay Rate
Multiply Hours by Pay Rate.
Store result in Gross Pay.
Display Gross Pay
END
Variable Contents:Hours: 40Pay Rate: 20Gross Pay: 800
Output Operation

Four Flowchart Structures
• Sequence
• Decision
• Repetition
• Case

Sequence Structure
• a series of actions are performed in sequence• The pay-calculating example was a sequence
flowchart.

Decision Structure
• One of two possible actions is taken, depending on a condition.

Decision Structure
• A new symbol, the diamond, indicates a yes/no question. If the answer to the question is yes, the flow follows one path. If the answer is no, the flow follows another path
YESNO
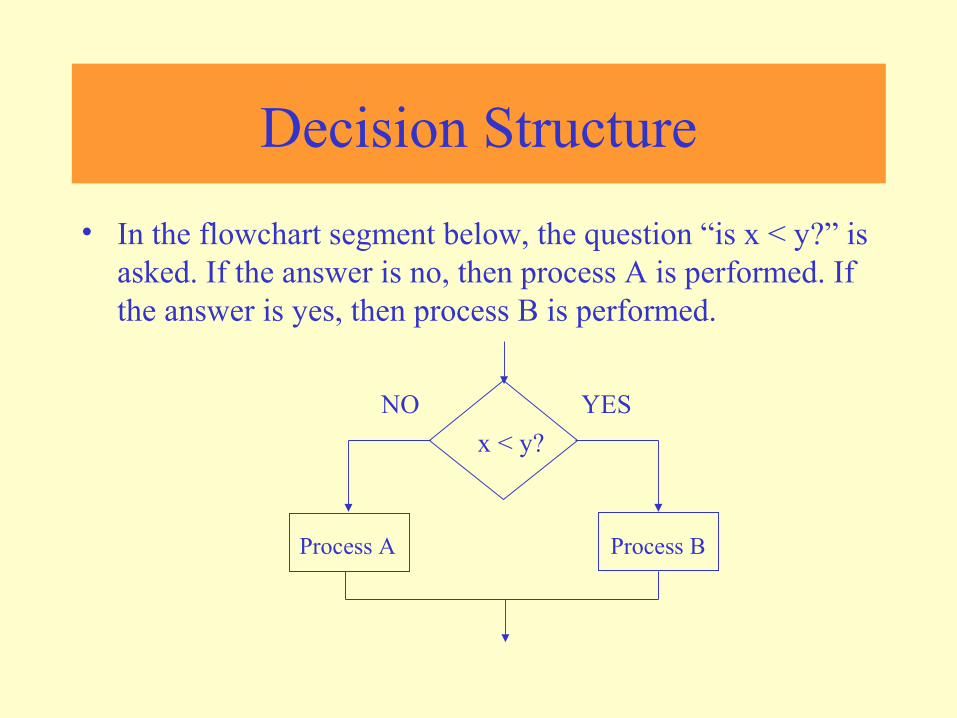
Decision Structure
• In the flowchart segment below, the question “is x < y?” is asked. If the answer is no, then process A is performed. If the answer is yes, then process B is performed.
YESNO
x < y?
Process BProcess A

Decision Structure
• The flowchart segment below shows how a decision structure is expressed in C++ as an if/else statement.
YESNO
x < y?
Calculate a as x times 2.
Calculate a as x plus y.
if (x < y)
a = x * 2;
else
a = x + y;
Flowchart C++ Code

Decision Structure
• The flowchart segment below shows a decision structure with only one action to perform. It is expressed as an if statement in C++ code.
if (x < y)
a = x * 2;
Flowchart C++ Code
YESNO
x < y?
Calculate a as x times 2.

Repetition Structure
• A repetition structure represents part of the program that repeats. This type of structure is commonly known as a loop.

Repetition Structure
• Notice the use of the diamond symbol. A loop tests a condition, and if the condition exists, it performs an action. Then it tests the condition again. If the condition still exists, the action is repeated. This continues until the condition no longer exists.

Repetition Structure
• In the flowchart segment, the question “is x < y?” is asked. If the answer is yes, then Process A is performed. The question “is x < y?” is asked again. Process A is repeated as long as x is less than y. When x is no longer less than y, the repetition stops and the structure is exited.
x < y? Process A
YES

Repetition Structure
• The flowchart segment below shows a repetition structure expressed in C++ as a while loop.
while (x < y)
x++;
Flowchart C++ Code
x < y? Add 1 to x
YES

Controlling a Repetition Structure
• The action performed by a repetition structure must eventually cause the loop to terminate. Otherwise, an infinite loop is created.
• In this flowchart segment, x is never changed. Once the loop starts, it will never end.
• QUESTION: How can thisflowchart be modified soit is no longer an infiniteloop?
x < y? Display x
YES

Controlling a Repetition Structure
• ANSWER: By adding an action within the repetition that changes the value of x.
x < y? Display x
Add 1 to x
YES

A Pre-Test Repetition Structure
• This type of structure is known as a pre-test repetition structure. The condition is tested BEFORE any actions are performed.
x < y? Display x
Add 1 to x
YES
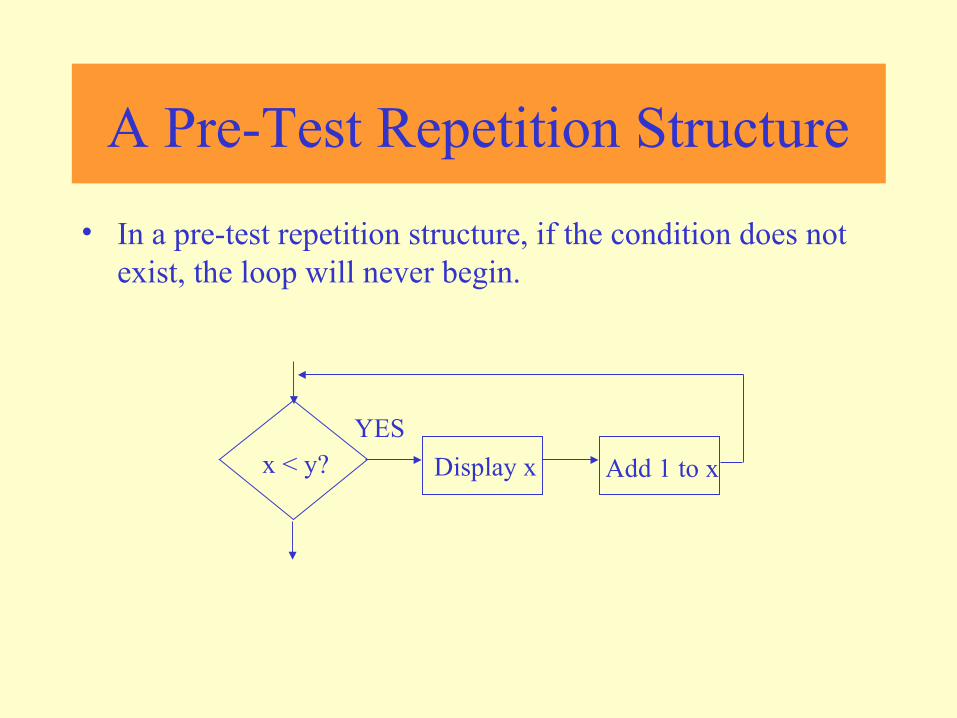
A Pre-Test Repetition Structure
• In a pre-test repetition structure, if the condition does not exist, the loop will never begin.
x < y? Display x
Add 1 to x
YES

A Post-Test Repetition Structure
• This flowchart segment shows a post-testrepetition structure.
• The condition is tested AFTER the actionsare performed.
• A post-test repetition structure alwaysperforms its actions at least once.
Display x
Add 1 to x
YESx < y?

A Post-Test Repetition Structure
• The flowchart segment below shows a post-test repetition structure expressed in C++ as a do-while loop.
do{
cout << x << endl;x++;
} while (x < y);
Flowchart
C++ Code Display x
Add 1 to x
YESx < y?

Case Structure
• One of several possible actions is taken, depending on the contents of a variable.

Case Structure
• The structure below indicates actions to perform depending on the value in years_employed.
CASEyears_employed
1 2 3 Other
bonus = 100 bonus = 200 bonus = 400 bonus = 800

Case Structure
CASEyears_employed
1 2 3 Other
bonus = 100 bonus = 200 bonus = 400 bonus = 800
If years_employed = 1, bonus is set to 100
If years_employed = 2, bonus is set to 200
If years_employed = 3, bonus is set to 400
If years_employed is any other value, bonus is set to 800

Connectors
• Sometimes a flowchart will not fit on one page.
• A connector (represented by a small circle) allows you to connect two flowchart segments.
A
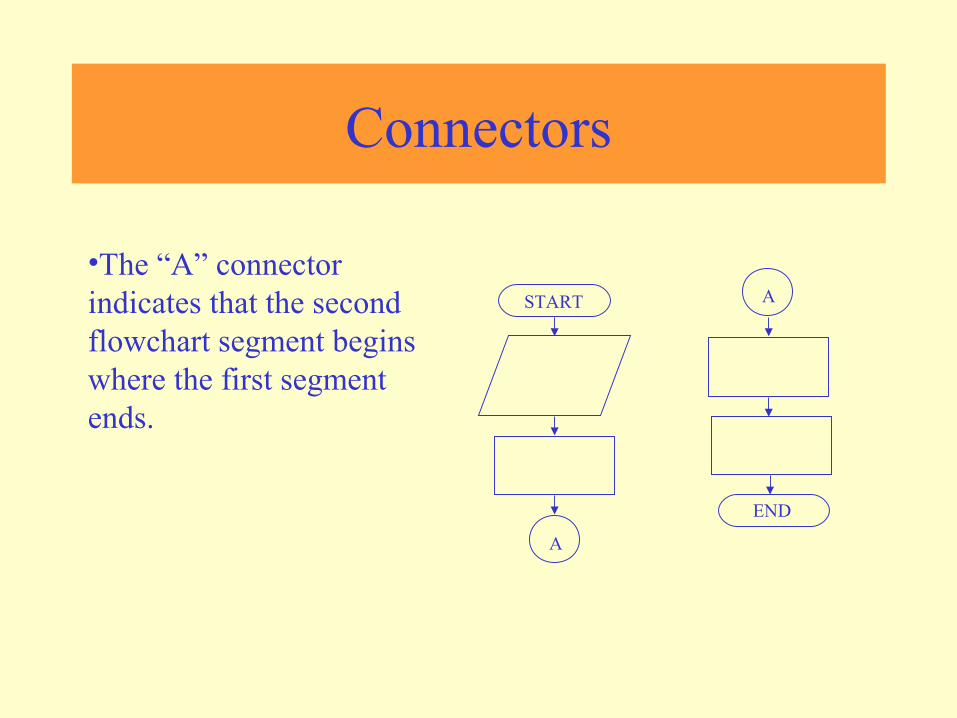
Connectors
A
A
START
END
•The “A” connector indicates that the second flowchart segment begins where the first segment ends.

Example
PRINT“PASS”
Step 1: Input M1,M2,M3,M4Step 2: GRADE ← (M1+M2+M3+M4)/4 Step 3: if (GRADE <50) then
Print “FAIL” else
Print “PASS” endif
START
InputM1,M2,M3,M4
GRADE←(M1+M2+M3+M4)/4
ISGRADE<5
0
PRINT“FAIL”
STOP
YN

Example 2
• Write an algorithm and draw a flowchart to convert the length in feet to centimeter.
Pseudocode:• Input the length in feet (Lft)• Calculate the length in cm (Lcm) by
multiplying LFT with 30• Print length in cm (LCM)

Example 2
Algorithm
• Step 1: Input Lft
• Step 2: Lcm ← Lft x 30
• Step 3: Print Lcm
START
InputLft
Lcm ← Lft x 30
PrintLcm
STOP
Flowchart

Example 3
Write an algorithm and draw a flowchart that will read the two sides of a rectangle and calculate its area.
Pseudocode • Input the width (W) and Length (L) of a rectangle• Calculate the area (A) by multiplying L with W• Print A

Example 3
Algorithm
• Step 1: Input W,L
• Step 2: A ← L x W
• Step 3: Print A
START
InputW, L
A ← L x W
PrintA
STOP

Example 4
• Write an algorithm and draw a flowchart that will calculate the roots of a quadratic equation
• Hint: d = sqrt ( ), and the roots are: x1 = (–b + d)/2a and x2 = (–b – d)/2a
2 0ax bx c+ + =2 4b ac−

Example 4
Pseudocode: • Input the coefficients (a, b, c) of the
quadratic equation• Calculate d• Calculate x1• Calculate x2• Print x1 and x2

Example 4
• Algorithm: • Step 1: Input a, b, c
• Step 2: d ← sqrt ( )
• Step 3: x1 ← (–b + d) / (2 x a)
• Step 4: x2 ← (–b – d) / (2 x a)
• Step 5: Print x1, x2
START
Inputa, b, c
d ← sqrt(b x b – 4 x a x c)
Printx1 ,x2
STOP
x1 ←(–b + d) / (2 x a)
X2 ← (–b – d) / (2 x a)
4b b a c× − × ×

DECISION STRUCTURES
• The expression A>B is a logical expression• it describes a condition we want to test• if A>B is true (if A is greater than B) we take the
action on left• print the value of A • if A>B is false (if A is not greater than B) we take
the action on right• print the value of B

DECISION STRUCTURES
isA>B
Print B
Print A
Y N

IF–THEN–ELSE STRUCTURE
• The structure is as follows
If condition then
true alternative
else
false alternative
endif

IF–THEN–ELSE STRUCTURE
• The algorithm for the flowchart is as follows:
If A>B then print A
else print B
endif
isA>B
Print B
Print A
Y N

Relational Operators
Relational Operators
Operator Description> Greater than
< Less than
= Equal to
≥ Greater than or equal to
≤ Less than or equal to
≠ Not equal to

Example 5
• Write an algorithm that reads two values, determines the largest value and prints the largest value with an identifying message.
ALGORITHMStep 1: Input VALUE1, VALUE2Step 2: if (VALUE1 > VALUE2) then
MAX ← VALUE1else
MAX ← VALUE2endif
Step 3: Print “The largest value is”, MAX

Example 5
MAX ← VALUE1
Print“The largest value is”,
MAX
STOP
Y N
START
InputVALUE1,VALUE2
MAX ← VALUE2
isVALUE1>VALUE2

NESTED IFS
• One of the alternatives within an IF–THEN–ELSE statement– may involve further IF–THEN–ELSE statement

Example 6
• Write an algorithm that reads three numbers and prints the value of the largest number.

Example 6Step 1: Input N1, N2, N3Step 2: if (N1>N2) then
if (N1>N3) then MAX ← N1 [N1>N2, N1>N3]
else MAX ← N3 [N3>N1>N2]
endifelse
if (N2>N3) then MAX ← N2 [N2>N1, N2>N3]
else MAX ← N3 [N3>N2>N1]
endifendif
Step 3: Print “The largest number is”, MAX

Example 6
• Flowchart: Draw the flowchart of the above Algorithm.
Example 7
• Write and algorithm and draw a flowchart to
a) read an employee name (NAME), overtime hours worked (OVERTIME), hours absent (ABSENT) and
b) determine the bonus payment (PAYMENT).

Example 7
Bonus Schedule
OVERTIME – (2/3)*ABSENT Bonus Paid
>40 hours>30 but ≤ 40 hours>20 but ≤ 30 hours>10 but ≤ 20 hours≤ 10 hours
$50$40$30$20$10

Modules
• A program module (such as a function in C++) is represented by a special symbol.

Modules
•The position of the module symbol indicates the point the module is executed.
•A separate flowchart can be constructed for the module.
START
END
Read Input.
Call calc_pay function.
Display results.

Combining Structures
• Structures are commonly combined to create more complex algorithms.
• The flowchart segment below combines a decision structure with a sequence structure.
x < y? Display x
Add 1 to x
YES

• This flowchart segment shows two decision structures combined.
Combining Structures
Display “x is within limits.”
Display “x is outside the limits.”
YESNOx > min?
x < max?
YES NO
Display “x is outside the limits.”

Review
• What do each of the following symbols represent?
(Answer on next slide)

Answer
• What do each of the following symbols represent?
Terminal
Input/Output Operation
Process
Decision
Connector
Module

Review
• Name the four flowchart structures.
(Answer on next slide)

Answer
• Sequence
• Decision
• Repetition
• Case

• What type of structure is this?
Review
(Answer on next slide)

Answer
• Repetition

• What type of structure is this?
Review
(Answer on next slide)

Answer
• Sequence

• What type of structure is this?
Review
(Answer on next slide)
Answer
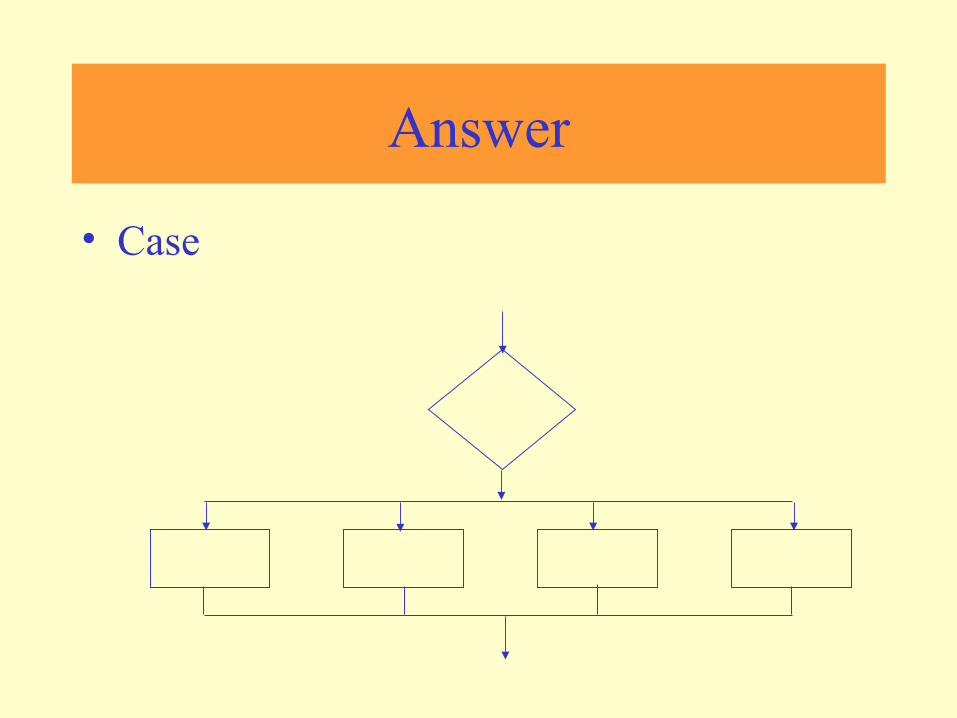
• Case

• What type of structure is this?
Review
(Answer on next slide)

Answer
• Decision