Embed Size (px)
Citation preview

Flower traits, habitat, and phylogeny as predictors of pollinatorservice: a plant community perspective
CARLOS M. HERRERA1
Estaci�on Biol�ogica de Do~nana, Consejo Superior de Investigaciones Cient�ıficas, Avenida Americo Vespucio 26, E-41092 Sevilla, Spain
Citation: Herrera, C. M. 2020. Flower traits, habitat, and phylogeny as predictors of pollinator service: aplant community perspective. Ecological Monographs 90(2):e01402. 10.1002/ecm.1402
Abstract. Pollinator service is essential for successful sexual reproduction and long-termpopulation persistence of animal-pollinated plants, and innumerable studies have shown thatinsufficient service by pollinators results in impaired sexual reproduction (“pollen limitation”).Studies directly addressing the predictors of variation in pollinator service across species orhabitats remain comparatively scarce, which limits our understanding of the primary causes ofnatural variation in pollen limitation. This paper evaluates the importance of pollination-related features, evolutionary history, and environment as predictors of pollinator service in alarge sample of plant species from undisturbed montane habitats in southeastern Spain. Quan-titative data on pollinator visitation were obtained for 191 insect-pollinated species belongingto 142 genera in 43 families, and the predictive values of simple floral traits (perianth type,class of pollinator visitation unit, and visitation unit dry mass), phylogeny, and habitat typewere assessed. A total of 24,866 pollinator censuses accounting for 5,414,856 flower-minutes ofobservation were conducted on 510 different dates. Flowering patch and single flower visita-tion probabilities by all pollinators combined were significantly predicted by the combinedeffects of perianth type (open vs. restricted), class of visitation unit (single flower vs. flowerpacket), mass of visitation unit, phylogenetic relationships, and habitat type. Pollinator compo-sition at insect order level varied extensively among plant species, largely reflecting the con-trasting visitation responses of Coleoptera, Diptera, Hymenoptera, and Lepidoptera tovariation in floral traits. Pollinator composition had a strong phylogenetic component, and thedistribution of phylogenetic autocorrelation hotspots of visitation rates across the plant phy-logeny differed widely among insect orders. Habitat type was a key predictor of pollinator com-position, as major insect orders exhibited decoupled variation across habitat types in visitationrates. Comprehensive pollinator sampling of a regional plant community has shown that polli-nator visitation and composition can be parsimoniously predicted by a combination of simplefloral features, habitat type, and evolutionary history. Ambitious community-level studies canhelp to formulate novel hypotheses and questions, shed fresh light on long-standing controver-sies in pollination research (e.g., “pollination syndromes”), and identify methodological cau-tions that should be considered in pollination community studies dealing with small,phylogenetically biased plant species samples.
Key words: floral traits;Mediterranean mountain habitats; phylogenetic niche conservatism; phylogeneticsignal; plant community; pollinator composition; pollinator functional abundance; pollinator service.
INTRODUCTION
Most angiosperm plants are pollinated by animals,and pollinator service is essential to achieve successfulsexual reproduction and long-term population persis-tence (Knight et al. 2005, Harder and Aizen 2010, Oller-ton et al. 2011). Considerable research effort has beendevoted over the years to elucidate the multiple implica-tions of variation in pollinator service among individu-als, species, habitats, or pollination modes. Within thisconceptual framework, one traditional line of inquiry
has analyzed the consequences of variation in pollinatorservice. This indirect approach to the study of pollinatorservice includes countless studies showing that insuffi-cient quantity or quality of pollen delivery (“pollen limi-tation”) often entails a reduction in the number orreproductive value of seeds (Gross and Werner 1983,Burd 1994, Harder and Aizen 2010, Bennett et al. 2018);empirical investigations on patterns of variation in pol-len limitation among plant taxa, regions, communitiesor life forms (Johnson and Bond 1997, Larson and Bar-rett 2000, Vamosi et al. 2006, Alonso et al. 2012, 2013,Bennett et al. 2018); and theoretical treatments formu-lating evolutionary models (Ashman et al. 2004, Aizenand Harder 2007, Burd 2016, Harder et al. 2016).Thanks to this vast amount of work, the ecological and
Manuscript received 21 May 2019; revised 23 September2019; accepted 11 November 2019. Corresponding Editor:Rebecca E. Irwin.
1 E-mail: [email protected]
Article e01402; page 1
Ecological Monographs, 90(2), 2020, e01402© 2019 by the Ecological Society of America
evolutionary consequences of variable pollinator serviceat different scales are now reasonably well understood.In contrast, studies directly addressing the causal factorsexplaining variation in pollinator service across species,habitats or regions remain comparatively scarce. Thisrepresents an important, albeit insufficiently recognizeddifficulty for achieving a better understanding of theconstellation of factors affecting pollen limitation andreproductive success in animal-pollinated plants. Asnoted by Ashman et al. (2004: 2419) more than one dec-ade ago, despite the wealth of data on pollen limitation“we [still] remain ill equipped to assess its causes” (seealso Vamosi et al. 2013).Pollinator service, which depends on a combination of
pollinator visitation frequency and pollinator composi-tion, is one of the most immediate causal factors con-tributing to variations in pollen limitation andreproductive success (G�omez et al. 2007, 2010). This isbecause the intensity of pollen deposition and removaloften depends on the frequency of animal visits to flow-ers (Silander and Primack 1978, Rush et al. 1995, Engeland Irwin 2003; but see also, e.g., Hegland and Totland2008), and different pollinator types vary in average pol-linating efficacy or quality per visit (Herrera 1987, Sahliand Conner 2007, King et al. 2013). Following the leadof early pioneering work (M€uller 1883, Knuth 1908,Robertson 1928), information on pollinator visitationfrequency and composition has routinely formed part ofnearly every published piece of pollination research, andvast amounts of qualitative and quantitative data havesteadily accumulated in the literature over many decades.The rather puzzling scarcity of quantitative ecologicalstudies aimed at recognizing predictors of natural varia-tion in pollinator visitation and composition, and thuspollinator service, despite early claims pointing out itsecological significance (McCall and Primack 1992, Pri-mack and Inouye 1993) and the availability of such anenormous literature database can be tentatively inter-preted on four distinct grounds. First, with few excep-tions (e.g., McCall and Primack 1992, Ollerton et al.2009, L�azaro et al. 2013) the vast majority of investiga-tions addressing pollinator visitation and/or composi-tion of animal-pollinated plants at the plant communitylevel have examined only small or modest numbers ofplant species at a time (see, e.g., Ollerton 2017: Appen-dix 2 for review). Apart from the likely ecological or tax-onomic biases to be expected in small species samples,the narrow range in flower traits, pollinator type, ecolog-ical conditions, or taxonomic/phylogenetic affiliationinherent to small samples reduces the statistical powerfor identifying predictors of pollinator visitation andcomposition. Second, among the scarce pollination stud-ies dealing with a substantial number of species (>100)very few have applied quantitative methods transcendingsimple binary scoring of plant–pollinator species associ-ations (Interaction Web Database; available online).2 As
a consequence, attempts at elucidating broad-scale pat-terns of pollinator visitation and composition in largespecies samples have often relied on statistically subopti-mal, binary plant–pollinator data (Herrera 1996, Waseret al. 1996, Olesen and Jordano 2002). Third, the enor-mous variety of observational methods and numericalmeasurements that have been applied so far in pollina-tion studies poses insuperable difficulties for comparingdata from different studies (Kearns and Inouye 1993),and also for turning results from different studies intoaggregate datasets that could be used for broad quanti-tative analyses searching for predictors of pollinator visi-tation and composition. And fourth, irrespective of themethods used to record and numerically represent polli-nator visitation and composition, pollination studieshave infrequently estimated the uncertainty of whicheverestimate of pollinator service was used (but see, e.g.,Motten 1986, Inouye and Pyke 1988, McCall and Pri-mack 1992, G�omez et al. 2007, Herrera 2019). This hin-ders the application of formal statistical tests foraddressing explicit hypotheses on predictors of pollina-tor service, including possible meta-analyses.This paper presents the results of an investigation
designed to assess the importance of pollination-relatedplant features, evolutionary history, and environmentalconditions as predictors of pollinator service in a largesample of plant species from undisturbed montane habi-tats in southeastern Spain. Quantitative data on pollina-tor visitation and composition were obtained for asubstantial fraction of the regional plant community ofinsect-pollinated plants, and then related to several floraltraits, phylogeny, and type of habitat to evaluate theirpredictive value. The strength and novelty of this studyrest on the combination of an unusually large speciessample; considerable pollinator sampling effort; fieldsampling methods yielding extensively replicated quanti-tative data on pollinator visitation and compositionamenable to powerful statistical analyses; and the appli-cation of recent implementations of generalized linearmixed models for the study of pollinator functionalabundance (Herrera 2019). The consistent use of mixedlinear models where plant species, sampling sites andsampling years were all treated as random effects, willallow drawing of conclusions referred to a broad infer-ence space and answering broad ecological questionswhose scope transcends the limits of the specific samplesstudied (McLean et al. 1991, Bolker 2015, Herrera2019).
MATERIALS AND METHODS
Study area
Data on pollinator visitation analyzed in this paperwere collected during February–December 1997–2018(with a gap in 2000–2002) in a relatively small area ofthe Sierras de Cazorla-Segura-Las Villas Natural Park,Ja�en Province, southeastern Spain. This region is2 https://www.nceas.ucsb.edu/interactionweb/resources.html
Article e01402; page 2 CARLOS M. HERRERA Ecological MonographsVol. 90, No. 2

characterized by extensive areas of well-preserved moun-tain habitats and outstanding biological diversity(M�edail and Diadema 2009, G�omez Mercado 2011,Molina-Venegas et al. 2015). Sampling sites (N = 42;Appendix S1, distance between sites ≤21 km) werespread over all altitudinal belts of vegetation occurringin the region (elevation range 770–1,920 m above sealevel). Study sites were a superset of the N = 29 locationsstudied by Herrera (2019). Major vegetation types fromlower to higher elevations included Quercus rotundifolia-dominated, Mediterranean evergreen forest and tallscrubland; mixed Pinus nigra or P. pinaster forest withQuercus and Acer; and various types of mature Pinusnigra forests and woodlands differing in age, height, andtree density.
Plant species sample
Pollinator visitation to flowers was assessed for 191plant species belonging to 142 genera in 43 families(Table 1). This sample is a superset of the 65 species in28 families studied by Herrera (2019), and includes spe-cies from 73% of families, and ~85% of widely dis-tributed or common species, of entomophilous plants inthe Sierra de Cazorla region (G�omez Mercado 2011; C.M. Herrera, unpublished data). Mean pollinator sam-pling date for each species roughly matched its peakflowering date. The seasonal distribution of samplingtimes in the species sample (Table 1) closely matched theseasonal pattern of flowering times in the region, withmost species flowering in June and July. Asteraceae (39species), Lamiaceae (24 species), Brassicaceae (10),Fabaceae (10), Rosaceae (9), and Cistaceae (8) con-tributed about one-half of species to the sample.Hemicryptophytes (72 species), chamaephytes (41), geo-phytes (33), and therophytes (27) were the predominantlife forms (Table 1).
Sampling scheme
The goal of this study was to collect quantitative dataon pollinator visitation for as many different plant spe-cies as possible so that most regional phylogenetic, eco-logical, and floral diversity was eventually sampled.Considerable attention was paid to avoiding consciousor unconscious biases favoring species from particularhabitat types, blooming at convenient times of year,yielding high data/sampling effort ratios, or having par-ticular pollinator types (e.g., easily identifiable or large-sized ones). Obtaining robust quantitative pollinatordata for a large, ecologically and phylogenetically unbi-ased species sample required spanning fieldwork overmany years, since pre-established replication rules (seePollinator visitation) limited the number of species thatcould be sampled per flowering season. About two-thirds of species in the sample (N = 126) were sampledfor pollinators in only one year and the rest were sam-pled for two or more years as part of the research on
long-term changes in pollinator abundance in relation toclimate change reported by Herrera (2019). Pollinatorsampling was conducted on a single site in the vastmajority of the species considered here (N = 181), while10 species that were part of other investigations weresampled on two or more sites (e.g., Aquilegia cazorlensis,Aquilegia vulgaris, Helleborus foetidus, Lavandula latifo-lia, Narcissus longispathus; Table 1). The distribution ofpollinator sampling effort among plant species, yearsand sites is shown in Table 1. Species–year combinationswere chosen randomly, subject only to constraints set bytime availability, finding suitable populations, and sam-pling site accessibility, the choice being thus uninformedby, e.g., phenology or flowering intensity (see also Her-rera 2019).
Pollinator visitation
Quantitative data on pollinator visitation wereobtained by applying the same standardized samplingprotocol for all plant species studied (Herrera 2019).The basic sampling unit was the “pollinator census,”consisting of a 3-minute watch of a flowering patchwhose total number of open flowers was also counted.All pollinators visiting some flower in the focal patchduring the 3-minute period were identified (see Pollina-tor identification), and total number of flowers probedby each individual was recorded. Areal extent and num-ber of open flowers in monitored patches were adjustedfor each plant species according to flower size and den-sity, so that all pollinator activity in the patches could beconfidently monitored from a distance of 1.5–2.0 m.Mean number of flowers in censused patches for eachspecies is shown in Appendix S2: Table S1. Some specieshad tiny flowers densely packed into compact inflores-cences (e.g., Apiaceae, Asteraceae, Dipsacaceae; N = 53species, Table 1), which rendered impractical assessingthe number of elemental florets visited by pollinators. Inthese cases, the number of inflorescences available perpatch and visited per census was counted rather thanindividual flowers, and visitation probabilities (see Dataanalysis) thus actually refer to inflorescences. For sim-plicity, I will refer to visitation to both single flowers andinflorescences as “flower visitation.” In some analyses,however, the two types of visitation units will be consid-ered as levels of the discrete variable “visitation unit,”one of the predictors of pollinator visitation consideredhere (“single flowers” vs. “flower packets”; Appendix S2:Fig. S1; see Data analysis).Census replication rules for each species–site–year
combination were as in Herrera (2019). A minimum of60 censuses spread over three non-consecutive datesshould be conducted on ≥20 widely spaced floweringpatches with roughly similar flower numbers. On eachdate, censuses should be distributed from 0.5 to 2.5 hpast sunrise (depending on season; censuses started ear-lier in summer) through one hour past noon, the differ-ent patches being watched in random order. Flowers of
May 2020 PREDICTORS OF POLLINATOR SERVICE Article e01402; page 3
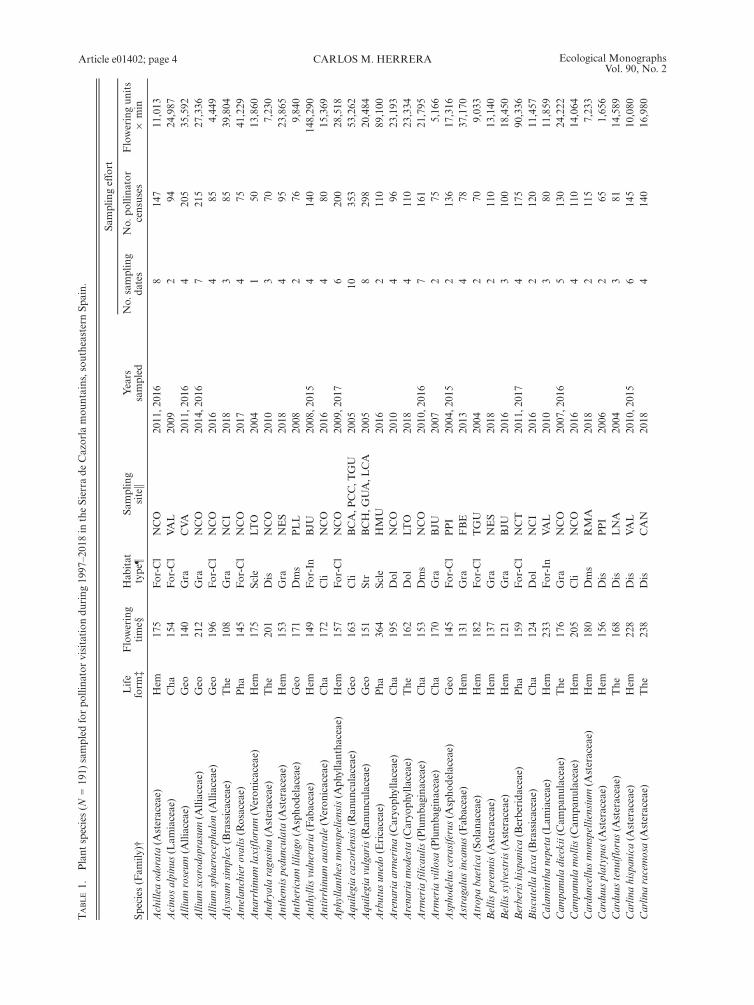
TABLE1.
Plant
species(N
=19
1)sampled
forpo
llina
torvisitation
during
1997–201
8in
theSierra
deCazorla
mou
ntains,sou
theasternSp
ain.
Species(Fam
ily)†
Life
form
‡Flowering
time§
Hab
itat
type¶
Sampling
sitek
Years
sampled
Samplingeffort
No.
sampling
dates
No.
pollina
tor
censuses
Floweringun
its
9min
Achillea
odorata(A
steraceae)
Hem
175
For-C
lNCO
2011,2
016
814
711
,013
Acinosalpinus(Lam
iaceae)
Cha
154
For-C
lVAL
2009
294
24,987
Allium
roseum
(Alliaceae)
Geo
140
Gra
CVA
2011,2
016
420
535
,592
Allium
scorod
oprasum
(Alliaceae)
Geo
212
Gra
NCO
2014,2
016
7215
27,336
Allium
sphaerocephalon(A
lliaceae)
Geo
196
For-C
lNCO
2016
485
4,44
9Alyssum
simplex
(Brassicaceae)
The
108
Gra
NCI
2018
385
39,804
Amelanchierovalis(R
osaceae)
Pha
145
For-C
lNCO
2017
475
41,229
Ana
rrhinu
mlaxiflorum
(Veron
icaceae)
Hem
175
Scle
LTO
2004
150
13,860
And
ryalaragu
sina
(Asteraceae)
The
201
Dis
NCO
2010
370
7,23
0Anthemispedunculata(A
steraceae)
Hem
153
Gra
NES
2018
495
23,865
Anthericum
liliago
(Aspho
delaceae)
Geo
171
Dms
PLL
2008
276
9,84
0Anthyllisvulneraria
(Fab
aceae)
Hem
149
For-In
BJU
2008,2
015
414
014
8,29
0Antirrhinum
australe(Veron
icaceae)
Cha
172
Cli
NCO
2016
480
15,369
Aphyllanthesmonspeliensis(A
phyllantha
ceae)
Hem
157
For-C
lNCO
2009,2
017
620
028
,518
Aqu
ilegiacazorlensis(R
anun
culaceae)
Geo
163
Cli
BCA,P
CC,T
GU
2005
1035
353
,262
Aqu
ilegiavulgaris(R
anun
culaceae)
Geo
151
Str
BCH,G
UA,L
CA
2005
829
820
,484
Arbutus
unedo(Ericaceae)
Pha
364
Scle
HMU
2016
211
089
,100
Arenariaarmerina(C
aryo
phyllaceae)
Cha
195
Dol
NCO
2010
496
23,193
Arenariamod
esta
(Caryo
phyllaceae)
The
162
Dol
LTO
2018
4110
23,334
Arm
eria
filicaulis
(Plumba
gina
ceae)
Cha
153
Dms
NCO
2010,2
016
716
121
,795
Arm
eria
villo
sa(Plumba
gina
ceae)
Cha
170
Gra
BJU
2007
275
5,16
6Asphodeluscerasiferus(A
spho
delaceae)
Geo
145
For-C
lPPI
2004,2
015
213
617
,316
Astragalusincanu
s(Fab
aceae)
Hem
131
Gra
FBE
2013
478
37,170
Atrop
aba
etica(Solan
aceae)
Hem
182
For-C
lTGU
2004
270
9,03
3Bellis
perenn
is(A
steraceae)
Hem
137
Gra
NES
2018
211
013
,140
Bellis
sylvestris(A
steraceae)
Hem
121
Gra
BJU
2016
310
018
,450
Berberishispanica(Berberida
ceae)
Pha
159
For-C
lNCT
2011,2
017
417
590
,336
Biscutella
laxa
(Brassicaceae)
Cha
124
Dol
NCI
2016
212
011
,457
Calam
inthanepeta
(Lam
iaceae)
Hem
233
For-In
VAL
2010
380
11,859
Cam
panu
ladieckii(Cam
panu
laceae)
The
176
Gra
NCO
2007,2
016
513
024
,222
Cam
panu
lamollis
(Cam
panu
laceae)
Hem
205
Cli
NCO
2016
411
014
,064
Carduncellusmonspelliensium
(Asteraceae)
Hem
180
Dms
RMA
2018
211
57,23
3Cardu
usplatypus
(Asteraceae)
Hem
156
Dis
PPI
2006
265
1,656
Cardu
ustenu
iflorus(A
steraceae)
The
168
Dis
LNA
2004
381
14,589
Carlin
ahispanica(A
steraceae)
Hem
228
Dis
VAL
2010,2
015
614
510
,080
Carlin
aracemosa(A
steraceae)
The
238
Dis
CAN
2018
414
016
,980
Article e01402; page 4 CARLOS M. HERRERA Ecological MonographsVol. 90, No. 2
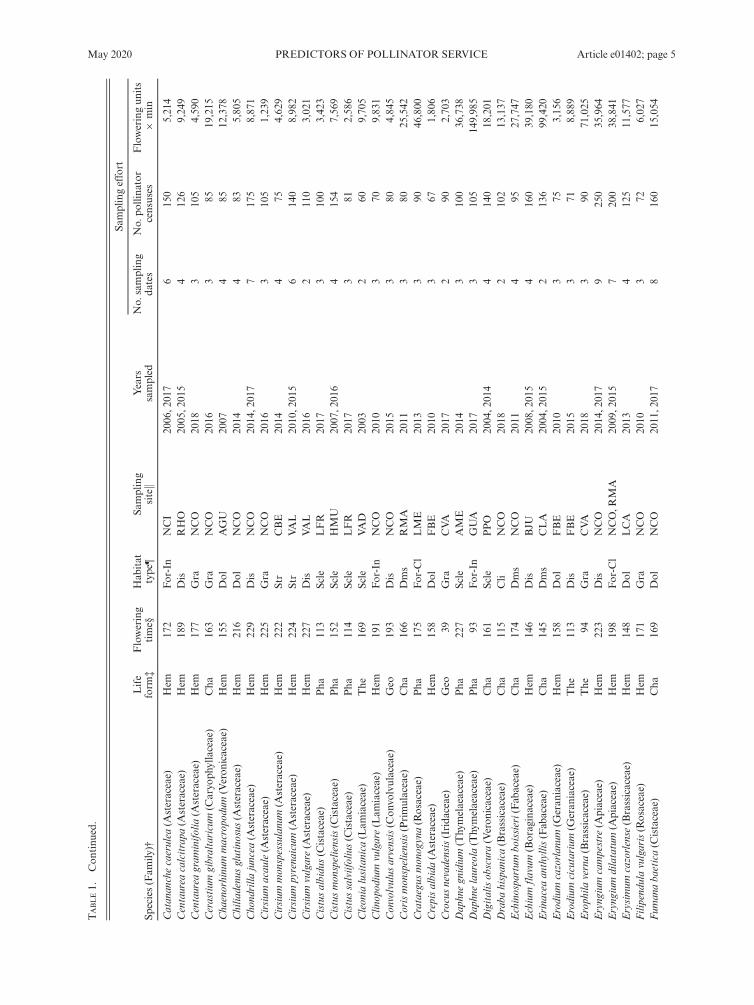
TABLE1.
Con
tinu
ed.
Species(Fam
ily)†
Life
form
‡Flowering
time§
Hab
itat
type¶
Sampling
sitek
Years
sampled
Samplingeffort
No.
sampling
dates
No.
pollina
tor
censuses
Floweringun
its
9min
Catan
anchecaerulea
(Asteraceae)
Hem
172
For-In
NCI
2006,2
017
6150
5,214
Centaurea
calcitrapa
(Asteraceae)
Hem
189
Dis
RHO
2005
,201
54
126
9,24
9Centaurea
gram
inifolia
(Asteraceae)
Hem
177
Gra
NCO
2018
3105
4,590
Cerastium
gibraltaricum
(Caryo
phyllaceae)
Cha
163
Gra
NCO
2016
385
19,215
Cha
enorhinu
mmacropo
dum
(Veron
icaceae)
Hem
155
Dol
AGU
2007
485
12,378
Chilia
denusglutinosus
(Asteraceae)
Hem
216
Dol
NCO
2014
483
5,80
5Cho
ndrilla
juncea
(Asteraceae)
Hem
229
Dis
NCO
2014,2
017
7175
8,871
Cirsium
acau
le(A
steraceae)
Hem
225
Gra
NCO
2016
310
51,23
9Cirsium
mon
spessulanum
(Asteraceae)
Hem
222
Str
CBE
2014
475
4,62
9Cirsium
pyrenaicum
(Asteraceae)
Hem
224
Str
VAL
2010
,201
56
140
8,98
2Cirsium
vulgare(A
steraceae)
Hem
227
Dis
VAL
2016
211
03,02
1Cistusalbidus(C
istaceae)
Pha
113
Scle
LFR
2017
310
03,42
3Cistusmonspeliensis(C
istaceae)
Pha
152
Scle
HMU
2007,2
016
4154
7,569
Cistussalviifolius(C
istaceae)
Pha
114
Scle
LFR
2017
381
2,58
6Cleon
ialusitanica
(Lam
iaceae)
The
169
Scle
VAD
2003
260
9,70
5Clin
opod
ium
vulgare(Lam
iaceae)
Hem
191
For-In
NCO
2010
370
9,83
1Convolvulus
arvensis(C
onvo
lvulaceae)
Geo
193
Dis
NCO
2015
380
4,84
5Corismonspeliensis(Primulaceae)
Cha
166
Dms
RMA
2011
380
25,542
Crataegus
mon
ogyn
a(R
osaceae)
Pha
175
For-C
lLME
2013
390
46,800
Crepisalbida
(Asteraceae)
Hem
158
Dol
FBE
2010
367
1,80
6Crocusnevadensis(Irida
ceae)
Geo
39Gra
CVA
2017
290
2,70
3Dap
hnegn
idium
(Thymelaeaceae)
Pha
227
Scle
AME
2014
310
036
,738
Dap
hnelaureola
(Thymelaeaceae)
Pha
93For-In
GUA
2017
3105
149,985
Digitalisobscura(Veron
icaceae)
Cha
161
Scle
PPO
2004
,201
44
140
18,201
Draba
hispanica(Brassicaceae)
Cha
115
Cli
NCO
2018
210
213
,137
Echinospa
rtum
boissieri(Fab
aceae)
Cha
174
Dms
NCO
2011
495
27,747
Echium
flavum
(Boraginaceae)
Hem
146
Dis
BJU
2008
,201
54
160
39,180
Erina
ceaan
thyllis
(Fab
aceae)
Cha
145
Dms
CLA
2004
,201
52
136
99,420
Erodium
cazorlan
um(G
eran
iaceae)
Hem
158
Dol
FBE
2010
375
3,15
6Erodium
cicutarium
(Geran
iaceae)
The
113
Dis
FBE
2015
371
8,88
9Eroph
ilaverna(Brassicaceae)
The
94Gra
CVA
2018
390
71,025
Eryng
ium
campestre
(Apiaceae)
Hem
223
Dis
NCO
2014
,201
79
250
35,964
Eryng
ium
dilatatum
(Apiaceae)
Hem
198
For-C
lNCO,R
MA
2009
,201
57
200
38,841
Erysimum
cazorlense
(Brassicaceae)
Hem
148
Dol
LCA
2013
4125
11,577
Filipendulavulgaris(R
osaceae)
Hem
171
Gra
NCO
2010
372
6,02
7Fum
anaba
etica(C
istaceae)
Cha
169
Dol
NCO
2011
,201
78
160
15,054
May 2020 PREDICTORS OF POLLINATOR SERVICE Article e01402; page 5
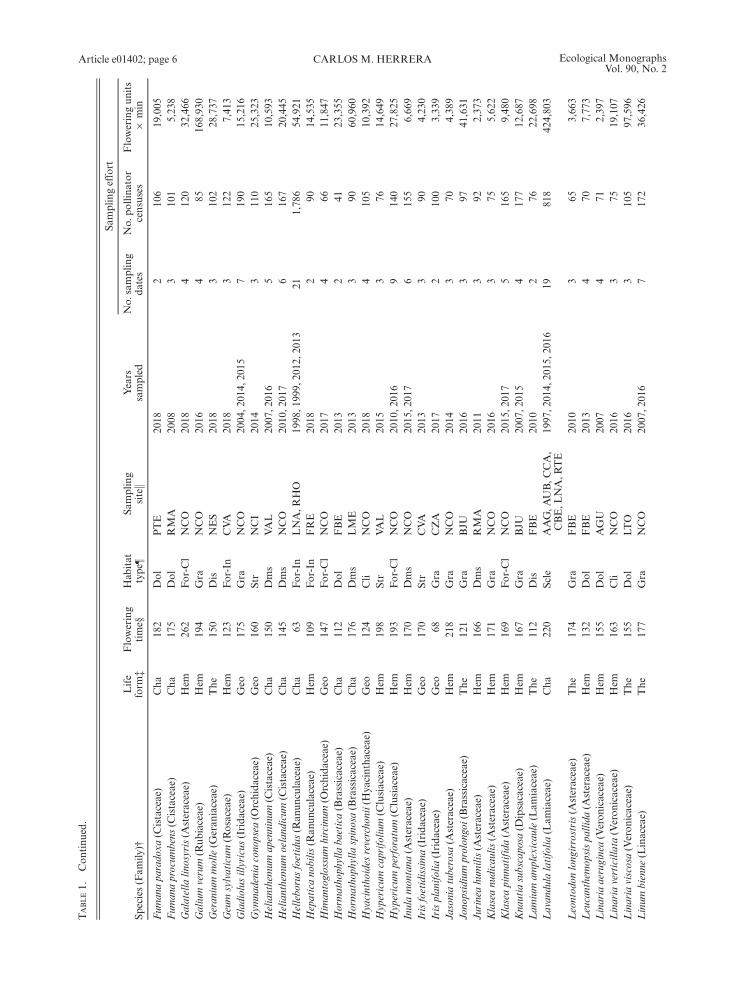
TABLE1.
Con
tinu
ed.
Species(Fam
ily)†
Life
form
‡Flowering
time§
Hab
itat
type¶
Sampling
sitek
Years
sampled
Samplingeffort
No.
sampling
dates
No.
pollina
tor
censuses
Floweringun
its
9min
Fum
anapa
radoxa
(Cistaceae)
Cha
182
Dol
PTE
2018
210
619
,005
Fum
anaprocum
bens
(Cistaceae)
Cha
175
Dol
RMA
2008
310
15,23
8Galatella
linosyris(A
steraceae)
Hem
262
For-C
lNCO
2018
412
032
,466
Galium
verum
(Rub
iaceae)
Hem
194
Gra
NCO
2016
485
168,930
Geran
ium
molle(G
eran
iaceae)
The
150
Dis
NES
2018
310
228
,737
Geum
sylvaticum
(Rosaceae)
Hem
123
For-In
CVA
2018
312
27,41
3Gladiolus
illyricus
(Irida
ceae)
Geo
175
Gra
NCO
2004
,201
4,20
157
190
15,216
Gym
nadeniacono
psea
(Orchida
ceae)
Geo
160
Str
NCI
2014
311
025
,323
Helianthemum
apenninum
(Cistaceae)
Cha
150
Dms
VAL
2007,2
016
5165
10,593
Helianthemum
oelandicum
(Cistaceae)
Cha
145
Dms
NCO
2010,2
017
6167
20,445
Helleborusfoetidus
(Ran
unculaceae)
Cha
63For-In
LNA,R
HO
1998
,199
9,20
12,2
013
211,78
654
,921
Hepaticano
bilis
(Ran
unculaceae)
Hem
109
For-In
FRE
2018
290
14,535
Him
antoglossum
hircinum
(Orchida
ceae)
Geo
147
For-C
lNCO
2017
466
11,847
Hormathophylla
baetica(Brassicaceae)
Cha
112
Dol
FBE
2013
241
23,355
Hormathophylla
spinosa(Brassicaceae)
Cha
176
Dms
LME
2013
390
60,960
Hyacintho
ides
revercho
nii(Hyacintha
ceae)
Geo
124
Cli
NCO
2018
410
510
,392
Hypericum
caprifolium
(Clusiaceae)
Hem
198
Str
VAL
2015
376
14,649
Hypericum
perforatum
(Clusiaceae)
Hem
193
For-C
lNCO
2010,2
016
9140
27,825
Inulamon
tana
(Asteraceae)
Hem
170
Dms
NCO
2015
,201
76
155
6,66
9Irisfoetidissima(Irida
ceae)
Geo
170
Str
CVA
2013
390
4,23
0Irisplan
ifolia
(Irida
ceae)
Geo
68Gra
CZA
2017
210
03,33
9Jasoniatuberosa
(Asteraceae)
Hem
218
Gra
NCO
2014
370
4,38
9Jono
psidium
prolon
goi(Brassicaceae)
The
121
Gra
BJU
2016
397
41,631
Jurineahu
milis(A
steraceae)
Hem
166
Dms
RMA
2011
392
2,37
3Klaseanu
dicaulis(A
steraceae)
Hem
171
Gra
NCO
2016
375
5,622
Klaseapinn
atifida(A
steraceae)
Hem
169
For-C
lNCO
2015
,201
75
165
9,48
0Kna
utia
subscaposa
(Dipsacaceae)
Hem
167
Gra
BJU
2007
,201
54
177
12,687
Lam
ium
amplexicau
le(Lam
iaceae)
The
112
Dis
FBE
2010
276
22,698
Lavan
dula
latifolia
(Lam
iaceae)
Cha
220
Scle
AAG,A
UB,C
CA,
CBE,L
NA,R
TE
1997
,201
4,20
15,2
016
1981
842
4,803
Leontodon
long
irrostris(A
steraceae)
The
174
Gra
FBE
2010
365
3,66
3Leucanthemopsispallida
(Asteraceae)
Hem
132
Dol
FBE
2013
470
7,773
Linaria
aeruginea(Veron
icaceae)
Hem
155
Dol
AGU
2007
471
2,39
7Linaria
verticillata(Veron
icaceae)
Hem
163
Cli
NCO
2016
375
19,107
Linaria
viscosa(Veron
icaceae)
The
155
Dol
LTO
2016
310
597
,596
Linum
bienne
(Linaceae)
The
177
Gra
NCO
2007
,201
67
172
36,426
Article e01402; page 6 CARLOS M. HERRERA Ecological MonographsVol. 90, No. 2
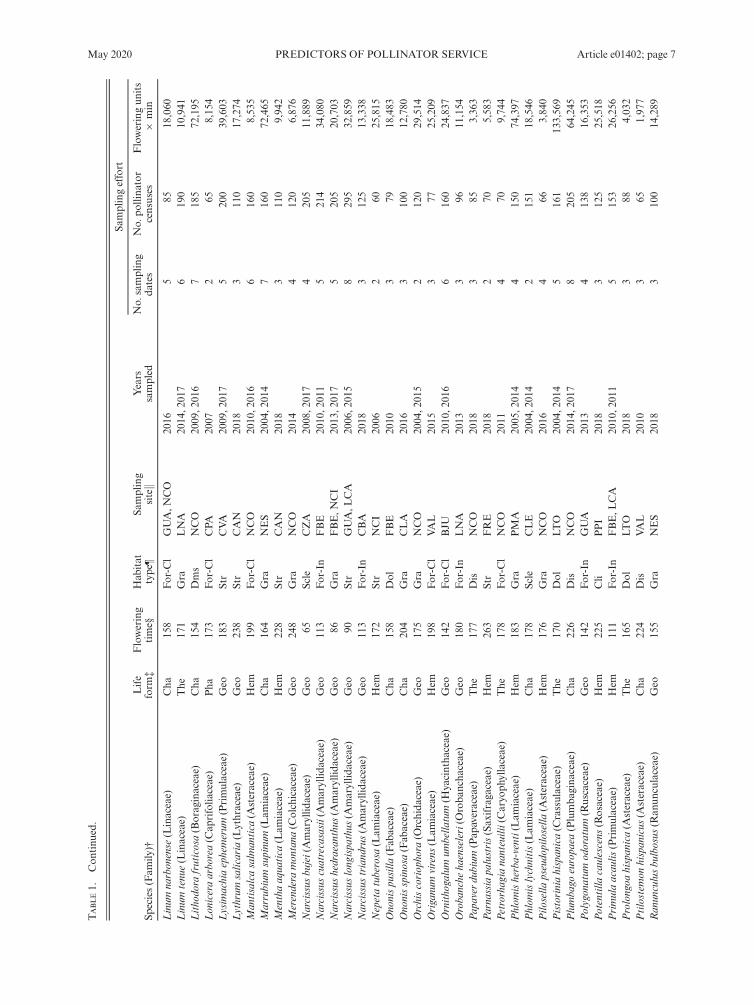
TABLE1.
Con
tinu
ed.
Species(Fam
ily)†
Life
form
‡Flowering
time§
Hab
itat
type¶
Sampling
sitek
Years
sampled
Samplingeffort
No.
sampling
dates
No.
pollina
tor
censuses
Floweringun
its
9min
Linum
narbon
ense
(Linaceae)
Cha
158
For-C
lGUA,N
CO
2016
585
18,060
Linum
tenu
e(Linaceae)
The
171
Gra
LNA
2014
,201
76
190
10,941
Lithodo
rafruticosa(Boraginaceae)
Cha
154
Dms
NCO
2009
,201
67
185
72,195
Loniceraarbo
rea(C
aprifolia
ceae)
Pha
173
For-C
lCPA
2007
265
8,15
4Lysim
achiaephemerum
(Primulaceae)
Geo
183
Str
CVA
2009
,201
75
200
39,603
Lythrum
salicaria
(Lythraceae)
Geo
238
Str
CAN
2018
311
017
,274
Man
tisalcasalm
antica
(Asteraceae)
Hem
199
For-C
lNCO
2010
,201
66
160
8,53
5Marrubium
supinum
(Lam
iaceae)
Cha
164
Gra
NES
2004
,201
47
160
72,465
Menthaaq
uatica
(Lam
iaceae)
Hem
228
Str
CAN
2018
311
09,94
2Merendera
mon
tana
(Colchicaceae)
Geo
248
Gra
NCO
2014
412
06,87
6Narcissus
bujei(Amaryllid
aceae)
Geo
65Scle
CZA
2008,2
017
4205
11,889
Narcissus
cuatrecasasii(Amaryllid
aceae)
Geo
113
For-In
FBE
2010,2
011
5214
34,080
Narcissus
hedraean
thus
(Amaryllid
aceae)
Geo
86Gra
FBE,N
CI
2013
,201
75
205
20,703
Narcissus
long
ispa
thus
(Amaryllid
aceae)
Geo
90Str
GUA,L
CA
2006,2
015
8295
32,859
Narcissus
triand
rus(A
maryllid
aceae)
Geo
113
For-In
CBA
2018
312
513
,338
Nepetatuberosa
(Lam
iaceae)
Hem
172
Str
NCI
2006
260
25,815
Ono
nispu
silla
(Fab
aceae)
Cha
158
Dol
FBE
2010
379
18,483
Ono
nisspinosa(Fab
aceae)
Cha
204
Gra
CLA
2016
310
012
,780
Orchiscoriop
hora
(Orchida
ceae)
Geo
175
Gra
NCO
2004
,201
52
120
29,514
Origanu
mvirens
(Lam
iaceae)
Hem
198
For-C
lVAL
2015
377
25,209
Ornitho
galum
umbella
tum
(Hyacintha
ceae)
Geo
142
For-C
lBJU
2010
,201
66
160
24,837
Oroba
nche
haenseleri(O
roba
ncha
ceae)
Geo
180
For-In
LNA
2013
396
11,154
Pap
aver
dubium
(Pap
averaceae)
The
177
Dis
NCO
2018
385
3,36
3Parna
ssia
palustris(Saxifraga
ceae)
Hem
263
Str
FRE
2018
270
5,58
3Petrorhag
iana
nteuilii(Caryo
phyllaceae)
The
178
For-C
lNCO
2011
470
9,74
4Phlom
isherba-venti(Lam
iaceae)
Hem
183
Gra
PMA
2005
,201
44
150
74,397
Phlom
islychnitis(Lam
iaceae)
Cha
178
Scle
CLE
2004
,201
42
151
18,546
Pilo
sella
pseudo
pilosella
(Asteraceae)
Hem
176
Gra
NCO
2016
466
3,84
0Pistoriniahispanica(C
rassulaceae)
The
170
Dol
LTO
2004
,201
45
161
133,569
Plumba
goeuropa
ea(Plumba
gina
ceae)
Cha
226
Dis
NCO
2014
,201
78
205
64,245
Polygon
atum
odoratum
(Ruscaceae)
Geo
142
For-In
GUA
2013
413
816
,353
Potentilla
caulescens
(Rosaceae)
Hem
225
Cli
PPI
2018
312
525
,518
Primulaacaulis
(Primulaceae)
Hem
111
For-In
FBE,L
CA
2010
,201
15
153
26,256
Prolongoa
hispanica(A
steraceae)
The
165
Dol
LTO
2018
388
4,03
2Ptilostem
onhispanicus
(Asteraceae)
Cha
224
Dis
VAL
2010
365
1,97
7Ran
unculusbu
lbosus
(Ran
unculaceae)
Geo
155
Gra
NES
2018
310
014
,289
May 2020 PREDICTORS OF POLLINATOR SERVICE Article e01402; page 7

TABLE1.
Con
tinu
ed.
Species(Fam
ily)†
Life
form
‡Flowering
time§
Hab
itat
type¶
Sampling
sitek
Years
sampled
Samplingeffort
No.
sampling
dates
No.
pollina
tor
censuses
Floweringun
its
9min
Ran
unculusficaria(R
anun
culaceae)
Geo
127
For-In
NCO
2018
310
86,28
2Ran
unculusmalessanus(R
anun
culaceae)
Geo
120
Gra
NCI
2015
395
11,760
Rha
gadiolus
edulis(A
steraceae)
The
165
For-In
LNA
2018
395
14,361
Roemeria
argemone(Pap
averaceae)
The
145
Gra
BJU
2016
490
4,33
8Rosacanina
(Rosaceae)
Pha
160
For-C
lPMA
2014
375
6,94
8Rosamicrantha
(Rosaceae)
Pha
181
For-C
lNCO
2010,2
017
714
510
,422
Rosasicula
(Rosaceae)
Pha
175
For-C
lNCO
2014
380
4,74
9Rosmarinus
officinalis
(Lam
iaceae)
Pha
140
Scle
GUA
2004,2
017
416
688
,515
Rub
usulmifolius(R
osaceae)
Pha
191
For-C
lRHO
2012
295
5,06
1Salvialavand
ulifolia
(Lam
iaceae)
Cha
185
Scle
AGU
2009
272
6,91
2Salviaverbenaca(Lam
iaceae)
Hem
133
Dis
BJU
2015
390
5,72
7San
tolin
arosm
arinifolia
(Asteraceae)
Cha
192
Dms
NCO
2010,2
015
813
029
,889
Sap
onaria
ocym
oides(C
aryo
phyllaceae)
Hem
153
For-In
VAL
2004,2
017
214
170
,680
Saturejaintricata(Lam
iaceae)
Cha
193
Dms
NCO
2010,2
015
614
768
,655
Sax
ifraga
haenseleri(Saxifraga
ceae)
Hem
132
Dol
FBE
2013
477
34,758
Scabiosaan
dryaefolia
(Dipsacaceae)
Hem
182
For-C
lBCA
2005
262
2,17
5Scilla
paui
(Hyacintha
ceae)
Geo
121
Gra
NCI
2015
390
16,113
Scorzon
eraalbicans
(Asteraceae)
Hem
160
Dol
NCO
2016
570
4,32
3Sedum
albu
m(C
rassulaceae)
Cha
185
Dms
NCO
2010,2
017
516
57,30
5Sedum
mucizon
ia(C
rassulaceae)
The
172
Dol
LTO
2013
310
071
,640
Senecio
doria(A
steraceae)
Hem
222
Str
CBE
2014
474
6,04
2Seselim
ontanu
m(A
piaceae)
Geo
266
For-C
lNCO
2018
412
020
,079
Sideritisincana
(Lam
iaceae)
Cha
178
Dol
RMA
2008,2
014
613
054
,819
Silene
colorata
(Caryo
phyllaceae)
The
155
Dis
LTO
2016
492
16,218
Silene
psam
mitis(C
aryo
phyllaceae)
The
149
Dol
GUA
2004,2
016
413
221
,645
Sisym
brella
aspera
(Brassicaceae)
Hel
171
Str
NCO
2010,2
016
8180
39,942
Sisym
brium
crassifoliu
m(Brassicaceae)
Hem
146
For-C
lLCA
2013
370
14,814
Solidagovirgau
rea(A
steraceae)
Hem
235
For-In
CBE
2018
310
014
,112
Son
chus
aqua
tilis
(Asteraceae)
Hem
232
Str
CBE
2018
391
4,866
Stachys
officina
lis(Lam
iaceae)
Hem
190
Gra
NCO
2010,2
015
813
849
,356
Tarax
acum
laevigatum
(Asteraceae)
Hem
145
Gra
NES
2018
312
06,45
9Teucrium
aureum
(Lam
iaceae)
Cha
180
Dms
NCO
2006,2
014
414
210
6,956
Teucrium
rotundifolium
(Lam
iaceae)
Cha
176
Cli
NCO
2007,2
016
618
149
,818
Teucrium
webbian
um(Lam
iaceae)
Cha
192
Dms
RMA
2009
481
8,53
5Thymus
mastichina(Lam
iaceae)
Cha
169
Scle
LNA
2004,2
014
516
080
,343
Thymus
orospeda
nus(Lam
iaceae)
Cha
153
Dms
VAL
2004,2
016
416
317
2,485
Article e01402; page 8 CARLOS M. HERRERA Ecological MonographsVol. 90, No. 2
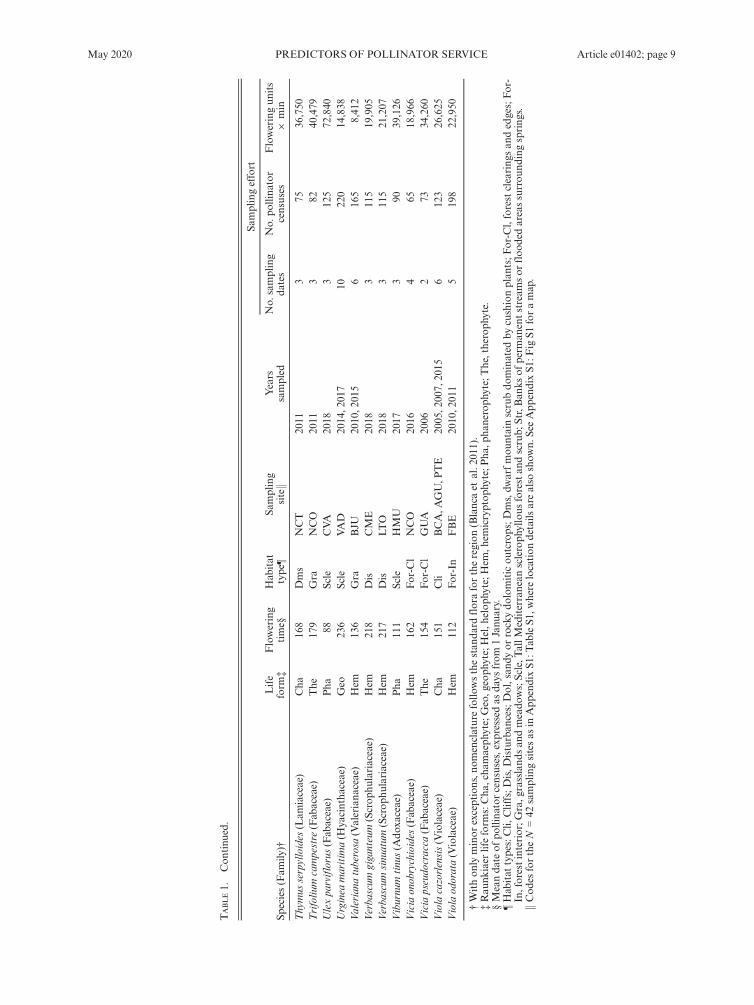
TABLE1.
Con
tinu
ed.
Species(Fam
ily)†
Life
form
‡Flowering
time§
Hab
itat
type¶
Sampling
sitek
Years
sampled
Samplingeffort
No.
sampling
dates
No.
pollina
tor
censuses
Floweringun
its
9min
Thymus
serpylloides
(Lam
iaceae)
Cha
168
Dms
NCT
2011
375
36,750
Trifoliu
mcampestre
(Fab
aceae)
The
179
Gra
NCO
2011
382
40,479
Ulexpa
rviflorus(Fab
aceae)
Pha
88Scle
CVA
2018
312
572
,840
Urginea
maritim
a(H
yacintha
ceae)
Geo
236
Scle
VAD
2014,2
017
1022
014
,838
Valeriana
tuberosa
(Valeriana
ceae)
Hem
136
Gra
BJU
2010,2
015
616
58,41
2Verba
scum
giganteum
(Scrop
hulariaceae)
Hem
218
Dis
CME
2018
311
519
,905
Verba
scum
sinu
atum
(Scrop
hulariaceae)
Hem
217
Dis
LTO
2018
311
521
,207
Viburnum
tinus(A
doxa
ceae)
Pha
111
Scle
HMU
2017
390
39,126
Vicia
onobrychioides
(Fab
aceae)
Hem
162
For-C
lNCO
2016
465
18,966
Vicia
pseudo
cracca
(Fab
aceae)
The
154
For-C
lGUA
2006
273
34,260
Viola
cazorlensis(V
iolaceae)
Cha
151
Cli
BCA,A
GU,P
TE
2005,2
007,
2015
612
326
,625
Viola
odorata(V
iolaceae)
Hem
112
For-In
FBE
2010,2
011
5198
22,950
†Withon
lyminor
exceptions,n
omenclaturefollo
wsthestan
dard
florafortheregion
(Blancaet
al.2
011).
‡Rau
nkiaer
lifeform
s:Cha
,cha
maeph
yte;Geo,g
eoph
yte;Hel,h
elop
hyte;H
em,h
emicryptop
hyte;P
ha,p
haneroph
yte;The,theroph
yte.
§Meanda
teof
pollina
torcensuses,exp
ressed
asda
ysfrom
1Janu
ary.
¶Hab
itat
types:Cli,
Cliffs;D
is,D
isturban
ces;Dol,san
dyor
rockydo
lomiticou
tcrops;D
ms,dw
arfmou
ntainscrubdo
minated
bycushionplan
ts;F
or-C
l,forestclearing
san
dedges;For-
In,forestinterior;G
ra,g
rassland
san
dmeado
ws;Scle,T
allM
editerranean
scleroph
yllous
forestan
dscrub;
Str,Ban
ksof
perm
anentstream
sor
floo
dedareassurrou
ndingspring
s.kC
odes
fortheN
=42
samplingsitesas
inApp
endixS1
:TableS1
,where
location
details
arealso
show
n.SeeApp
endixS1
:Fig
S1foramap.
May 2020 PREDICTORS OF POLLINATOR SERVICE Article e01402; page 9
about one-third of species studied are not available topollinators in the afternoon, as their corollas wither,close, or fall shortly after noon, and earlier studies in thearea have also shown that insect pollinator activity decli-nes considerably in the afternoon (Herrera 1990, 1995a;C. M. Herrera, personal observations). For four species(Daphne gnidium, D. laureola, Origanum virens, Silenecolorata) there was some circumstantial evidence sug-gesting the existence of additional crepuscular or noctur-nal pollinators (e.g., crab spiders with captured moths).Several factors precluded fulfilling all the preceding rulesfor some species in some sites or years, including longspells of poor weather, logistic problems and destructionof flowering patches by herbivorous mammals. Numberof distinct sampling dates, number of censuses, andflower-minutes of observational effort for every speciesare summarized in Table 1. This study is based on polli-nator visitation data obtained in a total of 24,866 polli-nator censuses carried out on 510 different dates andaccounting for a total watching effort of 5,414,856flower-minutes. With the only exceptions noted inAcknowledgments (Helleborus foetidus, Aquilegia vul-garis), I conducted all censuses throughout this studypersonally, thus results are unaffected by inter-observerheterogeneity.
Pollinator identification
Pollinators recorded during censuses were identifiedusing the methods described by Herrera (2019). Insecttaxonomists that contributed identifications for thisstudy are listed in Acknowledgments. Out of a total of30,463 individual pollinators recorded in censuses,79.1% were identified to species, 4.1% were assigned tocryptic species pairs of congeneric species, and 15.6%were identified to genus. Orders will be the only taxo-nomic level considered in this paper. Close-up pho-tographs of pollinators visiting flowers were takenroutinely during censuses using a DSLR digital cameraand 105 mm macro lens. These photographs were usedfor insect identification, keeping photographic vouchersof pollinators, and ascertaining the pollinating status ofdifferent insect taxa. Only taxa whose individuals con-tacted anthers or stigmas, or had visible pollen grains onbody surfaces, are considered as pollinators in this study.
Data analysis
Pollinator visitation.—Two probabilistic measurementswill be used here as complementary descriptors of polli-nator service, namely “patch visitation probability” and“flower visitation probability,” which depict the proba-bility of a flowering patch or a single flower being visitedby some pollinator during a 3-minute census. These twomeasurements estimate pollinator service from the view-point of the local flowering plant population and singleflowers, respectively. Each pollinator census providedpoint estimates of patch visitation (probability of at least
one flower in a patch being probed during a 3-minuteperiod) and flower visitation (probability of an individ-ual flower being probed during a 3-minute period) prob-abilities, and replication of censuses allowed calculationof parameter estimates in models and associated uncer-tainty measurements. See Herrera (2019) for additionaldetails and discussion on the motivation and advantagesof framing pollinator functional abundance in theseprobabilistic terms.The broad-scale pattern of interspecific variation in
proportional pollinator composition in the sample ofspecies studied was explored by performing nonmetricmultidimensional scaling (NMDS) on the matrix of pair-wise interspecific dissimilarity (Bray-Curtis distance) inproportional importance of the four major insect orders.NMDS provided an objective assessment of majortrends in pollinator composition occurring in the sam-ple. Computations were performed with the functionmetaMDS in the package vegan (Oksanen et al. 2019)for the R computing environment (R Core Team 2018;all statistical analyses in this paper were carried outusing R). To assess the relative importance of interspeci-fic variation in the species sample in relation to variationbetween sites and years, total sample variance in patchand flower visitation probabilities was dissected intocomponents due to variance among plant species, sam-pling sites, and sampling years. Generalized linear mixedmodels were fitted to pollinator census data, where plantspecies, sampling site and sampling year were includedas random effects, an intercept as the only fixed effect,and patch and flower visitation probabilities were theresponse variables, modeled as binomial processes. Foreach response variable, independent analyses were con-ducted for all pollinator taxa combined and for eachmajor insect order separately.
Floral and ecological predictors.—Three species-specificfloral features were examined as potential predictors ofpollinator visitation: class of floral perianth, type of pol-linator visitation unit (single flower vs. flower packet;Appendix S2: Fig. S1), and mean dry mass of visitationunit (log10-transformed for the analyses). All plant spe-cies were characterized for each of these three variables(Appendix S2: Table S1). Two discrete perianth classeswere recognized, corresponding respectively to open,more or less bowl-shaped, non-restrictive perianths(“open perianth” hereafter, N = 123 species), and closed,tubular, sympetalous or otherwise restrictive perianths(“restrictive perianth” hereafter, N = 68 species). Meandry mass of the visitation unit was obtained for each spe-cies by weighing samples of flowers or flower packetscollected at census localities. Samples were dried in anoven until constant mass prior to weighing. Dry mass ofthe visitation unit was used here as a convenient surro-gate for overall size, which could influence pollinator vis-itation through effects on pollen or nectar production.The broad heterogeneity in morphology and structure ofvisitation units occurring in the sample precluded
Article e01402; page 10 CARLOS M. HERRERA Ecological MonographsVol. 90, No. 2
dissection of flowering unit mass into components withdifferent functionalities in relation to pollinators thatwere comparable across species. This should be inconse-quential in the context of overall analyses because of theexpected positive relationship between overall flower sizeand pollinator reward or attraction (e.g., Plowright1981, Herrera 1985, Stanton and Preston 1988).To assess possible environmental influences on polli-
nator service, each plant species was assigned to one ofthe following nine habitat types (total species per habitatin parentheses): vertical rock cliffs (nine species); localdisturbances caused by humans, large mammals, or nat-ural abiotic processes (21); sandy or rocky dolomitic out-crops (23); dwarf mountain scrub dominated by cushionplants (21); forest edges and large clearings (30); forestinterior (18); patches of grasslands and meadows ondeep soils in relatively flat terrain (35); tall, denseMediterranean sclerophyllous forest and scrub (17);banks of permanent streams or flooded/damp areasaround springs (17). Individual species’ assignments tohabitat types are shown in Table 1. In the case of speciesthat occurred in more than one of these habitat types(~15% of total), the assignment considered only thehabitat where pollinator censuses were conducted, for itwas impractical to sample these species in all habitatswhere they occurred. This should be inconsequential toresults, since plant species and sampling sites were trea-ted as random effects in the analyses (see next para-graph) and conclusions on variation among habitatsreferred to a broad inference space beyond the limits ofthe specific samples studied.Two sets of generalized linear mixed models were fit-
ted to the data to test the effects on patch and flower vis-itation probability of species-specific floral traits(perianth type, visitation unit type, visitation unit mass)and habitat type, respectively, which were in each caseincluded as fixed effects. In each set of analyses, indepen-dent models were fitted using as response variables thevisitation probability by all pollinators combined and byeach major insect order considered separately. Binomialerror distribution and logit link function were used in allmodels, and plant species, sampling site, and samplingyear were included as random effects. For a large subsetof species considered here, Herrera (2019) found that inthe vast majority of species the number of flowers perpatch was directly related to patch visitation probability,and inversely related to flower visitation probability.Furthermore, in the study area patch and flower visita-tion probabilities increased from winter through springto summer (C. M. Herrera, unpublished data). Toaccount statistically for these effects, the number of flow-ers in each censused patch (scaled and centered) and thedate of the census (expressed as days from 1 January,scaled and centered) were included in all models asfixed-effect covariates.All generalized linear mixed models in this paper were
fitted with the glmer function in the lme4 package (Bateset al. 2015). They were checked for overdispersion using
function dispersion_glmer from the blmeco library (Kor-ner-Nievergelt et al. 2015). Weak overdispersion of somemodels was fixed by adding observation-level randomeffects to the data (Bolker 2015). Statistical significanceof fixed effects was determined by analysis of deviance-based, Type II Wald chi-square tests using the ANOVAfunction from the car package (Fox and Weisberg 2011).Confidence intervals of fixed effect parameter estimateswere obtained using the profile likelihood method imple-mented in the confint.merMod function of the lme4package. The function ggpredict from the ggeffects pack-age (L€udecke 2018) was used to compute marginaleffects of single predictors on measurements of pollina-tor visitation holding constant the rest of fixed effects inthe model.
Phylogenetic effects.—The relationship between pollina-tor visitation and plant phylogeny was examined by con-structing a phylogenetic tree for the set of species studiedand testing for the presence of a phylogenetic signal inthe species means for patch and flower visitation proba-bility, for all pollinators combined and separately foreach major insect order. The phylogenetic tree wasobtained using the phylomatic function in the brranch-ing package and the default storedtree = “R20120829”(Chamberlain 2018). Tree branch lengths were set tounity and polytomies resolved randomly using utilityfunctions compute.brlen and multi2di in the ape pack-age, respectively (Paradis and Schliep 2018). Phyloge-netic signal in pollinator visitation, defined as “atendency for related species to resemble each other morethan they resemble species drawn at random from thetree” (Blomberg and Garland 2002) was assessed withPagel’s k. This statistic, which assumes a Brownianmotion model of quantitative trait evolution, seemsstrongly robust to incompletely resolved phylogenies orsuboptimal branch-length information, and can be usedto assess the strength, or “effect size,” of phylogeneticstructuring (M€unkem€uller et al. 2012, Molina-Venegasand Rodr�ıguez 2017). To identify relevant “local hot-spots” of phylogenetic autocorrelation contributing dis-proportionately to overall phylogenetic signal inpollinator visitation, local Moran’s I (Ii) was computedfor each tip of the phylogenetic tree. This local indicatorof phylogenetic association (LIPA; Keck et al. 2016)allows for the decomposition of global phylogenetic sig-nal into the contributions due to individual observa-tions, and the LIPA for each tip in the phylogeny givesan indication of the extent of significant phylogeneticclustering of similar values around that tip (Anselin1995). Computations were performed using the packagephylosignal (Keck et al. 2016), and statistical signifi-cance of Pagel’s k and Ii was tested by randomization.A regression approach (Grafen 1989) based on
phylogenetic generalized least squares (PGLS; Paradis2012, Symonds and Blomberg 2014) was adopted toevaluate the importance of habitat type as predictor ofpatch and flower visitation probabilities after statistically
May 2020 PREDICTORS OF POLLINATOR SERVICE Article e01402; page 11
accounting for the phylogenetic correlations underlyingpollinator visitation data. Generalized linear mixed mod-els were fitted to species mean values using restrictedmaximum likelihood estimation, with either mean patchor mean flower visitation probabilities as response vari-ables. For each response variable, separate analyses wereperformed for all pollinators combined and for eachmajor insect order separately. Phylogenetic correlationswere incorporated into the models by setting the vari-ance–covariance structure between species to match thatexpected under a Brownian motion process of evolutionon the phylogenetic tree (Paradis 2012, Symonds andBlomberg 2014). Computations were performed withfunction gls in the nlme package (Pinheiro et al. 2018).The covariance structure between species was obtainedfrom the phylogenetic tree using the corBrownian func-tion of the ape package (Paradis 2012, Paradis and Sch-liep 2018).
RESULTS
The pollinators
Regional assemblage.—Hymenoptera (47.5% of individ-uals), Diptera (19.9%), Coleoptera (16.8%), and Lepi-doptera (15.2%) accounted for nearly all pollinatorsrecorded (N = 30,463 individuals) in the N = 191 plantspecies studied. Three additional insect orders, Hemi-ptera, Neuroptera, and Orthoptera, contributed alto-gether 0.5% of all individuals and will not be consideredhereafter. Coleoptera, Diptera, Hymenoptera, and Lepi-doptera were recorded in 62.3%, 88.5%, 97.9%, and62.3% of plant species studied, respectively.Pollinators identified at least to genus (N = 30,121)
belonged to 314 insect genera. Diptera (106 genera)exhibited the highest generic diversity, followed indecreasing order by Hymenoptera (86), Lepidoptera(62), and Coleoptera (53). Bees (families Andrenidae,Apidae, Colletidae, Halictidae, Megachilidae) accountedfor nearly all the Hymenoptera recorded (95.5% of indi-viduals). Truncated genus abundance curves for the 20most abundant genera in each order are shown inAppendix S3: Fig. S1. Dominance was similarly high inall orders, with a few genera accounting for most indi-viduals in every case: Anthrenus, Lobonyx, and Dasyteswere the three most abundant genera of Coleoptera(36.9% of total); Sphaerophoria, Bombylius, and Eristalisof Diptera (32.9%); Argynnis, Thymelicus, and Melanar-gia of Lepidoptera (41.0%); and Bombus, Andrena, andLasioglossum of Hymenoptera (33.5%).
Individual plant species’ assemblages.—Nearly all speciesstudied had taxonomically diverse pollinator assemblagesat the insect order level (Appendix S3: Table S1). Only 14species (7.3% of total) had pollinators belonging to singleinsect orders (e.g., Diptera: Saponaria ocymoides; Hyme-noptera: Digitalis obscura, Iris foetidissima, Ononis spi-nosa; Lepidoptera: Gymnadenia conopsea), while as many
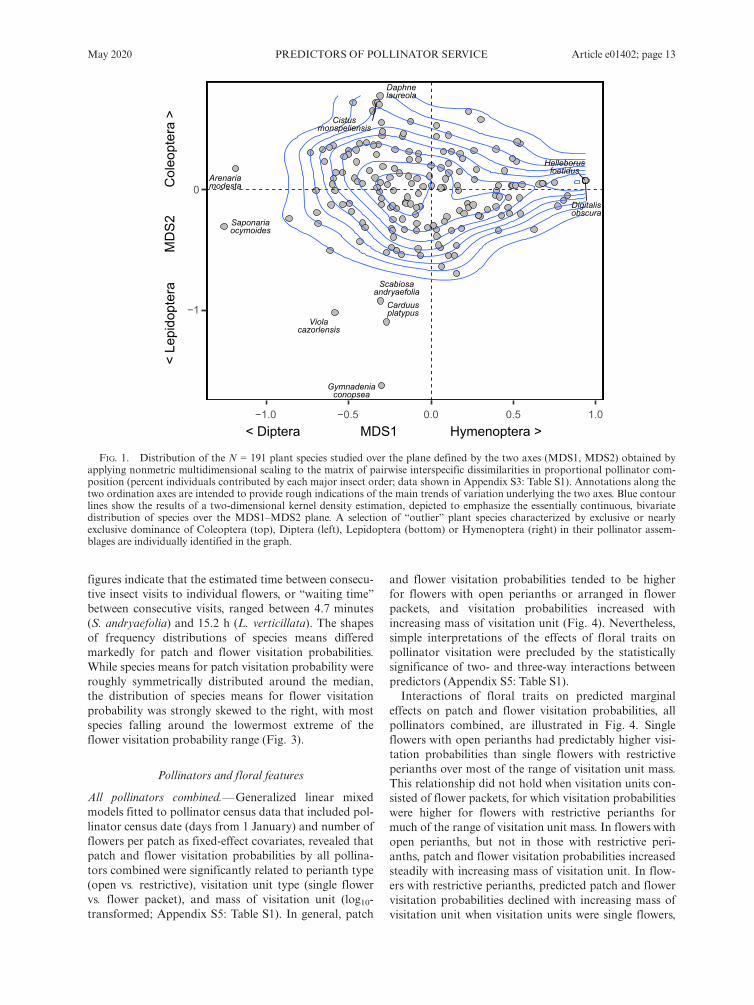
as 152 species (79.6% of total) had pollinators from threeor four different insect orders (Appendix S3: Table S1).With few exceptions, the proportional contributions ofColeoptera and Lepidoptera were consistently low inmost plant species, while the relative importance of Dip-tera and, particularly, Hymenoptera varied extensively(Appendix S3: Fig. S2). Ordination analysis of the matrixof interspecific dissimilarity in proportional importanceof the four major insect orders revealed an essentiallycontinuous, bivariate distribution of species over thereduced two-dimensional space obtained (Fig. 1). Thecloud of points was roughly centered on the bivariate ori-gin (0, 0), which corresponded to comparable contribu-tions of the four insect orders, and there was no evidenceof clusters or gaps indicative of the presence in the sampleof distinct groups of species with contrasting, differenti-ated pollinator types (Fig. 1). Some species falling aroundor beyond the periphery of the rather compact 191-spe-cies cluster did have pollinator assemblages strongly dom-inated by single insect orders. These included, forinstance, Gymnadenia conopsea, Carduus platypus (Lepi-doptera), Saponaria ocymoides, Arenaria modesta (Dip-tera), Cistus monspeliensis, Daphne laureola (Coleoptera),Digitalis obscura, and Helleborus foetidus (Hymenoptera;Fig. 1; see Appendix S3: Table S1 for details).
Sample variance components of pollinator visitation
For all pollinator taxa combined, variation amongplant species in pollinator visitation probabilities was byfar the chief source of sample variance in the whole dataset, and results were comparable for patch and flowervisitation probabilities (Table 2). Closely similar resultswere obtained when variance components due to species,sites, and years were computed only for subsets of spe-cies that were sampled on more than one year (N = 65species, Appendix S4: Table S1) or more than one site(N = 10 species, Appendix S4: Table S2). For the wholespecies sample, similar patterns held when separate anal-yses were conducted for each major insect order,although there existed some differences among orders inthe variance structure of patch and flower visitationprobabilities. Sample variance due to interspecific varia-tion was highest for visitation by Coleoptera and Lepi-doptera, and lowest for Diptera and Hymenoptera(Fig. 2), thus denoting greater interspecific heterogene-ity in patch and flower visitation probabilities by the for-mer two pollinator groups.The important interspecific variation in pollinator vis-
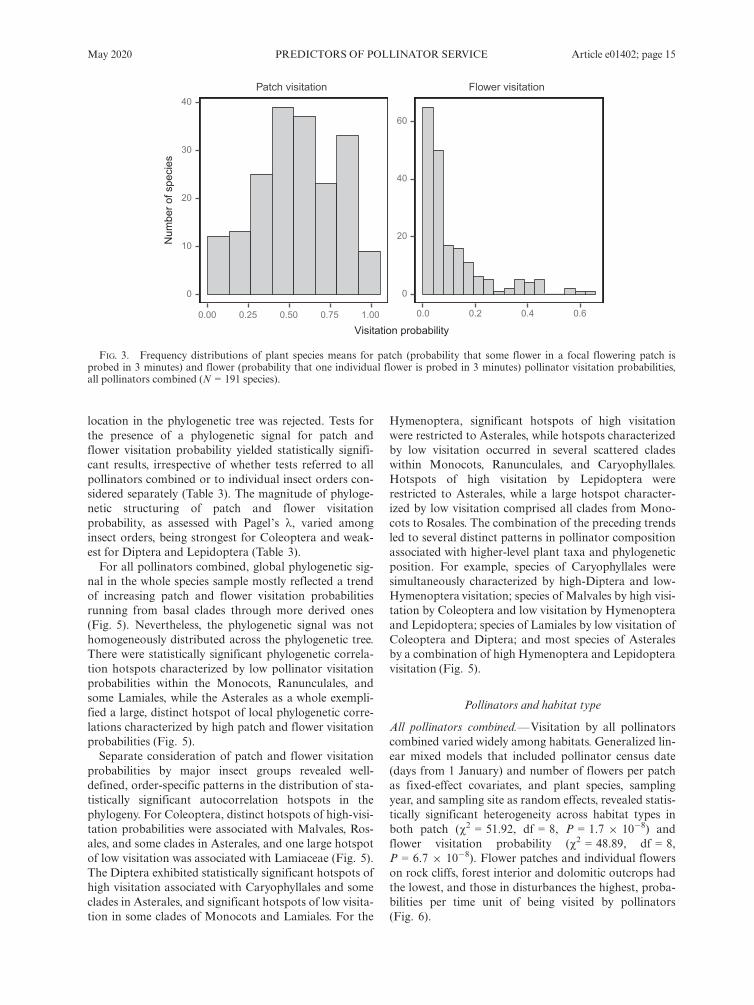
itation occurring in the sample was also apparent in thebroad range of species means for patch and flower visita-tion probabilities (Fig. 3), which spanned nearly threeorders of magnitude. Mean patch visitation probabilityper 3-minute period ranged between 0.0049 (Viola cazor-lensis) and 0.9857 (Jasonia tuberosa), or a 200-fold varia-tion. Mean flower visitation probability ranged between0.0033 (Linaria verticillata) and 0.644 (Scabiosa andryae-folia), or a 195-fold variation. Reciprocals of these
Article e01402; page 12 CARLOS M. HERRERA Ecological MonographsVol. 90, No. 2
figures indicate that the estimated time between consecu-tive insect visits to individual flowers, or “waiting time”between consecutive visits, ranged between 4.7 minutes(S. andryaefolia) and 15.2 h (L. verticillata). The shapesof frequency distributions of species means differedmarkedly for patch and flower visitation probabilities.While species means for patch visitation probability wereroughly symmetrically distributed around the median,the distribution of species means for flower visitationprobability was strongly skewed to the right, with mostspecies falling around the lowermost extreme of theflower visitation probability range (Fig. 3).
Pollinators and floral features
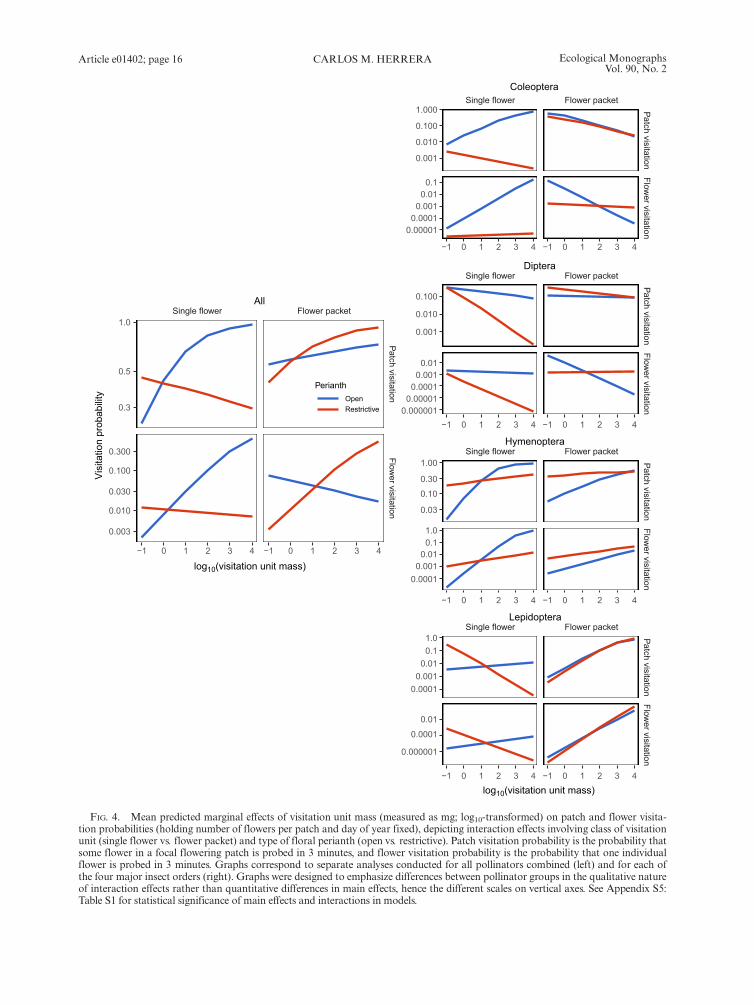
All pollinators combined.—Generalized linear mixedmodels fitted to pollinator census data that included pol-linator census date (days from 1 January) and number offlowers per patch as fixed-effect covariates, revealed thatpatch and flower visitation probabilities by all pollina-tors combined were significantly related to perianth type(open vs. restrictive), visitation unit type (single flowervs. flower packet), and mass of visitation unit (log10-transformed; Appendix S5: Table S1). In general, patch
and flower visitation probabilities tended to be higherfor flowers with open perianths or arranged in flowerpackets, and visitation probabilities increased withincreasing mass of visitation unit (Fig. 4). Nevertheless,simple interpretations of the effects of floral traits onpollinator visitation were precluded by the statisticallysignificance of two- and three-way interactions betweenpredictors (Appendix S5: Table S1).Interactions of floral traits on predicted marginal
effects on patch and flower visitation probabilities, allpollinators combined, are illustrated in Fig. 4. Singleflowers with open perianths had predictably higher visi-tation probabilities than single flowers with restrictiveperianths over most of the range of visitation unit mass.This relationship did not hold when visitation units con-sisted of flower packets, for which visitation probabilitieswere higher for flowers with restrictive perianths formuch of the range of visitation unit mass. In flowers withopen perianths, but not in those with restrictive peri-anths, patch and flower visitation probabilities increasedsteadily with increasing mass of visitation unit. In flow-ers with restrictive perianths, predicted patch and flowervisitation probabilities declined with increasing mass ofvisitation unit when visitation units were single flowers,
Arenariamodesta
Carduusplatypus
Cistusmonspeliensis
Daphnelaureola
Digitalisobscura
Gymnadeniaconopsea
Helleborusfoetidus
Saponariaocymoides
Scabiosaandryaefolia
Violacazorlensis
−1
0
−1.0 −0.5 0.0 0.5 1.0< Diptera MDS1 Hymenoptera >
< Le
pido
pter
aM
DS
2C
oleo
pter
a >
FIG. 1. Distribution of the N = 191 plant species studied over the plane defined by the two axes (MDS1, MDS2) obtained byapplying nonmetric multidimensional scaling to the matrix of pairwise interspecific dissimilarities in proportional pollinator com-position (percent individuals contributed by each major insect order; data shown in Appendix S3: Table S1). Annotations along thetwo ordination axes are intended to provide rough indications of the main trends of variation underlying the two axes. Blue contourlines show the results of a two-dimensional kernel density estimation, depicted to emphasize the essentially continuous, bivariatedistribution of species over the MDS1–MDS2 plane. A selection of “outlier” plant species characterized by exclusive or nearlyexclusive dominance of Coleoptera (top), Diptera (left), Lepidoptera (bottom) or Hymenoptera (right) in their pollinator assem-blages are individually identified in the graph.
May 2020 PREDICTORS OF POLLINATOR SERVICE Article e01402; page 13

but the trend was reversed when visitation units con-sisted of flower packets.
Major insect orders.—Patch and flower visitation proba-bilities by each major insect order were significantlyrelated to perianth type, visitation unit type, and mass ofvisitation unit, and in every case, there were also statisti-cally significant interactions among floral traits(Appendix S5: Table S1). Major insect groups differed
widely in detailed aspects of the relationships betweenvisitation probabilities and combinations of floral fea-tures, as shown by the interaction graphs shown inFig. 4. Among plants with single flowers and open peri-anths, visitation by Coleoptera and Hymenoptera, butnot by Diptera and Lepidoptera, increased steeply withincreasing visitation unit mass. In species with singleflowers and restrictive perianths, in contrast, there was asteep decline in visitation by Diptera and Lepidoptera,but not by Coleoptera and Hymenoptera, with increas-ing visitation unit mass. In plants with flower packets asvisitation units, patch and flower visitation probabilitiesby Hymenoptera and, particularly, Lepidoptera,increased with increasing visitation unit mass, while visi-tation by other groups remained stable (Diptera) ordeclined slightly (Coleoptera), and patterns were closelysimilar for species with open and restrictive perianths.Taken together, these results denote sharply contrasting,complex responses of the four major insect groups tointerspecific variation in individual floral features and,particularly, the different trait combinations representedin the large set of plant species studied.
Pollinators and phylogenetic relationships
The phylogenetic tree depicting evolutionary relation-ships among the plant species studied is shown inAppendix S6: Fig. S1. The hypothesis that mean valuesof patch and flower pollinator visitation probabilities forindividual plant species were independent from their
TABLE 2. Variance components of patch and flower visitationprobability (all pollinators combined) accounted for by plantspecies, sampling site, and sampling year in the data setstudied.
Random effect
Variance (95% confidence interval)
Patch visitationprobability
Flower visitationprobability
Plant species(N = 191)
1.429 (1.143–1.805) 1.610 (1.304–2.015)
Sampling site(N = 42)
0.147 (0.059–0.363) 0.491 (0.270–0.939)
Sampling year(N = 19)
0.068 (0.026–0.178) 0.235 (0.122–0.519)
Notes: Variance components were obtained by fitting gener-alized linear mixed models to the pollinator census data(N = 24,866 pollinator censuses), with species, site, and year asrandom effects and the intercept as the only fixed effect.Response variables were modeled as binomial processes. Patchvisitation probability is the probability of at least one flower ina patch being probed during a 3-minute period. Flower visita-tion probability is the probability of visitation of an individualflower during a 3-minute period.
Patch visitation Flower visitation
Plantspecies
Site Year Plantspecies
Site Year
0
3
6
9
0
2
4
6
Random effect
Varia
nce
Coleoptera Diptera Hymenoptera Lepidoptera
FIG. 2. Variance components of patch and flower visitation probability accounted for by plant species, sampling site, and sam-pling year in the data set studied, estimated separately for each major insect order. Patch visitation probability is the probability thatsome flower in a focal flowering patch is probed in 3 minutes and flower visitation probability is the probability that one individualflower is probed in 3 minutes. See Table 2 for the results for all pollinators combined.
Article e01402; page 14 CARLOS M. HERRERA Ecological MonographsVol. 90, No. 2
location in the phylogenetic tree was rejected. Tests forthe presence of a phylogenetic signal for patch andflower visitation probability yielded statistically signifi-cant results, irrespective of whether tests referred to allpollinators combined or to individual insect orders con-sidered separately (Table 3). The magnitude of phyloge-netic structuring of patch and flower visitationprobability, as assessed with Pagel’s k, varied amonginsect orders, being strongest for Coleoptera and weak-est for Diptera and Lepidoptera (Table 3).For all pollinators combined, global phylogenetic sig-
nal in the whole species sample mostly reflected a trendof increasing patch and flower visitation probabilitiesrunning from basal clades through more derived ones(Fig. 5). Nevertheless, the phylogenetic signal was nothomogeneously distributed across the phylogenetic tree.There were statistically significant phylogenetic correla-tion hotspots characterized by low pollinator visitationprobabilities within the Monocots, Ranunculales, andsome Lamiales, while the Asterales as a whole exempli-fied a large, distinct hotspot of local phylogenetic corre-lations characterized by high patch and flower visitationprobabilities (Fig. 5).Separate consideration of patch and flower visitation
probabilities by major insect groups revealed well-defined, order-specific patterns in the distribution of sta-tistically significant autocorrelation hotspots in thephylogeny. For Coleoptera, distinct hotspots of high-visi-tation probabilities were associated with Malvales, Ros-ales, and some clades in Asterales, and one large hotspotof low visitation was associated with Lamiaceae (Fig. 5).The Diptera exhibited statistically significant hotspots ofhigh visitation associated with Caryophyllales and someclades in Asterales, and significant hotspots of low visita-tion in some clades of Monocots and Lamiales. For the
Hymenoptera, significant hotspots of high visitationwere restricted to Asterales, while hotspots characterizedby low visitation occurred in several scattered cladeswithin Monocots, Ranunculales, and Caryophyllales.Hotspots of high visitation by Lepidoptera wererestricted to Asterales, while a large hotspot character-ized by low visitation comprised all clades from Mono-cots to Rosales. The combination of the preceding trendsled to several distinct patterns in pollinator compositionassociated with higher-level plant taxa and phylogeneticposition. For example, species of Caryophyllales weresimultaneously characterized by high-Diptera and low-Hymenoptera visitation; species of Malvales by high visi-tation by Coleoptera and low visitation by Hymenopteraand Lepidoptera; species of Lamiales by low visitation ofColeoptera and Diptera; and most species of Asteralesby a combination of high Hymenoptera and Lepidopteravisitation (Fig. 5).
Pollinators and habitat type
All pollinators combined.—Visitation by all pollinatorscombined varied widely among habitats. Generalized lin-ear mixed models that included pollinator census date(days from 1 January) and number of flowers per patchas fixed-effect covariates, and plant species, samplingyear, and sampling site as random effects, revealed statis-tically significant heterogeneity across habitat types inboth patch (v2 = 51.92, df = 8, P = 1.7 9 10�8) andflower visitation probability (v2 = 48.89, df = 8,P = 6.7 9 10�8). Flower patches and individual flowerson rock cliffs, forest interior and dolomitic outcrops hadthe lowest, and those in disturbances the highest, proba-bilities per time unit of being visited by pollinators(Fig. 6).
Patch visitation Flower visitation
0.00 0.25 0.50 0.75 1.00 0.0 0.2 0.4 0.6
0
20
40
60
0
10
20
30
40
Visitation probability
Num
ber o
f spe
cies
FIG. 3. Frequency distributions of plant species means for patch (probability that some flower in a focal flowering patch isprobed in 3 minutes) and flower (probability that one individual flower is probed in 3 minutes) pollinator visitation probabilities,all pollinators combined (N = 191 species).
May 2020 PREDICTORS OF POLLINATOR SERVICE Article e01402; page 15
Single flower Flower packet
Patch visitationFlow
er visitation
−1 0 1 2 3 4 −1 0 1 2 3 4
0.3
0.5
1.0
0.003
0.010
0.030
0.100
0.300
log10(visitation unit mass)
log10(visitation unit mass)
Vis
itatio
n pr
obab
ility
PerianthOpenRestrictive
All
Single flower Flower packetPatch visitation
Flower visitation
−1 0 1 2 3 4 −1 0 1 2 3 4
0.001
0.010
0.100
1.000
0.000010.0001
0.0010.01
0.1
0.0000010.00001
0.00010.001
0.01
0.00010.001
0.01
Coleoptera
Single flower Flower packet
Patch visitationFlow
er visitation
−1 0 1 2 3 4 −1 0 1 2 3 4
0.001
0.010
0.100
Diptera
Single flower Flower packet
Patch visitationFlow
er visitation
−1 0 1 2 3 4 −1 0 1 2 3 4
0.03
0.10
0.30
1.00
0.11.0
0.00010.001
0.010.11.0
0.01
0.0001
0.000001
Hymenoptera
Single flower Flower packet
Patch visitationFlow
er visitation
−1 0 1 2 3 4 −1 0 1 2 3 4
Lepidoptera
FIG. 4. Mean predicted marginal effects of visitation unit mass (measured as mg; log10-transformed) on patch and flower visita-tion probabilities (holding number of flowers per patch and day of year fixed), depicting interaction effects involving class of visitationunit (single flower vs. flower packet) and type of floral perianth (open vs. restrictive). Patch visitation probability is the probability thatsome flower in a focal flowering patch is probed in 3 minutes, and flower visitation probability is the probability that one individualflower is probed in 3 minutes. Graphs correspond to separate analyses conducted for all pollinators combined (left) and for each ofthe four major insect orders (right). Graphs were designed to emphasize differences between pollinator groups in the qualitative natureof interaction effects rather than quantitative differences in main effects, hence the different scales on vertical axes. See Appendix S5:Table S1 for statistical significance of main effects and interactions in models.
Article e01402; page 16 CARLOS M. HERRERA Ecological MonographsVol. 90, No. 2

Major insect orders.—Patch and flower visitation proba-bilities by major insect orders considered separately var-ied significantly among habitat types (P < 0.0001 in allcases), but the four groups did not vary in unison acrosshabitats. A generalized linear mixed model similar to theone described in the preceding paragraph but whosemain fixed effects were habitat type, insect order, andtheir interaction, revealed strong habitat 9 insect orderinteractions on both patch visitation (v2 = 1,461.6,df = 24, P < 2.2 9 10�16) and flower visitation probabil-ity (v2 = 9,848.8, df = 24, P < 2.2 9 10�16). Mean pre-dicted marginal effects of habitat type on patch andflower visitation probabilities (holding census date andnumber of flowers per patch fixed) for each insect orderare shown in Fig. 7. In general, patch and flower visita-tion by Hymenoptera varied relatively little across habitattypes, experiencing only minor reductions in dolomiticoutcrops, forest interior, and rock cliffs. The rest of insectorders did exhibit broad variations among habitat typesin patch and flower visitation. Coleoptera and Lepi-doptera were the two groups exhibiting the most markedchanges in patch and flower visitation probabilitiesacross habitat types. Coleoptera had particularly low visi-tation probabilities in disturbances, dolomitic outcrops,forest interior, and rock cliffs, and high visitations indwarf mountain scrub, grasslands and meadows, and tallsclerophyllous scrub. Lepidoptera visitation probabilitieswere highest in disturbances, forest clearings and edges,grasslands and meadows, and springs/streams, and low-est in forest interior and rock cliffs. Diptera had fairlyconstant, moderate-to-low-visitation probabilities in all
habitat types except forest interior and rock cliffs, wherethey reached minimum values (Fig. 7).There was a fairly predictable, habitat-dependent vari-
ation in proportional pollinator composition as a conse-quence of the decoupling across habitat types of patchand flower visitation probabilities by the different insectorders. Dwarf mountain scrub, grasslands and meadows,and forest clearings and edges, for example, were charac-terized by pollinator assemblages in which the fourinsect orders had roughly similar patch and flower visi-tation probabilities (Fig. 7). In dolomitic outcrops androck cliffs the pollinator assemblages tended to be domi-nated by Hymenoptera and Diptera, while combinationsof Hymenoptera, Diptera, and Lepidoptera were charac-teristic of disturbances and streams/springs.
Phylogenetic regressions on habitat type.—Results ofphylogenetic regressions of mean patch and flower visi-tation probability per species on habitat type differed insome respects from those obtained from models ignoringphylogenetic correlations underlying pollinator visita-tion. For all pollinators combined, statistically signifi-cant effects of habitat type on patch and flowervisitation probabilities persisted after controlling forphylogenetic correlations (Table 4). Patterns of variationamong habitats were also closely similar to thosedepicted in Fig. 6, with rock cliffs, forest interior, anddolomitic outcrops exhibiting lower overall visitationprobabilities than other habitat types (results notshown). Separate phylogenetic regressions for insectorders revealed statistically significant relationshipsbetween visitation probabilities and habitat type only forHymenoptera. The visitation–habitat relationships werestatistically nonsignificant for Coleoptera and Diptera,and significant for patch visitation only in the case ofLepidoptera (Table 4).
DISCUSSION
Many different approaches have been used over theyears to quantify pollinator visitation to flowers,although few of these allow for proper statistical com-parisons as noted in the Introduction. The method usedhere, whereby pollinator visitation rate is measured interms of the probability of flowering patches or individ-ual flowers being visited in a given length of time, over-comes these limitations and can be universally applied toany plant species (Herrera 2019). It must be stressed thatthis method, albeit without explicit recognition of itsprobabilistic connotations and analytical advantages,was proposed long ago and applied in community stud-ies by Arroyo et al. (1985) and Inouye and Pyke (1988).These authors also emphasized its value for comparativepurposes. Despite these advantages, however, not manystudies have adopted this method for quantifying polli-nator visitation in plant community contexts (e.g., Mot-ten 1986, Totland 1993, L�azaro et al. 2013). This fact, incombination with the much larger, phylogenetically
TABLE 3. Tests for the presence of phylogenetic signal inspecies means for patch visitation and flower visitationprobabilities.
Response variable and pollinator group
Pagel’s k
statistic P
Patch visitation probabilityAll pollinators 0.491 0.00001Coleoptera 0.651 0.00001Diptera 0.316 0.050Hymenoptera 0.376 0.00002Lepidoptera 0.208 0.00001
Flower visitation probabilityAll pollinators 0.422 0.00001Coleoptera 0.879 0.00001Diptera 0.125 0.12Hymenoptera 0.293 0.00033Lepidoptera 0.167 0.0013
Notes: Mean values for patch visitation and flower visitationprobabilities were computed for plant species, associated withthe corresponding tips in the phylogenetic tree (Appendix S6:Fig. S1), and tested for phylogenetic signal. Statistical signifi-cance was obtained by randomization with 105 repetitions.Patch visitation probability is the probability of at least oneflower in a patch being probed during a 3-minute period.Flower visitation probability is the probability of visitation ofan individual flower during a 3-minute period.
May 2020 PREDICTORS OF POLLINATOR SERVICE Article e01402; page 17
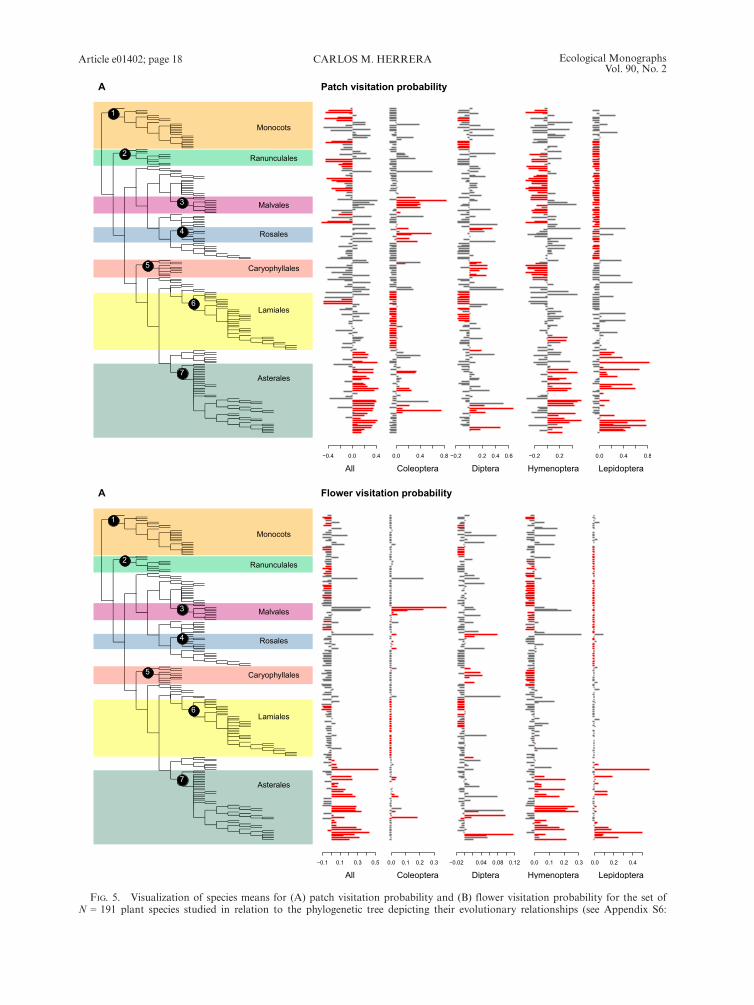
Patch visitation probabilityA
Flower visitation probabilityA
FIG. 5. Visualization of species means for (A) patch visitation probability and (B) flower visitation probability for the set ofN = 191 plant species studied in relation to the phylogenetic tree depicting their evolutionary relationships (see Appendix S6:
Article e01402; page 18 CARLOS M. HERRERA Ecological MonographsVol. 90, No. 2
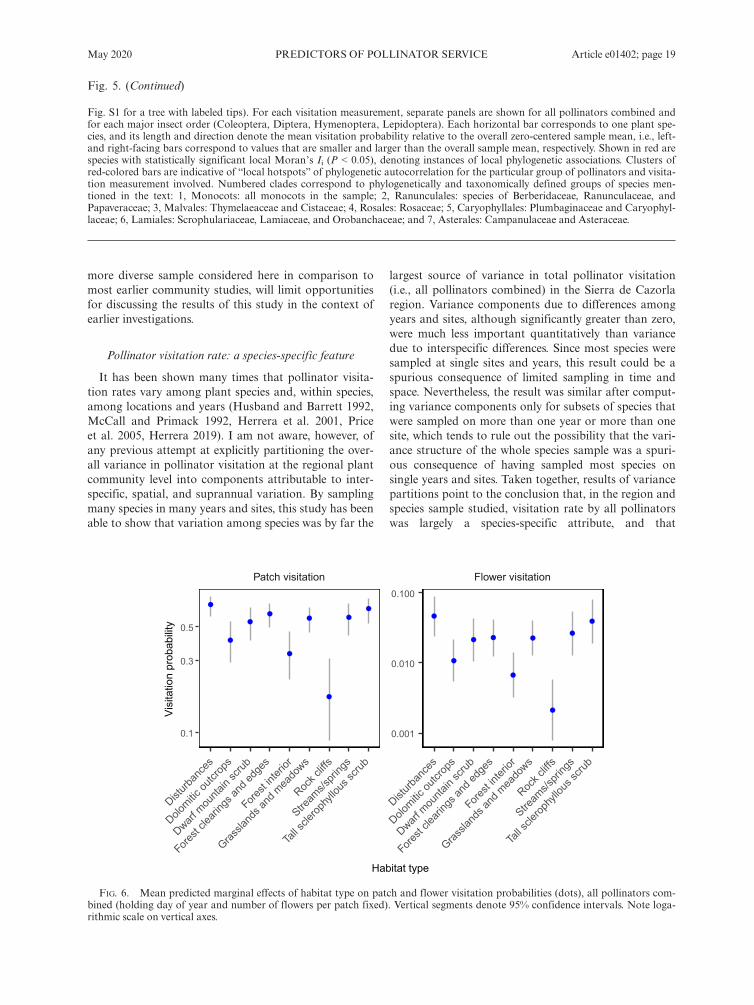
more diverse sample considered here in comparison tomost earlier community studies, will limit opportunitiesfor discussing the results of this study in the context ofearlier investigations.
Pollinator visitation rate: a species-specific feature
It has been shown many times that pollinator visita-tion rates vary among plant species and, within species,among locations and years (Husband and Barrett 1992,McCall and Primack 1992, Herrera et al. 2001, Priceet al. 2005, Herrera 2019). I am not aware, however, ofany previous attempt at explicitly partitioning the over-all variance in pollinator visitation at the regional plantcommunity level into components attributable to inter-specific, spatial, and suprannual variation. By samplingmany species in many years and sites, this study has beenable to show that variation among species was by far the
largest source of variance in total pollinator visitation(i.e., all pollinators combined) in the Sierra de Cazorlaregion. Variance components due to differences amongyears and sites, although significantly greater than zero,were much less important quantitatively than variancedue to interspecific differences. Since most species weresampled at single sites and years, this result could be aspurious consequence of limited sampling in time andspace. Nevertheless, the result was similar after comput-ing variance components only for subsets of species thatwere sampled on more than one year or more than onesite, which tends to rule out the possibility that the vari-ance structure of the whole species sample was a spuri-ous consequence of having sampled most species onsingle years and sites. Taken together, results of variancepartitions point to the conclusion that, in the region andspecies sample studied, visitation rate by all pollinatorswas largely a species-specific attribute, and that
Fig. S1 for a tree with labeled tips). For each visitation measurement, separate panels are shown for all pollinators combined andfor each major insect order (Coleoptera, Diptera, Hymenoptera, Lepidoptera). Each horizontal bar corresponds to one plant spe-cies, and its length and direction denote the mean visitation probability relative to the overall zero-centered sample mean, i.e., left-and right-facing bars correspond to values that are smaller and larger than the overall sample mean, respectively. Shown in red arespecies with statistically significant local Moran’s Ii (P < 0.05), denoting instances of local phylogenetic associations. Clusters ofred-colored bars are indicative of “local hotspots” of phylogenetic autocorrelation for the particular group of pollinators and visita-tion measurement involved. Numbered clades correspond to phylogenetically and taxonomically defined groups of species men-tioned in the text: 1, Monocots: all monocots in the sample; 2, Ranunculales: species of Berberidaceae, Ranunculaceae, andPapaveraceae; 3, Malvales: Thymelaeaceae and Cistaceae; 4, Rosales: Rosaceae; 5, Caryophyllales: Plumbaginaceae and Caryophyl-laceae; 6, Lamiales: Scrophulariaceae, Lamiaceae, and Orobanchaceae; and 7, Asterales: Campanulaceae and Asteraceae.
●
●
●●
●
●
●
●
●●
●
● ●
●
●
●
●
●
Patch visitation Flower visitation
Disturb
ance
s
Dolomitic
outcr
ops
Dwarf m
ounta
in sc
rub
Fores
t clea
rings
and e
dges
Fores
t inter
ior
Grassla
nds a
nd m
eado
ws
Rock c
liffs
Stream
s/spri
ngs
Tall s
clerop
hyllo
us sc
rub
Disturb
ance
s
Dolomitic
outcr
ops
Dwarf m
ounta
in sc
rub
Fores
t clea
rings
and e
dges
Fores
t inter
ior
Grassla
nds a
nd m
eado
ws
Rock c
liffs
Stream
s/spri
ngs
Tall s
clerop
hyllo
us sc
rub
0.001
0.010
0.100
0.1
0.3
0.5
Habitat type
Vis
itatio
n pr
obab
ility
FIG. 6. Mean predicted marginal effects of habitat type on patch and flower visitation probabilities (dots), all pollinators com-bined (holding day of year and number of flowers per patch fixed). Vertical segments denote 95% confidence intervals. Note loga-rithmic scale on vertical axes.
Fig. 5. (Continued)
May 2020 PREDICTORS OF POLLINATOR SERVICE Article e01402; page 19
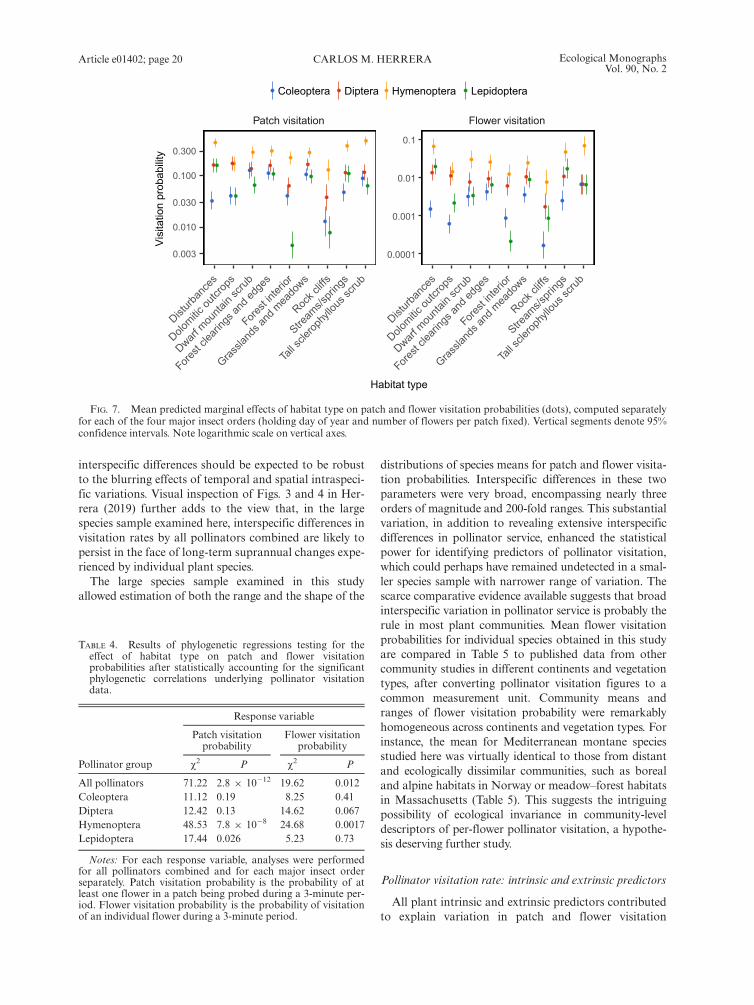
interspecific differences should be expected to be robustto the blurring effects of temporal and spatial intraspeci-fic variations. Visual inspection of Figs. 3 and 4 in Her-rera (2019) further adds to the view that, in the largespecies sample examined here, interspecific differences invisitation rates by all pollinators combined are likely topersist in the face of long-term suprannual changes expe-rienced by individual plant species.The large species sample examined in this study
allowed estimation of both the range and the shape of the
distributions of species means for patch and flower visita-tion probabilities. Interspecific differences in these twoparameters were very broad, encompassing nearly threeorders of magnitude and 200-fold ranges. This substantialvariation, in addition to revealing extensive interspecificdifferences in pollinator service, enhanced the statisticalpower for identifying predictors of pollinator visitation,which could perhaps have remained undetected in a smal-ler species sample with narrower range of variation. Thescarce comparative evidence available suggests that broadinterspecific variation in pollinator service is probably therule in most plant communities. Mean flower visitationprobabilities for individual species obtained in this studyare compared in Table 5 to published data from othercommunity studies in different continents and vegetationtypes, after converting pollinator visitation figures to acommon measurement unit. Community means andranges of flower visitation probability were remarkablyhomogeneous across continents and vegetation types. Forinstance, the mean for Mediterranean montane speciesstudied here was virtually identical to those from distantand ecologically dissimilar communities, such as borealand alpine habitats in Norway or meadow–forest habitatsin Massachusetts (Table 5). This suggests the intriguingpossibility of ecological invariance in community-leveldescriptors of per-flower pollinator visitation, a hypothe-sis deserving further study.
Pollinator visitation rate: intrinsic and extrinsic predictors
All plant intrinsic and extrinsic predictors contributedto explain variation in patch and flower visitation
●
●
●
●●
●●
●
●
●
●●●
●
●
●
●
●
●
●
●
●
●
●
●
●
●
●
●
●
●
●
●
●
●
●
●
●
●
●
●
●●
●
●
●
●
●
●
●
●
●
●
●
●
●
●
●
●
●
●
●
●
●
●
●
●
●
●
●
●●
Patch visitation Flower visitation
Disturb
ance
s
Dolomitic
outcr
ops
Dwarf m
ounta
in sc
rub
Fores
t clea
rings
and e
dges
Fores
t inter
ior
Grassla
nds a
nd m
eado
ws
Rock c
liffs
Stream
s/spri
ngs
Tall s
clerop
hyllo
us sc
rub
Disturb
ance
s
Dolomitic
outcr
ops
Dwarf m
ounta
in sc
rub
Fores
t clea
rings
and e
dges
Fores
t inter
ior
Grassla
nds a
nd m
eado
ws
Rock c
liffs
Stream
s/spri
ngs
Tall s
clerop
hyllo
us sc
rub
0.0001
0.001
0.01
0.1
0.003
0.010
0.030
0.100
0.300
Habitat type
Vis
itatio
n pr
obab
ility
● ● ● ●Coleoptera Diptera Hymenoptera Lepidoptera
FIG. 7. Mean predicted marginal effects of habitat type on patch and flower visitation probabilities (dots), computed separatelyfor each of the four major insect orders (holding day of year and number of flowers per patch fixed). Vertical segments denote 95%confidence intervals. Note logarithmic scale on vertical axes.
TABLE 4. Results of phylogenetic regressions testing for theeffect of habitat type on patch and flower visitationprobabilities after statistically accounting for the significantphylogenetic correlations underlying pollinator visitationdata.
Pollinator group
Response variable
Patch visitationprobability
Flower visitationprobability
v2 P v2 P
All pollinators 71.22 2.8 9 10�12 19.62 0.012Coleoptera 11.12 0.19 8.25 0.41Diptera 12.42 0.13 14.62 0.067Hymenoptera 48.53 7.8 9 10�8 24.68 0.0017Lepidoptera 17.44 0.026 5.23 0.73
Notes: For each response variable, analyses were performedfor all pollinators combined and for each major insect orderseparately. Patch visitation probability is the probability of atleast one flower in a patch being probed during a 3-minute per-iod. Flower visitation probability is the probability of visitationof an individual flower during a 3-minute period.
Article e01402; page 20 CARLOS M. HERRERA Ecological MonographsVol. 90, No. 2
probabilities, all pollinators combined. Among intrinsicpredictors, the simple floral traits considered, namelyperianth type, mass of visitation unit, and type of visita-tion unit, were all related to pollinator visitation. Simplefunctional relationships, however, could not be inferreddue to interactions between predictors. For example,pollinator visitation increased steadily with increasinglog mass of visitation unit, a surrogate for its size, butthis relationship only held for species with single flowerswith open perianths, or those with flower packets andrestrictive perianths, but not for species possessing othertrait combinations. Single flowers with open perianthstended to have higher visitation rates than those withrestrictive perianth, but these relationships did not heldfor flower packets. Comparable relationships have beenreported previously by the few studies that have exam-ined interspecific relationship between floral traits andpollinator visitation at the plant community level(McCall and Primack 1992, Hegland and Totland 2005,L�azaro et al. 2013). In the present instance, positive rela-tionships between pollinator visitation rates and logmass of visitation unit may be parsimoniously explainedas a consequence of the direct relationship between per-flower sugar secretion and flower log mass reported forsouthern Spanish plants (Herrera 1985), on the plausibleassumption that consistently greater floral rewardsshould favor greater average visitation rates.Another species-specific, intrinsic predictor having an
effect on patch and flower visitation probabilities wasthe evolutionary history of each species as representedby its phylogenetic relationships. There was, on one side,a global phylogenetic trend in the sample roughly reflect-ing an increasing trend in visitation probabilities from
basal through more derived clades. In addition, therewere phylogenetic correlation hotspots characterized byeither similarly low (Monocots, some Ranunculales,some Lamiales) or similarly high (most Asterales) polli-nator visitation probabilities. To my knowledge, no pre-vious study has examined variations in pollinatorvisitation rates in a broad phylogenetic framework, thusit is not possible to know whether phylogenetic patternsfound here are representative for the angiosperms as awhole or apply only to my species sample. In addition,an even more phylogenetically encompassing speciessample would be needed to ascertain whether phyloge-netic patterns occurring in my sample are linked to theevolutionary trajectories of floral traits considered hereor depend on other factors. Keeping these caveats inmind, two implications of the phylogenetic analysesshown here deserve consideration. First, the well-knowndifferences between taxonomic groups and evolutionarylineages in incidence of pollen limitation (Larson andBarrett 2000, Knight et al. 2005, Alonso et al. 2010,Vamosi et al. 2013, Bennett et al. 2018) could reflectunderlying, insufficiently recognized phylogenetic effectson pollinator visitation rates. It is worth noting in thisregard that the ubiquitous pollen limitation occurringwithin the plant order Asparagales (Bennett et al. 2018:Fig. 3) is consistent with the low pollinator visitationrates found here for Monocots, most of which belong toAsparagales. And second, because of the overall phylo-genetic signal and local hotspots of phylogenetic correla-tions in pollinator visitation, the taxonomic affiliation ofspecies chosen for pollination investigations can some-times predefine those conclusions of research thatdepend on pollinator visitation rates. This adds one
TABLE 5. Pollinator visitation rates (all pollinators combined) from community studies conducted in different regions andvegetation types.
Vegetation type and regionNo. plantspecies
Flower visitation probability(visits/minute)
ReferenceMean � SE Range
Mediterranean montane, Spain 191 0.037 � 0.003 0.0011–0.2146 this studyAlpine and boreal, Norway 41† 0.037 � 0.012 0.0003–0.4050 Totland (1993, 1994, 2001), Totland and Schulte-
Herbr€uggen (2003), Hansen and Totland (2006),Totland et al. (2006), Lundemo and Totland(2007), L�azaro et al. (2013); A. L�azaro (personalcommunication)
Alpine, Australia 36† 0.016 � 0.003 0.0002–0.0742 Inouye and Pyke (1988)Alpine tundra,New Hampshire, USA
35 0.022 � 0.057 ‡ McCall and Primack (1992)
Deciduous forest, USA 6 0.026 � 0.007 0.0050–0.0453 Motten (1986)Woodland-meadow (1982),Massachusetts, USA
124 0.035 � 0.101 ‡ McCall and Primack (1992)
Woodland-meadow (1983),Massachusetts, USA
108 0.034 � 0.069 ‡ McCall and Primack (1992)
Tropical forest, Central America 11 0.028 � 0.015 0.0027–0.1610 Kay and Schemske (2003)Mountain fynbos, South Africa 92 0.018 � 0.058 ‡ McCall and Primack (1992)
Notes: Original figures were transformed to common units. In each region, multiple data for the same species were averaged.† Only species with nonzero visitation records are included.‡ Visitation probabilities estimates for individual species were not available in the original publication.
May 2020 PREDICTORS OF POLLINATOR SERVICE Article e01402; page 21

more instance to the growing list of challenges to polli-nation studies due to unacknowledged geographic ortaxonomic biases (Rodger et al. 2004, Archer et al.2014, Ollerton et al. 2015, Herrera 2019).Habitat type was a significant predictor of pollinator
visitation rate. Among the nine habitat types recognized,dolomitic outcrops, forest interior, and, particularly,rock cliffs were characterized by comparatively low polli-nator visitation at both the flowering patch and individ-ual flower levels. These patterns could arise fromhabitat-specific ecological factors influencing pollinatorvisitation but, given the strong phylogenetic signal char-acterizing pollinator visitation rates in the sample, couldalso reflect possible phylogenetic niche conservatism ifplant species that are closely related phylogeneticallytended to occur in similar environments (Losos 2008,M€unkem€uller et al. 2015). The second possibility is notconsistent with the results of phylogenetic regressions,which showed that the value of habitat type as a predic-tor of pollinator visitation persisted after statisticallyaccounting for the phylogenetic relationships amongspecies. Instead, habitat-specific ecological factors seemto account for the reduced pollinator service in dolomi-tic outcrops, forest interior and rock cliffs. In these threehabitats, low attractiveness of flowering plants to polli-nators due to scarcity of flowers in their immediate vicin-ity may have contributed to the low-visitation rates,since previous studies have often found that floral neigh-borhood characteristics are important determinants ofpollinator visitation to individual plants or floweringpatches (Laverty 1992, Molina-Montenegro et al. 2008,Montero-Casta~no and Vil�a 2015). In dolomitic outcrops,low pollinator visitation probably was also a conse-quence of strong interspecific competition for pollinatorservice arising from high diversity of sympatric ento-mophilous plants (Alonso et al. 2013) in combinationwith small size of local insect populations derived fromaridity, low plant productivity and sparse vegetation. Inthe case of forest interior and rock cliffs, energetic con-straints on foraging due to low density of floweringplants and thermal limitations on ectothermic pollina-tors set by the low solar irradiance available in theseshady environments (Beattie 1971, Herrera 1995a, b,1997, Zamora 1999) can also have reduced pollinatorvisitation.
Pollinator composition: community-wide patterns
Pollinator composition is an important componentof pollinator service, since different pollinators vary inper-visit pollen transfer efficacy and quality of trans-ferred pollen (Herrera 1987, Sahli and Conner 2007,King et al. 2013). Coleoptera, Diptera, Hymenoptera,and Lepidoptera, the main groups of insectpollinators in the species sample studied here, gener-ally differ in quantity and/or quality of their pollina-tion service. As a general trend, per-visit pollenremoval or deposition tend to decline in the direction
Hymenoptera-Lepidoptera-Diptera-Coleoptera, althoughbroad variations can occur within orders and exceptionsto this ranking are frequent, depending on the particularplant and insect species concerned (Schemske and Horvitz1984, Herrera 1987, Larsson 2005, Sahli and Conner2007, Theiss et al. 2007, Koski et al. 2018). These fourinsect orders have also been traditionally related to distinctplant “pollination syndromes,” or suites of floral charac-teristics that are associated to particular pollinator groups(Fægri and van der Pijl 1979, Fenster et al. 2004).Pollinator composition, in terms of relative contribu-
tions of Coleoptera, Diptera, Hymenoptera, and Lepi-doptera, varied extensively among species in the samplestudied. The variation was essentially continuous, asrevealed by the ordination analysis of the between-spe-cies dissimilarity matrix. Discontinuities in pollinatorcomposition over the bivariate ordination plane did notexist, and discrete groups with species more similar toeach other than to species in other groups were not rec-ognizable. All possible combinations of relative pollina-tor importance of the four major insect orders wererepresented in the species sample, and the frequency dis-tributions of relative importance were essentially uni-modal in all cases. These results indicate, on one side,that the vast majority of plants in the montane habitatsstudied had generalized pollination systems, each speciesdepending for pollination on two or more insect orderswith disparate morphology and behavior. Similar perva-siveness of generalized pollination systems has been pre-viously emphasized in other community studies (McCalland Primack 1992, Herrera 1996, Waser et al. 1996).And on the other side, the absence of distinct speciesclusters associated with particular pollinators falsifiesexpectations from “pollination syndromes” views postu-lating that plants partition the range of available pollina-tors by specializing on particular groups, a result thatcorroborates those of Ollerton et al. (2009; see alsoOllerton et al. 2015). Consideration of the 10 species(5.2% of total) exclusively or predominantly pollinatedby single insect orders, and falling around the peripheryof the species cluster obtained by the ordination analysis,further adds to the failure to support pollinator syn-dromes linked to distinct pollinator groups. Species thatdepended entirely or predominantly on the same insectorder for pollination were conspicuously heterogeneousin their floral characteristics (Appendix S7: Fig. S1). Itmust be stressed, however, that the current state of polli-nator visitation does not necessarily imply that certainpollinator groups did not drive the evolution of certainplant species toward certain morphologies, in which casethere may have been true partitioning of pollinators inthe plant species’ evolutionary history.
Pollinator composition: responses to predictors
The continuous interspecific variation in pollinatorcomposition occurring in the species sample studied canbe parsimoniously explained in terms of the heterogeneous
Article e01402; page 22 CARLOS M. HERRERA Ecological MonographsVol. 90, No. 2

visitation responses of major insect groups to variation infloral traits, phylogeny, and habitat type. Insect orders dif-fered in the specific flower trait combinations to whichthey were responsive and in the shape of the relationships.For example, visitation rates by Coleoptera increased withincreasing visitation unit mass in species with single flow-ers, but declined in species with flower packets. Lepi-doptera responded positively to increasing mass ofvisitation unit in species with flowers packets, but nega-tively in species with single flowers and restrictive peri-anths. Hymenoptera stood alone from the rest byresponding positively to increasing mass of visitation unitin all instances, and their visitation rates were not impairedby restrictive perianths.Pollinator composition of individual plant species
depended strongly on phylogeny. Patch and flower visita-tion probabilities by all insect orders except Dipteraexhibited strong phylogenetic signals, thus showing thatevolutionarily related plant species were more similar toeach other in visitation probabilities by the differentinsect orders than to species more distant phylogeneti-cally. Phylogenetic signal, however, was not homoge-neously distributed across the plant phylogeny, and thedistribution of significant hotspots of local phylogeneticautocorrelation was specific to each insect order. Thesehotspots indistinctly arose from local similarity in eitherabove- or under-average visitation rates, as illustrated bythe high-visitation hotspots of Coleoptera and Lepi-doptera associated with Malvales and Asterales, respec-tively; the low-visitation hotspots of Hymenopteracharacterizing Caryophyllales; and the low-visitationhotspots of both Diptera and Coleoptera associatedwith Lamiales. There were some instances of comple-mentarity between insect orders in their phylogenetichotspots. For example, the Caryophyllales simultane-ously exhibited a low-visitation hotspot for Hymenop-tera and a high-visitation hotspot for Diptera. Evenacknowledging that my species sample falls short atachieving a complete phylogenetic coverage of ento-mophilous angiosperms in the study region, these resultsprovide compelling evidence that plant phylogeny aloneis an important predictor of pollinator composition interms of major insect groups. This relationship is notnecessarily mediated by similarity of phylogeneticallyrelated taxa in macroscopic floral traits of the sort tradi-tionally considered in studies focusing on pollinationsyndromes (Fægri and van der Pijl 1979, Fenster et al.2004, Ollerton et al. 2009). This is illustrated in my sam-ple by the high-Coleoptera hotspot associated with spe-cies of Malvales, which belong to families with disparatemacroscopic floral traits (Cistaceae and Thymelaeaceae;compare Cistus and Daphne in Appendix S7: Fig. S1), orby species in the high-Diptera and low-Hymenopterahotspot associated with Caryophyllales (compare Are-naria and Saponaria in Appendix S7: Fig. S1).In addition to floral traits and phylogenetic relation-
ships, habitat type was another key predictor of pollina-tor composition, as shown by the decoupled variation
across habitat types in visitation rates by different insectgroups. Visitation rates by Hymenoptera (mostly bees)varied little among habitat types, a result that contrastswith published reports of between-habitat heterogeneityin bee abundance in other Mediterranean regions(Torn�e-Noguera et al. 2014). Visitation by the remainingthree insect orders varied in contrasting ways acrosshabitats. Variation among habitats in pollinator compo-sition was in part the consequence of phylogeneticallyrelated plant species with their distinctive pollinatorassemblages tending to occur in similar environments.This phylogenetic conservatism hypothesis was sup-ported for Coleoptera, Diptera, and Lepidoptera, butnot for Hymenoptera. Significant effects of habitat typeon visitation probabilities by the former three ordersvanished after statistically accounting for the phyloge-netic correlations underlying pollinator visitation data.In contrast, habitat effects on Hymenoptera abundanceremained significant after accounting for phylogeny. Itcan be speculated that the comparative stability ofHymenoptera across habitats could be the outcome ofhomogeneity among habitats in the abundance of theircommon larval and adult food (nectar plus pollen),while the broad variation in abundance of the rest of pol-linator groups may reflect heterogeneity between habi-tats in the supply of their highly heterogeneous larvaland adult foods. No data are available to evaluate thisecological hypothesis. In conclusion, therefore, between-habitat differences in pollinator composition occurringin my study region were the composite outcome of habi-tat-specific, phylogenetically independent responses inthe case of Hymenoptera, in combination with signifi-cant phylogenetic niche conservatism in the case ofColeoptera, Diptera, and Lepidoptera.
CONCLUDING REMARKS
In the long run, local and regional plant communitiesare molded by the concerted, continued, intricate actionof evolutionary, historical, and ecological events, and forthis reason, they accumulate considerable amounts ofbiological information about the past and current opera-tion of these building forces (Herrera 1992, Ackerly2004, Donoghue 2008). Pollination community studiesinvolving large species samples thus have considerablepotential for understanding the present-day ecology andpast evolution of plant–pollinator interactions (Arroyoet al. 1982, 1985, Inouye and Pyke 1988, Herrera 1992,McCall and Primack 1992, Totland 1993, L�azaro et al.2013). In contrast, small or modest species sets drawnfrom a much larger regional pool represent artificiallyassembled samples often selected for practical conve-nience rather than biological motivations, but they pro-vide suitable arenas for detailed study of specificquestions or testing particular hypotheses. These two“zooming-out” and “zooming-in” approaches, respec-tively, to the study of the ecology and evolution of plantpollination are bound to contribute complementary
May 2020 PREDICTORS OF POLLINATOR SERVICE Article e01402; page 23
insights, since small or modest species samples will rarelyrepresent truly scaled-down, phylogenetically and eco-logically unbiased versions of whole plant communities.As noted in the Introduction, research relying on ambi-tious sampling efforts involving many plant speciesremains overly underrepresented in comparison to thatfocusing on single species or small samples. By examin-ing a unusually large, phylogenetically and ecologicallydiverse sample of species, the present study has illus-trated the hitherto underexploited potential of pollina-tion community studies at the regional scale to (1) revealthe importance of interactions among species-specificfloral traits as predictors of pollinator visitation andcomposition and also, possibly, pollen limitation; (2)shed new light on long-standing, controversial issues inpollination research such as, e.g., the reality of so-called“pollination syndromes” (Fenster et al. 2004, Ollertonet al. 2009); (3) identify potential avenues for futureresearch, e.g., examining heterogeneity among habitatsor geographical regions in pollinator service and pollenlimitation in the context of the phylogenetic relation-ships among species; (4) formulate novel hypotheses andquestions that could hardly have arisen from studiesdealing with limited species samples, e.g., asking whethercomplementary phylogenetic hotspots exhibited by dif-ferent pollinator groups reflect some relationships overan evolutionary time scale, or suggesting the possibleecological invariance of community-level descriptors ofper-flower pollinator visitation; and (5) identify poten-tial methodological cautions that should be taken intoconsideration by studies dealing with limited, phyloge-netically biased species samples, e.g., the extent to whichresults of these studies can be tainted by phylogeneticsignals in pollinator abundance and composition notbeing accounted for. More generally, results of this studyhave shown that, given sufficient ecological and phyloge-netic diversity in a species sample, components of polli-nator service can be predicted by considering a fewsimple flower features, habitat type and evolutionary his-tory.
ACKNOWLEDGMENTS
This study would not have been accomplished without thehelp of insect taxonomists that over the years dealt with myqueries, shared their knowledge, and identified specimens. Spe-cial thanks are due to Oscar Aguado (Apoidea, Symphyta),Jorge Almeida (Diptera), Miguel A. Alonso Zarazaga (Coleop-tera), Piluca �Alvarez (Diptera), Stig Andersen (Tachinidae), RuiAndrade (Diptera), Enrique Asensio (Apoidea), Marcos B�aez(Bombyliidae), Leopoldo Castro (Bombus, Vespoidea), AntonioCobos (Buprestidae), Jos�e Garc�ıa Carrillo (Anthicidae), Severi-ano F. Gayubo (Crabronidae, Sphecidae), Mar�ıa �Angeles Mar-cos (Syrphidae), Andreas M€uller (Anthidiini), Rafael Obreg�on(Coleoptera, Lepidoptera), Concepci�on Ornosa (Apoidea),Francisco J. Ortiz-S�anchez (Apoidea), Jos�e Carlos Otero(Nitidulidae), Florent Prunier (Orthoptera), Antonio Ricarte(Syrphidae), Knut Rognes (Calliphoridae), Luis Rozas (Coleop-tera, Neuroptera), Arabia S�anchez Terr�on (Bombyliidae), KlausSch€onitzer (Andrena), Alberto Tinaut (Formicidae), Hans-PeterTschorsnig (Tachinidae), and Jos�e Luis Yela (Lepidoptera).
Alfredo Benavente and Gabriel Blanca assisted with some chal-lenging plant identifications. Pollinator censuses on Helleborusfoetiduswere done in collaboration with Joaqu�ın Cerd�a, Bego~naGarc�ıa (1998, 1999), Miyuki Mac�ıas, M�onica Medrano, andCurro Molina (2012, 2013). Mar�ıa Clara Castellanos did partof the censuses on Aquilegia vulgaris. Amparo L�azaro providedunpublished pollinator visitation data for Table 5. DavidInouye and one anonymous reviewer contributed helpful com-ments and suggestions on the manuscript. Consejer�ıa de MedioAmbiente, Junta de Andaluc�ıa, granted permission to work inthe Sierra de Cazorla and provided invaluable facilities there.M�onica Medrano provided insightful ideas, encouragement andinspiring discussions over so many years. The research reportedin this paper received no specific grant from any fundingagency.
LITERATURE CITED
Ackerly, D. D. 2004. Adaptation, niche conservatism, and con-vergence: comparative studies of leaf evolution in the Califor-nia chaparral. American Naturalist 163:654–671.
Aizen, M. A., and L. D. Harder. 2007. Expanding the limits ofthe pollen-limitation concept: effects of pollen quantity andquality. Ecology 88:271–281.
Alonso, C., J. C. Vamosi, T. M. Knight, J. A. Steets, and T. L.Ashman. 2010. Is reproduction of endemic plant species par-ticularly pollen limited in biodiversity hotspots? Oikos119:1192–1200.
Alonso, C., C. M. Herrera, and T. L. Ashman. 2012. A piece ofthe puzzle: a method for comparing pollination quality andquantity across multiple species and reproductive events. NewPhytologist 193:532–542.
Alonso, C., C. M. Navarro-Fern�andez, G. Arceo-G�omez, G. A.Meindl, V. Parra-Tabla, and T. L. Ashman. 2013. Among-species differences in pollen quality and quantity limitation:implications for endemics in biodiverse hotspots. Annals ofBotany 112:1461–1469.
Anselin, L. 1995. Local indicators of spatial association–LISA.Geographical Analysis 27:93–115.
Archer, C. R., C. W. W. Pirk, L. G. Carvalheiro, and S. W.Nicolson. 2014. Economic and ecological implications of geo-graphic bias in pollinator ecology in the light of pollinatordeclines. Oikos 123:401–407.
Arroyo, M. T. K., R. Primack, and J. Armesto. 1982. Commu-nity studies in pollination ecology in the high temperateAndes of central Chile. I. Pollination mechanisms and altitu-dinal variation. American Journal of Botany 69:82–97.
Arroyo, M. T. K., J. J. Armesto, and R. B. Primack. 1985. Com-munity studies in pollination ecology in the high temperateAndes of central Chile. II. Effect of temperature on visitationrates and pollination possibilities. Plant Systematics and Evo-lution 149:187–203.
Ashman, T. L., et al. 2004. Pollen limitation of plant reproduc-tion: ecological and evolutionary causes and consequences.Ecology 85:2408–2421.
Bates, D., M. Maechler, B. Bolker, and S. Walker. 2015. Fittinglinear mixed-effects models using lme4. Journal of StatisticalSoftware 67:1–48.
Beattie, A. J. 1971. Itinerant pollinators in a forest. Madro~no21:120–124.
Bennett, J. M., et al. 2018. GloPL, a global data base on pollenlimitation of plant reproduction. Scientific Data 5:180249.
Blanca, G., B. Cabezudo, M. Cueto, C. Morales Torres, and C.Salazar, editors. 2011. Flora vascular de Andaluc�ıa oriental.Second edition. Consortium of Universities of Almer�ıa,Granada, Ja�en and M�alaga, Granada, Spain.
Article e01402; page 24 CARLOS M. HERRERA Ecological MonographsVol. 90, No. 2
Blomberg, S. P., and T. Garland. 2002. Tempo and mode in evo-lution: phylogenetic inertia, adaptation and comparativemethods. Journal of Evolutionary Biology 15:899–910.
Bolker, B. M. 2015. Linear and generalized linear mixed models.Pages 309–333 in G. A. Fox, S. Negrete-Yankelevich, and V. J.Sosa, editors. Ecological statistics: contemporary theory andapplication. Oxford University Press, Oxford, UK.
Burd, M. 1994. Bateman’s principle and plant reproduction:the role of pollen limitation in fruit and seed set. BotanicalReview 60:83–139.
Burd, M. 2016. Pollen limitation is common—Should it be?American Naturalist 187:388–396.
Chamberlain, S. 2018. brranching: Fetch ‘phylogenies’ frommany sources. R package version 0.4.0. https://CRAN.R-project.org/package=brranching
Donoghue, M. J. 2008. A phylogenetic perspective on the distri-bution of plant diversity. Proceedings of the National Acad-emy of Sciences USA 105:11549–11555.
Engel, E. C., and R. E. Irwin. 2003. Linking pollinator visita-tion rate and pollen receipt. American Journal of Botany90:1612–1618.
Fægri, K., and L. van der Pijl. 1979. The principles of pollina-tion ecology. Third edition. Pergamon Press, Oxford, UK.
Fenster, C. B., W. S. Armbruster, P. Wilson, M. R. Dudash, andJ. D. Thomson. 2004. Pollination syndromes and floral spe-cialization. Annual Review of Ecology, Evolution and Sys-tematics 35:375–403.
Fox, J., and S. Weisberg. 2011. An R companion to appliedregression. Second edition. Sage Publishing, Thousand Oaks,California, USA.
G�omez Mercado, F. 2011. Vegetaci�on y flora de la Sierra deCazorla. Guineana 17:1–481.
G�omez, J. M., J. Bosch, F. Perfectti, J. Fern�andez, and M.Abdelaziz. 2007. Pollinator diversity affects plant reproduc-tion and recruitment: the tradeoffs of generalization. Oecolo-gia 153:597–605.
G�omez, J. M., M. Abdelaziz, J. Lorite, A. J. Mu~noz-Pajares,and F. Perfectti. 2010. Changes in pollinator fauna cause spa-tial variation in pollen limitation. Journal of Ecology98:1243–1252.
Grafen, A. 1989. The phylogenetic regression. PhilosophicalTransactions of the Royal Society B 326:119–157.
Gross, R. S., and P. A.Werner. 1983. Relationships among flower-ing phenology, insect visitors, and seed-set of individuals: exper-imental studies on four co-occurring species of goldenrod(Solidago: Compositae). EcologicalMonographs 53:95–117.
Hansen, V. I., and O. Totland. 2006. Pollinator visitation, pollenlimitation, and selection on flower size through female func-tion in contrasting habitats within a population of Campanulapersicifolia. Canadian Journal of Botany 84:412–420.
Harder, L. D., and M. A. Aizen. 2010. Floral adaptation anddiversification under pollen limitation. Philosophical Trans-actions of the Royal Society B 365:529–543.
Harder, L. D., M. A. Aizen, and S. A. Richards. 2016. Thepopulation ecology of male gametophytes: the link betweenpollination and seed production. Ecology Letters 19:497–509.
Hegland, S. J., and Ø. Totland. 2005. Relationships betweenspecies’ floral traits and pollinator visitation in a temperategrassland. Oecologia 145:586–594.
Hegland, S. J., and Ø. Totland. 2008. Is the magnitude of pollenlimitation in a plant community affected by pollinator visitationand plant species specialisation levels? Oikos 117:883–891.
Herrera, J. 1985. Nectar secretion patterns in southern SpanishMediterranean scrublands. Israel Journal of Botany 34:47–58.
Herrera, C. M. 1987. Components of pollinator ‘quality’: com-parative analysis of a diverse insect assemblage. Oikos 50:79–90.
Herrera, C. M. 1990. Daily patterns of pollinator activity, dif-ferential pollinating effectiveness, and floral resource avail-ability, in a summer-flowering Mediterranean shrub. Oikos58:277–288.
Herrera, C. M. 1992. Historical effects and sorting processes asexplanations of contemporary ecological patterns: charactersyndromes in Mediterranean woody plants. American Natu-ralist 140:421–446.
Herrera, C. M. 1995a. Floral biology, microclimate, and polli-nation by ectothermic bees in an early-blooming herb. Ecol-ogy 76:218–228.
Herrera, C. M. 1995b. Microclimate and individual variation inpollinators: flowering plants are more than their flowers.Ecology 76:1516–1524.
Herrera, C. M. 1996. Floral traits and plant adaptation toinsect pollinators: a devil’s advocate approach. Pages 65–87in D. G. Lloyd and S. C. H. Barrett, editors. Floral biology.Chapman and Hall, New York, New York, USA.
Herrera, C. M. 1997. Thermal biology and foraging responsesof insect pollinators to the forest floor irradiance mosaic.Oikos 78:601–611.
Herrera, C. M. 2019. Complex long-term dynamics of pollina-tor abundance in undisturbed Mediterranean montane habi-tats over two decades. Ecological Monographs 89:e01338.
Herrera, C. M., A. M. S�anchez-Lafuente, M. Medrano, J.Guiti�an, X. Cerd�a, and P. Rey. 2001. Geographical variationin autonomous self-pollination levels unrelated to pollinatorservice in Helleborus foetidus (Ranunculaceae). AmericanJournal of Botany 88:1025–1032.
Husband, B. C., and S. C. H. Barrett. 1992. Pollinator visitationin populations of tristylous Eichhornia paniculata in north-eastern Brazil. Oecologia 89:365–371.
Inouye, D. W., and G. H. Pyke. 1988. Pollination biology in theSnowy Mountains of Australia: comparisons with montaneColorado, USA. Australian Journal of Ecology 13:191–210.
Johnson, S. D., and W. J. Bond. 1997. Evidence for widespreadpollen limitation of fruiting success in Cape wildflowers.Oecologia 109:530–534.
Kay, K. M., and D. W. Schemske. 2003. Pollinator assemblagesand visitation rates for 11 species of neotropical Costus (Cost-aceae). Biotropica 35:198–207.
Kearns, C. A., and D. W. Inouye. 1993. Techniques for pollina-tion biologists. University Press of Colorado, Niwot, Color-ado, USA.
Keck, F., F. Rimet, A. Bouchez, and A. Franc. 2016. phylosig-nal: an R package to measure, test, and explore the phyloge-netic signal. Ecology and Evolution 6:2774–2780.
King, C., G. Ballantyne, and P. G. Willmer. 2013. Why flowervisitation is a poor proxy for pollination: measuring single-visit pollen deposition, with implications for pollination net-works and conservation. Methods in Ecology and Evolution4:811–818.
Knight, T. M., J. A. Steets, J. C. Vamosi, S. J. Mazer, M. Burd,D. R. Campbell, M. R. Dudash, M. O. Johnston, R. J. Mitch-ell, and T. L. Ashman. 2005. Pollen limitation of plant repro-duction: pattern and process. Annual Review of EcologyEvolution and Systematics 36:467–497.
Knuth, P. 1908. Handbook of flower pollination. Volume 2.Translated by J. R. Ainsworth Davis, Clarendon, Oxford,UK.
Korner-Nievergelt, F., T. Roth, S. von Felten, J. Guelat, B.Almasi, and P. Korner-Nievergelt. 2015. Bayesian data analy-sis in ecology using linear models with R, BUGS and Stan.Elsevier, Amsterdam, The Netherlands.
Koski, M. H., J. L. Ison, A. Padilla, A. Q. Pham, and L. F.Galloway. 2018. Linking pollinator efficiency to patterns ofpollen limitation: small bees exploit the plant-pollinator
May 2020 PREDICTORS OF POLLINATOR SERVICE Article e01402; page 25
mutualism. Proceedings of the Royal Society B285:20180635.
Larson, B. M. H., and S. C. H. Barrett. 2000. A comparativeanalysis of pollen limitation in flowering plants. BiologicalJournal of the Linnean Society 69:503–520.
Larsson, M. 2005. Higher pollinator effectiveness by specialistthan generalist flower-visitors of unspecialized Knautia arven-sis (Dipsacaceae). Oecologia 146:394–403.
Laverty, T. M. 1992. Plant interactions for pollinator visits: atest of the magnet species effect. Oecologia 89:502–508.
L�azaro, A., A. Jakobsson, and O. Totland. 2013. How do polli-nator visitation rate and seed set relate to species’ floral traitsand community context? Oecologia 173:881–893.
Losos, J. B. 2008. Phylogenetic niche conservatism, phylogeneticsignal and the relationship between phylogenetic relatednessand ecological similarity among species. Ecology Letters11:995–1003.
L€udecke, D. 2018. ggeffects: Create tidy data frames of marginaleffects for ‘ggplot’ from model outputs. R package version0.3.1. https://CRAN.R-project.org/package=ggeffects
Lundemo, S., and O. Totland. 2007. Within-population spatialvariation in pollinator visitation rates, pollen limitation onseed set, and flower longevity in an alpine species. Acta Oeco-logica 32:262–268.
McCall, C., and R. B. Primack. 1992. Influence of flower char-acteristics, weather, time of day, and season on insect visita-tion rates in three plant communities. American Journal ofBotany 79:434–442.
McLean, R. A., W. L. Sanders, and W. W. Stroup. 1991. A uni-fied approach to mixed linear models. American Statistician45:54–64.
M�edail, F., and K. Diadema. 2009. Glacial refugia influenceplant diversity patterns in the Mediterranean Basin. Journalof Biogeography 36:1333–1345.
Molina-Montenegro, M. A., E. I. Badano, and L. A. Cavieres.2008. Positive interactions among plant species for pollinatorservice: assessing the ‘magnet species’ concept with invasivespecies. Oikos 117:1833–1839.
Molina-Venegas, R., and M. �A. Rodr�ıguez. 2017. Revisitingphylogenetic signal; strong or negligible impacts of poly-tomies and branch length information? BMC EvolutionaryBiology 17:53.
Molina-Venegas, R., A. Aparicio, J. A. Slingsby, S. Lavergne,and J. Arroyo. 2015. Investigating the evolutionary assemblyof a Mediterranean biodiversity hotspot: deep phylogeneticsignal in the distribution of eudicots across elevational belts.Journal of Biogeography 42:507–518.
Montero-Casta~no, A., and M. Vil�a. 2015. Direct and indirectinfluence of non-native neighbours on pollination and fruitproduction of a native plant. PLoS ONE 10:e0128595.
Motten, A. F. 1986. Pollination ecology of the spring wildflowercommunity of a temperate deciduous forest. EcologicalMonographs 56:21–42.
M€uller, H. 1883. The fertilisation of flowers. Translated by D.W. Thompson. MacMillan, London, UK.
M€unkem€uller, T., S. Lavergne, B. Bzeznik, S. Dray, T. Jombart, K.Schiffers, and W. Thuiller. 2012. How to measure and test phy-logenetic signal. Methods in Ecology and Evolution 3:743–756.
M€unkem€uller, T., F. C. Boucher, W. Thuiller, and S. Lavergne.2015. Phylogenetic niche conservatism – common pitfalls andways forward. Functional Ecology 29:627–639.
Oksanen, J., et al. 2019. vegan: Community ecology package. Rpackage version 2.5-4. https://CRAN.R-project.org/package=vegan
Olesen, J. M., and P. Jordano. 2002. Geographic patterns inplant-pollinator mutualistic networks. Ecology 83:2416–2424.
Ollerton, J. 2017. Pollinator diversity: distribution, ecologicalfunction, and conservation. Annual Review of Ecology, Evo-lution, and Systematics 48:353–376.
Ollerton, J., R. Alarc�on, N. M. Waser, M. V. Price, S. Watts, L.Cranmer, A. Hingston, C. I. Peter, and J. Rotenberry. 2009. Aglobal test of the pollination syndrome hypothesis. Annals ofBotany 103:1471–1480.
Ollerton, J., R. Winfree, and S. Tarrant. 2011. How manyflowering plants are pollinated by animals? Oikos 120:321–326.
Ollerton, J., A. Rodrigo Rech, N. M. Waser, and M. V. Price.2015. Using the literature to test pollination syndromes—some methodological cautions. Journal of Pollination Ecol-ogy 16:119–125.
Paradis, E. 2012. Analysis of phylogenetics and evolution withR. Second edition. Springer, New York, New York, USA.
Paradis, E., and K. Schliep. 2018. ape 5.0: An environment formodern phylogenetics and evolutionary analyses in R. Bioin-formatics 35:526–528.
Pinheiro, J., D. Bates, S. DebRoy, D. Sarkar, and R Core Team.2018. nlme: Linear and nonlinear mixed effects models. Rpackage version 3.1-137. https://CRAN.Rproject.org/package=nlme
Plowright, R. C. 1981. Nectar production in the boreal forest lilyClintonia borealis. Canadian Journal of Botany 59:156–160.
Price, M. V., N. M. Waser, R. E. Irwin, D. R. Campbell, and A.K. Brody. 2005. Temporal and spatial variation in pollinationof a montane herb: a seven-year study. Ecology 86:2106–2116.
Primack, R. B., and D. W. Inouye. 1993. Factors affecting polli-nator visitation rates: a biogeographic comparison. CurrentScience 65:257–262.
R Core team. 2018. R: a language and environment for statisti-cal computing. R Foundation for Statistical Computing,Vienna, Austria. https://www.R-project.org/
Robertson, C. 1928. Flowers and insects. Lists of visitors of fourhundred and fifty-three flowers. Science Press, Lancaster,Pennsylvania, USA.
Rodger, J. G., K. Balkwill, and B. Gemmill. 2004. African polli-nation studies: where are the gaps? International Journal ofTropical Insect Science 24:5–28.
Rush, S., J. K. Conner, and P. Jennetten. 1995. The effects ofnatural variation in pollinator visitation on rates of pollenremoval in wild radish, Raphanus raphanistrum (Brassi-caceae). American Journal of Botany 82:1522–1526.
Sahli, H. F., and J. K. Conner. 2007. Visitation, effectiveness,and efficiency of 15 genera of visitors to wild radish, Rapha-nus raphanistrum (Brassicaceae). American Journal of Botany94:203–209.
Schemske, D. W., and C. C. Horvitz. 1984. Variation among flo-ral visitors in pollination ability: a precondition for mutual-ism specialization. Science 225:519–521.
Silander, J. A., and R. B. Primack. 1978. Pollination intensityand seed set in the evening primrose (Oenothera fruticosa).American Midland Naturalist 100:213–216.
Stanton, M. L., and R. E. Preston. 1988. Ecological conse-quences and phenotypic correlates of petal size variation inwild radish, Raphanus sativus (Brassicaceae). American Jour-nal of Botany 75:528–539.
Symonds, M. R. E., and S. P. Blomberg. 2014. A primer on phy-logenetic generalised least squares. Pages 105–130 in L. Z.Garamszegi, editor. Modern phylogenetic comparative meth-ods and their application in evolutionary biology. Springer,Berlin, Germany.
Theiss, K., S. Kephart, and C. T. Ivey. 2007. Pollinator effective-ness on co-occurring milkweeds (Asclepias; Apocynaceae,
Article e01402; page 26 CARLOS M. HERRERA Ecological MonographsVol. 90, No. 2
Asclepiadoideae). Annals of the Missouri Botanical Garden94:505–516.
Torn�e-Noguera, A., A. Rodrigo, X. Arnan, S. Osorio, H. Bar-ril-Graells, L. C. da Rocha, and J. Bosch. 2014. Determi-nants of spatial distribution in a bee community: nestingresources, flower resources, and body size. PLoS ONE 9:e97255.
Totland, Ø. 1993. Pollination in alpine Norway: floweringphenology, insect visitors, and visitation rates in twoplant communities. Canadian Journal of Botany 71:1072–1079.
Totland, Ø. 1994. Intraseasonal variation in pollinationintensity and seed set in an alpine population ofRanunculus acris in southwestern Norway. Ecography17:159–165.
Totland, Ø. 2001. Environment-dependent pollen limitation andselection on floral traits in an alpine species. Ecology82:2233–2244.
Totland, Ø., and B. Schulte-Herbr€uggen. 2003. Breeding sys-tem, insect flower visitation, and floral traits of two alpine
Cerastium species in Norway. Arctic, Antarctic, and AlpineResearch 35:242–247.
Totland, Ø., A. Nielsen, A. L. Bjerknes, and M. Ohlson. 2006.Effects of an exotic plant and habitat disturbance on pollina-tor visitation and reproduction in a boreal forest herb. Ameri-can Journal of Botany 93:868–873.
Vamosi, J. C., T. M. Knight, J. A. Steets, S. J. Mazer, M. Burd,and T. L. Ashman. 2006. Pollination decays in biodiversityhotspots. Proceedings of the National Academy of SciencesUSA 103:956–961.
Vamosi, J. C., J. A. Steets, and T.-L. Ashman. 2013. Drivers ofpollen limitation: macroecological interactions betweenbreeding system, rarity, and diversity. Plant Ecology andDiversity 6:171–180.
Waser, N. M., L. Chittka, M. V. Price, N. M. Williams, and J.Ollerton. 1996. Generalization in pollination systems, andwhy it matters. Ecology 77:1043–1060.
Zamora, R. 1999. Conditional outcomes of interactions: thepollinator–prey conflict of an insectivorous plant. Ecology80:786–795.
SUPPORTING INFORMATION
Additional supporting information may be found online at: http://onlinelibrary.wiley.com/doi/10.1002/ecm.1402/full
DATA AVAILABILITY
Data and R scripts are available in the Dryad Digital Repository: https://doi.org/10.5061/dryad.wh70rxwj3
May 2020 PREDICTORS OF POLLINATOR SERVICE Article e01402; page 27