Embed Size (px)
Citation preview

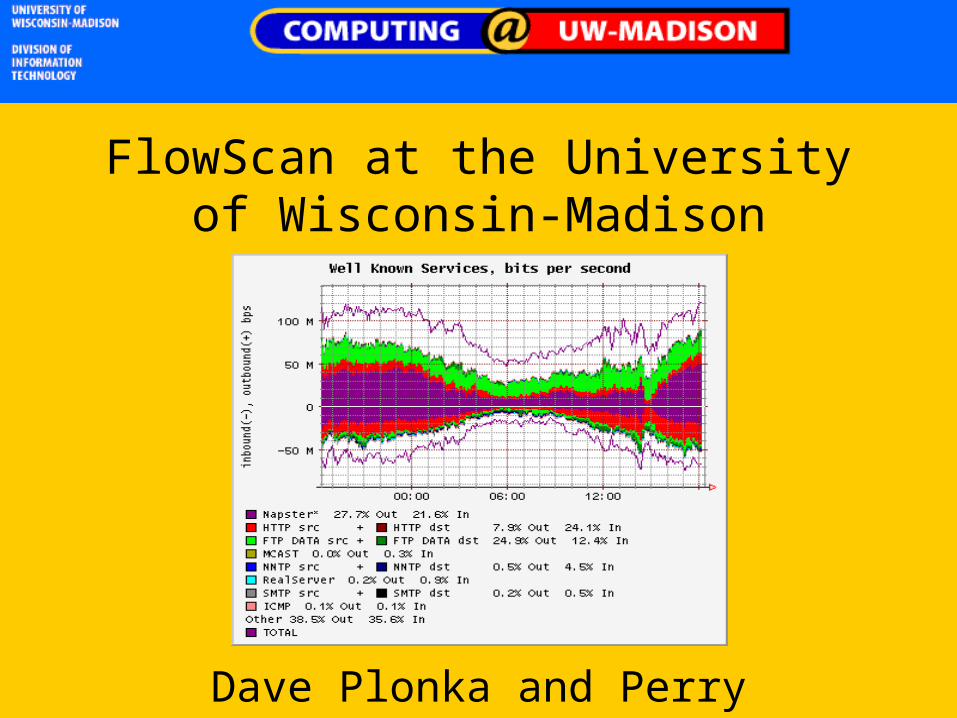
FlowScan at the University of Wisconsin-Madison
Copyright Dave Plonka and Perry Brunelli, 2001. This work is the intellectual property of the authors. Permission is granted for this material to be shared for non-commercial, educational purposes, provided that this copyrightstatement appears on the reproduced materials and notice is given that the copying is by permission of the author. To disseminate otherwise or to republish requires written permission from the author.
FlowScan at the University of Wisconsin-Madison
Dave Plonka and Perry Brunelli
Agenda
• What is FlowScan?
• Interpreting Sample Graphs
• Network Events of Interest
What is FlowScan?• FlowScan is a freely-available network
traffic reporting and visualization tool. Its development began in December 1998, and it was first released in March 2000. There are hundreds of users today including campuses and ISP’s.
• FlowScan analyzes data exported by Internet Protocol routers.
What is FlowScan
• FlowScan counts flows by protocol, application, user population, or Internet connection.– Protocols include TCP and UDP.
– Applications include email (SMTP), file sharing (e.g. KaZaA).
– User populations are subnets such as schools or departments.

What is a Flow?“An IP flow is a unidirectional series of IP packets of a given protocol (and port where applicable), traveling between a source and destination, within a certain period of time.”
K. Claffy, G. Polyzos, H. Werner-Braun, c. 1993.
References:http:://ipfix.doit.wisc.edu

These flows represent an ftp file transfer that lasted 9 seconds. Two bi-directional Internet connections, comprised of a total of 430 packets containing 380,122 bytes, are summarized into just five flows.

Flow-based passive measurement
• Active measurements examine traffic which is introduced into the network solely for the purpose of measurement.
• Passive measurements examine existing traffic, in an attempt to minimize the impact of the measurement itself.
• In actuality, the flows are the accounting record or log of activity reported by the router.

Example
• collector receives flow data from the router and writes it to disk.
• FlowScan parses/massages data from cflowd and stores the results in RRD format.
• RRDtool graph produces graphs from RRD files.

Interpreting FlowScan Graphs
• Horizontal axis is time, current time to the right.• Vertical axis indicates magnitude of measurement,
usually in bits, packets, or flows per second.• Outbound traffic is upwards, Inbound traffic is
downwards (mnemonic: pejorative `bottom feeders').
• Colored bars show traffic classification and are stacked (not overlaid) to show the total.
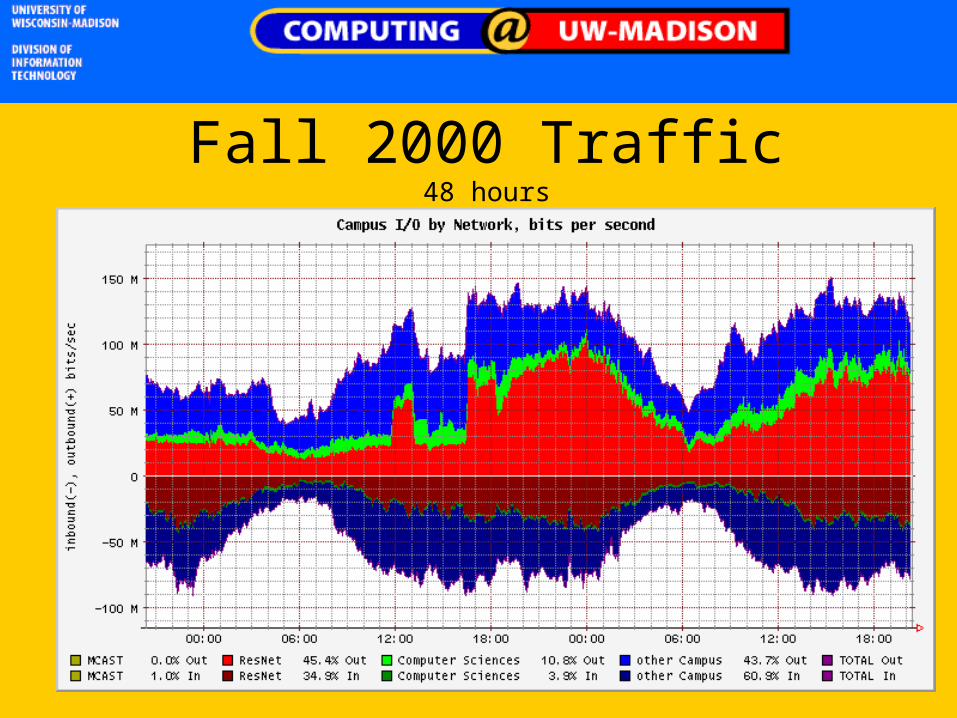
Fall 2000 Traffic48 hours
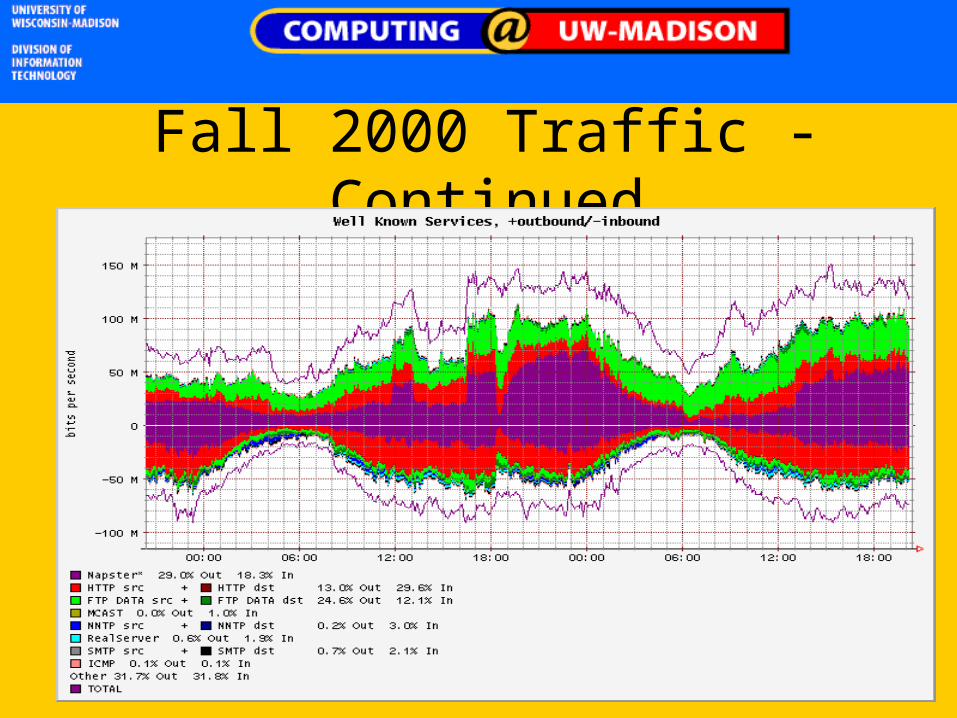
Fall 2000 Traffic - Continued

Fall 2001 Traffic
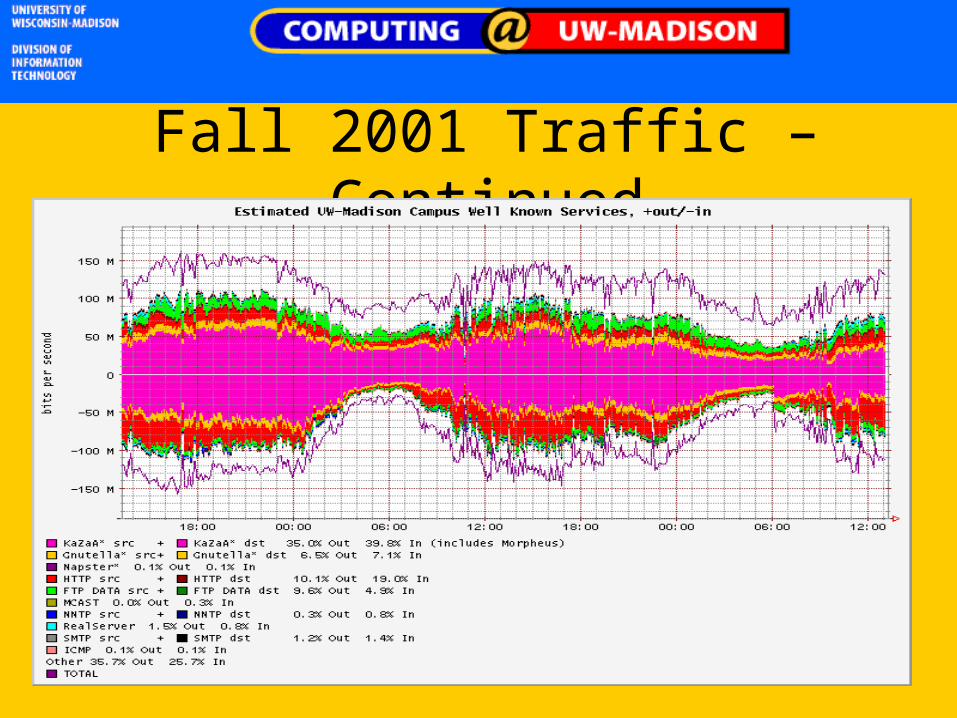
Fall 2001 Traffic – Continued
Network Events of Interest
• The Rise and Fall, and Rise of Peer-to-Peer• Rate-limiting changes: Packateer Packetshaper• Under Attack: Code Red and Nimda worm
propagation• Flash Crowds: Linux release, campus events• Denial of Service (DoS)• Distributed Denial of Service (DDoS)

Peer-to-Peer as presented by FlowScan

Packeteer Installed 5-Oct-2001
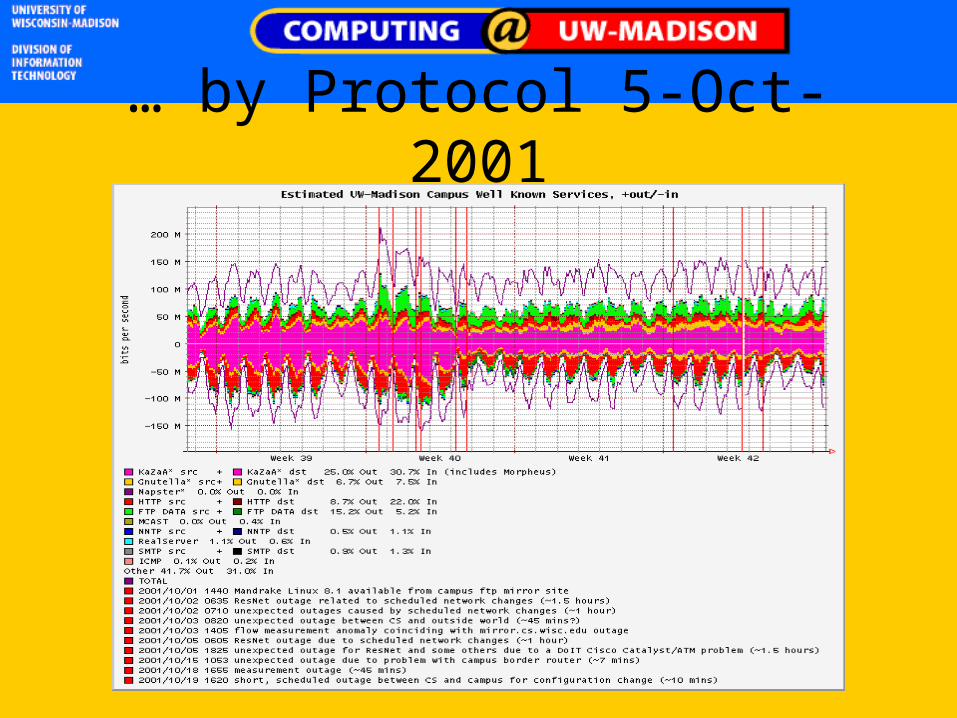
… by Protocol 5-Oct-2001
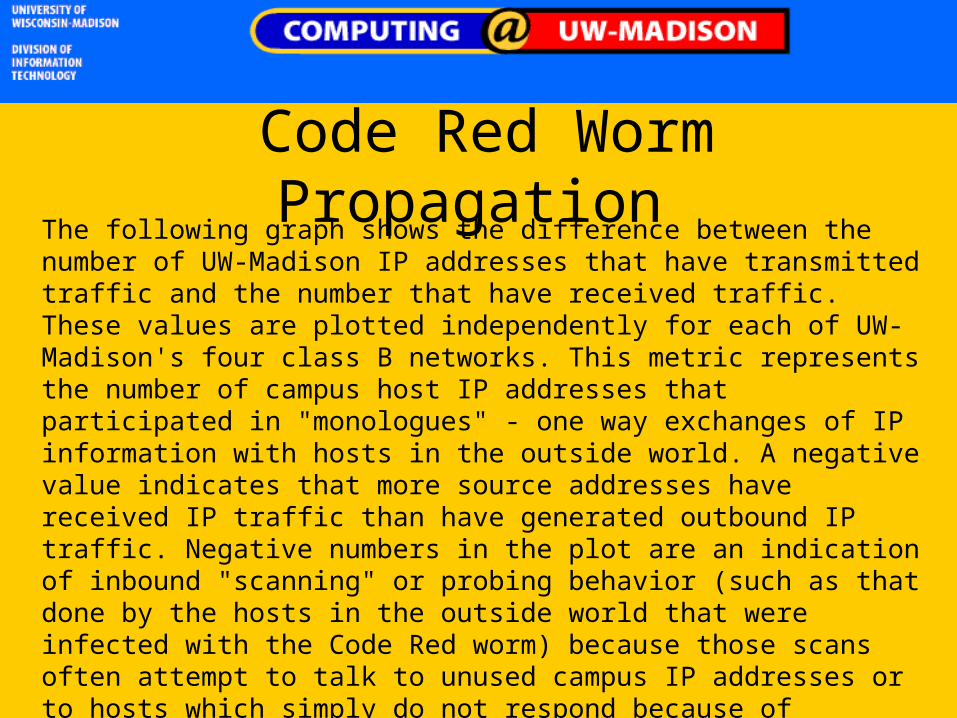
Code Red Worm Propagation The following graph shows the difference between the number of UW-Madison IP addresses that have transmitted traffic and the number that have received traffic. These values are plotted independently for each of UW-Madison's four class B networks. This metric represents the number of campus host IP addresses that participated in "monologues" - one way exchanges of IP information with hosts in the outside world. A negative value indicates that more source addresses have received IP traffic than have generated outbound IP traffic. Negative numbers in the plot are an indication of inbound "scanning" or probing behavior (such as that done by the hosts in the outside world that were infected with the Code Red worm) because those scans often attempt to talk to unused campus IP addresses or to hosts which simply do not respond because of firewall policies.

Code Red Worm Propagation
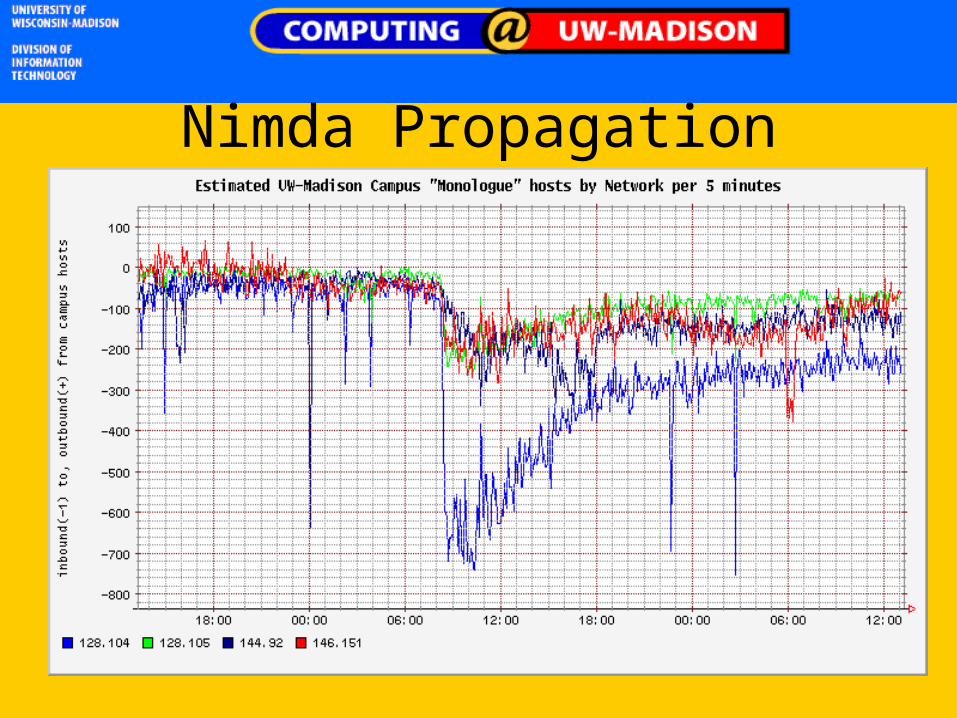
Nimda Propagation
Flash Events, Flash CrowdsLarry Niven's 1973 SF short story "Flash Crowd“ predicted that one consequence of cheap teleportation would be huge crowds materializing almost instantly at the sites of interesting news stories. Twenty years later the term passed into common use on the Internet to describe exponential spikes in website or server usage when one passes a certain threshold of popular interest.
www.tuxedo.org/~esr/jargon/html/entry/flash-crowd.html
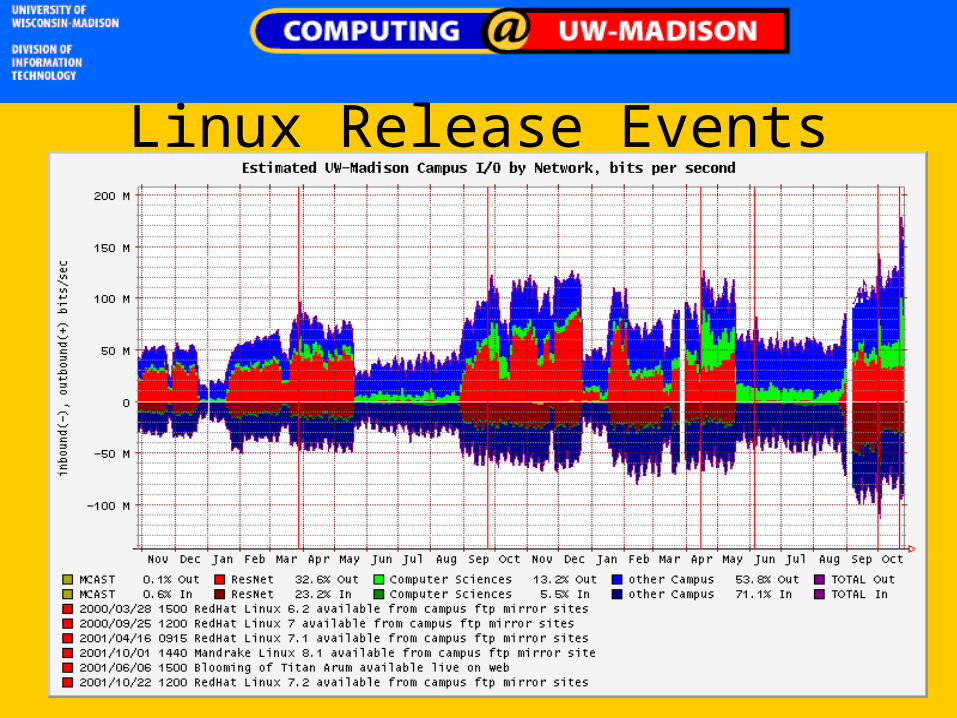
Linux Release Events
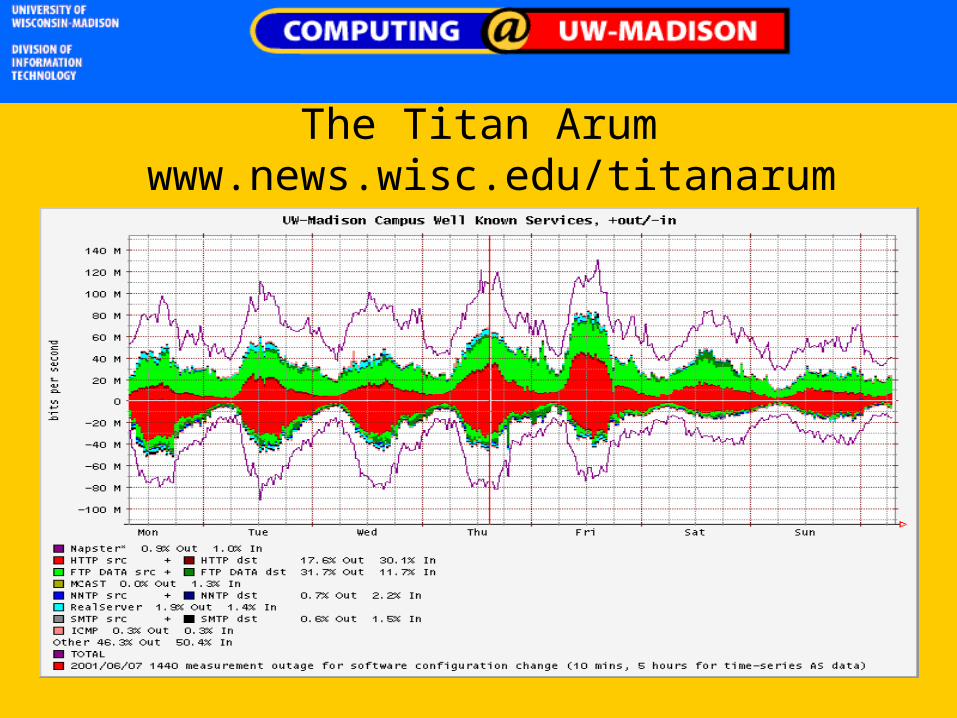
The Titan Arum www.news.wisc.edu/titanarum

Inbound DSL DoSA campus DSL user's host (640Kbps download) was the recipient of 50,000 packets per second, which totaled over 10 megabits per second.

…Inbound DSL DoS

A Distributed Denial of Service Attack
On Monday, July 9, 2001, UW-Madison network engineers discovered that for the past two days, various campus hosts running the Windows IIS HTTP server were enlisted as slaves in an outbound Distributed-Denial-of-Service attack. The outbound traffic consisted of large ICMP ECHO packets to a small set of destination "victim" hosts.
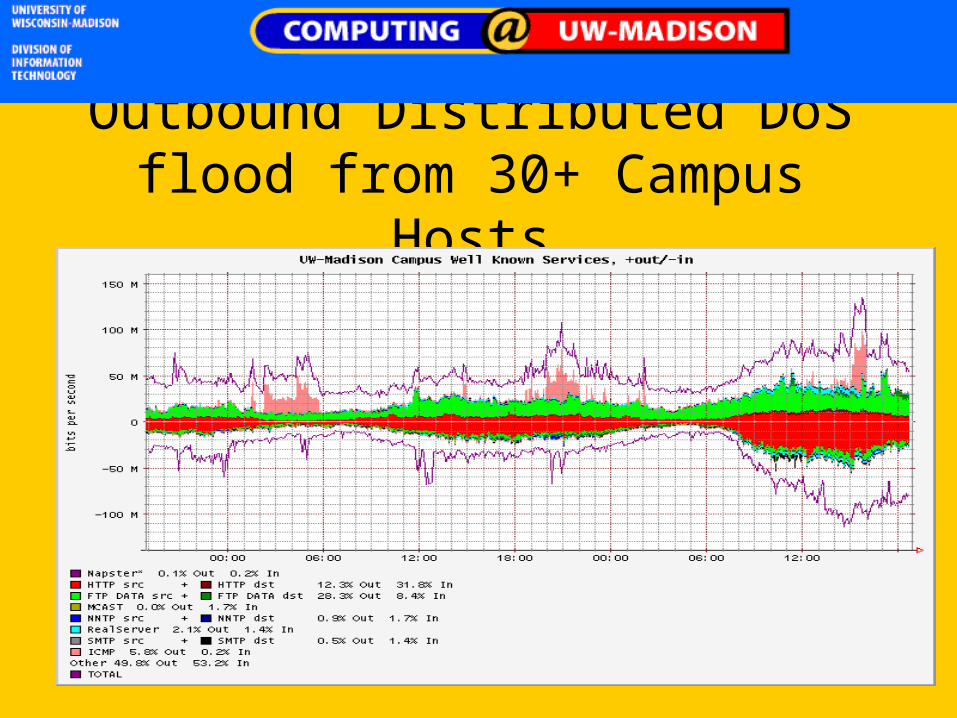
Outbound Distributed DoS flood from 30+ Campus Hosts
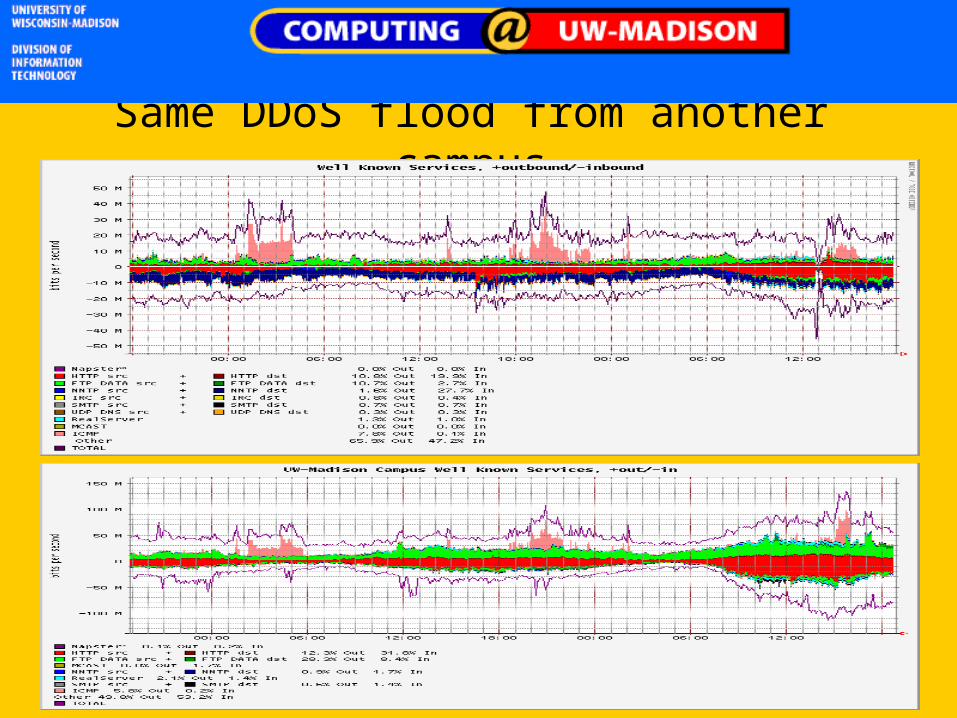
Same DDoS flood from another campus

The Knight IRC RobotCoordinated via Internet Relay Chat (IRC) using "robots".
Independent observations reported aggregates over 500Mbs

References
• FlowScan:
– net.doit.wisc.edu/~plonka/FlowScan/#FlowScan_Resources
– wwwstats.net.wisc.edu
• Denial of Service:
– www-cse.ucsd.edu/~savage
– www.astanetworks.com
• Code Red Analysis:
– www.caidi.org/analysis/security/code-red/
Summary/Questions
• http://lanfiles.williams.edu/educause2001• http://net.doit.wisc.edu/data/FlowScan