Embed Size (px)
Citation preview
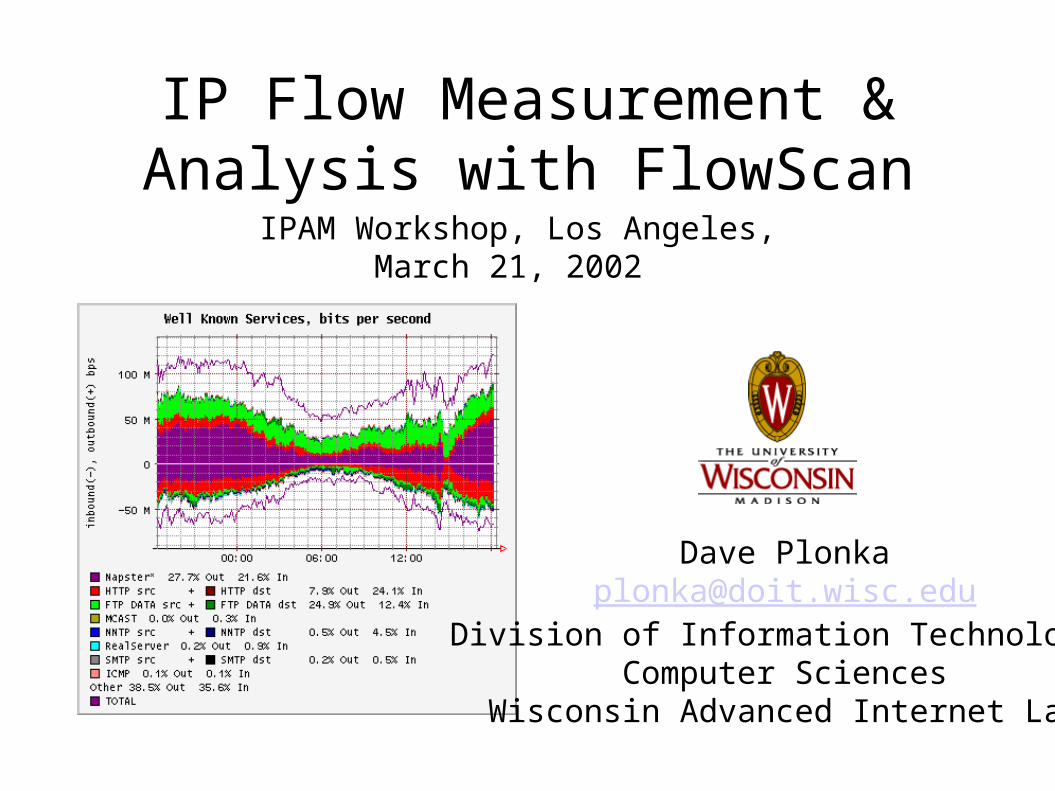
IP Flow Measurement & Analysis with FlowScan
IPAM Workshop, Los Angeles, March 21, 2002
Dave [email protected]
Division of Information Technology,Computer Sciences
Wisconsin Advanced Internet Lab
Agenda
What is FlowScan? What are IP Flows? Interpreting Sample FlowScan Graphs FlowScan Hardware & Software Components Graphs of Network Events & Anomalies "Characteristics of Flow Anomalies" (work in
progress)
What is FlowScan?
FlowScan is a freely-available network traffic reporting and visualization tool. Its development began in December 1998, and it was first released in March 2000. There are hundreds of users today including campuses and ISPs.
FlowScan analyzes data exported by Internet Protocol routers.
FlowScan counts IP flows by protocol, application, user population, or Internet connection. Protocols include TCP and UDP. Applications include email (SMTP), file sharing (e.g.
KaZaA). User populations are subnets such as schools or
departments. Internet connections are transit and peering links
between Autonomous Systems
What does FlowScan do?
What is a Flow?
An IP flow is a unidirectional series of IP packets of a given protocol (and port where applicable), traveling between a source and destination, within a certain period of time.
K. Claffy, G. Polyzos, H. Werner-Braun, c. 1993.
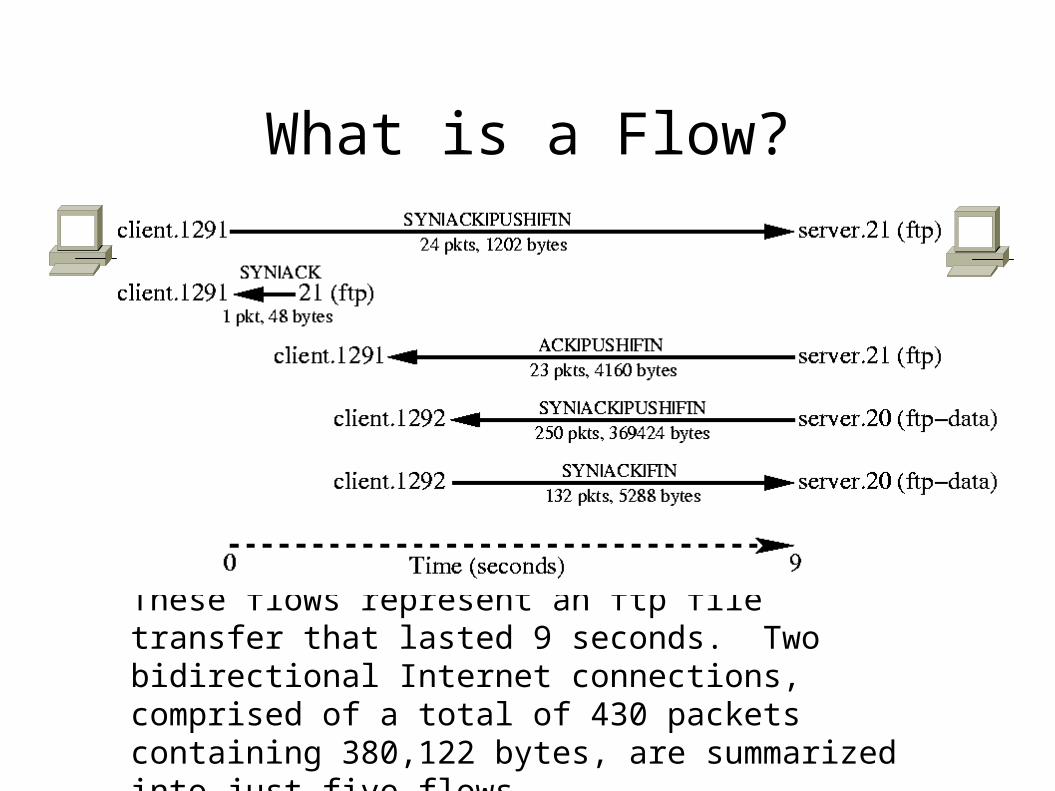
These flows represent an ftp file transfer that lasted 9 seconds. Two bidirectional Internet connections, comprised of a total of 430 packets containing 380,122 bytes, are summarized into just five flows.
What is a Flow?
The notion of flow profiling was introduced by the research community.
Today, flow profiling is built into some networking devices for operational and accounting purposes.
Vendor implementations include Cisco NetFlow, Riverstone (formerly Cabletron) LFAP, Foundry (InMon) sFlow
These essentially use the definition introduced by [ClaffyPB] with timeout and TCP stateful inspection.
The "IP Flow Information eXport" (IFPIX) Working Group in the IETF is currently working toward standardizing existing practice by definingrequirements, information model, and architecture for flow export implementations.
Background on Flows & Router-based Flow-Export
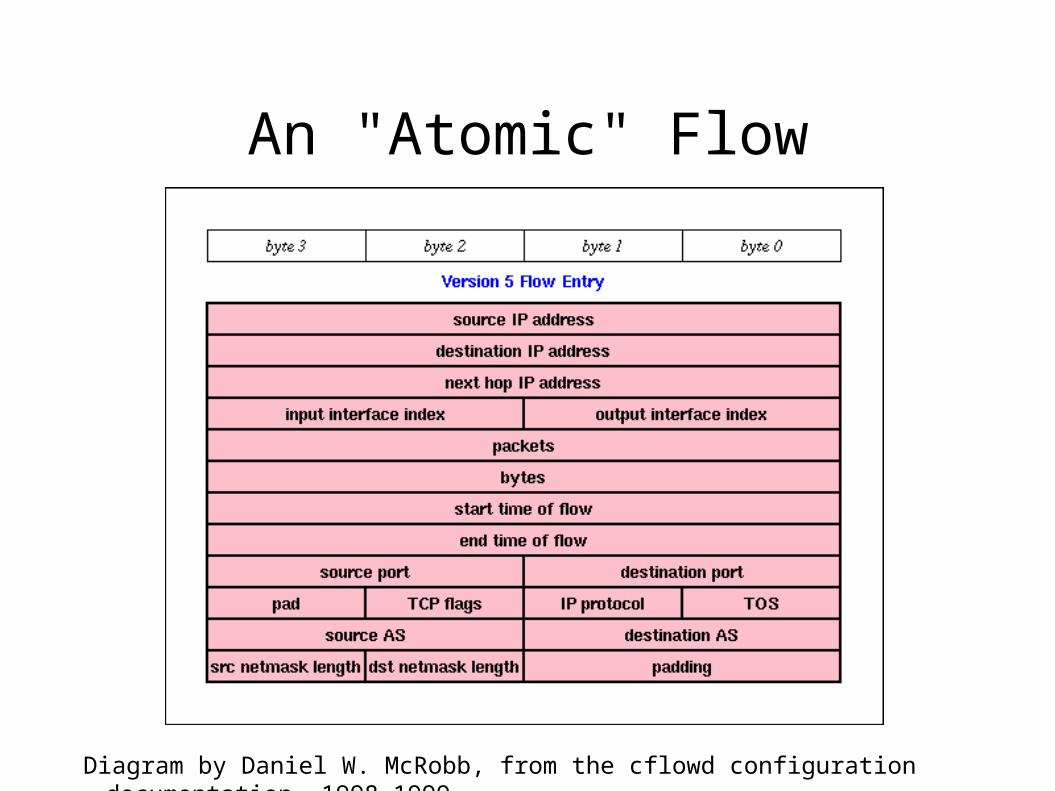
Diagram by Daniel W. McRobb, from the cflowd configuration documentation, 1998-1999.
An "Atomic" Flow
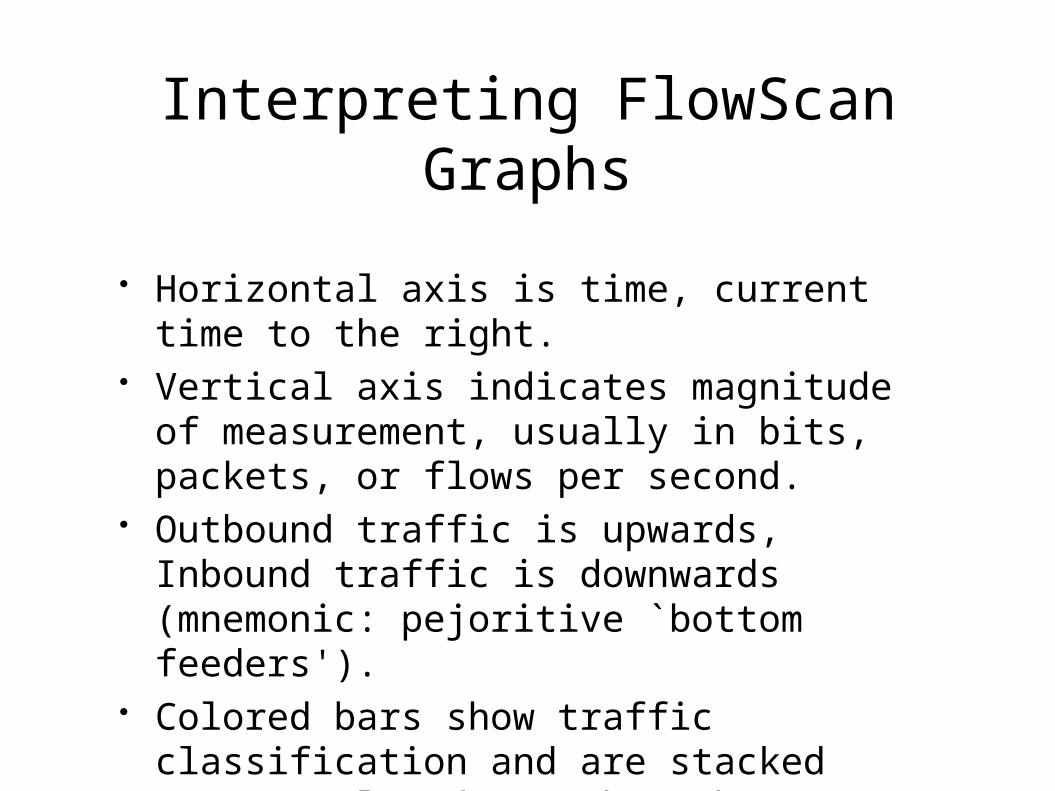
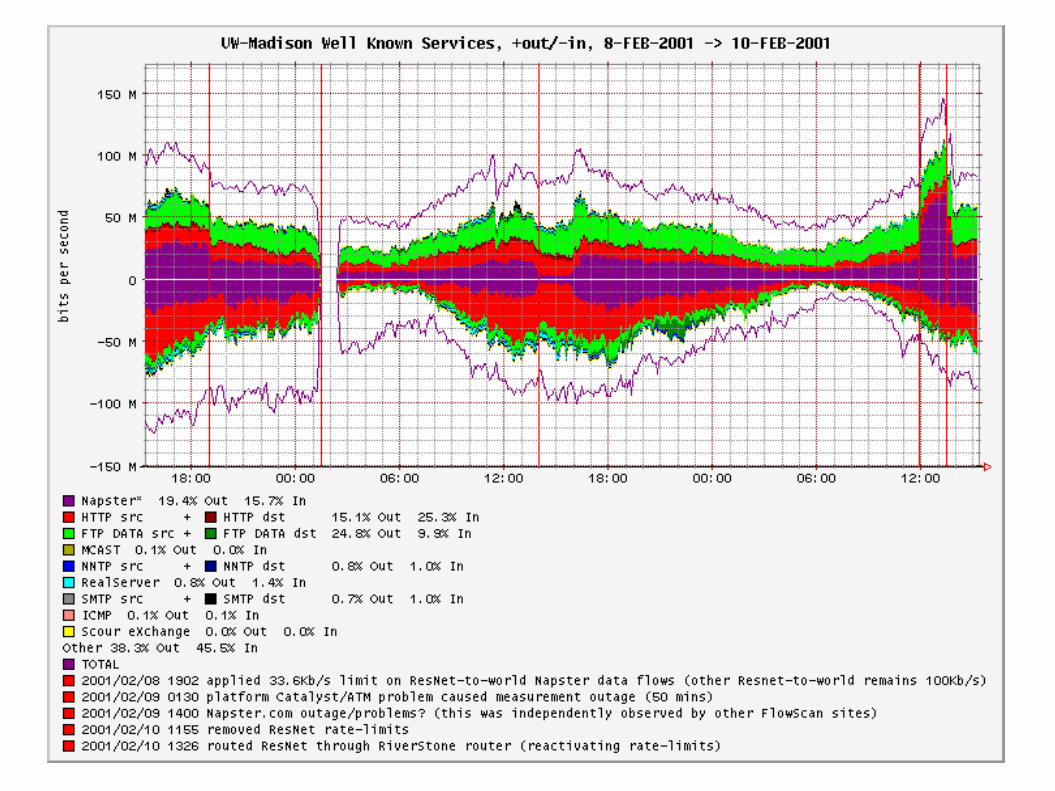
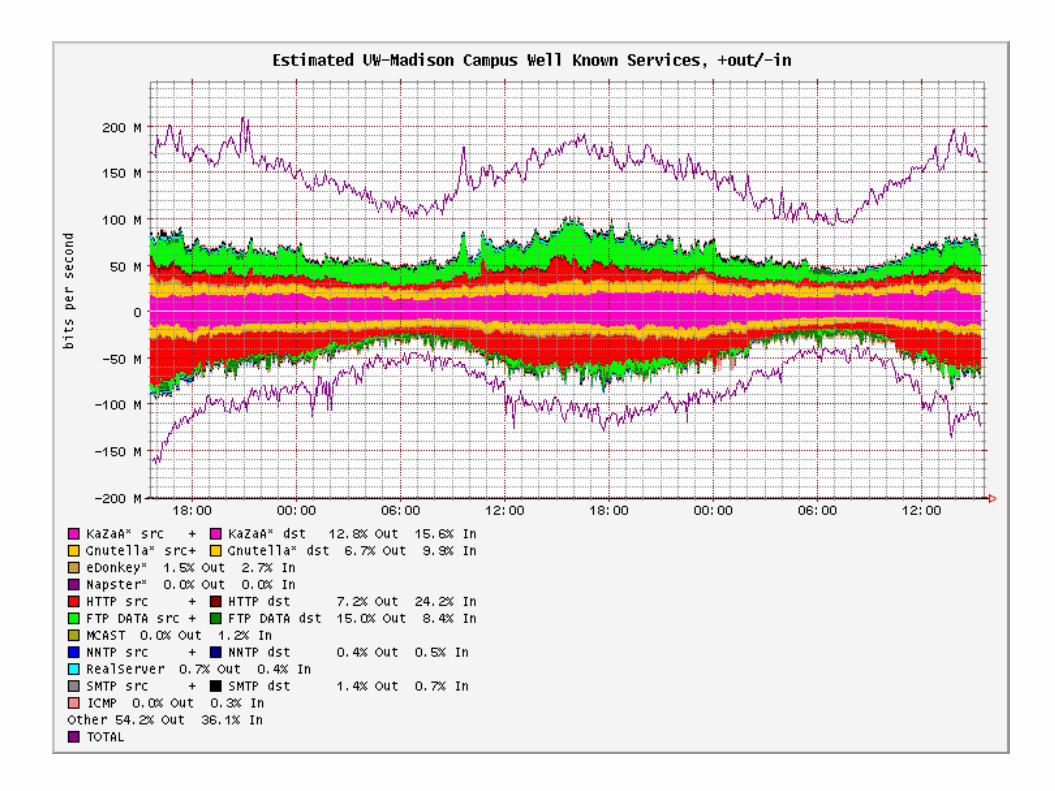
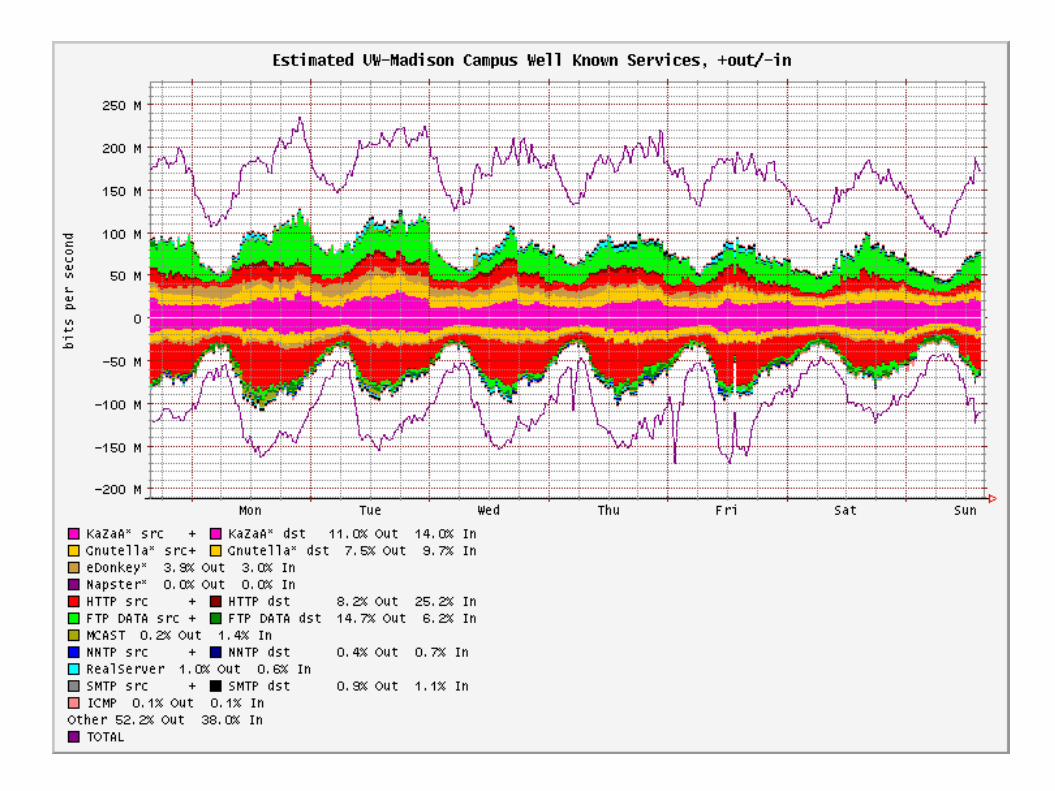
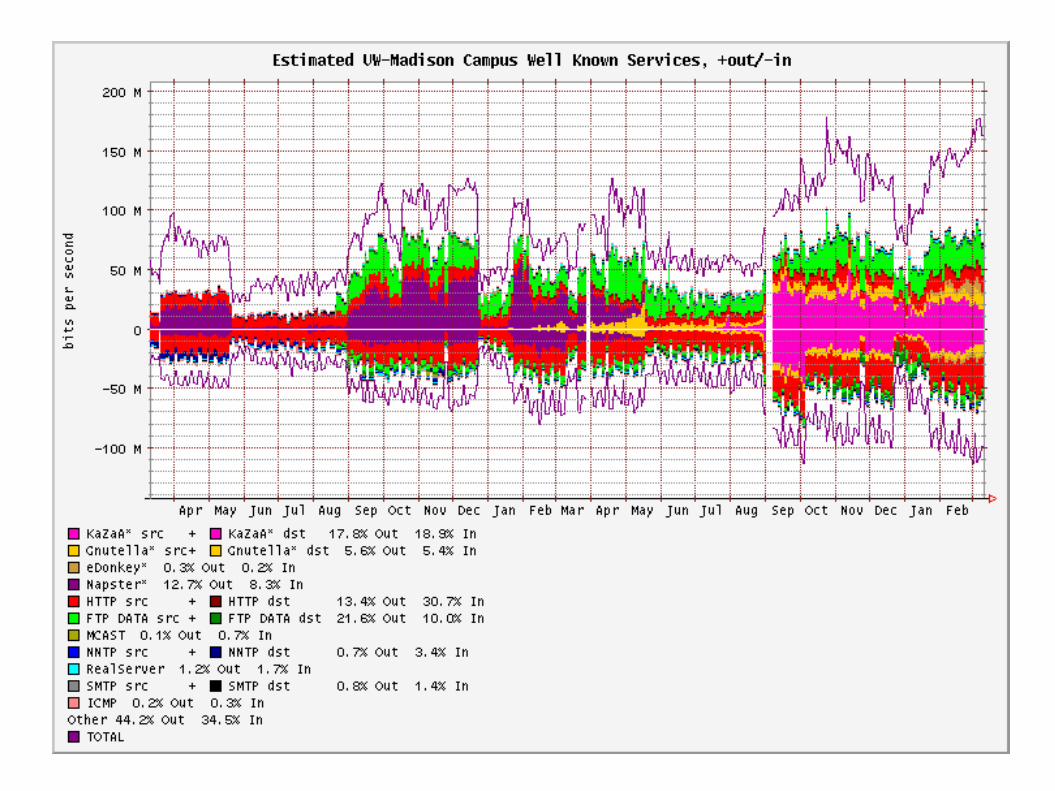
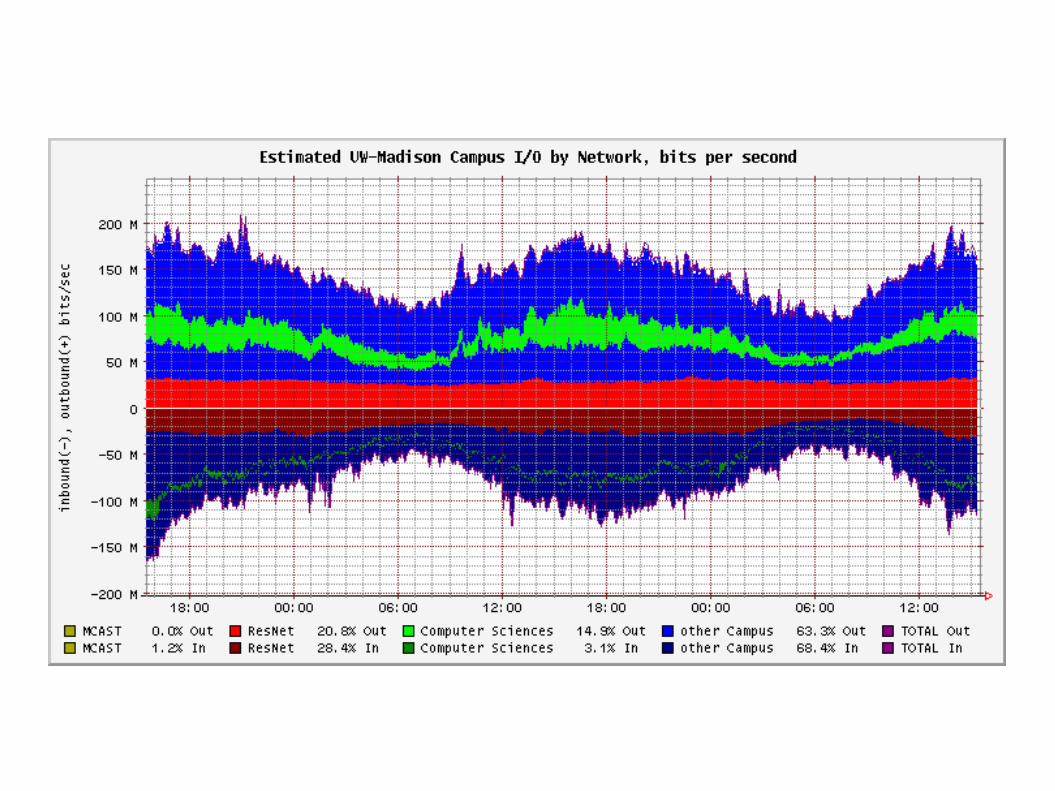
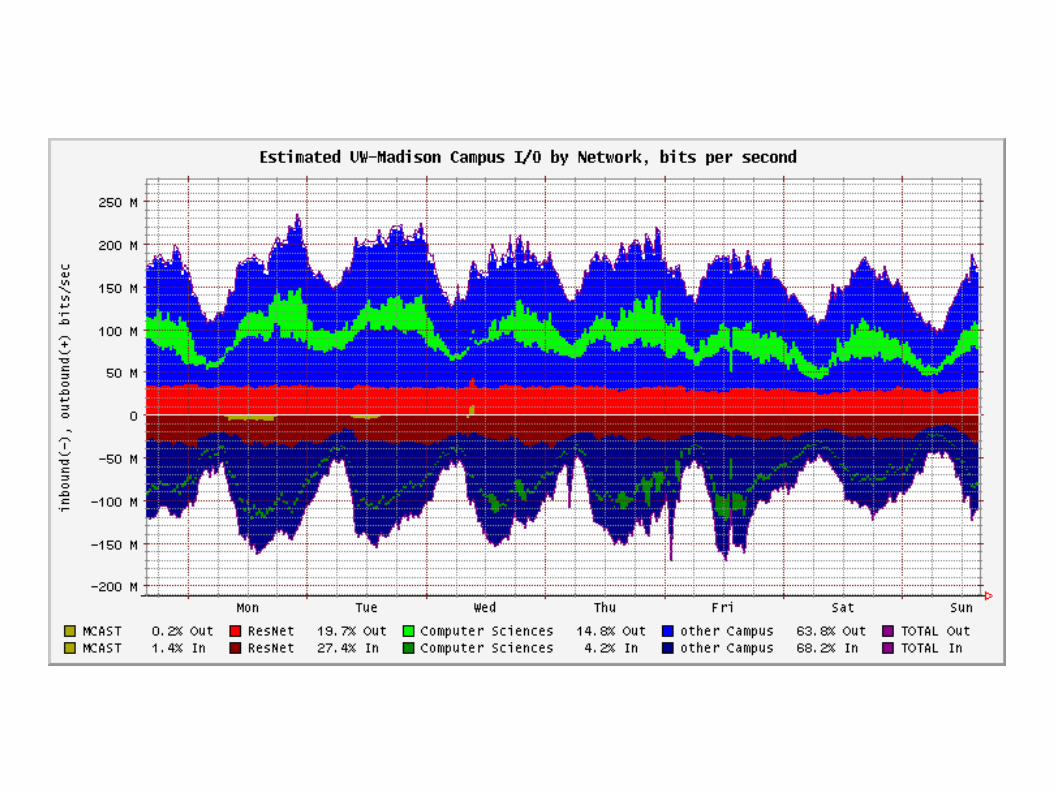
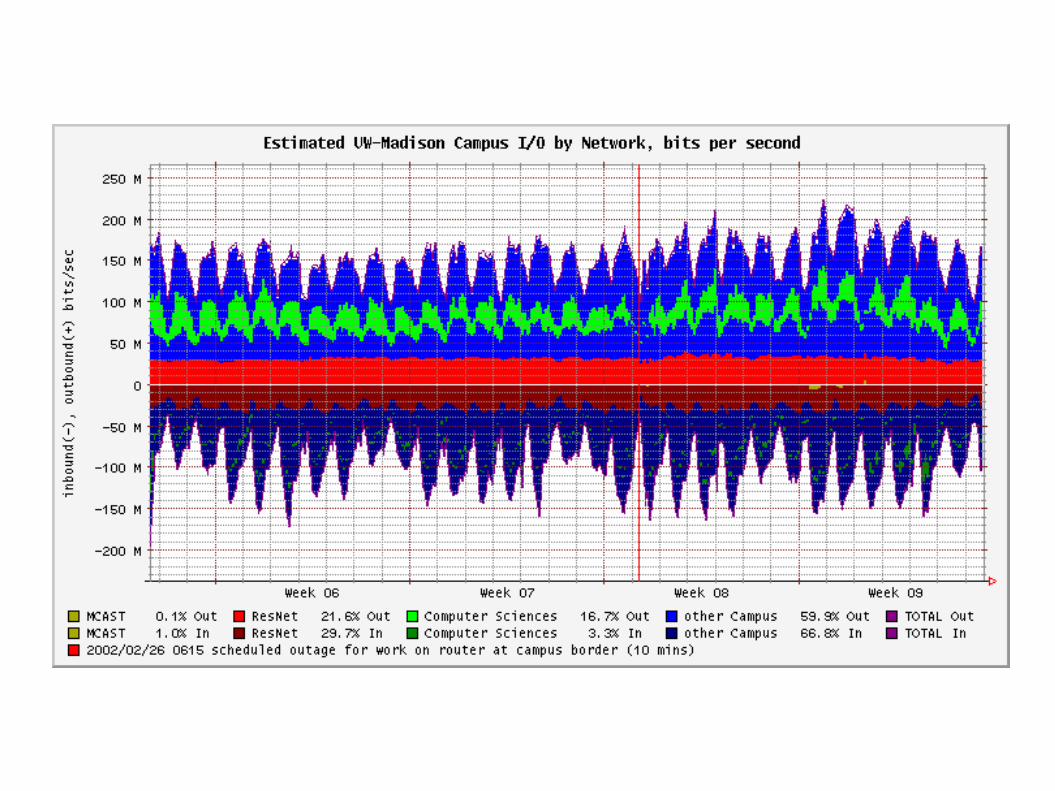
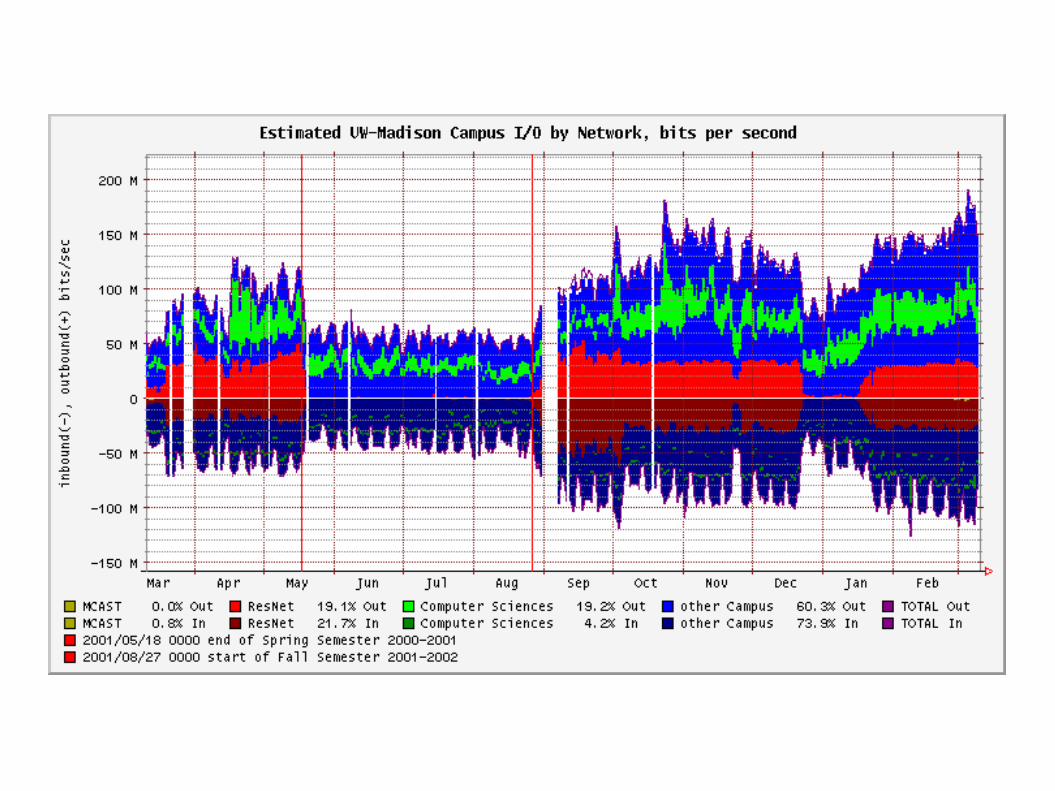
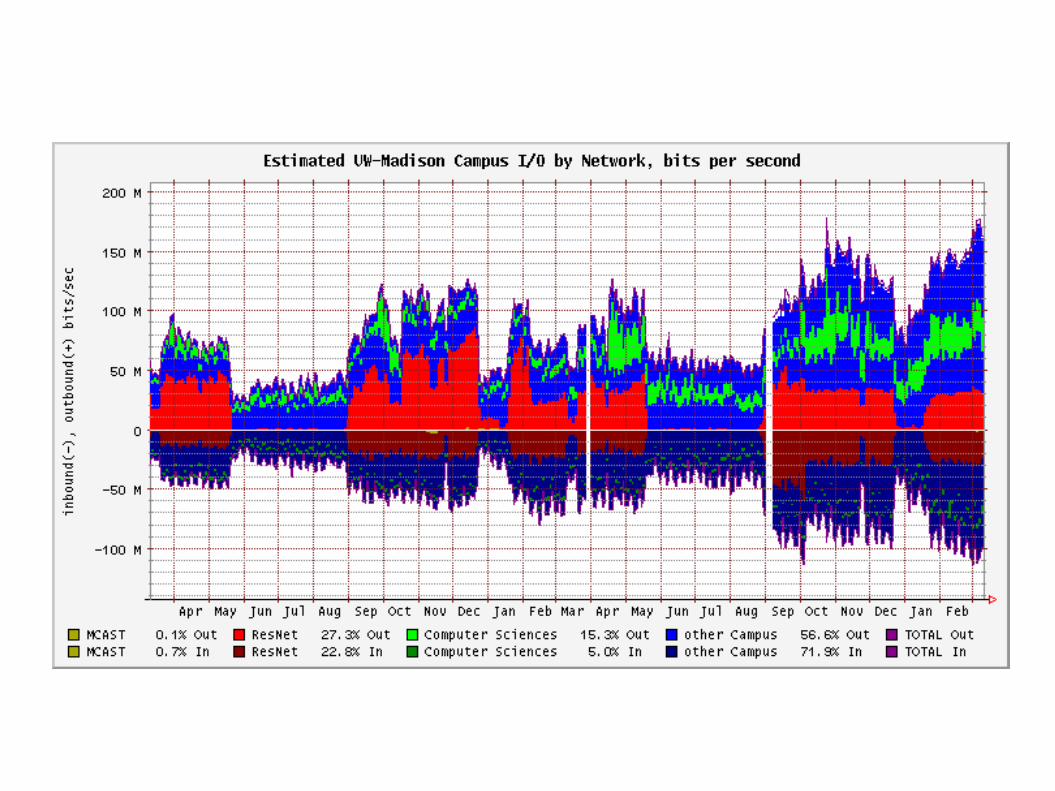
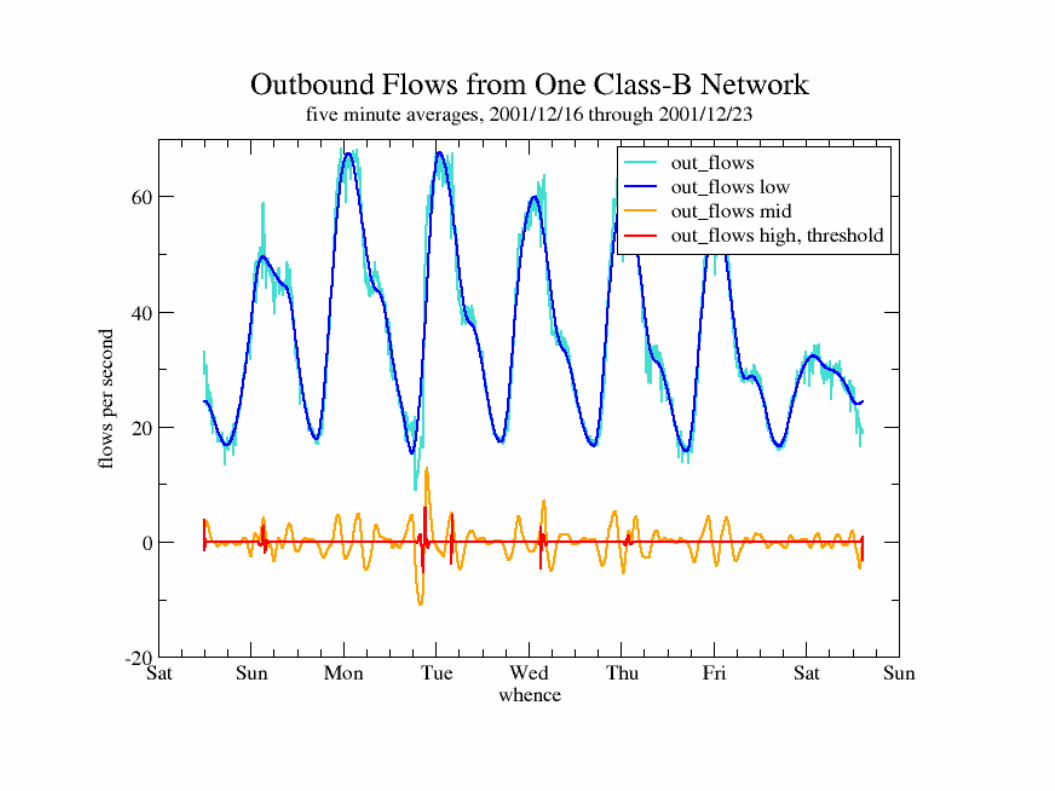
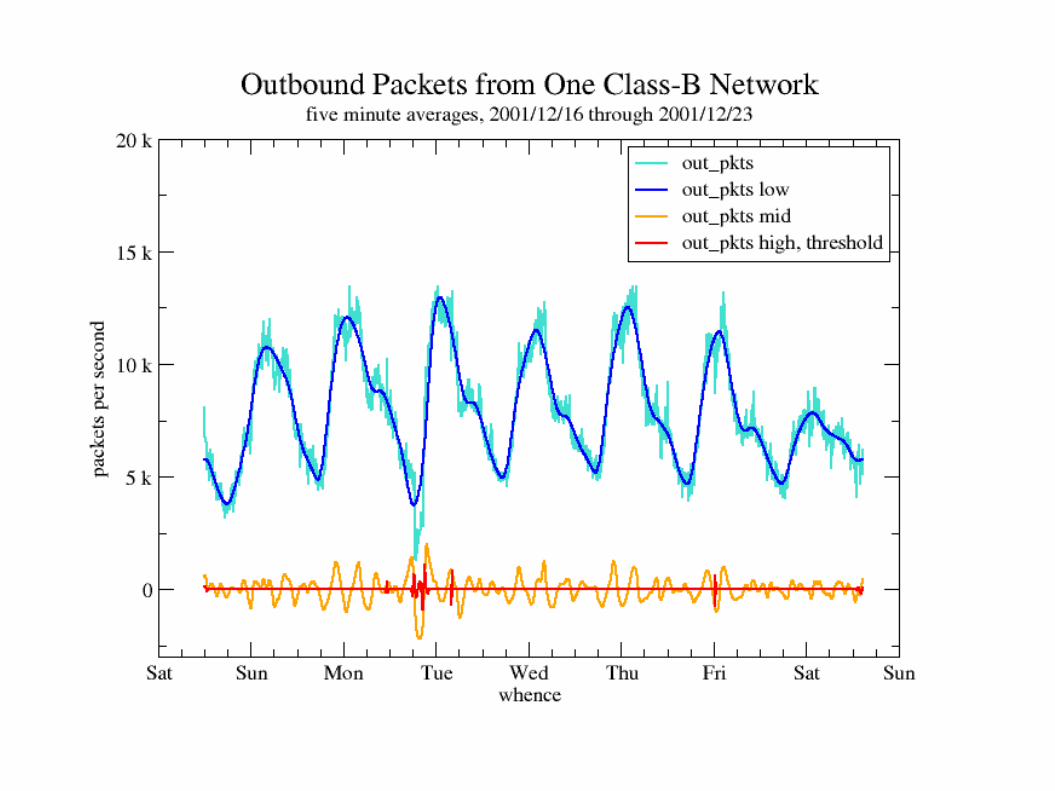
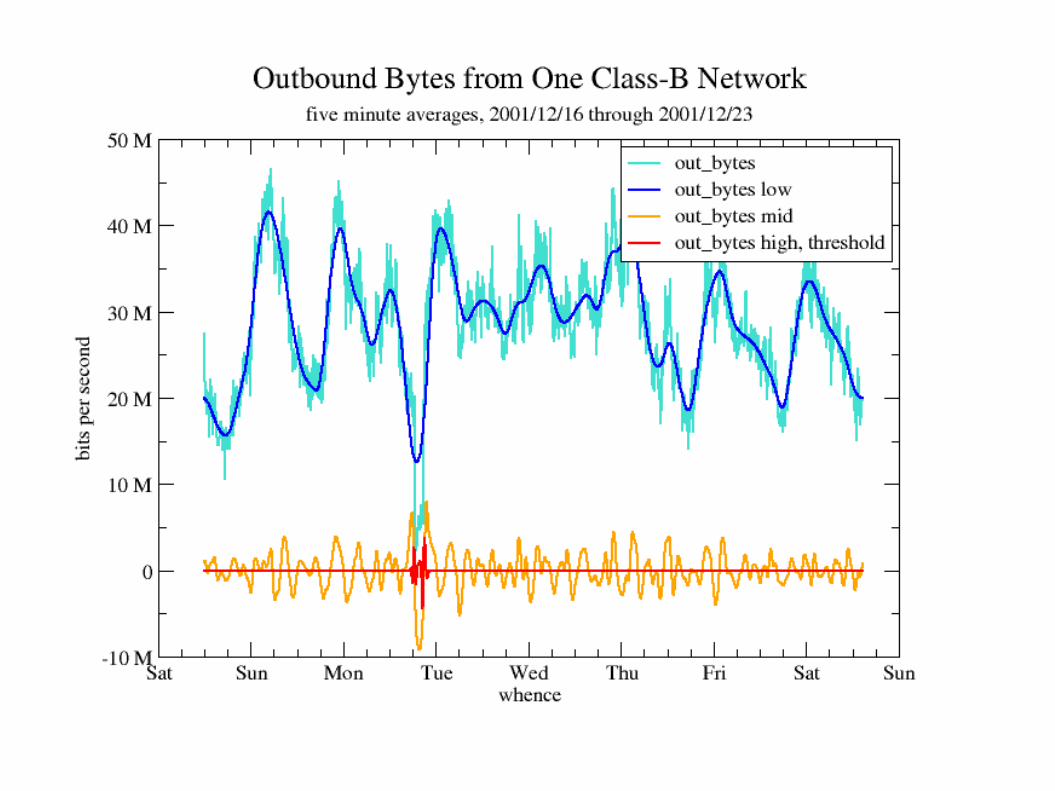
Horizontal axis is time, current time to the right. Vertical axis indicates magnitude of measurement,
usually in bits, packets, or flows per second. Outbound traffic is upwards, Inbound traffic is
downwards (mnemonic: pejoritive `bottom feeders').
Colored bars show traffic classification and are stacked (not overlayed) to show the total.
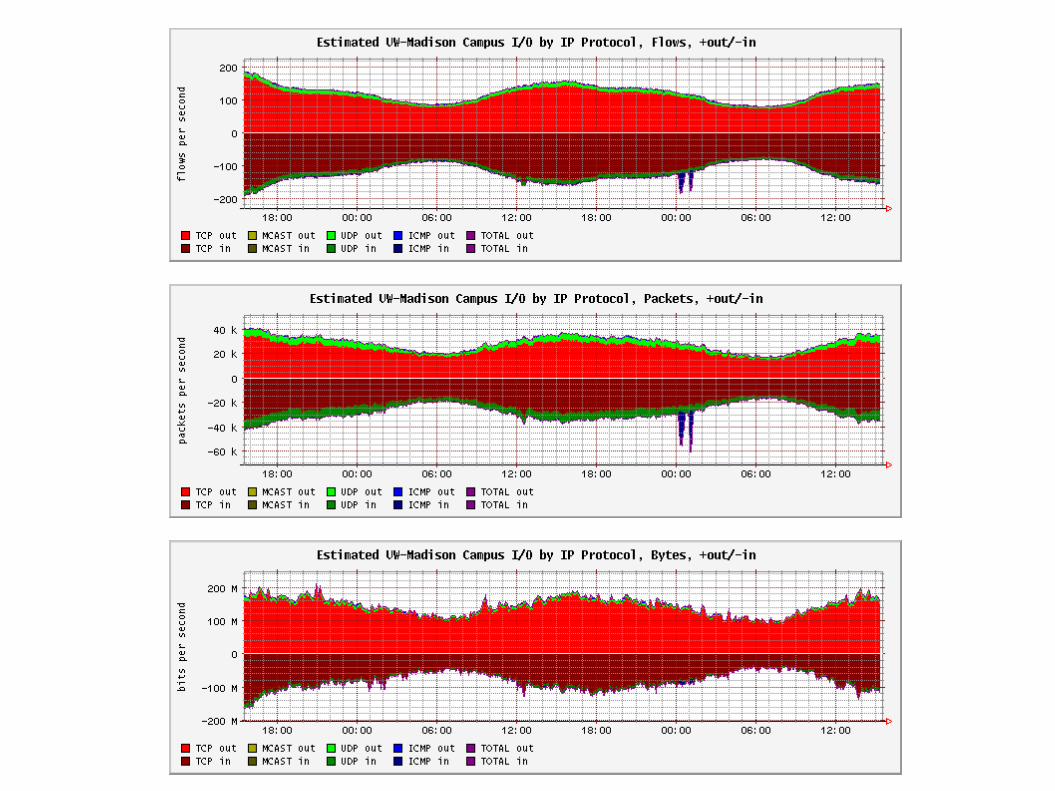
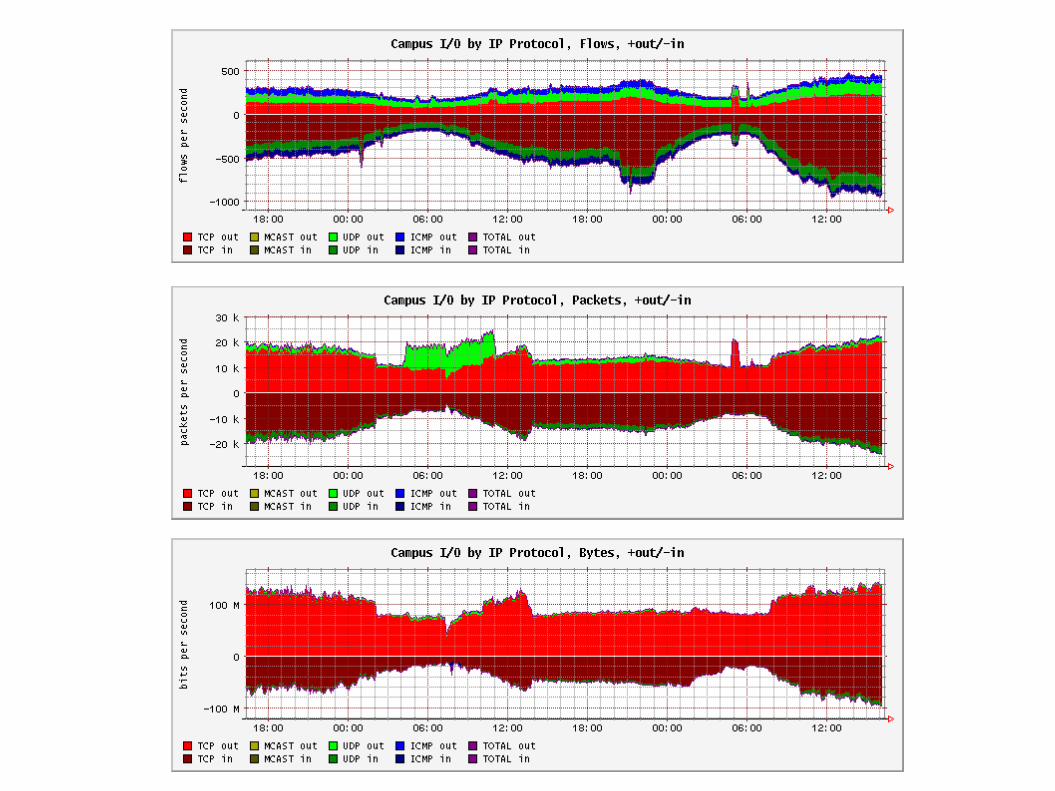
Interpreting FlowScan Graphs
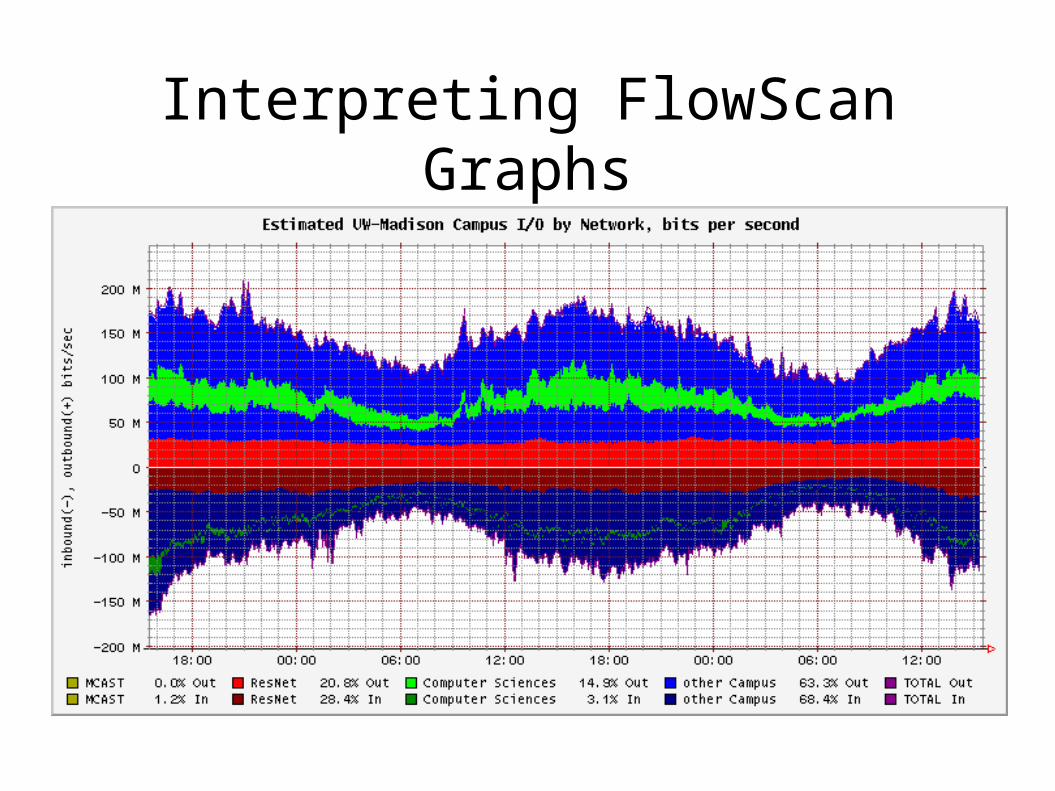
Interpreting FlowScan Graphs
Hardware and Software Components
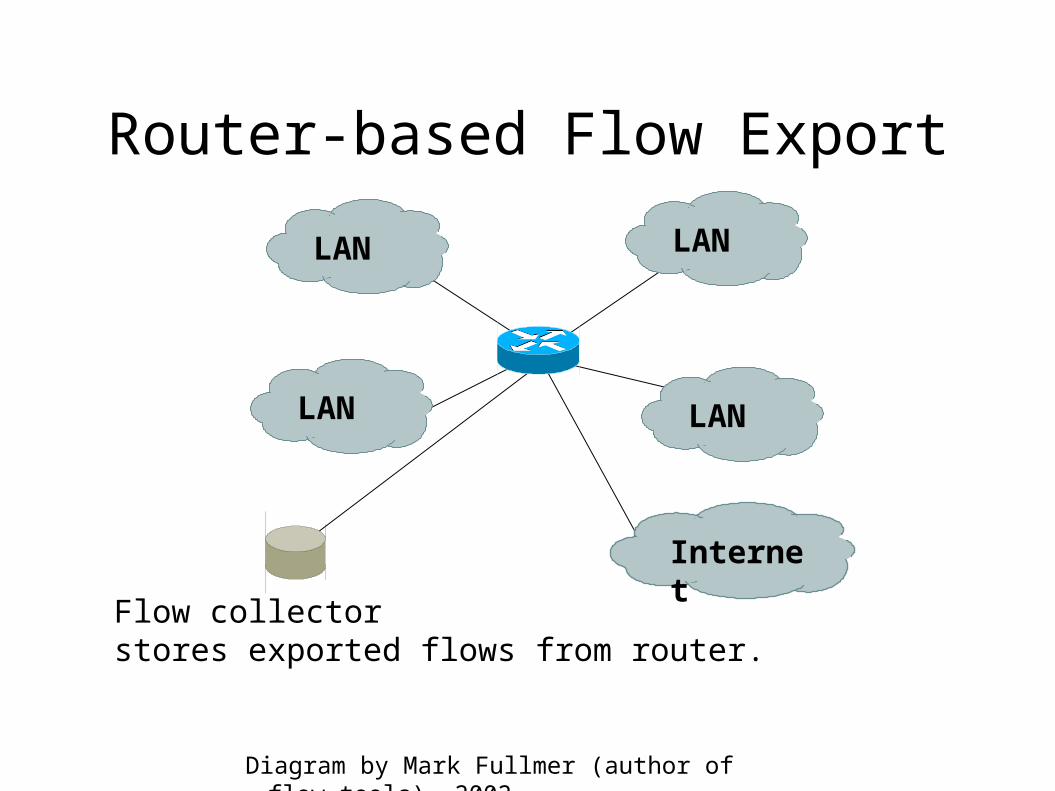
Flow collectorstores exported flows from router.
LAN
LAN
LAN
LAN
Internet
Diagram by Mark Fullmer (author of flow-tools), 2002.
Router-based Flow Export
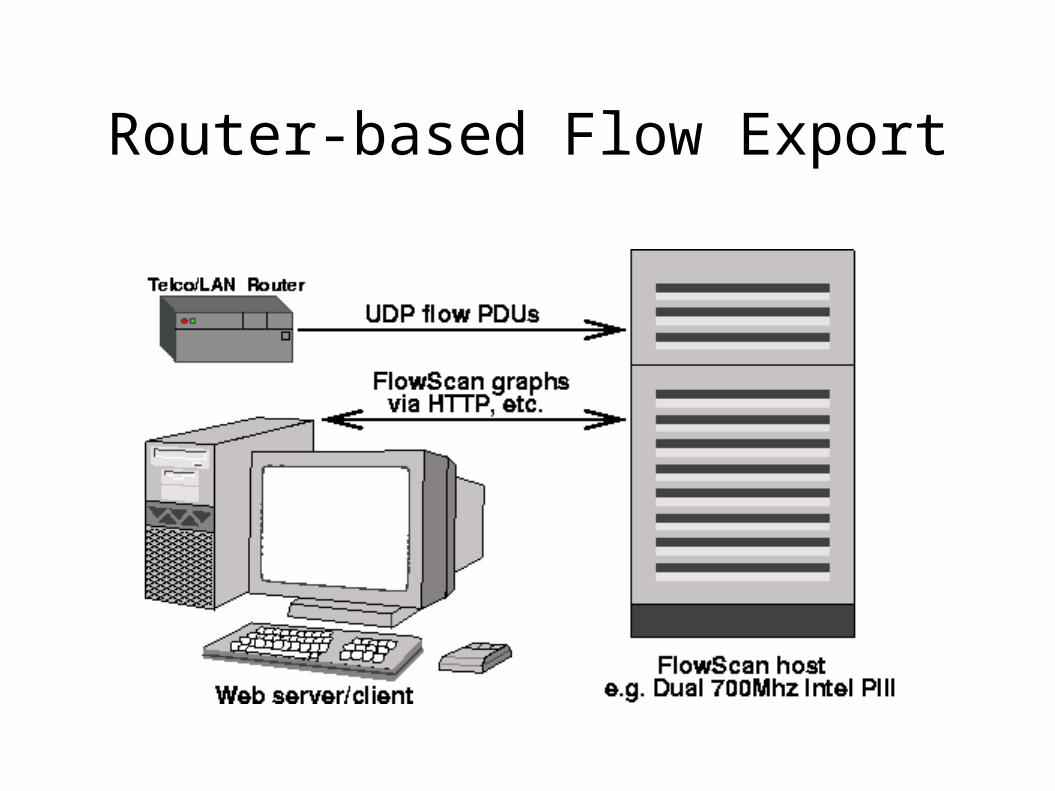
Router-based Flow Export
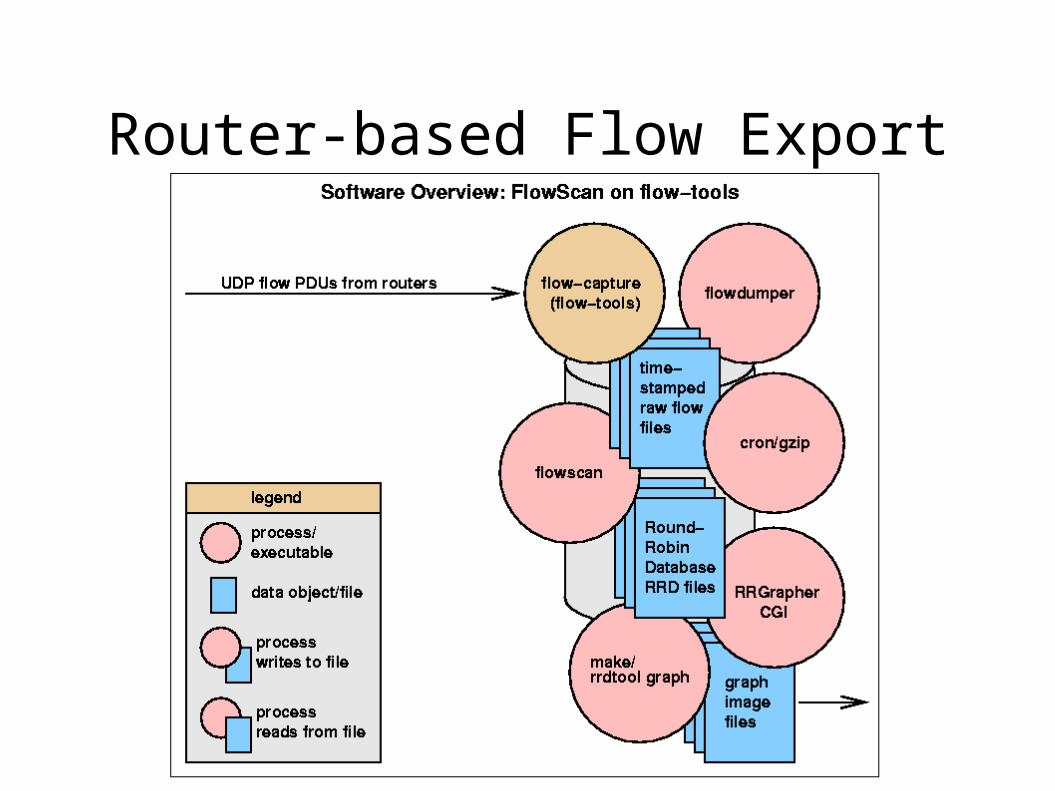
Router-based Flow Export
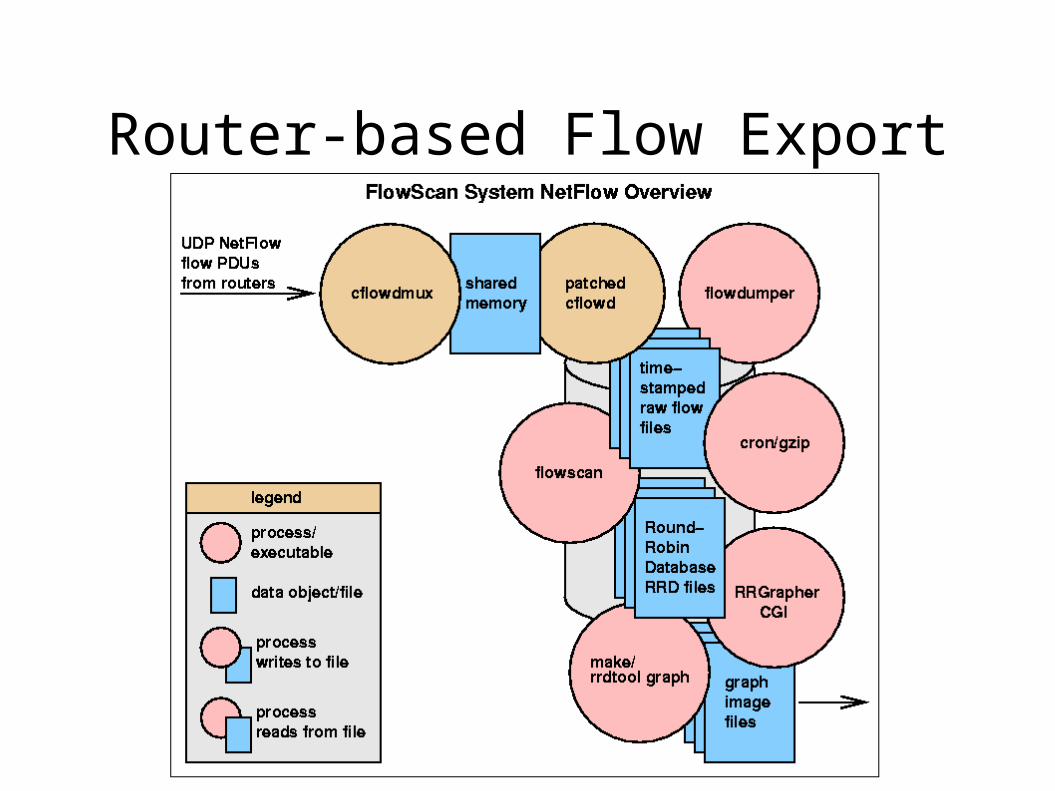
Router-based Flow Export
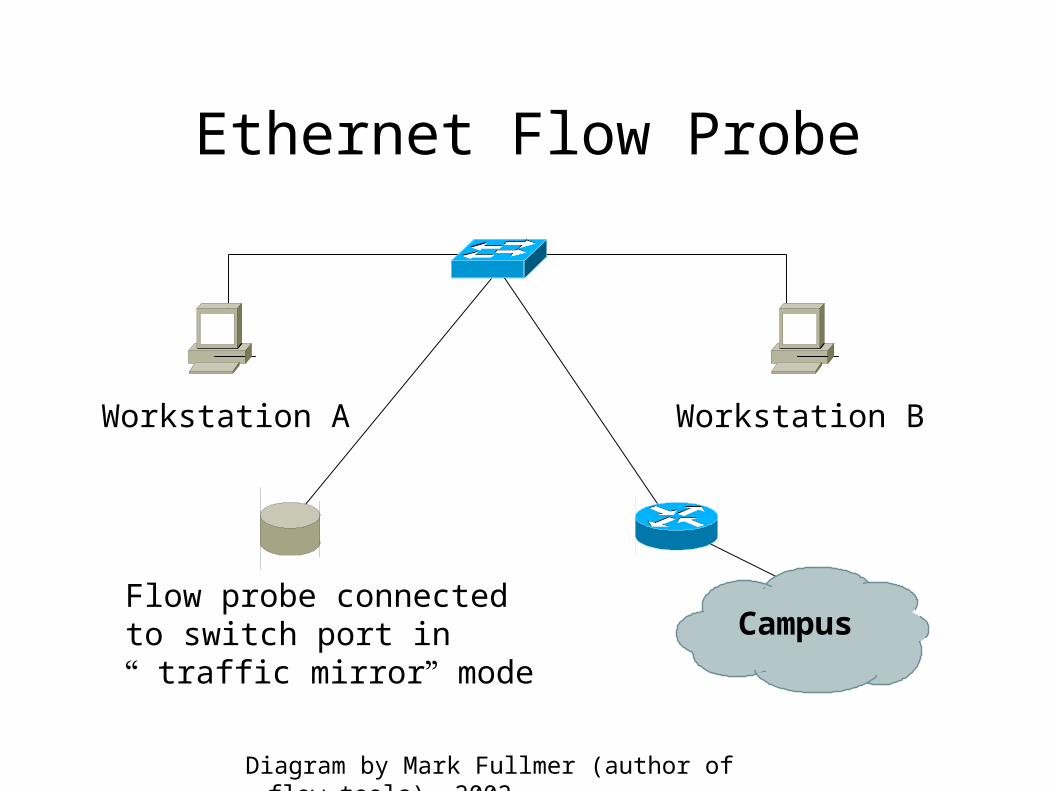
Workstation A Workstation B
Campus Flow probe connectedto switch port in traffic mirror mode
Diagram by Mark Fullmer (author of flow-tools), 2002.
Ethernet Flow Probe
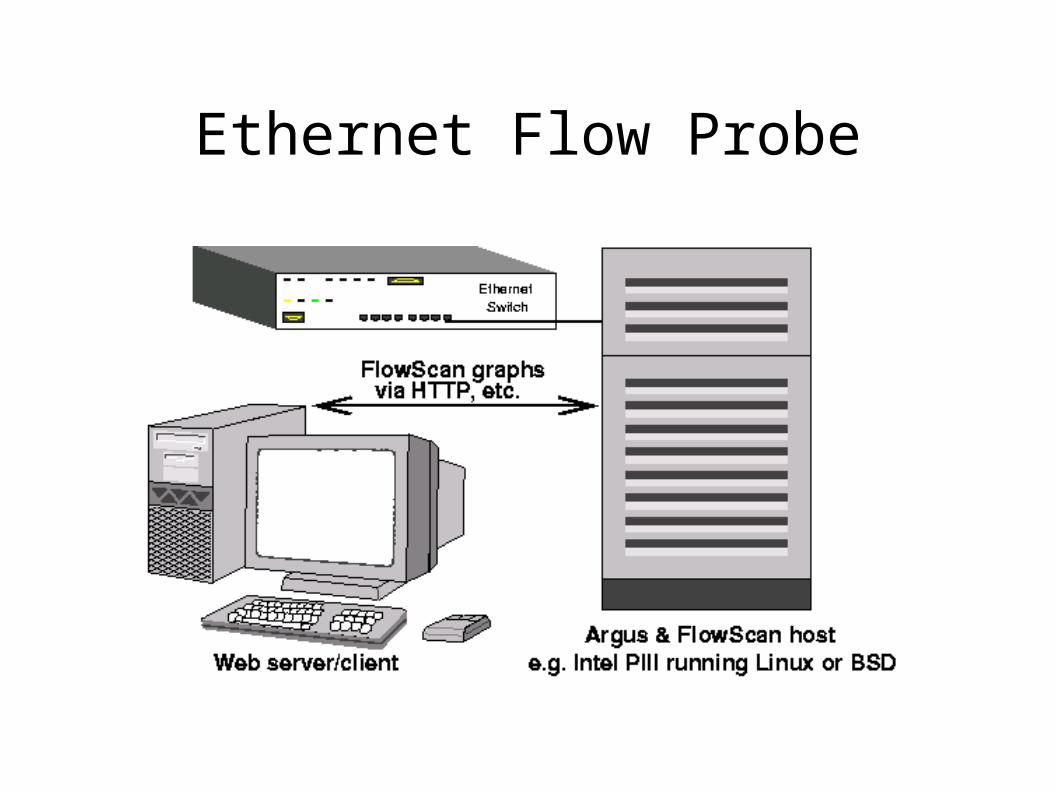
Ethernet Flow Probe
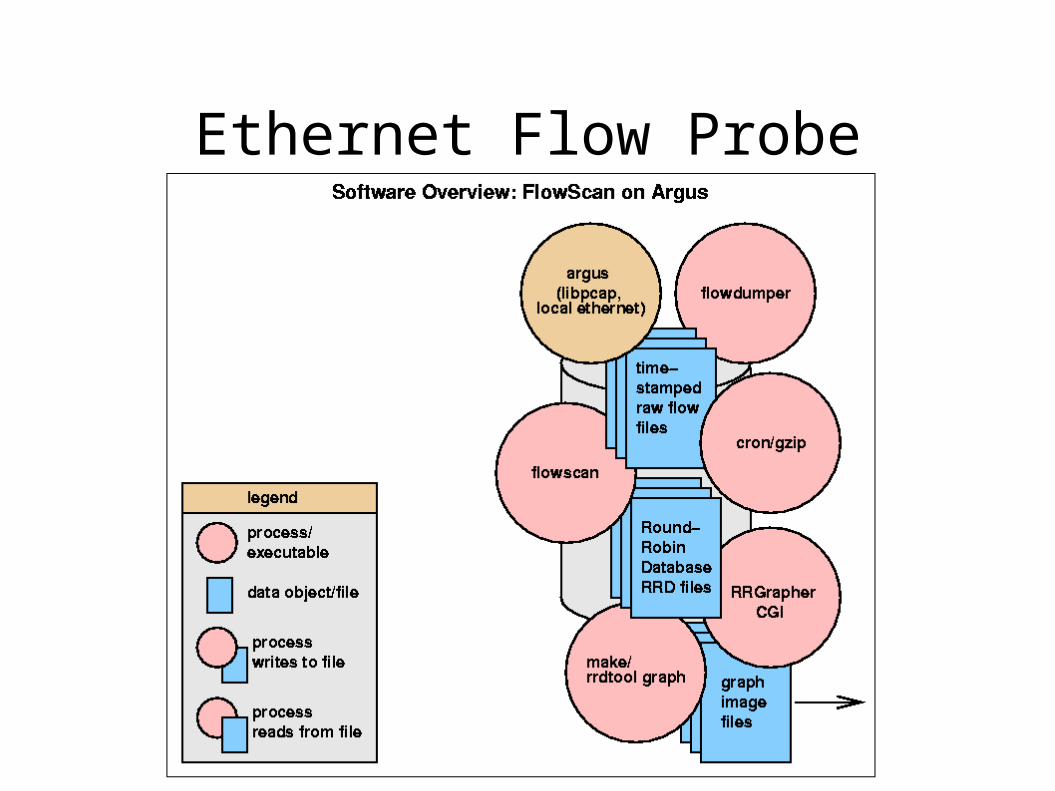
Ethernet Flow Probe
Interpreting Graphs Review
Events & Anomalies
Denial-of-Service Probes, Scans Worm Propagation Flash Crowds Distributed Denial-of-Service
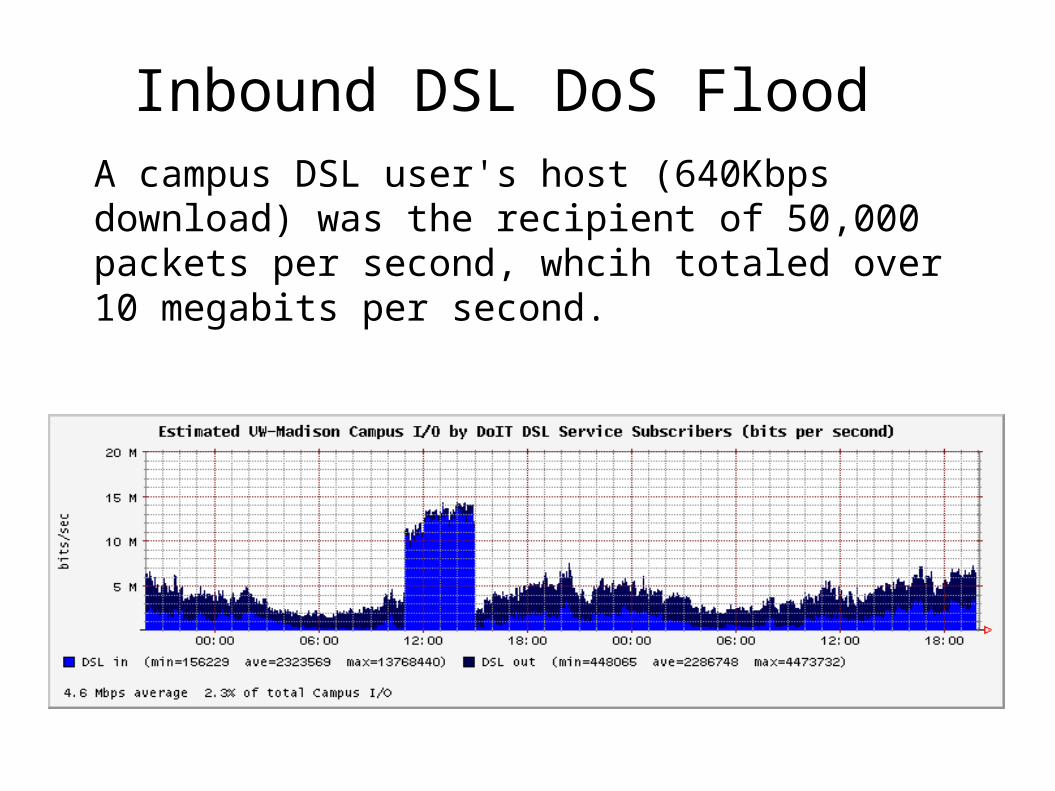
Inbound DSL DoS FloodA campus DSL user's host (640Kbps download) was the recipient of 50,000 packets per second, whcih totaled over 10 megabits per second.
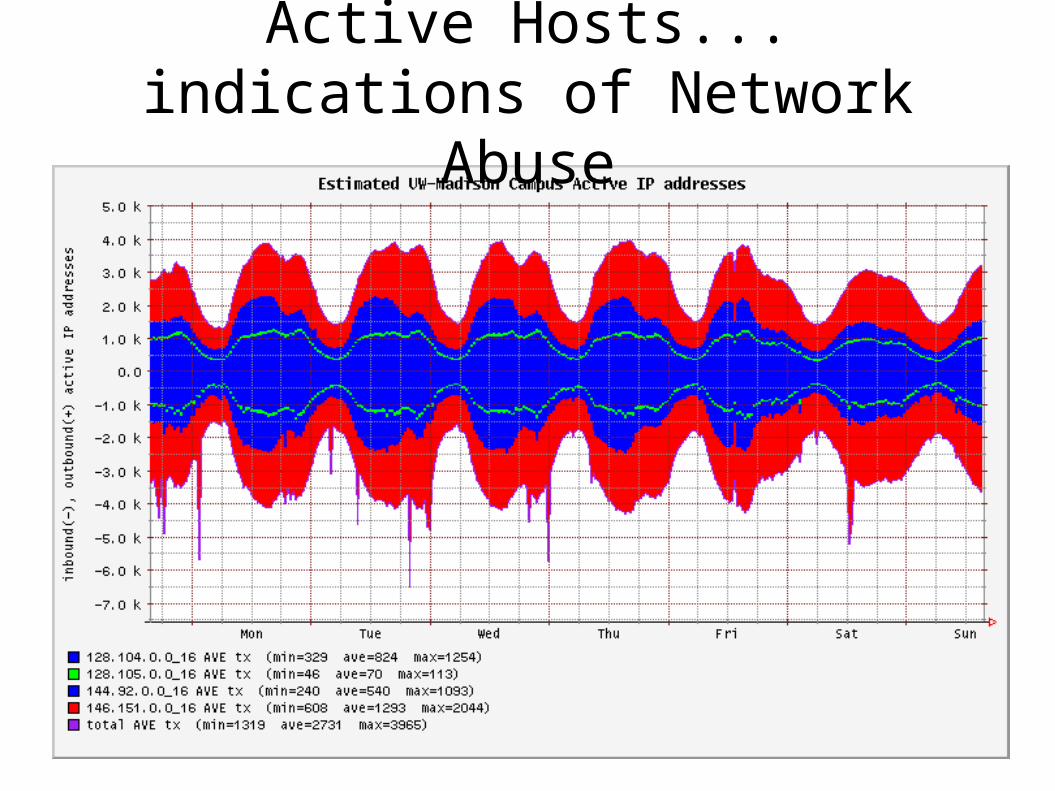
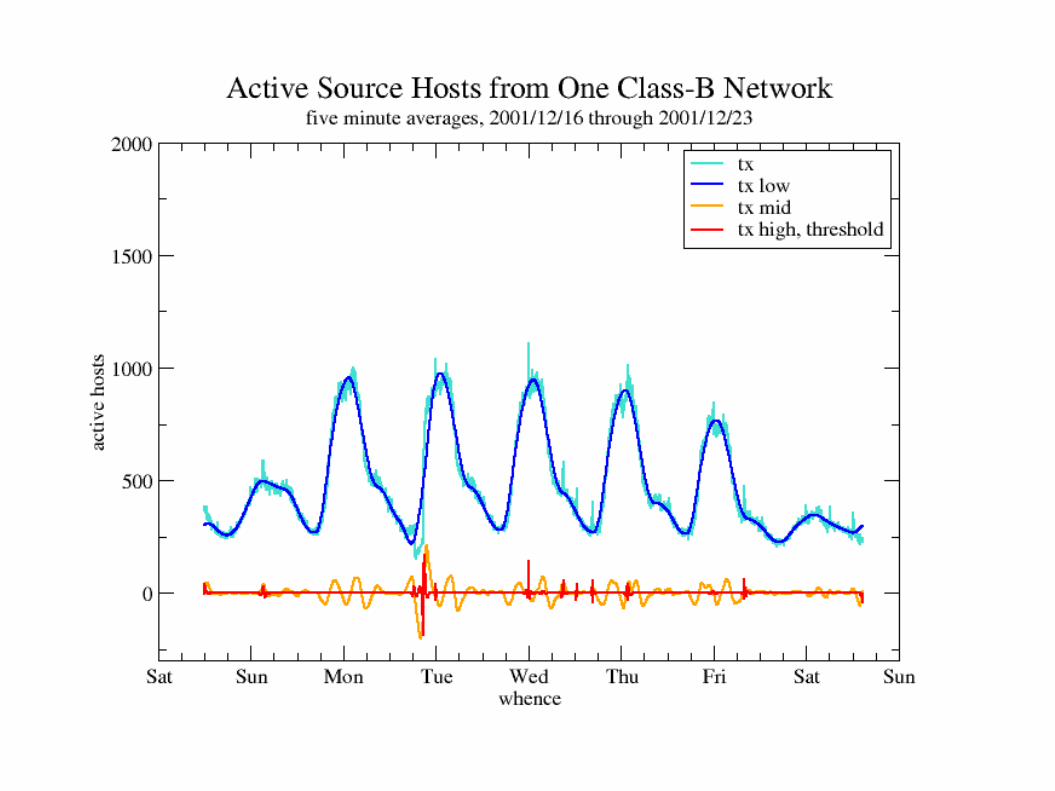
Active Hosts... indications of Network Abuse
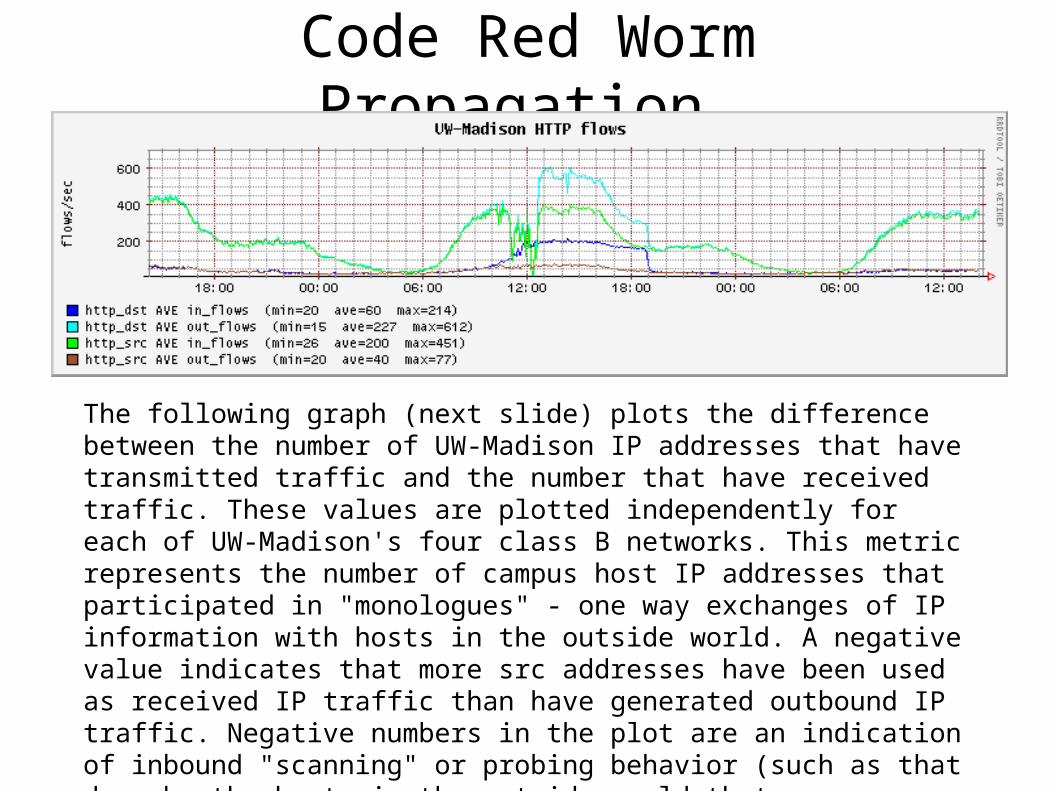
Code Red Worm Propagation
The following graph (next slide) plots the difference between the number of UW-Madison IP addresses that have transmitted traffic and the number that have received traffic. These values are plotted independently for each of UW-Madison's four class B networks. This metric represents the number of campus host IP addresses that participated in "monologues" - one way exchanges of IP information with hosts in the outside world. A negative value indicates that more src addresses have been used as received IP traffic than have generated outbound IP traffic. Negative numbers in the plot are an indication of inbound "scanning" or probing behavior (such as that done by the hosts in the outside world that were infected with the Code Red worm) because those scans often attempt to talk to unused campus IP addresses or to hosts which simply do not respond because of firewall policies.
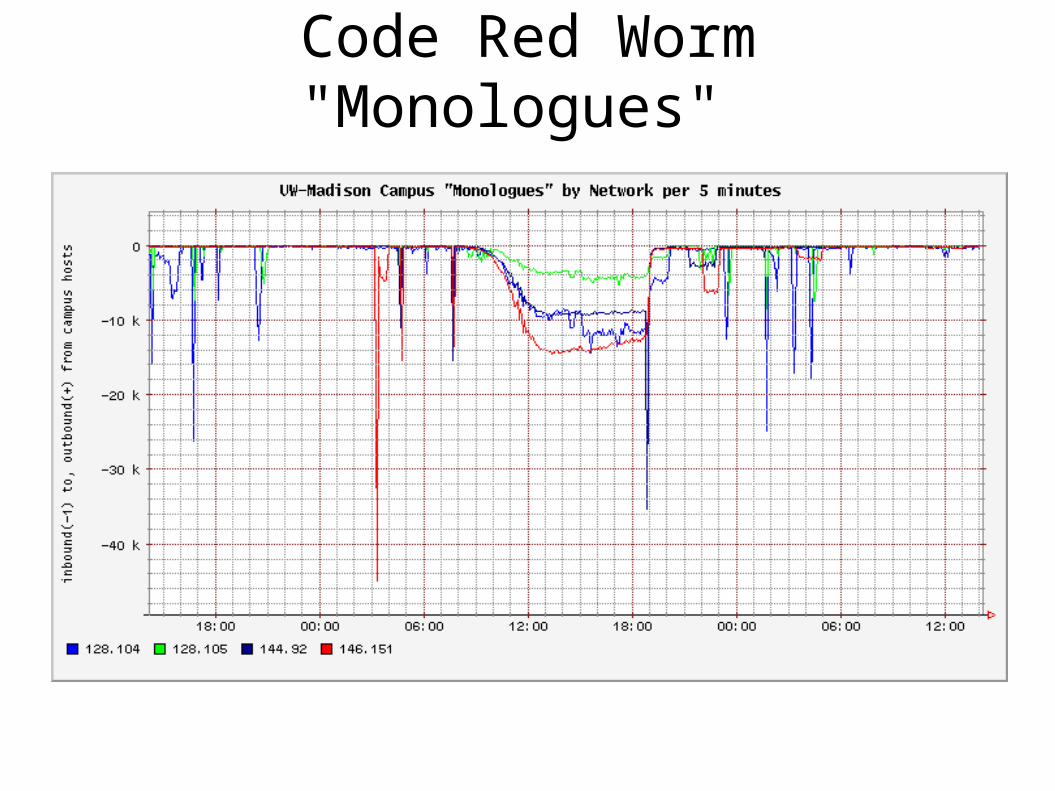
Code Red Worm "Monologues"
Larry Niven's 1973 SF short story "Flash Crowd" predicted that one consequence of cheap teleportation would be huge crowds materializing almost instantly at the sites of interesting news stories. Twenty years later the term passed into common use on the Internet to describe exponential spikes in website or server usage when one passes a certain threshold of popular interest.
http://www.tuxedo.org/~esr/jargon/html/entry/flash-crowd.html
Flash Crowds
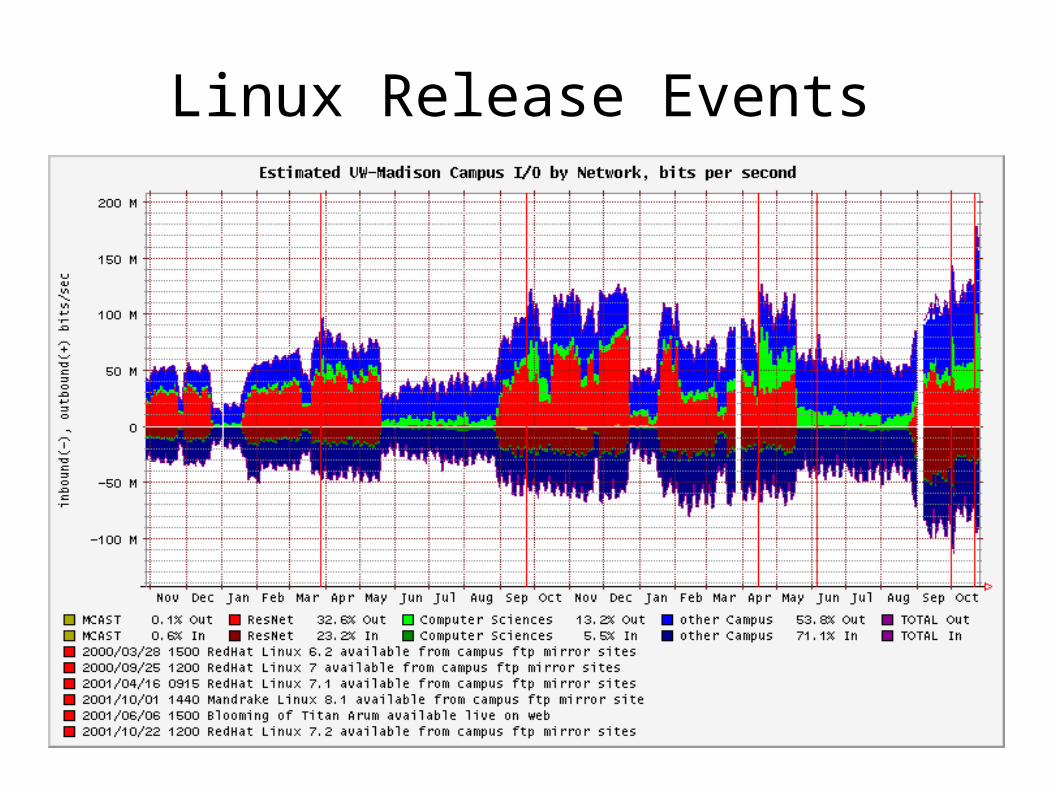
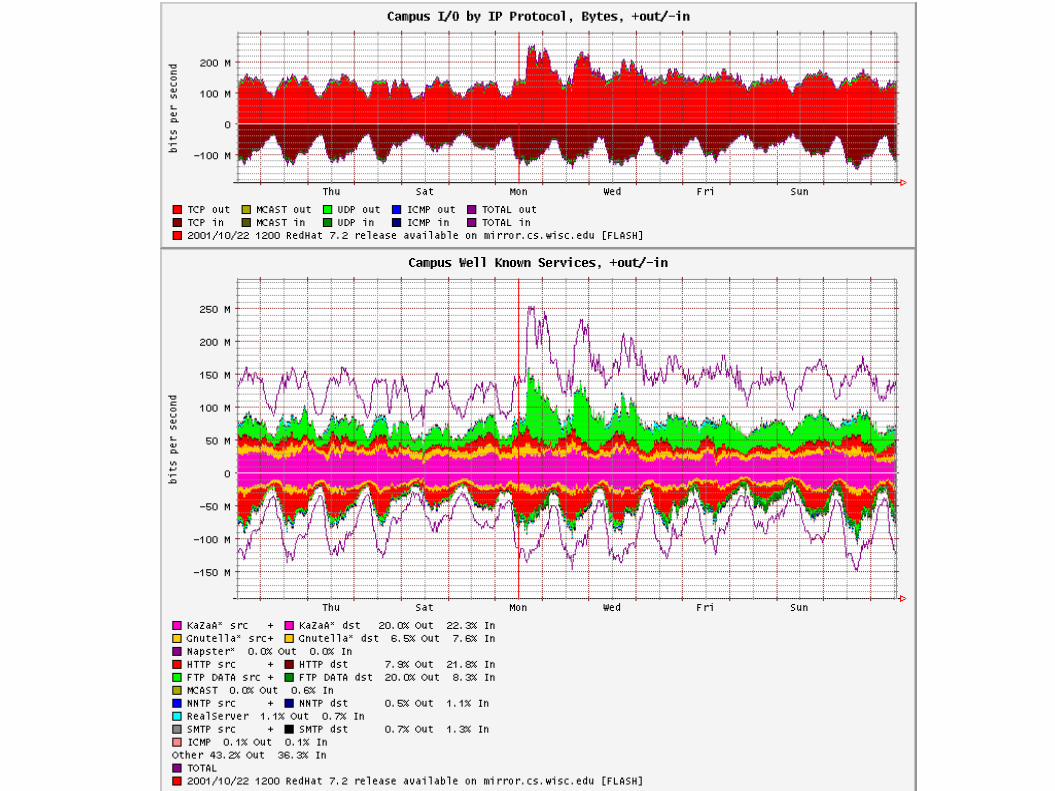
Linux Release Events
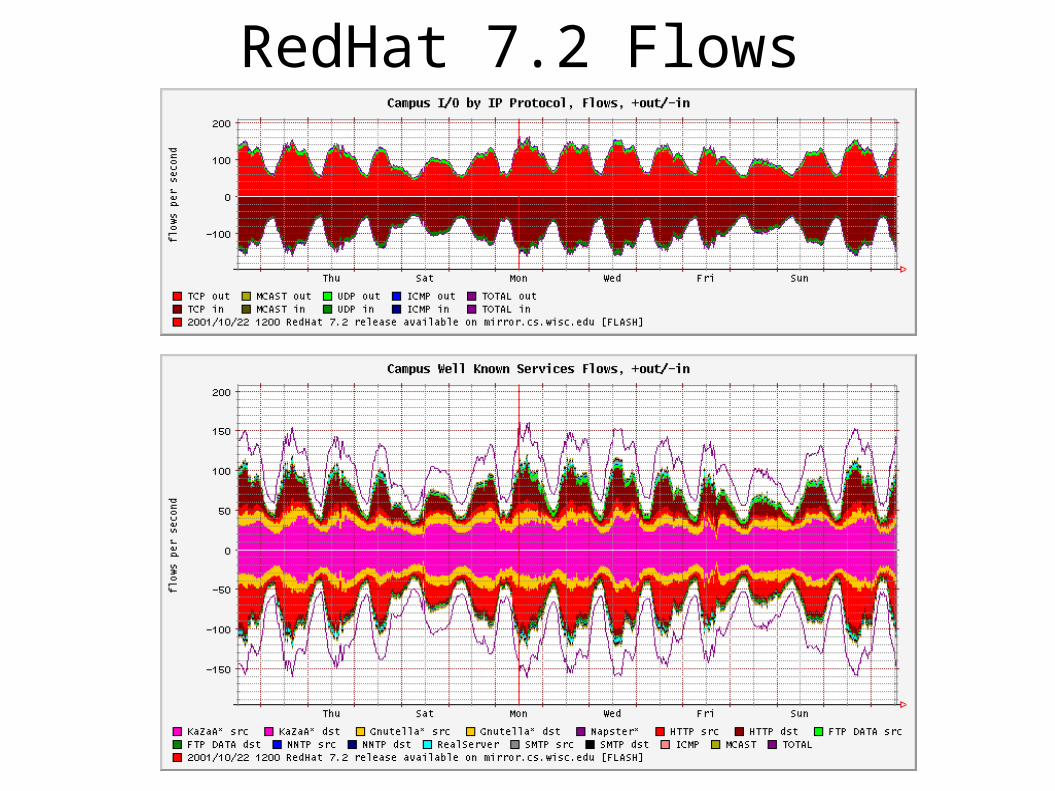
RedHat 7.2 Flows

On June 7, 2001, UW-Madison's 8-feet, 5-inch tall titan opened up gradually over the course of six hours
This illustration shows Titan Arum in bud, left, and full bloom, center. Inside the base of the spadix (the fleshy central column of the flower) are over a thousand tiny flowers, right.
The Blooming of the Titan Arum http://www.news.wisc.edu/titanarum/
Photo: Michael Rothbart, Illustration: Kandis Elliot
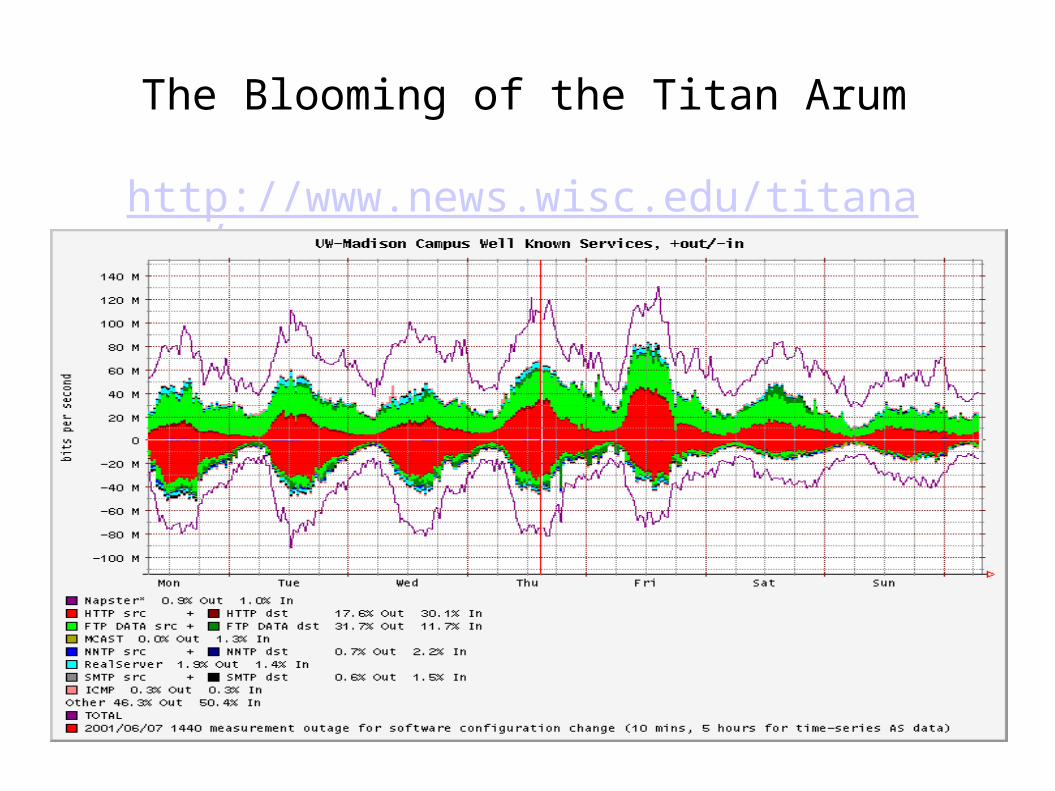
The Blooming of the Titan Arum http://www.news.wisc.edu/titanarum/
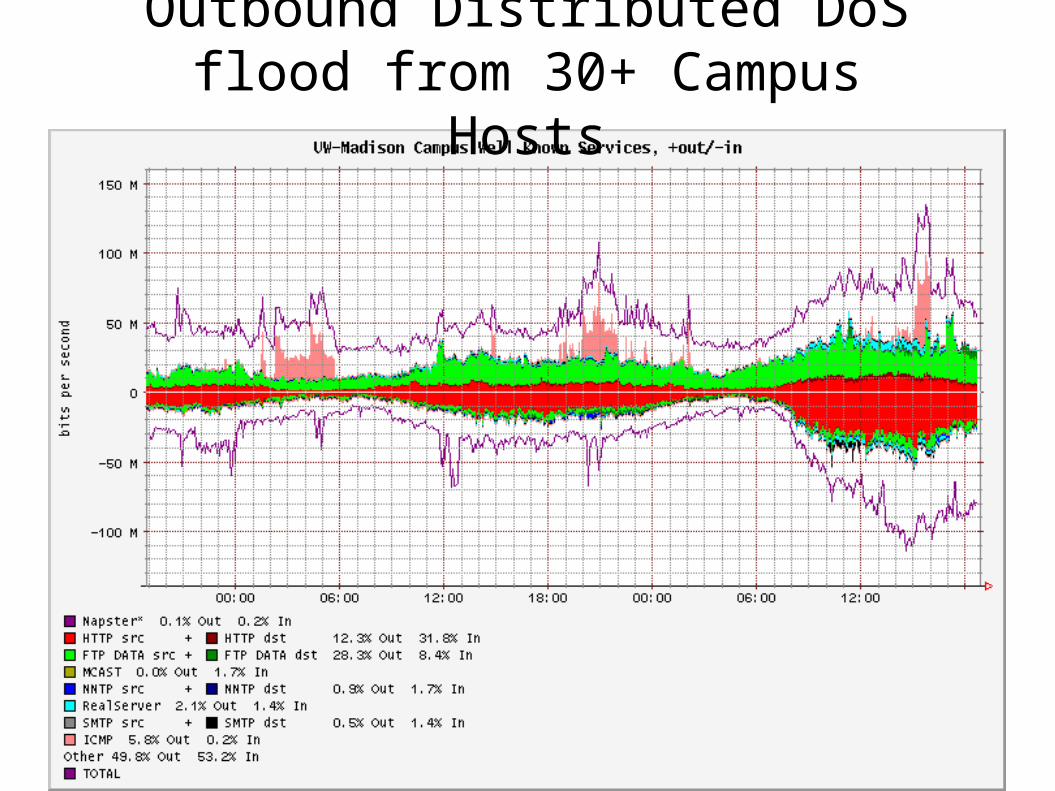
Outbound Distributed DoS flood from 30+ Campus Hosts
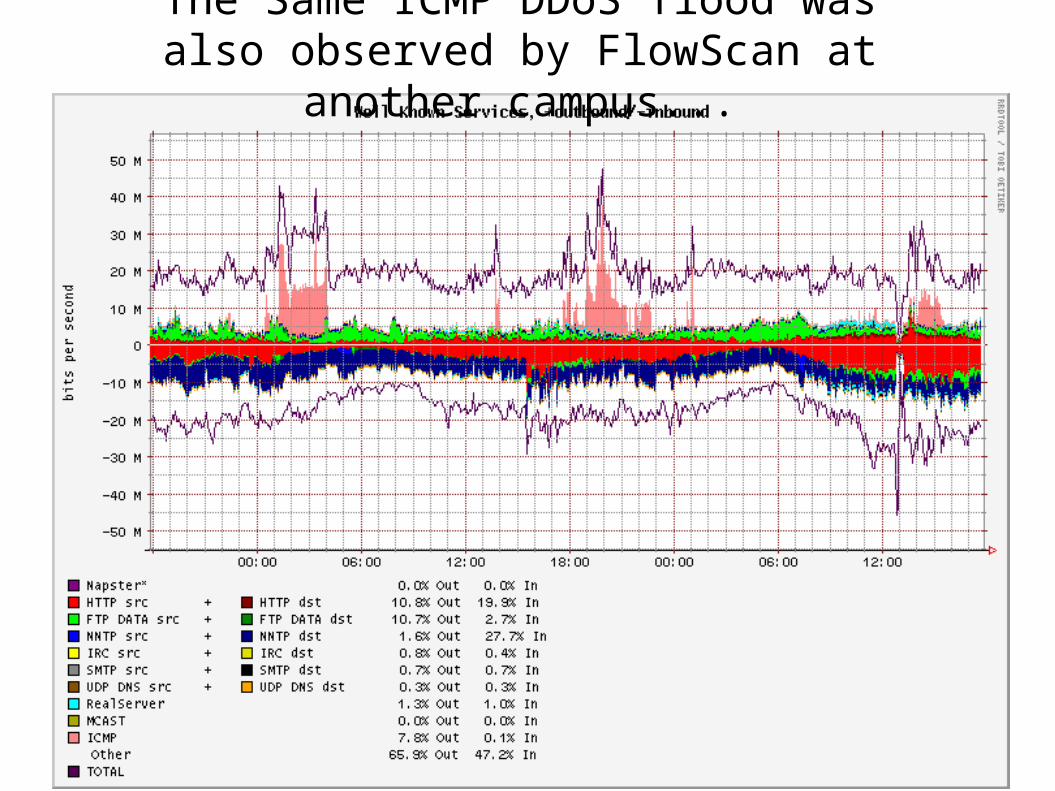
The Same ICMP DDoS flood was also observed by FlowScan at another campus...
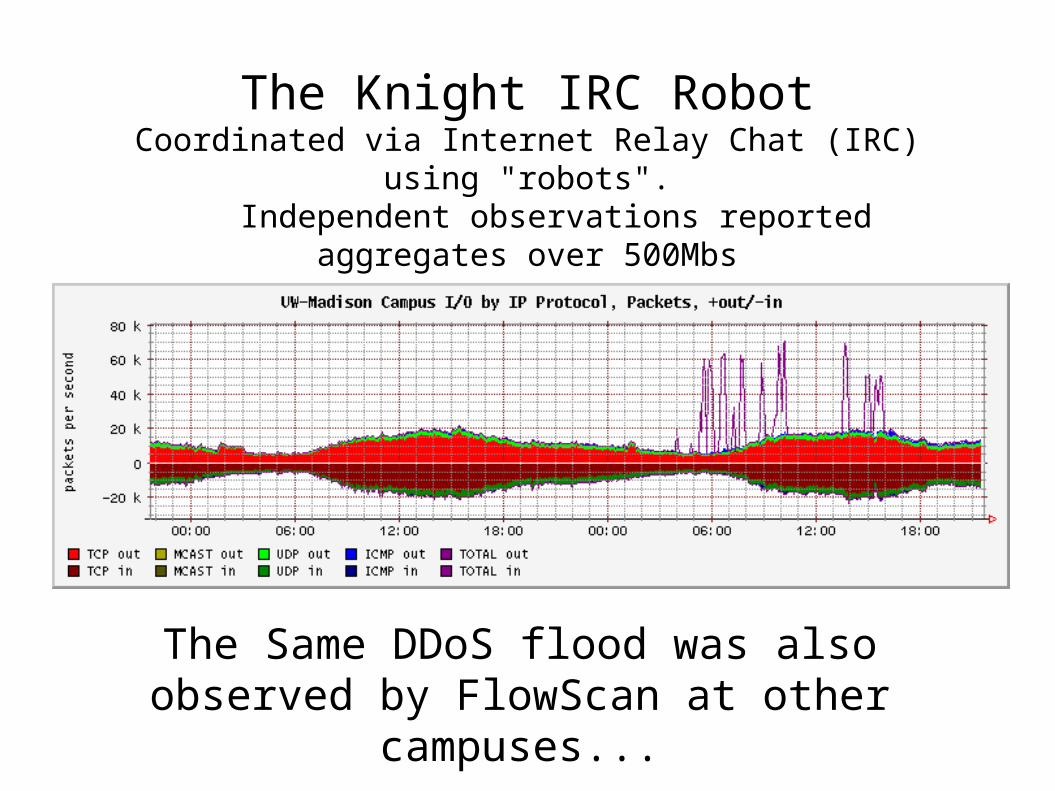
The Knight IRC RobotCoordinated via Internet Relay Chat (IRC) using "robots".
Independent observations reported aggregates over 500Mbs
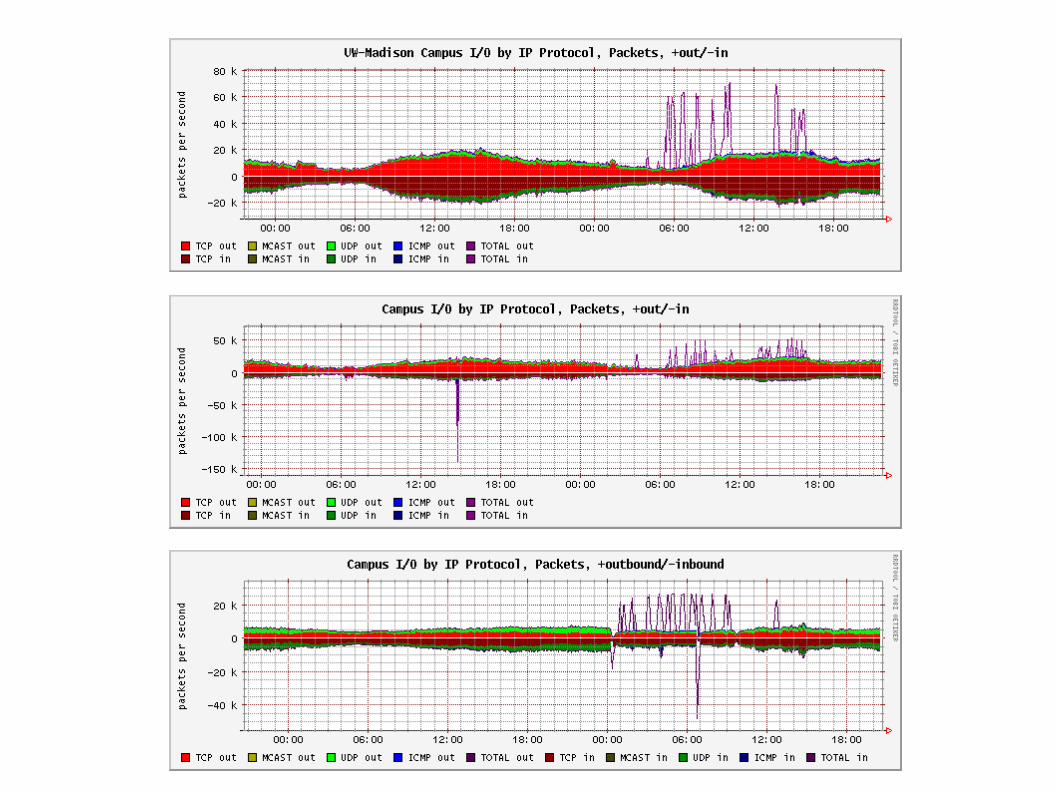
The Same DDoS flood was also observed by FlowScan at other campuses...
Characteristics of Flow Anomalies
http://www.aciri.org/vern/imw-2001/imw2001-papers/47.pdf
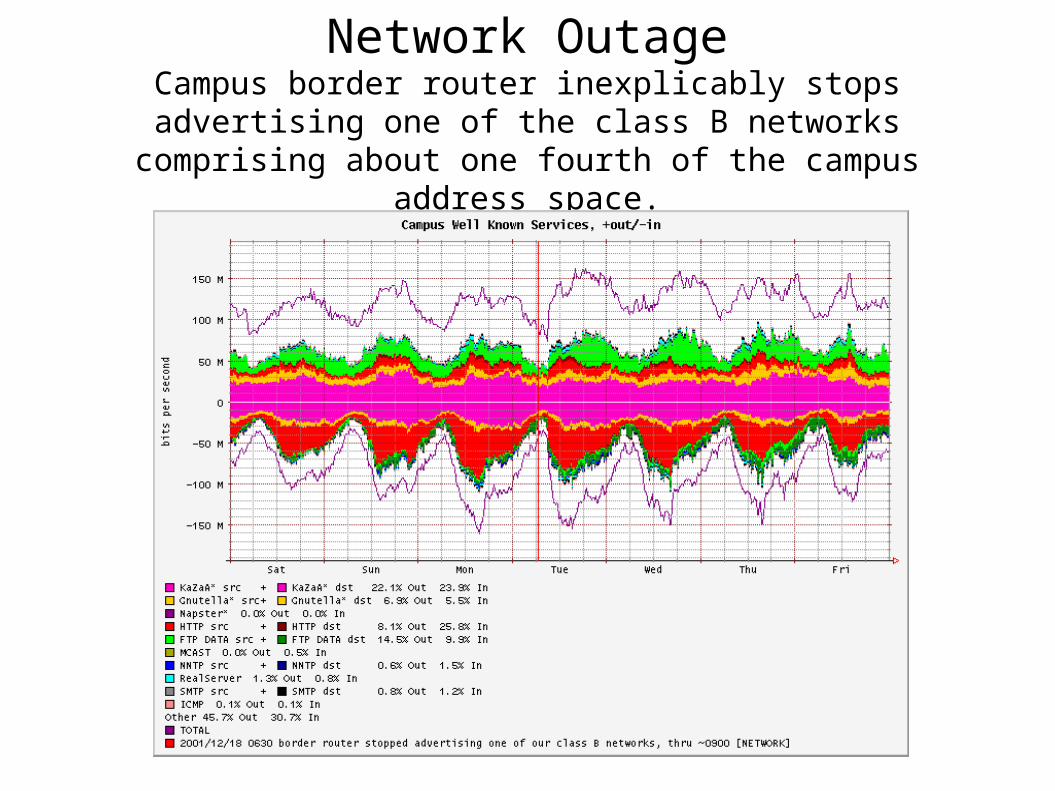
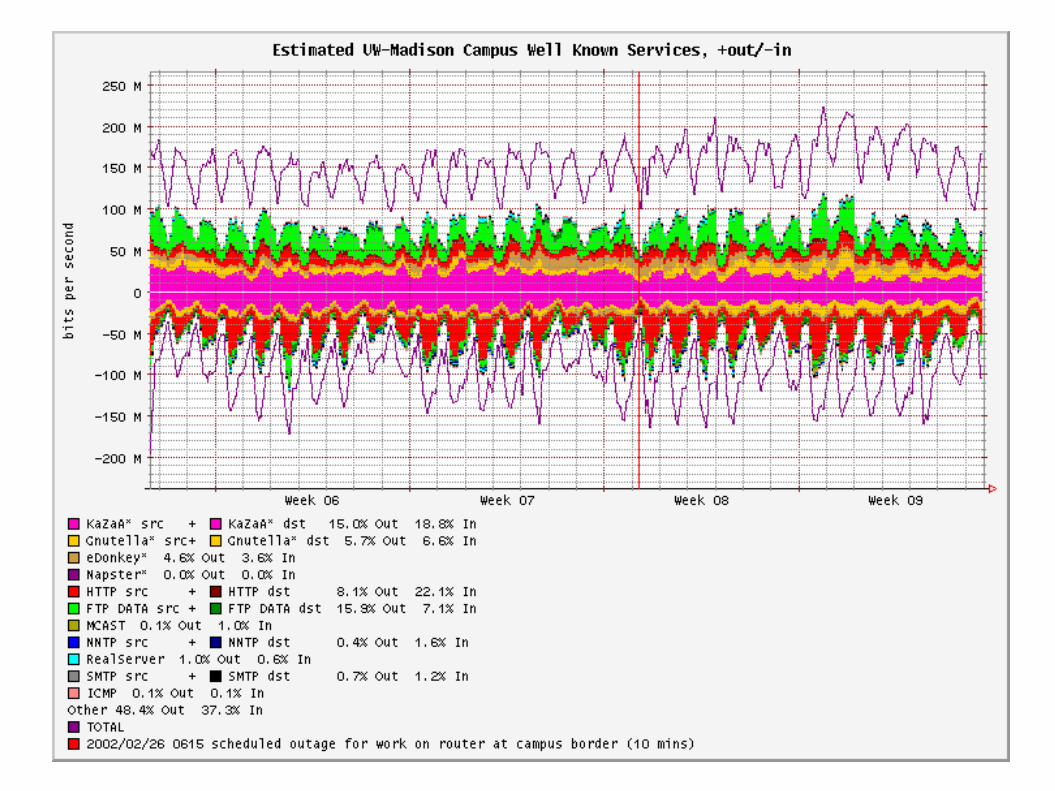
Network OutageCampus border router inexplicably stops advertising one of
the class B networks comprising about one fourth of the campus address space.
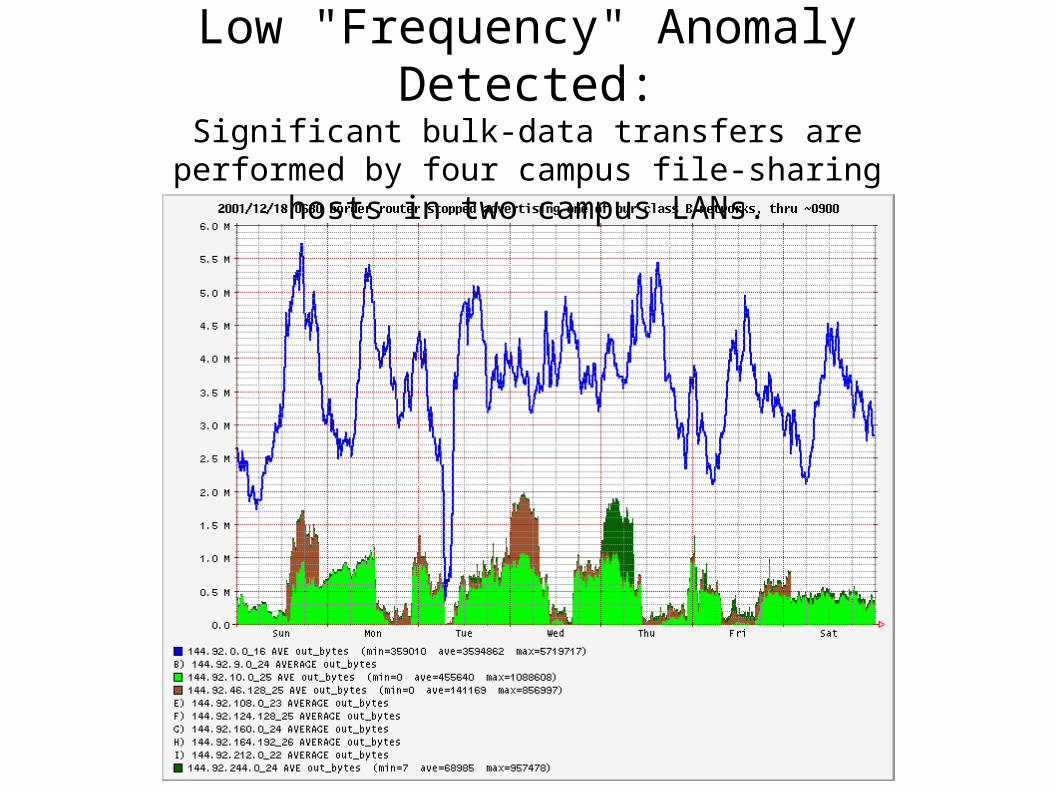
Low "Frequency" Anomaly Detected:Significant bulk-data transfers are performed by four campus
file-sharing hosts in two campus LANs.
Credits & Thanks Flow-related tools:
CAIDA (cflowd, RRDTOOL) Tobi Oetiker (RRDTOOL) Mark Fullmer (flow-tools) Carter Bullard (argus) FlowScan contributors
Anomaly Characteristics & Wavelet Analysis: Paul Barford Amos Ron Jeff Kline
Resources FlowScan:
http://net.doit.wisc.edu/~plonka/FlowScan/ http://wwwstats.net.wisc.edu
Argus: http://www.qosient.com/argus/ flow-tools:
http://www.splintered.net/sw/flow-tools/ cflowd, CoralReef: http://www.caida.org/
tools/measurement/cflowd/ tools/measurement/CoralReef/
IP Flow Information eXport, an IETF Working Group: http://ipfix.doit.wisc.edu
![Optimal Representation of Piecewise Ho¨lder Smooth ...num.math.uni-goettingen.de/~plonka/pdfs/JAT-final.pdf · adapted (EA) multiscale decompositions in [1, 15] (and references therein)](https://img.pdfslide.net/doc/110x75/5f69472fedf5880d60132511/optimal-representation-of-piecewise-holder-smooth-nummathuni-plonkapdfsjat-finalpdf.jpg)