Embed Size (px)
Citation preview

FLT ANNUAL REPORT
FLIGH
T CEN
TRE
TRAV
EL GR
OU
P LIM
ITED
2019
AN
NU
AL R
EP
OR
T 2019
OUR VALUES
1 OUR PEOPLE Our company is our people. We care for our
colleagues’ health and wellbeing, their personal and professional development and their financial security. We believe that work should be challenging and fun for everyone and through work we contribute to our community.
2 OUR CUSTOMER We recognise that our customers always have a choice.
We care about personally delivering amazing travel experiences. This is provided with honesty, integrity and a great attitude. It is the key to our company’s success. The key measure of whether we really are personally providing our customers with an amazing experience, an amazing product and a very caring service is they will return again and again.
3 BRIGHTNESS OF FUTURE We believe our people have the right to belong to
a Team (family), a Village, an Area (tribe) and Nation (hierarchy) that will provide them with an exciting future and a supportive working community. They also have the right to see a clear pathway to achieving their career goals. Promotion and transfers from within will always be our first choice.
4 TAKING RESPONSIBILITY We take full responsibility for our own successes or
failures. We do not externalise. We accept that we have total ownership and responsibility, but not always control. As a company we recognise and celebrate our individual and collective successes.
5 EGALITARIANISM AND UNITY In our company, we believe that each individual
should have equal privileges and rights. In all our countries and all our businesses there should be no ‘them and us’.
OUR BUSINESS MODEL
1 OWNERSHIP We believe each individual in our company should
have the opportunity to share in the company’s success through outcome-based incentives, profit share, BOS (franchises) and Employee and Leadership Share Schemes. It is important that business leaders and business team members see the business they run as their business.
2 INCENTIVES Incentives are based on measurable and reliable
outcome-based KPIs. We believe that ‘what gets rewarded, gets done’. A reward for producing the needed outcome. If the right outcomes are rewarded, our company and our people will prosper.
3 OUR STANDARD SYSTEMS – ONE BEST WAY In our business there is always ‘one best way’ to
operate. These are standard systems employed universally until a better way is shown. This improved way becomes the ‘one best way system’. We value common sense over conventional wisdom.
4 FAMILY, VILLAGE, TRIBE Our structure is simple, lean, flat and transparent,
with accessible leaders. Our business model is being one of the world’s best and biggest small business operators. There is a maximum of 4 and sometimes 5 layers. The village is an unfunded, self-help support group that forms an integral part of our structure.
• Family (Teams – min 3, max 7 members) Villages (min 3, max 7 Teams).
• Tribe (Areas – min 10, max 20 Teams). • Nations/Brands (min 8, max 15 Areas). • Regions/States/Countries. • Board and senior leadership team.
5 PROFIT A fair margin resulting in a business profit is the
key measure of whether we really are providing our customers with an amazing experience, an amazing product and a very caring service – an experience they genuinely value and will pay us for.
OUR PURPOSE‘To open up the world for those
who want to see.’
OUR VISION‘To become the world’s most exciting and
profitable travel retailer, personally delivering amazing experiences to our people, our
customers and our partners.’
COMPANY VISION, PURPOSE AND PHILOSOPHIESFor our company to survive, grow and prosper for the next 100 years and beyond, we must clearly define and live by our vision, purpose and philosophies. We must protect and further develop our company culture and philosophies. Our culture must be robust and independent, with the ability to outlive our current and future leaders.

FLIGHT CENTRE TRAVEL GROUP LIMITED (FLT) CORPORATE DIRECTORYDirectors G.F. Turner G.W. Smith J.A. Eales R.A. Baker C.M. Garnsey
Secretary D.C. Smith
Principal registered office and place of business in Australia 275 Grey Street, South Brisbane QLD 4101 +61 7 3083 0088 ABN 25 003 377 188
Share register Computershare Investor Services Pty Ltd 200 Mary Street, Brisbane QLD 4000
Auditor Ernst & Young 111 Eagle Street Brisbane QLD 4000
Stock exchange FLT shares are listed on the Australian Securities Exchange.
Web address www.fctgl.com
KEY DATES 2018/19August 22, 2019 2018/19 full year results released
September 13, 2019 2018/19 final dividend record date
October 11, 2019 2018/19 final dividend payment date
November 7, 2019 Annual General Meeting
February 27*, 2020 2019/20 half year results released
March 27*, 2020 2019/20 interim dividend record date
April 17*, 2020 2019/20 interim dividend payment date
*Dates are subject to change
This financial report covers the consolidated financial statements for the consolidated entity consisting of FLT and its subsidiaries. The financial report is presented in Australian currency.
FLT is a company limited by shares, incorporated and domiciled in Australia.
A description of the nature of the consolidated entity’s operations and its principal activities is included in the review of operations and activities in the directors’ report.
The financial report was authorised for issue by the directors on 22 August 2019. The directors have the power to amend and reissue the financial report.
FLT endorses the ASX's Corporate Governance Principles and Recommendations and complies in all areas, apart from amalgamating the Remuneration and the Nomination Committee. Further information on FLT's compliance with the Corporate Governance Principles and Recommendations, including FLT’s Corporate Governance Statement, can be found on the company's website, http://www.fctgl.com/investors/governance/corporate-governance-statement-2/
Corporate directory 1Chairman’s message 2FY19 results & overview 5Strategic update 8Outlook 11Directors’ report 13 Overview 16Auditor’s independence declaration 35Statement of profit or loss 36Statement of other comprehensive income 37Statement of cash flows 38Balance sheet 39Statement of changes in equity 40Notes to the financial statements 41 Significant Matters 42A Financial overview 44
A1 Segment information 44A2 Revenue 48A3 Other income 50A4 Expenses 50A5 Intangible Assets 51A6 Business combinations 54A7 Contingent consideration 57
B Cash management 59B1 Cash and cash equivalents 59B2 Financial asset investments 60B3 Cash and financial asset investments – financial risk management 61B4 Borrowings 62B5 Ratios 64B6 Dividends 65B7 Capital expenditure 66
C Financial risk management 67C1 Financial risk management 67C2 Derivative financial instruments 70C3 Other financial assets 74
D Reward and recognition 75D1 Key management personnel 75D2 Business ownership scheme (BOS) 76D3 Share-based payments 77D4 Contributed equity and treasury shares 81
E Related parties 82E1 Investments accounted for using the equity method 82E2 Related party transactions 84
F Other information 86F1 Other expenses 86F2 Earnings per share 87F3 Trade and other receivables and other assets 88F4 Contract Assets 89F5 Property, plant and equipment 91F6 Trade and other payables 92F7 Deferred revenue 93F8 Provisions 93F9 Reserves 94F10 Tax 97F11 Auditor’s remuneration 99F12 Seasonality 99
G Group structure 100G1 Subsidiaries 100G2 Deed of cross guarantee 100G3 Parent entity financial information 103
H Unrecognised items 105H1 Commitments 105H2 Contingencies 105H3 Events occurring after the end of the reporting period 105
I Summary of accounting policies 106Directors’ declaration 121Independent Auditor’s Report 122Shareholder information 127Tax transparency report (unaudited) 128
CONTENTS

WELCOME to the Flight Centre Travel Group’s (FLT) annual report for the 2019 fiscal year (FY19).
I’m pleased to report that your company again delivered record sales, with total transaction value (TTV) for the 12 months to June 30 2019 topping the record FY18 result by almost $2billion or 8.8%.
TTV has now eclipsed the prior year’s result in 23 of FLT’s 24 years as a listed entity, which is a testament to the company’s:
• Brand and geographic diversity• Ongoing value to customers• Resilience throughout the economic cycle; and• Ability to identify and capitalise on new trends and
opportunities
Unfortunately, this solid TTV growth did not translate to the record profit we initially targeted, although we did finish the year within our revised guidance range.
While our international businesses and our corporate travel operations generally delivered solid profit growth, which is a very positive sign for the future, this growth was more than offset by soft Australian results in a fairly subdued trading cycle and during a period of significant disruption for the leisure business in particular.
As evidenced by our FY18 results, we do not rely on Australian leisure to drive overall growth, but it remains a very important part of our business. Strategies have been implemented to address the issues that have been impacting performance, as outlined in Skroo’s column within this report.
On a positive note, the Americas businesses continued their strong growth trajectory and delivered an underlying PBT in excess of $100million, which is a very significant achievement and elevates the region as an earnings powerhouse for the group.
While we are having great success in the Americas and delivering consistent growth in both profit and TTV, it represents a significant future opportunity given the size of the market and our small – but rapidly growing – share.
Our success in Europe, the Middle East and Africa (EMEA) was also a very credible achievement, particularly in light of the ongoing Brexit uncertainty in the UK, which is our largest business within this region.
The businesses in Asia delivered strong profit and TTV growth, making record contributions in both areas.
The investment in our corporate businesses globally continues to pay strong dividends, with FLT’s company-owned corporate businesses alone generating $8.9billion in TTV during FY19 at an impressive 15.2% growth rate.
Our corporate offerings globally are built around a compelling blend of technology and people that delivers tangible savings and benefits to customers.
Brand diversity is another key difference and an important factor in our success.
We recognise that customers in the small to medium enterprise (SME) sector have different needs to larger clients and we have carefully tailored our offerings to meet those specific requirements.
Corporate Traveller, which blends a simple personalised service with the market leading edge of a strong digital
CHAIRMAN'S MESSAGEGARY SMITH
ANNUAL REPORT 2019 FLIGHT CENTRE TRAVEL GROUP 3
platform, is our specialist SME offering and it currently operates in Australia, New Zealand, the United States, Canada, the United Kingdom, South Africa and India.
Our large customer focused travel management company (TMC), FCM Travel Solutions, has an equity presence in 22 countries across the three major regions of Asia-Pacific (APAC), EMEA and the Americas and a network of independent licensees in an additional 75 countries throughout the world.
Within the leisure travel sector, our offerings have continued to evolve.
Effectively, we have three leisure pillars targeting the mass market, premium customers and the youth sector through a variety of channels and brands.
Our dominant mass market offerings are in Australia, New Zealand and South Africa, while we tend to focus on more specialised and premium offerings in the Northern Hemisphere.
Globally, we have invested in several emerging leisure distribution models in recent years, to complement traditional offerings.
These models have included flash sale and ready-made packages (the Ignite investment in Australia) and the home-based or independent contractor model, which has now been introduced in Australia, New Zealand, the USA, Canada and South Africa.
Online leisure sales via a number of brands are also growing strongly.
Our third key division, our at-destination travel experiences network (TEN), is smaller than our leisure and corporate division and is seen as a longer term creator of shareholder value.
This network, recently rebranded to The Travel Group (TTG), began with our investment in UK-based touring businesses Top Deck and Back-Roads and then extended into destination management companies (DMCs) in Asia (Buffalo Tours) and the Americas (Olympus).
More recently, we have added a hotel management business through our acquisition of Bespoke Hotel Management Asia (BHMA) in July 2017.
Both BHMA and the DMC businesses have recently been rebranded, as outlined in Melanie Waters-Ryan’s column.
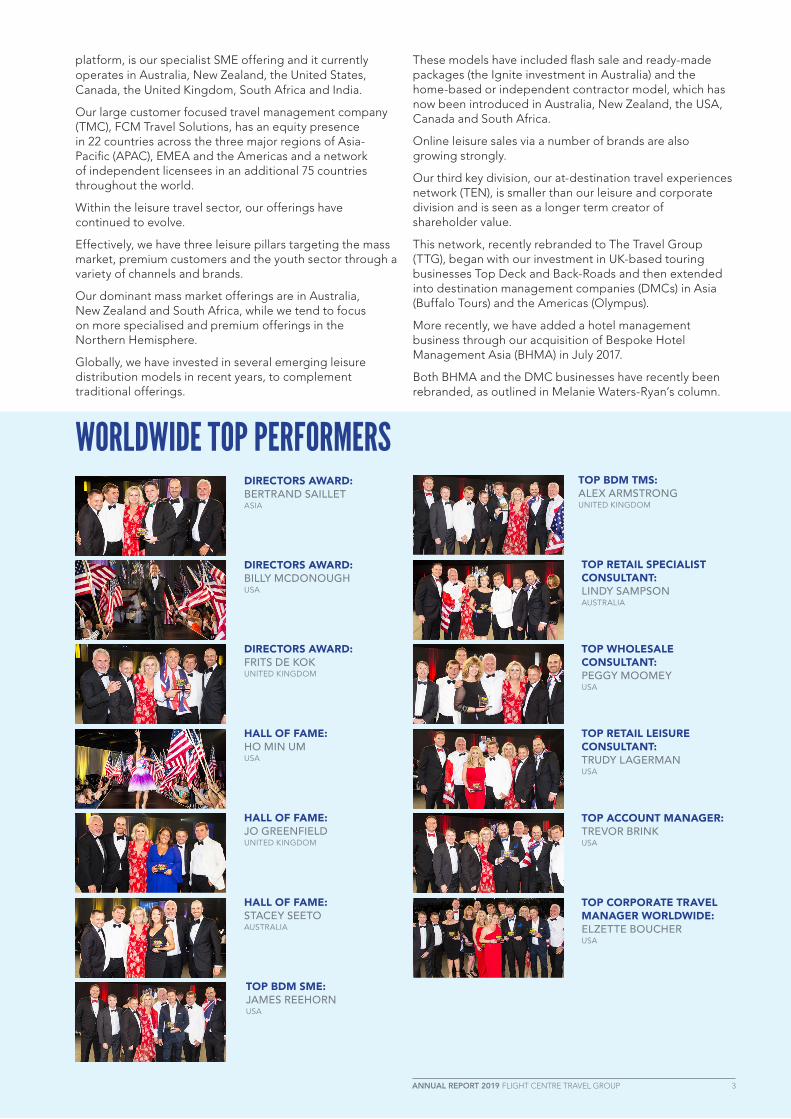
WORLDWIDE TOP PERFORMERS
DIRECTORS AWARD: BILLY MCDONOUGHUSA
DIRECTORS AWARD: BERTRAND SAILLETASIA
DIRECTORS AWARD: FRITS DE KOKUNITED KINGDOM
HALL OF FAME: HO MIN UM USA
HALL OF FAME: JO GREENFIELDUNITED KINGDOM
HALL OF FAME: STACEY SEETOAUSTRALIA
TOP BDM SME: JAMES REEHORNUSA
TOP BDM TMS: ALEX ARMSTRONGUNITED KINGDOM
TOP RETAIL SPECIALIST CONSULTANT: LINDY SAMPSONAUSTRALIA
TOP WHOLESALE CONSULTANT: PEGGY MOOMEYUSA
TOP RETAIL LEISURE CONSULTANT: TRUDY LAGERMANUSA
TOP ACCOUNT MANAGER: TREVOR BRINKUSA
TOP CORPORATE TRAVEL MANAGER WORLDWIDE: ELZETTE BOUCHERUSA
4 ANNUAL REPORT 2019 FLIGHT CENTRE TRAVEL GROUP
As always, we continue to take a long-term view of our business and invest in areas that we believe will create shareholder value into the future.
This is reflected in the significant investment within our leisure, corporate and in-destination networks in recent years and in our increased technology and system investment to benefit our customers, lower costs, enhance consultant productivity and, of course, to ensure data is protected.
We also continue to maintain a very healthy balance sheet.
This meant we were able to return a record amount to shareholders in fully franked dividend payments during FY19, including the $1.49 per share special dividend, which was paid in April 2019.
The total payout to shareholders amounted to $310.2million in relation to FY19.
While our major focus has always been on organic growth, we will continue to acquire businesses – when appropriate opportunities arise – to complement this growth.
During FY19, the company completed a number of acquisitions and investments that collectively:
• Bolstered our technology platforms and offerings (Upside, Umapped, Claire, Sam :])
• Expanded our corporate travel footprint (Casto, 3mundi); and
• Fast-tracked growth in emerging areas (Camakila hotel business)
Since year-end, we have also acquired the remaining 25% interest in Les Voyages Laurier Du Vallon (LDV) in Canada to take 100% ownership of this very well established corporate travel and premium leisure business.
Governance and oversight have always been priorities for FLT’s Board and they were again at the forefront of our thinking during FY19, particularly in the light of the release of the Report from the Banking Royal Commission into Misconduct in the Banking, Superannuation and Financial Services Industries.
While the focus of the commission and its report was specifically on the financial services sector, many of the issues highlighted are common across other industries.
An overarching theme of the report was corporate culture, with poor culture seen as a root cause of misconduct.
We are very proud of our culture as it has underpinned our success over a long period of time. However, the Royal Commission findings have focused the board’s attention on ensuring that our culture focuses very much on looking after our customers over the short and long-term.
We have for some years been measuring and tracking our corporate culture and will continue to do this and learn from the process, making changes as needed.
We have a strong commitment to corporate social responsibility (CSR) and are taking meaningful steps to enhance disclosure of our activities across our business in this area.
In recent years, we have become a signatory to the United Nations (UN) Global Compact, which is a voluntary initiative based on CEO commitments to implement universal sustainability principles and to take steps to support UN goals, and we have just completed our latest Communication of Progress (COP). The COP is now available on the fctgl.com website.
We have also highlighted our Brighter Futures program, which was introduced during FY18 and has focused on four key areas – the Flight Centre Foundation, FCTG Worldwise (responsible travel), people and environmental sustainability.
We are currently expanding on this program, tying it and other initiatives to the UN’s ’ Sustainable Development Goals and working to incorporate our achievements and objectives in to a broader FLT sustainability report, which has been earmarked for release ahead of our Annual General Meeting in November 2019.
This will be our first sustainability report and our people are currently charting our progress within the key categories and are identifying opportunities for improvement.
Ahead of this process, we engaged Ernst & Young to help us identify issues that were important to key stakeholders (both internal and external) that should be addressed in our inaugural report.
People and Diversity issues are key focus areas and we are working to strengthen our diversity and inclusion programs, along with our commitment to various initiatives, including the Reconciliation Action Plan and the Rainbow Tick, which is designed to educate, acknowledge and celebrate LGBTIQ team members.
Another key program is the Womenwise initiative, which was launched in Australia in 2015 to recognise women’s achievements through celebration, connection, collaboration and creating change.
Womenwise has now been exported to other FLT operations globally and we recently hosted our first external Womenwise event in Brisbane.
Parentwise, which is now in place in the UK, South Africa and Australia supports our many working families through numerous initiatives throughout the parental leave journey. We also encourage flexible workplace arrangements, where possible, to meet the needs of parents and those who are unable to work full-time or traditional work hours.
In terms of career development, a specific boardroom program is in place for various senior female executives. This program and others like it should, in time, help more and more of our people reach the top level either within our company or externally.
In finishing, I would again like that thank our people for their efforts and achievements during FY19.
Together, we look forward to building on these efforts and making further progress during FY20.
ANNUAL REPORT 2019 FLIGHT CENTRE TRAVEL GROUP 5
THE Flight Centre Travel Group (FLT) has achieved another year of record sales and a profit within its targeted range for the 2019 fiscal year (FY19).
Strong results in key overseas markets and continued out-performance in the corporate travel sector globally underpinned the company’s FY19 results, which included $23.7billion in total transaction value (TTV) and an underlying $343.1million profit before tax (PBT).
Globally, TTV exceeded FLT’s record FY18 result by almost $2billion, as the company achieved:
• Record results in all countries and regions, apart from the Nordics; and
• Its 23rd year of growth in 24 years as a listed entity
FLT’s 8.8% year-on-year TTV growth was achieved with fewer sales staff – pointing to further productivity gains – with sales staff numbers contracting slightly from 14,622 at June 30 2018 to 14,346 at June 30, 2019.
Revenue growth was more subdued (up 4.5% globally), which meant that revenue margin – revenue as a percentage of TTV – decreased during the year to 12.9% (FY18: 13.4%).
While FLT expected its revenue margin to decrease, as a result of its changing business mix during FY19, the actual movement was larger than anticipated and was a key contributor to the company achieving a PBT in FY19 that was 10.8% below its record underlying FY18 result of $384.7million.
These mix changes are in part being driven by the rapid growth in lower revenue margin businesses, specifically:
• The FX businesses in Australia, New Zealand and India, which together generated about 9% of group TTV at a 3.4% revenue margin
• The higher volume low margin FCM corporate travel management business; and
• FLT’s leisure online travel agency businesses, which are growing rapidly in TTV terms
Together, these businesses generated about $8billion in TTV during FY19 at a 6.6% revenue margin.
FY19 RESULTS & OVERVIEWADAM CAMPBELL CHIEF FINANCIAL OFFICER
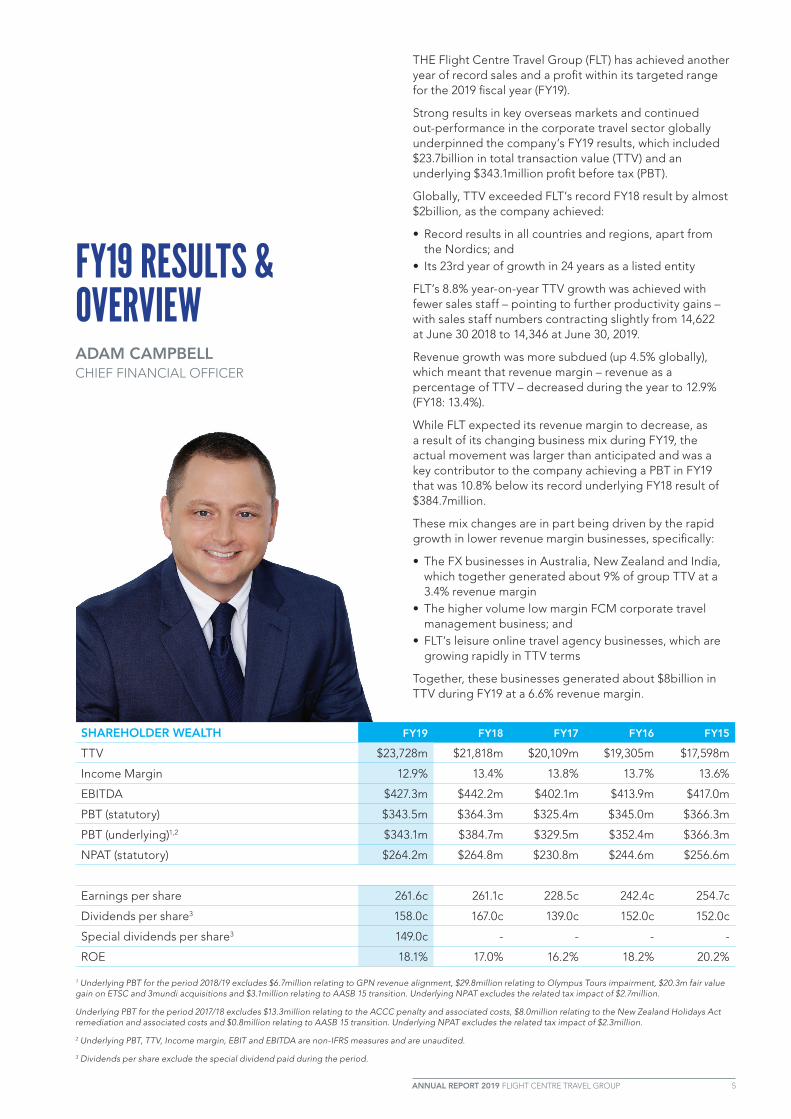
SHAREHOLDER WEALTH FY19 FY18 FY17 FY16 FY15
TTV $23,728m $21,818m $20,109m $19,305m $17,598m
Income Margin 12.9% 13.4% 13.8% 13.7% 13.6%
EBITDA $427.3m $442.2m $402.1m $413.9m $417.0m
PBT (statutory) $343.5m $364.3m $325.4m $345.0m $366.3m
PBT (underlying)1,2 $343.1m $384.7m $329.5m $352.4m $366.3m
NPAT (statutory) $264.2m $264.8m $230.8m $244.6m $256.6m
Earnings per share 261.6c 261.1c 228.5c 242.4c 254.7c
Dividends per share3 158.0c 167.0c 139.0c 152.0c 152.0c
Special dividends per share3 149.0c - - - -
ROE 18.1% 17.0% 16.2% 18.2% 20.2%
1 Underlying PBT for the period 2018/19 excludes $6.7million relating to GPN revenue alignment, $29.8million relating to Olympus Tours impairment, $20.3m fair value gain on ETSC and 3mundi acquisitions and $3.1million relating to AASB 15 transition. Underlying NPAT excludes the related tax impact of $2.7million.
Underlying PBT for the period 2017/18 excludes $13.3million relating to the ACCC penalty and associated costs, $8.0million relating to the New Zealand Holidays Act remediation and associated costs and $0.8million relating to AASB 15 transition. Underlying NPAT excludes the related tax impact of $2.3million.
2 Underlying PBT, TTV, Income margin, EBIT and EBITDA are non-IFRS measures and are unaudited.
3 Dividends per share exclude the special dividend paid during the period.
6 ANNUAL REPORT 2019 FLIGHT CENTRE TRAVEL GROUP
In addition to mix changes, the company also saw a decrease in revenue margins in Australia. Strategies are in place to address the issues that have contributed to this, as outlined in the Strategy and Outlook sections of this report.
FLT’s statutory (actual) PBT for FY19 was slightly higher than the underlying result at $343.5million (FY18: $364.3million) and has not been adjusted to exclude the impacts of various non-recurring losses and gains.
Adjustments to statutory PBT during FY19 included a $29.8 impairment loss relating to the Olympus destination management company (DMC) in Mexico; which was offset by four non-recurring gains totalling $30.1million and consisting of.
• A $6.7million pull forward of land over-ride revenue, which previously would have been recognised during future periods
• A $3.1m gain on the transition to IFRS15• A $19.6million fair value gain relating to FLT’s interest
in the 3mundi corporate travel business in France and Switzerland. FLT took 100% ownership of this business on June 30, 2019 after initially acquiring 25% in June 2017; and
• A $718,000 fair value gain relating to FLT’s interest in ETSC, the company that developed our corporate travel chatbot Sam :]. We took 100% ownership of ETSC in April 2019 after initially acquiring a 25% holding in October 2017
These profit results translated to a $266.6million underlying net profit after tax (NPAT) or a $264.2million actual or statutory NPAT (FY18: $283million and $264.8million respectively).
GLOBALISATION STRATEGY GAINING MOMENTUMBusinesses outside Australia generated 52% of group TTV and, for the first time, also generated more than half of group profit as the company’s globalisation strategy gained momentum and in a challenging year for the Australian leisure business.
The Americas business was the major driver of international growth and underlined its emergence as an earnings powerhouse by delivering a $102.5million PBT, a result that surpassed its record FY18 PBT ($71.2million) by 44.4%.
Underlying profit in the Americas has now increased almost five-fold since FY16.
The Europe, the Middles East and Africa (EMEA) businesses delivered another record profit, despite Brexit-related uncertainty throughout the year in the large and important United Kingdom (UK) market.
FLT’s increasing globalisation was also reflected in record profit contributions in New Zealand and from the Asia businesses (India, China, Singapore and Malaysia).
CONTINUED CORPORATE OUT-PERFORMANCEIn most countries, profit growth was driven by the corporate travel businesses, as FLT continued to out-perform in the sector.
TTV from FLT’s company-owned corporate travel brands increased 15.2% globally to a record $9billion, with the US corporate business growing almost 30%.
This strong growth in the USA helped the broader North American corporate business overtake its Australia-New Zealand counterpart to become FLT’s largest corporate business globally in TTV terms.
Growth globally was underpinned by strong customer retention and record business wins, with FCM alone securing new accounts worth more than $1.3billion during the year.
These wins were broadly shared among the three major regions of Asia-Pacific, the Americas and EMEA.
DISAPPOINTING AUSTRALIAN LEISURE RESULTS, BUT STRONG GROWTH IN EMERGING CHANNELSIncreased international and corporate travel earnings partly offset the soft results in Australia.
This softness, which predominantly affected the leisure business, in part reflected a challenging trading cycle, but also disruption from changes that have taken place during the past two years.
These changes in Australia have included:
• The deployment of a new sales system (GDS), which temporarily impacted TTV growth, sales staff numbers, margins and in-store productivity
• The introduction of a new wage model for front-end sales staff, which led to a $14million increase in wage costs in Australia during FY19 in addition to causing some disruption while the Enterprise Bargaining Agreement (EBA) was being finalised
• Brand consolidation, which saw the Escape Travel and Cruiseabout brands closed during FY18 and about 20% of FLT’s Australian leisure workforce relocated to new brands. Attachment of higher margin products initially decreased after this strategy was initiated; and
• An ongoing review of the leisure network and sales force, which is close to being finalised and has identified opportunities for rationalisation, along with growth opportunities in some areas that continue to perform well
Within the leisure sector, FLT is generating solid returns on its investments in new and emerging distribution channels and models.
Together, these newer leisure models generated more than $1.8billion in TTV during FY19, which consisted of:
• About $1.3billion globally from FLT’s online travel agency (OTA) businesses and leisure branded websites. Further online growth is expected during FY20, with flightcentre.com.au currently growing TTV at more than 40% and with minimal cannibalisation – pointing to market-share growth
• $380million from the independent contractor networks in Australia, New Zealand, Canada, the USA and South Africa; and
• Circa $180million from Ignite, a specialist flash sale and ready-made package business that FLT secured a 49% interest in during FY17
The specialist divisions within Flight Centre brand in Australia also achieved solid growth and together generated about $430million in TTV. These divisions focus on small corporate accounts (Flight Centre Business Travel), group travel, round the world airfares, cruise and first and business class flights.

ANNUAL REPORT 2019 FLIGHT CENTRE TRAVEL GROUP 7
OTHER FY19 HIGHLIGHTSOther FY19 highlights included:
• Record dividend payments to shareholders, totalling $3.07 per share fully franked and consisting of a $0.98 final dividend (declared today), a $1.49 per share special dividend and a $0.60 per share interim dividend (both paid April 2019)
• Continued success in slowing cost growth, with underlying expenses (excluding touring cost of sales) increasing 3% in constant currency and additional plans in place to achieve further efficiency gains
• Significant investments in technology and systems to strengthen FLT’s IT backbone, improve productivity and efficiency and to enhance the customer experience; and
• Various small acquisitions and investments to boost FLT’s global corporate travel footprint and capabilities (Upside, Casto, ETSC, 3mundi), enhance its leisure customer offering (Umapped) and deliver new revenue streams (Camakila hotel lease)
Since year-end, FLT has also taken 100% ownership of Les Voyages Laurier du Vallon (LDV), a Canada-based corporate and premium leisure business that it secured a 75% interest in during 2017.
CASH AND CASH FLOWThe increased dividend payments, which were underpinned by the special dividend, followed a balance sheet review early in FY19 and meant that FLT returned $310.2million in fully franked dividends to its shareholders, in addition to taking on a modest level of debt.
As a result, the company finished the year with a reduced global cash and investment portfolio of $1.29billion, compared to $1.48billion one year earlier.
This included $352.3million in company cash and investments and $185,1million in borrowings, compared to $553million and $35.5million respectively at June 30, 2018, and meant that FLT finished the year in a positive net debt position of $167.2million.
Operating cash flow followed its normal seasonal pattern with FLT recording a modest cash outflow during the first half, followed by a larger inflow during the second half of the year.
Over the full year, the company recorded a $278.9million operating cash inflow, compared to a $314.3million inflow during FY18. The year-on-year movement was driven by timing factors relating to staff pay (the Australian leisure business introduced a weekly pay system) and payments to non-air suppliers.
FLT expects to maintain a strong balance sheet to ensure it can take advantage of future growth opportunities and continue to invest in key business drivers throughout the economic cycle.
GLOBAL RESULTS1
AUSTRALIA TTV: $11.2b, up 1% EBIT: $173.1m Businesses: 1,443
NEW ZEALAND TTV: $1.4b, up 8% in AUD (up 6% in local currency) EBIT: $22.3m Businesses: 188
USA TTV: $3.9b, up 21% in AUD (up 11% in local currency) EBIT: $75.7m Businesses: 233
CANADA TTV: $1.6b, up 8% in AUD (up 4% in local currency) EBIT: $24.0m Businesses: 195
UNITED TTV: $2.3b, KINGDOM up 8% in AUD (up 4% in local currency) EBIT: $56.7m Businesses: 259
EUROPE TTV: $340m, up 24% in AUD (up 23% in local currency) EBIT: $2.1m Businesses: 22
SOUTH AFRICA TTV: $659m, up 8% in AUD (up 10% in local currency) EBIT: $16.5m Businesses: 190
UNITED ARAB TTV: $148m, EMIRATES up 23% in AUD (up 14% in local currency) EBIT: $6.1m Businesses: 7
INDIA TTV: $1.3b, up 64% in AUD (up 64% in local currency) EBIT: $4.3m Businesses: 164
GREATER CHINA TTV: $317m, up 4% in AUD (up 1% in local currency) EBIT: $5.3m Businesses: 39
SOUTH EAST TTV: $308m, ASIA up 14% in AUD (up 11% in local currency) EBIT: $4.7m Businesses: 21
LATIN TTV: $67m, AMERICA up 7% in AUD (up 3% in local currency) EBIT: ($1.1m) Businesses: 4
1 TTV, EBIT and Businesses are non-IFRS measures and are unaudited.EBIT above represents statutory EBIT (refer note A1) taking into account underlying adjustments (refer note B6).

STRATEGIC UPDATE MELANIE WATERS-RYAN CHIEF OPERATING OFFICER
FLT is working towards a 2025 vision that will see it become a thriving global travel business with a distinctive entrepreneurial culture, famous brands and winning models across its three core pillars of leisure, corporate and at-destination travel.
Three strategic leadership groups are now working on the future in each of these pillars, while also working together to operate the key businesses today and overseeing the various transformational activities and programs that are underway globally.
LEISURE TRAVEL PILLARIn leisure travel, the company has adopted a three markets and two paths approach.
Plans are in place to ensure long-term success in mass market, premium and youth travel – FLT’s three core markets within this sector.
Within these markets, FLT will continue to operate a network of famous brands, although not all brands will be deployed globally. This reflects the two paths approach, which will generally see the Southern and Northern Hemisphere leisure businesses pursue different growth strategies.
For example:
• ln Australia, New Zealand and South Africa, the famous Flight Centre brand will remain a major mass market player with high market share; and
• In the Northern Hemisphere (USA, Canada and UK) the company will take a more specialised approach and will target key market segments
While these paths differ, some strategies are shared to ensure the group can leverage a global investment approach, especially into areas such as technology and mergers and acquisitions.
Reinventing customer systems and centricity is one key shared strategy. During the past year, the company has implemented customer review and/or scoring systems including Net Promoter Scores (NPS) and Trust Pilot (or similar) reviews to help ensure customers love the experiences of both buying travel from us and then experiencing it.
Reward and recognition systems have also been enhanced to include specific customer metrics and they will be integrated into all remuneration models over the next period. In addition, our lead management system, Red Connect, is now being globally rolled out and incorporates a customer score in determining where to distribute enquiry to.
Within our leisure businesses globally, other key areas of focus have included:
• Digitisation, which has seen new self-service capabilities added to our websites and native apps across multiple product categories and contributed to our strong growth in online sales. The Umapped acquisition in September 2018 has also digitised key parts of the consultant-customer interaction, with our Trips product now available to some 6000 consultants and their customers and providing access throughout the travel journey to our full product range
• Product and pricing. Work is well underway on rejuvenating product design and ensuring pricing across our different channels for our travel or service products

ANNUAL REPORT 2019 FLIGHT CENTRE TRAVEL GROUP 9
is transparent and value-based. New products include Flight Centre Exclusives, a flash-sale range of products, are now available throughout our retail network in Australia and sales are growing significantly. Pricing trials and pilots undertaken over the last year throughout the globe particularly in the FCB brand have provided strong findings and as we move to fully centralised pricing models we are investing in market shopping tools and yield management systems.
• Providing customers with full content to ensure they can access all their travel needs in one place and are always advantaged when buying through our brands. FLT is making – and will continue to make – significant investments to work with our airline partners and has been at the forefront of discussions relating to New Distribution Capability (NDC) and technical capability
• Investments in marketing and advertising to generate leads and sales, to reflect the brand DNA work that has taken place over the past 18 months and to ensure brands are famous, valued and trusted by customers; and
• Changing our overall sales mix by capitalising on the strong growth in winning models and channels that we have developed or bought in recent years
We are, for example, focused on becoming the world’s best referral independent contractor (IC) model. The IC model now generates significant volumes in the offline travel market, is growing rapidly globally and is expected to keep growing significantly.
Traditionally, independent agents sourced products from a host company (host model), but tended to rely on their own repeat customer base. Under a referral model, FLT can use its famous brands and product capability to generate customer leads that independent agents can fulfil either at home, in shared locations or even in-store.
An added advantage for FLT is that this model allows the company to flex its number one cost base of people. Our lead management and product technology investments will help facilitate these plans and trials are underway in the USA to distribute leads to independent agents.
We are also looking to tap into the rise of the social entrepreneur.
Travel is a great segment for this model to prosper, given the rise of social media platforms and the shared nature of travel experiences, and our newly launched Universal Traveller brand is already experimenting in this space.
In premium travel, we expect to expand the brands that we operate within this market globally.
Travel Associates, a brand that has enjoyed great success in Australia, is expanding in the USA and we will use LDV as our key premium play in Canada.
CORPORATE TRAVEL PILLARIn corporate travel, FLT’s strategic evolution is relatively advanced, with the company continuing to focus on dominating the SME sector through the Corporate Traveller brand and developing FCM as a truly global brand in the managed travel sector (TMS).
These strategic objectives are being achieved through:
• Strong investment in sales and marketing to win new accounts. These wins, which are secured via a global network of some 500 business development managers, are complemented by high customer retention rates
• Development of an innovative technology and product suite across all brands; and
• A leading people proposition, which is proactively blended with systems and technology
Brand diversity has been a key to FLT’s ongoing success within the corporate travel sector.
While competitors have tended to use a standard offering and a single brand to target both the SME and TMS customer segments, FLT has developed a network of brands with tailored products and offerings to suit the different customer bases.
These brands include the core Corporate Traveller and FCM businesses, plus MICE (Meetings, Incentives, Conventions and Exhibitions) specialist cievents and Stage & Screen, a specialist travel provider to the sports and entertainment sectors.
Corporate Traveller now operates in seven countries – Australia, New Zealand, the USA, UK, Canada, South Africa and India – and blends simple, personalised service with the design and control of a digital platform to provide its people, customers and suppliers with an unique experience and access to all content.
FCM, which is emerging as the number one global alternative to the three mega travel management companies (TMCs), operates in 97 countries through FLT’s company-owned businesses (22 countries) and independent licensees (75 countries) across the three major regions of Asia/Pacific, EMEA and the Americas.
Its strategies are geared towards delivering globally consistent services to mid to large market customers. FCM aims to design and control the customer experience by blending people and technology, offer the widest choice of content and services and empower its people to always find a way for their customers.
Across the corporate pillar, future growth is expected to be driven by:
• Continued development of the two core brands and their different offerings
• Further investment in technology, sales and marketing• A continued focus on cost reduction and efficiency gains
to benefit customers• The development of market leading and unique
products; and• Further geographic expansion
FLT’s commitment to investing in and introducing consumer-grade technology is evidenced by the investment in Upside, a Washington DC-based, technology-driven business launched in 2017 by Priceline founder Jay Walker.
Through its 25% investment in Upside, FLT:
• Became the largest individual shareholder in a next generation US corporate online travel agency that could disrupt traditional offerings in the SME sector in the future; and
• Gained access to a travel technology platform and software development resources that will enhance its already strong SME offering.
As we said when we announced this investment in April this year, we are taking proactive steps to future proof our successful SME-focused offerings, which we predominantly

10 ANNUAL REPORT 2019 FLIGHT CENTRE TRAVEL GROUP
provide through the Corporate Traveller brand and fast-tracking our overall growth in this huge travel sector by offering customers the benefits of a new, blended on and offline offering.
AT-DESTINATION PILLAR: THE TRAVEL GROUP (TTG)FLT’s at-destination businesses are part of a broader pillar now known as The Travel Group (TTG), which is seen as a longer term driver of shareholder value.
The key at-destination businesses, which specialise in hotel management, tour operating and destination management, are generally in their infancy and are not expected to make material contributions to group earnings during their early growth phases.
FLT’s DMCs, Buffalo in Asia and Mexico-based Olympus, have just been rebranded to Discova as part of the longer term plan to develop a global DMC network. Similarly, the hotel business, BHMA, has just been rebranded to Cross Hotels & Resorts, ahead of further expansion in carefully selected and lower risk markets.
The more-established and profitable tour businesses, Top Deck and Backroads, have been earmarked for ongoing growth through to 2025 driven by:
• Product evolution – including off-peak and winter programs and expansion of small group touring globally
• Sales in new and emerging markets; and• Brand expansion
Within this pillar, the at-destination businesses operate alongside a network of product and procurement-related businesses that have historically focused on servicing FLT’s businesses, but could be expanded in the future to service the broader B2B market.
BUSINESS TRANSFORMATION PROGRAMWhile the company is working towards its 2025 vision within its three pillars and has adopted tailored programs in each area, it also remains focused on the broader business transformation program targets that are in place through to the end of FY22, specifically:
• 7% compounding annual TTV growth • A 10% underlying cost margin (excluding touring cost of
sales); and• A return to a 2% net profit margin (underlying PBT as a
percentage of TTV)
The program’s focus was on loss-making businesses during year-one (FY18) and then shifted to an investment phase during years two and three (FY19 and FY20).
Containing cost growth, while continuing to invest for the future, remains a priority and the company has made solid progress, as evidenced by the lower growth in expenses (in constant currency) during both FY18 and FY19 and improved cost margins.
To further reduce support overheads, FLT is currently focusing on three core cost and efficiency strategies:
1. Consolidating support operations into offshore centres. Various finance, call centre and ticket processing functions are now being performed overseas
2. Streamlining business processes. FLT is working with external consultants to identify efficiencies in product creation, booking admin and support within the corporate business and global finance; and
3. Robotic automation and self-service technology, which are already being used within FLT’s finance areas and call centres and are set to be expanded
FLT has also initiated an IT excellence program, which is being run in partnership with US-based technology consultancy Hudson Crossing.
The 12-18-month program is built around five key phases, ranging from an initial assessment which is now underway to phased roll-out of initiatives, and will deliver a rationalised IT roadmap that is connected to business strategies and takes into account current commitments and future full value opportunities.

ANNUAL REPORT 2019 FLIGHT CENTRE TRAVEL GROUP 11
WHILE FY19 was not the year of record profit that we initially expected, we have started the new fiscal year with strong foundations and with reasonable growth prospects.
There are, of course, some ongoing challenges to overcome, particularly in Australia, and we are working hard to address the issues that are adversely impacting results within this large and very important business.
While our focus is on factors that we can control, we are facing some external challenges early in FY20, including the trading cycle in Australia and its impacts on leisure travel demand, uncertainty relating to Brexit in the UK and the recent unrest in Hong Kong.
Our geographic and brand diversity help shield us from the impacts of events like these and are critical factors in our ongoing evolution.
Throughout the company, we are balancing the need to deliver short-term results with the need to build and invest for the future, as evidenced by our significant ongoing spend in systems and technology and the further investment in our three core business divisions.
We remain focused on our FY22 transformation program targets and are making reasonable progress towards the TTV and cost margin goals. Our ability to achieve the 2% net margin target will largely be determined by our ability to stabilise and then improve Australian leisure results.
FY20 GUIDANCE & GROWTH DRIVERSWe plan to release FY20 guidance at our Annual General Meeting in November, which is in line with our normal practice and will allow us to monitor first quarter trading conditions and results in comparison to a stronger trading period during FY19.
Results are again likely to be driven by the corporate and international businesses, although improvement is also anticipated in Australia.
The company’s overseas businesses have performed strongly during the past few years and, for the first time, generated the majority of the company’s profit during FY19. This trend is expected to continue, given FLT’s success and relatively small existing market share in several much larger markets overseas.
The Americas business is growing strongly and consistently and is now entrenched as a key earnings driver for the group, with expectations of strong growth into the future.
In TTV terms, the Americas corporate business has just overtaken its counterpart in Australia and New Zealand to become FLT’s largest corporate business globally and leisure returns are also improving. In the US, Liberty delivered its strongest result since acquisition (2008) during FY19.
The EMEA business, which is headquartered in London, is also delivering consistent earnings and sales growth while expanding into new locations and countries.
In addition to the large and successful UK business, FLT now has a solid corporate travel footprint and a platform for further growth in key markets on continental Europe through a combination of start-ups and small acquisitions in France, Germany, the Netherlands, Switzerland, Sweden, Norway, Denmark and Finland.
OUTLOOKGRAHAM TURNER CHIEF EXECUTIVE OFFICER

While the Asia business is currently smaller than both the Americas and EMEA businesses, it is performing well and has a good growth trajectory. This business, which is set to deliver more than $2billion in TTV this year, is also a key contributor to FLT’s corporate sector success globally and is integral to the strong pipeline of new accounts the company is winning.
GRADUAL RECOVERING IN AUSTRALIAIn Australia, gradual recovery in the leisure business is expected as the year progresses, as the trading climate improves and as improvement strategies gain traction. While market conditions remain subdued, the company has seen some slight signs of improvement recently and margins starting to stabilise.
For Flight Centre brand in Australia, key focus areas currently include:
• Growing TTV across specialist businesses (Round The World, First & Business Class, Groups and Cruise businesses) and via channels that continue to perform well and that are now generating an increased share of the brand’s TTV – online, flagship stores and Flight Centre Business Travel
• Improving operational performance through new customer centric initiatives, better use of data and by working with consultants to improve conversion and , deliver an instant quality response to customers; and
• Simplifying the product-to-market approach and delivering irresistible deals, including cheapest, best and premium options
The leisure network review that is currently underway aims to right-size the Flight Centre Brand network in terms of both shops and people and is expected to see:
• Up to 30 Flight Centre shops closed and an additional 30 converted to either Travel Associates or the new youth-focused Universal Traveller brand, depending on each shop’s location and customer base
• An additional 30-40 leisure shops shifted to better sites
• About 20 Flight Centre shop openings, including high profile hyperstores in the Melbourne and Perth central business districts; and
• About 200 sales consultants added to the Flight Centre brand network over the course of the year to ensure each shop is appropriately staffed and to return the network to optimum staffing levels (about 5200 people), following a reduction in recent months
NEW OPPORTUNITIESThe Universal Traveller launch and the Melbourne and Perth hyper-store openings are among the enhancements that have already taken place this year.
Other recent developments have included:
• StudentUniverse.com.au’s launch in Australia as a dedicated online brand to operate alongside Universal Traveller in a stronger youth brand stable.
• Within the premium travel sector in Australia, FLT has developed a new specialist cruise offering, Travel Associates Cruise Boutique
• FLT’s acquisition of the remaining 25% interest in LDV (Canada) to give the company 100% ownership of the business; and
• The launch of new brands within TTG (formerly TEN), as outlined previously
FLT’s 100% ownership of 3mundi is expected to help fuel profit growth during FY20, although the increased contribution is likely to be offset by losses associated with the company’s 25% investment in the Upside corporate travel start-up.
As announced previously, FLT will incorporate Upside’s technology into its Corporate Traveller businesses in North America and the UK and expects deployment in the USA late in the year.
We will, of course, continue to pursue other mergers and acquisition opportunities, although our primary focus will be on organic growth within our leisure, corporate and at-destination businesses.
Thank you for your ongoing support of our company. We look forward to updating you on our achievements as the year progresses.
12 ANNUAL REPORT 2019 FLIGHT CENTRE TRAVEL GROUP

ANNUAL REPORT 2019 FLIGHT CENTRE TRAVEL GROUP 13
DIRECTORS’ REPORTYour directors present their report on the consolidated entity (referred to hereafter as the group) consisting of Flight Centre Travel Group Limited (FLT) and the entities it controlled at the end of, or during, the year ended 30 June 2019.
PRINCIPAL ACTIVITIESThe group’s principal continuing activities consisted of travel retailing in both the leisure and corporate travel sectors, plus in-destination travel experience businesses including tour operators, hotel management, destination management companies (DMCs) and wholesaling.
There were no significant changes in the nature of the group’s activities during the year.
SIGNIFICANT CHANGES IN STATE OF AFFAIRSThere was no significant change in the group’s state of affairs during the year.
REVIEW OF OPERATIONS – OVERCOMING OPERATIONAL RISKSA review of operations, operational risks and details of FLT’s outlook for 2019/20 are included on pages 2 to 12 of this report, along with comprehensive details on FLT’s strategies for dealing with risks and growing its business.
LIKELY DEVELOPMENTS AND EXPECTED RESULTS OF OPERATIONSInformation on likely developments in the group’s operations and the expected results of operations has been included in the Strategic Update column on page 8 and Outlook column on page 11 of this report.
DIVIDENDS – FLIGHT CENTRE TRAVEL GROUP LIMITED
Dividends paid to members during the financial year were as follows:2019
$’0002018
$’000
Final ordinary dividend for the year ended 30 June 2018 of 107.0 cents (2017: 94.0 cents) per fully paid share 108,153 94,990
Interim ordinary dividend for the year ended 30 June 2019 of 60.0 cents (2018: 60.0 cents) per fully paid share 60,657 60,639
Special dividend for the year ended 30 June 2019 of 149.0 cents (2018: nil) per fully paid share 150,631 -
319,441 155,629
MATTERS SUBSEQUENT TO THE END OF THE FINANCIAL YEAR
DIVIDENDSOn 22 August 2019, FLT’s directors declared a fully franked 98.0 cents per share final dividend on ordinary shares for the 2019 financial year. The total amount of the dividend is $98.9million. The combined interim and final dividend payments represent a $159.5million return to shareholders, 60% of FLT’s statutory NPAT.
ACQUISITIONSOn 1 August 2019, FLT acquired the remaining 25% of Les Voyages Laurier du Vallon (LDV) under the terms of a rolling put/call option that was agreed when FLT initially invested in the Quebec-based business. This brings FLT’s shareholding to 100%. An initial payment of $6,159,000 has been made, with the final payment subject to finalisation of the LDV financial statements. Refer to note A7 for further details.
BORROWINGSOn 4 July 2019, FLT repaid $60,000,000 of the $160,000,000 bilateral debt facility that was outstanding at year end. Refer to note B4 for further details.
No other material matters have arisen since 30 June 2019.
ENVIRONMENTAL REGULATIONSThe group has determined that no particular or significant environmental regulations apply to it.

DIRECTORS’ REPORT
14 ANNUAL REPORT 2019 FLIGHT CENTRE TRAVEL GROUP
INFORMATION ON DIRECTORS
The following persons were FLT directors during the financial year and up to the date of this report:
DIRECTOR EXPERIENCE AND DIRECTORSHIPSSPECIAL RESPONSIBILITIES
DIRECTORS’ INTERESTS IN SHARES OF FLT AS AT DATE
OF THIS REPORT
ORDINARY SHARES
G.W. Smith
BCom, FCA, FAICD
Age: 59
FLT director since 2007. Gary has vast tourism industry experience and has served on a diverse range of boards and tourism industry related bodies during the past 30 years. Gary is a Fellow of the Australian Institute of Company Directors and the Institute of Chartered Accountants. He is also a director of Michael Hill International Limited (from Feb-16) and National Roads and Motorists' Association Limited (the NRMA) (from Feb-19).
Independent non-executive chairman
Remuneration & nomination committee member
Audit and risk committee member
15,000
J.A. Eales
BA, GAICD
Age: 49
FLT director since 2012. Director of Palladium Group (from Mar-10), Magellan Financial Group (from Jul-17), Executive Health Solutions (from Jun-15) and FujiXerox-DMS Asia Pacific (from Jan-14).
Independent non-executive director
Remuneration & nomination committee chairman
Audit and risk committee member
3,000
R.A. Baker
FCA, GAICD, BBus (Accountancy)
Age: 61
FLT director since 2013. Former audit partner of PricewaterhouseCoopers, with experience in the retail, travel and hospitality sectors. Chairman of Rightcrowd Limited (from Aug-17), chairman of Goodman Private Wealth Ltd (from Oct-14), chairman of the Archdiocesan Development Fund, Catholic Archdiocese of Brisbane (from Jan-18), and chairman of the audit and risk committee of Australian Catholic University Limited (from May-15).
Independent non-executive director
Remuneration & nomination committee member
Audit and risk committee chairman
3,500
C.M.Garnsey
OAM
Age: 59
FLT Director since Feb-18. Chairman and independent director of Australian Wool Innovation Limited and non-executive director of Seven West Media. Extensive experience in Australian retail industry, marketing and distribution. Former advisory roles include advisor to Federal Minister for Trade and Investment, Australian Fashion Week, Melbourne Fashion Festival and CSIRO. Former executive director of Just Group Limited (2012-2017).
Independent non-executive director
Remuneration & nomination committee member
Audit and risk committee member
3,000
G.F. Turner
BVSc
Age: 70
Founding FLT director with significant experience in running retail travel businesses in Australia, New Zealand, USA, UK, South Africa, Canada and Asia. Director of the Australian Federation of Travel Agents Limited (from Sept-05).
Managing Director 15,245,012
No directors held interests in share rights, options or performance rights during the year (2018: nil).

ANNUAL REPORT 2019 FLIGHT CENTRE TRAVEL GROUP 15
SKILLS AND EXPERIENCEThe current mix of skills and experience represented by the directors during the period, is as follows:
G.W. SMITH J.A. EALES R.A. BAKER C.M. GARNSEY G.F. TURNER
Travel or retail industry
Senior executive
Finance/capital markets
Audit/accounting
Legal*
Regulatory/public policy
International markets
Strategy/risk management
Governance
Marketing/communications
Technology/IT*
* For expertise in areas not listed above, the directors seek expertise within FLT and externally where appropriate.
COMPANY SECRETARYThe company secretary, Mr D.C. Smith (B.Com, LLB) joined FLT in 2002, and was appointed as company secretary in February 2008. Mr Smith has over 20 years legal experience. Mr Smith is also the general manager of mergers & acquisitions with FLT. Prior to joining FLT, Mr Smith held positions with Wilson HTM, Blake Dawson (now Ashurst) and Clayton Utz.
MEETINGS OF DIRECTORSThe number of meetings of the company’s board of directors and of each board committee held during the year ended 30 June 2019 and the number of meetings attended by each director were:
COMMITTEE MEETINGS
FULL MEETINGS OF DIRECTORS AUDIT & RISK
REMUNERATION & NOMINATION
A B A B A B
G.W. Smith 16 16 3 3 2 2
J.A. Eales 16 16 3 3 2 2
R.A. Baker 16 16 3 3 2 2
C.M. Garnsey 14 16 3 3 2 2
G.F. Turner 16 16 * * * *
A = Number of meetings attended
B = Number of meetings held during the time the director held office or was a member of the committee during the year
* = Not a member of the relevant committee

16 ANNUAL REPORT 2019 FLIGHT CENTRE TRAVEL GROUP
On behalf of FLT’s board, I am pleased to introduce your company’s FY19 remuneration report.
While KMP pay structures were unchanged during FY19, the year to June 30 2019 was a significant period from a broader remuneration perspective, particularly in Australia, as we worked with our sales people to develop and introduce our first EBA.
The EBA’s key features were negotiated and agreed during several months of discussions with our Student Flights (now Universal Traveller) and Flight Centre sales people and the agreement itself received overwhelming support – 85% of our people voted in favour – when it was ultimately put to our staff in October 2018.
This new system, which is now in place but has not yet been formally ratified by Australia’s Fair Work Commission, has already delivered tangible benefits to some 6000 people in terms of both pay and conditions. Some of the key features and benefits have been summarised in table 1.
TABLE 1: THE FLIGHT CENTRE AGREEMENT The Flight Centre Agreement details all terms and conditions for Flight Centre brand and Universal Traveller team members and entitles then to benefits ranging from:
• An additional week’s leave to relax or travel depending on their individual needs
• Flexibility to ensure they are able to balance their work and life; and
• The ability to earn incentives far beyond other industries
In addition, it offers stability and security when it is most needed through the provision of:
• Three paid days of Natural Disaster Leave• Five paid days of bereavement/ compassionate leave• Five days paid Domestic/Family violence leave; and• The unique offering of a Giving Bank, which allows
fellow team members to contribute unused personal leave to those who may need it more
From a governance perspective, FY19 was also a very significant year in Australia as a result of the Financial Services Royal Commission.
The commission’s findings and some of the behaviours that were unearthed made for compulsory reading in boardrooms throughout Australia – including our own
OVERVIEWJOHN EALES REMUNERATION AND NOMINATION COMMITTEE CHAIRMAN
REMUNERATION REPORT GLOSSARY
• BOS: Business ownership scheme
• CEO: Chief executive officer
• CFO: Chief financial officer
• COO: Chief operating officer
• EBA: Enterprise bargaining agreement
• EBIT: Earnings before interest and tax
• EGM: Executive general manager
• EMEA: Europe, Middle East and Africa
• ESP: Employee Share Plan
• FLT: Flight Centre Travel Group Limited
• FY: The fiscal year
• LTRP: Long Term Retention Plan
• LSL: Long Service Leave
• KMP: Key management personnel
• KPIs: Key performance indicators, the basis for FLT’s STIs
• NEDs: Non-executive directors
• PBT: Profit before tax
• RNC: FLT’s Remuneration and Nomination Committee
• SBP: Share based payments
• STIs/LTIs: Short-term incentives/long-term incentives
• Targeted Packages: The packages KMP are offered at the beginning of each year and consisting of base pay, superannuation and targeted STI earnings
• TIP: Transformation Incentive Plan

ANNUAL REPORT 2019 FLIGHT CENTRE TRAVEL GROUP 17
– and strongly reinforced the need for strict ongoing governance and diligence.
FLT has an incentivised workforce and constantly reviews its systems and structures to ensure that STIs are tied to outcomes that encourage sales people and their leaders to develop sustainable business models and ongoing, positive relationships with their customers.
Ultimately, our sales people will achieve the best financial rewards during their Flight Centre careers if they play the long game by building a book of loyal, long-term customers and maintain these relationships by delivering the best travel advice and outstanding service.
To reinforce the emphasis the company is placing on maintaining positive, long-term customer relationships, a new policy has been put in place for FY20 to ensure service remains at the forefront of our people’s minds at all times.
Under this new policy, all of our front end sales people who achieve the financial KPIs necessary to qualify for our Global Gathering, our showpiece annual event, will also need to achieve a customer satisfaction measure within their businesses.
A COMMON-SENSE REMUNERATION SYSTEM THAT ALIGNS TO FLT’S STRATEGIC OBJECTIVESThroughout its history, FLT has taken a common-sense approach to business rather than adopting conventional off-the-shelf strategies and policies that are neither aligned to our strategic objectives nor our core philosophies.
This common-sense approach is illustrated in our unique remuneration structures, which are purpose-built to meet FLT’s short and long-term strategic objectives,
This year, we have summarised the key differences between FLT’s tailor-made system and traditional remuneration models in table 2 to enhance shareholder understanding.
TABLE 2: UNDERSTANDING THE DIFFERENCES: FLT’S TAILOR-MADE REMUNERATION MODEL V TRADITIONAL OFFERINGS
STI component built into targeted remuneration packages, not paid as an annual bonus
STIs are not annual bonuses that are only payable to FLT’s executives in good years. The company’s people are targeted to earn STIs as part of their normal (targeted) remuneration packages in any given year and can earn additional stretch STIs (above and beyond targeted packages) if they exceed their KPIs.
Profit-Based KPIs Tied to Sustainable, Ongoing Growth
FLT uses profit – generally underlying PBT – as the basis of its executive STIs, which is aligned to its goal of delivering sustainable, year on-year earnings growth to benefit all stakeholders. To earn their targeted STIs, executives need to deliver ongoing profit growth.
LTRP is primarily a retention tool, not a traditional LTI
The company’s main KMP LTI, the LTRP, does not have result-related performance hurdles attached to it. This is because the LTRP is a tailor-made retention tool for key executives and its performance hurdle is longevity-related.
STIs are uncapped
Fairness and reward for achievement are key components of FLT’s remuneration system. Although the company does not cap STIs for KMP, or indeed for its sales people, formal structures, governance processes and natural curbs are in place to ensure that rewards are aligned to shareholders’ interests and to prevent salaries from reaching unacceptable levels.
The LTRP, which is now in its fifth year, is one of the tailor-made programs that we have highlighted and is an example of FLT’s willingness to build and implement offerings that are aligned to its key strategic objectives.
This program is not intended to be a conventional LTI.
Rather, it is a hybrid program that first and foremost serves as a long-term retention tool for key executives, but secondly, strengthens the alignment between KMP and shareholder interests as these executives build
tangible and immediate ownership of the company. We believe ownership among our people is a critical factor in our success and this belief is articulated in our core philosophies.
Our LTRP operates alongside our BOS program, which also serves as an LTI for some key executives.
While the LTRP builds executives’ ownership in the company overall, executives’ participation in the BOS delivers another long-term incentive to grow the individual businesses they run. In tandem, the BOS and the LTRP ensure our executives are invested in growing both their individual businesses and the company overall for the benefit of shareholders.
Our remuneration objectives are unchanged and, in simple terms, are to ensure:
• Key people are attracted and retained – our success in this area is highlighted by of our key executives’ longevity, as outlined in table 3 and by the 98% retention rate among LTRP participants during FY19
• Our people are recognised and rewarded appropriately for their achievements in growing our business, helping our company achieve its long-term strategic objectives and delivering sustainable growth in value to our shareholders
• Incentive structures are simple and transparent; and• Our people have the opportunity to invest in their
company through long-term share ownership, which ensures they adopt the behaviours and implement the strategies that deliver long-term wealth creation for shareholders, rather than simply focusing on short-term performance.
Of course, another important consideration is to ensure that shareholders are comfortable with and understand our remuneration structures. In this regard, we proactively engage with industry bodies, special interest groups and
other key stakeholders and amend our structures where appropriate.
Generally, shareholders have responded positively to our remuneration system and the policies, beliefs and governance structures which underpin it, with the largest vote against our remuneration report representing just 5.85% of our issued capital (2007).

18 ANNUAL REPORT 2019 FLIGHT CENTRE TRAVEL GROUP
TABLE 3: KMP TENURE - SUCCESSFULLY DEVELOPING AND RETAINING KEY PEOPLE
EXECUTIVE AGE TENURE FIRST FLT ROLE CURRENT FLT ROLE
Adam Campbell 44 12 years Risk & Audit CFO
Chris Galanty 45 22 years Flight Centre Putney (UK) EGM – EMEA
Dean Smith 52 23 years Flight Centre Elizabeth Street (Victoria) EGM – The Americas
Melanie Waters-Ryan 52 32 years Flight Centre Queen Street (QLD) COO
FY19 OUTCOMES AND FY20 EXPECTATIONSGiven that the company did not achieve its FY19 profit goal, the three KMP whose targeted STIs were tied exclusively to global profit growth, namely Skroo, Adam Campbell and Melanie Waters-Ryan, earned 90% of their targeted remuneration packages for the year.
The additional 10% of their targeted packages was subject to FLT achieving a $400million underlying PBT (4% year-on-year growth).
While the company’s underlying PBT was below expectations, overseas businesses generally performed well. This was reflected in stronger earnings outcomes for Dean Smith, the head of our Americas business, who earned stretch STIs, and for Chris Galanty, who earned a percentage of his targeted STIs.
In relation to targeted remuneration, the FY19 outcomes for our key executives have been summarised in Table 4.
Overall, FLT paid $1.6billion in employee benefits to its people globally during the year compared to $1.5billion the prior year.
Looking ahead to FY20, similar remuneration structures for KMP are again in place with:
• STI structures unchanged, although the profit targets for the year have been reset, as outlined below; and
• Targeted packages also unchanged
At the time of writing, Board fees for FY20 had not yet been determined.
While the company has not yet released FY20 market guidance, clearly defined profit growth targets are in place for KMP STIs for the new fiscal year. In line with normal practice, these internal targets that are being used for remuneration purposes have not been disclosed publicly.
TABLE 4: KEY EXECUTIVE TARGETED REMUNERATION
KMPTARGETED
REMUNERATION FIXED PAY TARGETED STIACTUAL STI
EARNEDREASON FOR STI
VARIATION
Graham Turner AU $750,000 AU $675,000 AU $75,000 $nilKPI (AU $400m
global PBT) not achieved
Melanie Waters-Ryan AU $770,000 AU $693,005 AU $77,000 $nil As above
Adam Campbell AU $1,085,000 AU $ 976,500 AU $108,500 $nil As above
Dean Smith US $700,000 US $630,000 US $70,000 $US 175,833Surpassed KPI
(Americas profit)
Chris Galanty GBP £350,000 GBP £315,000 GBP £35,000 GBP £17,047Partially achieved
KPIs – EMEA profit
CONCLUSIONWhile we will inevitably adjust our systems from time to time to ensure they remain fit for purpose, we believe that the remuneration structures that are in place for our KMP and for our people in general:
• Are tied to its objectives and tailor-made to complement its key strategies
• Continue to fulfil their objectives• Do not exceed median market remuneration for
equivalent positions; and• Deliver tangible benefits to key stakeholders particularly
our people and our shareholders
Pay for performance remains at the forefront of this system and ensures that our people benefit to a reasonable degree when shareholders benefit.
STIs, which are outcome-based, quantitative and constantly monitored, are a key part of our overall business but we are balancing these and strengthening executives’ long-term focus through initiatives like the LTRP, the ESP and, in some cases, the BOS Multiplier program.
I thank-you for your ongoing support of FLT.

DIRECTORS’ REPORT CONTINUED
ANNUAL REPORT 2019 FLIGHT CENTRE TRAVEL GROUP 19
REMUNERATION REPORT – AUDITEDThe remuneration report outlines FLT’s KMP reward framework and is set out under the following headings:
1. Principles used to determine the nature and amount of remuneration2. Details of remuneration, including service agreements3. LTIs: BOS return multiples on redemption4. Share-based compensation; and5. Loans to KMPInformation in this remuneration report has been audited in accordance with section 308(3C) of the Corporations Act 2001.
1 PRINCIPLES USED TO DETERMINE THE NATURE AND AMOUNT OF REMUNERATIONThe following section outlines FLT’s remuneration policy and the philosophies that underpin it. Information has been categorised in a Question and Answer format in five sub-sections:
i. Remuneration philosophies and structures
ii. Alignment with shareholder wealth
iii. Director remuneration
iv. Executive (KMP) remuneration; and
v. Remuneration governance
1I) REMUNERATION PHILOSOPHIES AND STRUCTURES
WHAT IS FLT’S REMUNERATION PHILOSOPHY?
In line with its belief in common-sense over conventional wisdom, FLT has a simple remuneration system that is tied to its core philosophies and strategic objectives.
Although this reward framework is unique and is tailor-made to suit FLT’s specific goals, its ultimate objectives are in line with market practice in that they aim to ensure overall reward is:
• Competitive, which allows the company to attract and retain high calibre people• Aligned with participants’ interests, reflecting responsibilities and rewarding achievement and shareholder value
creation• Acceptable to shareholders and strongly aligned to their interests• Transparent – clear targets are set and achievements against these targets are measurable; and• Tied to the company’s longer term objectives, capital management strategies and structures
Remuneration structures for KMP (excluding NEDs) have also been carefully tailored to ensure they include an appropriate mix of:
• Fixed and variable pay; and• STIs and LTIs to ensure a strong alignment between executive and shareholder interests for both the short and
long-term
Measurable and reliable outcome-based KPIs underpin FLT’s STI programs and the company’s overall remuneration systems globally. FLT believes that if the right outcomes are rewarded via its STIs, the company, its people, its customers and its shareholders will benefit.
FLT’s belief in the value of using quantitative and outcome-based STIs to drive the desired outcomes is articulated in the company’s core philosophies, which are included in this Annual Report.
The company’s philosophies also underline its belief in the importance of providing its people with ownership opportunities and the chance “to share in the company’s success through outcome-based incentives, profit share, BOS and Employee Share Plans”.
Accordingly, ownership opportunities are built into the company’s remuneration structures to encourage FLT’s people to behave as long-term stakeholders in the company and to adopt the strategies, disciplines and behaviours that create longer term value.

20 ANNUAL REPORT 2019 FLIGHT CENTRE TRAVEL GROUP
DIRECTORS’ REPORT CONTINUED
REMUNERATION REPORT – AUDITED (CONTINUED)
WHAT ARE THE KEY COMPONENTS OF FLT’S REMUNERATION FRAMEWORK FOR EXECUTIVES?
All executives earn a combination of:
• Fixed pay• Variable STIs; and• LTIs, which may include share-based compensation and, in some cases, BOS return multipliers (variable)
Three KMP - Melanie Waters-Ryan, Chris Galanty and Dean Smith - also receive returns on their investments in the BOS, which is another tailor-made program that encourages FLT’s people to build businesses that deliver sustainable returns over the long-term.
Additional detail on each of these components is included in Table 1.
TABLE 1: THE KEY COMPONENTS OF FLT’S REWARD FRAMEWORK
Fixed Pay
Fixed pay typically includes base pay (retainer), LSL provisions and employer superannuation contributions.
FLT does not guarantee annual base pay increases for executives or for its people at other levels.
Other fixed payments, including LSL accruals, are made in accordance with relevant government regulations. Superannuation contributions are paid to a defined contribution superannuation fund.
FLT’s people are guaranteed to earn at least the minimum amount payable to them under applicable awards or other regulations and agreements.
STIs
FLT's use of STIs differs from many other companies in that its STI program is not an annual bonus scheme for executives. Rather, all KMP are targeted to earn STIs as part of their remuneration packages.
These STIs can be categorised in two ways:
1. Targeted STIs, which are structured in a way that will see an individual earn his or her targeted salary package if he or she achieves the KPIs that are in place; and
2. Stretch STIs, payments that the executive will earn if his or her businesses exceed their pre-determined targets or KPIs
All STIs (targeted and stretch) are based on measurable achievements (quantifiable) against KPIs or targets that are set before the start of each year. This transparency means that each employee knows what he or she needs to achieve to earn all or part of his or her targeted STIs or the additional stretch STIs that might become available.
FLT does not guarantee its executives will earn 100% of their targeted STI earnings, which in turns means that the company does not guarantee the annual salary packages its executives will earn beyond the fixed component (90% of targeted remuneration).
BOS returns
In line with FLT's belief in the importance of leaders taking ownership of the businesses they run, eligible executives may be invited to invest in unsecured notes in
their individual businesses via the BOS. In return for this investment, BOS participants receive a variable return that is tied to the individual business’s performance.
In basic terms, a BOS participant who has invested in a 10% interest in his or her business is entitled to 10% of the business’s profit as a return on his or her investment. The executive is exposed to the business's risks, as neither FLT nor any of its group companies guarantees returns above face value.
In accordance with the BOS prospectus, the board, via its RNC, can review and amend a BOS note if an individual return exceeds 35% of the BOS note’s face value in any 12-month period. In addition, FLT can redeem the BOS note at face value at any point.
BOS Multiplier Program
To help ensure that the leaders of some key businesses remain in their roles for the long-term, the company offers a BOS Multiplier program (see section 3). Under this program, invited senior executives become entitled to multiples of 5, 10 and up to 15 times the BOS return in the last full financial year before their BOS note is redeemed, provided they achieve tenure-related hurdles.
Provisions for these future payments are taken up annually and the amounts are shown in the salary tables in section 2. These provisions can be positive or negative as the company adjusts accruals to meet its anticipated future needs.
Share-based compensation
In line with the company's strong belief in creating ownership opportunities for its people, share-based compensation is available to KMP and other employees (excluding directors).
Programs include:
1. The ESP, which was offered to staff in Australia (excluding directors), New Zealand, Canada, the USA, South Africa and the UK; and
2. The LTRP, which was offered to various senior executives (refer section 4).

ANNUAL REPORT 2019 FLIGHT CENTRE TRAVEL GROUP 21
REMUNERATION REPORT – AUDITED (CONTINUED)
HOW ARE EXECUTIVE SALARIES STRUCTURED?
Before the start of each year, executives are offered a targeted remuneration package which includes:
• A fixed pay component equivalent to 90% of the targeted remuneration package, which gives executives a degree of certainty over their earnings and helps ensure they are retained during challenging trading periods; and
• A targeted STI component equivalent to 10% of the targeted remuneration package and tied to pre-determined KPIs
The targeted STI component is not guaranteed - either in part or in full. If the KPIs are not achieved, the executive will not earn 100% of his or her targeted remuneration package. Conversely, additional STIs (stretch incentives) will be payable if the KPIs are exceeded and the executive will earn more than 100% of his or her targeted remuneration package.
Targeted remuneration packages are periodically compared to remuneration packages for equivalent positions externally to ensure executives are remunerated at a market-equivalent level.
1II) ALIGNMENT WITH SHAREHOLDER WEALTH CREATION
HOW DOES FLT ALIGN EXECUTIVE REMUNERATION WITH SHAREHOLDER WEALTH CREATION?
FLT has a simple and logical reward system that ties KMP earnings to financial results achieved and, at the same time, rewards executives for creating longer term shareholder value. Pay-for-performance is integral to this system.
KMP are incentivised within the STI structure to improve key financial results year-on-year and are rewarded according to their achievements against pre-determined KPIs that are both measurable and outcome-based, as outlined above.
KMP KPIs are strictly tied to year-on-year growth in FLT’s overall profit and, in some instances, within its key geographic divisions. This means that senior executives’ interests are tied to the company’s success and are fully aligned with shareholders’ interests.
If the company or the key geographic divisions’ results exceed expectations, KMP will earn the full component of their targeted STIs, plus additional stretch STIs. Conversely, if the company or the key geographic divisions’ results are below expectations, KMP will earn a fraction of their targeted STIs (and possibly zero), which means they will not achieve their targeted packages for the year, as illustrated in Table 3 and as outlined above.
As outlined in table 4 of John Eales' overview, four KMP did not earn their targeted STIs during FY19 because the company or the relevant business division did not achieve its profit-related target. Dean Smith earned stretch STIs, based on the Americas business’s out-performance.
Table 2 below illustrates FLT’s achievements in the areas that drive shareholder wealth during the past five years:
TABLE 2: SHAREHOLDER WEALTH
FY19FY18
RESTATED1 FY17 FY16 FY15
Profit before income tax $343.5m $364.3m $325.4m $345.0m $366.3m
Underlying profit before income tax2 $343.1m $384.7m $329.5m $352.4m $366.3m
Profit after income tax $264.2m $264.8m $230.8m $244.6m $256.6m
Interim dividend 60.0c 60.0c 45.0c 60.0c 55.0c
Final dividend 98.0c 107.0c 94.0c 92.0c 97.0c
Special dividend 149.0c - - - -
Earnings per share (basic) 261.6c 261.1c 228.5c 242.4c 254.7c
Share price at 30 June $41.55 $63.65 $38.30 $31.58 $34.11
Increase / (decrease) in share price % (35%) 66% 21% (7%) (23%)
1 Restatements for changes in accounting policies on adoption of AASB 152 Underlying PBT is a non-IFRS measure and is unaudited.
Underlying PBT for the period 2018/19 excludes $6.7million relating to GPN revenue alignment, $29.8million relating to Olympus Tours impairment, $20.3m fair value gain on ETSC and 3mundi acquisitions and $3.1million relating to AASB 15 transition.
Underlying PBT for the period 2017/18 excludes $13.3million relating to the ACCC penalty and associated costs, $8.0million relating to the New Zealand Holidays Act remediation and associated costs and $0.8million relating to AASB 15 transition.
Underlying PBT for the period 2016/17 excludes $4.1m relating to the loss on disposal of investment in Employment Office. Underlying PBT for the period 2015/16 excludes $11.0m ACCC fine refund, $6.3m NZ building sale income, and $24.7m impairment charge. Underlying PBT for the period 2014/15 was previously reported as $363.7m, which excluded $2.6m PBT for the first year results of Topdeck from date of acquisition, 27 August 2014 until 30 June 2015. This has been updated to no longer exclude the results of Topdeck as all comparatives include the business results.

22 ANNUAL REPORT 2019 FLIGHT CENTRE TRAVEL GROUP
DIRECTORS’ REPORT CONTINUED
REMUNERATION REPORT – AUDITED (CONTINUED)FLT exceeded its targets during FY18 and finished below expectations in FY15, FY16, FY17 and FY19. The impact on KMP earnings during each period is outlined in Table 3 below.
TABLE 3: IMPACT ON KMP EARNINGS
KMP STIs are tied to FLT's underlying PBT globally and/or the PBT generated by key geographic divisions.
In simple terms, this means that STI earnings will typically be:
• Broadly in line with expectations (targeted STIs) in years where profits within their areas of responsibility are in line with expectations (when they meet their KPIs)
• Above expectations in years when KMP earn stretch STIs because profits are above expectations and shareholders benefit from higher than expected dividends and EPS (when they exceed their KPIs); and
• Below expectations in years when KMP do not earn their targeted STIs because profits and ultimately shareholder returns are below expectations and the executive has not achieved his or her KPIs
HOW DOES FLT’S REMUNERATION SYSTEM BENEFIT BOTH ITS EMPLOYEES AND ITS SHAREHOLDERS?
For executives and employees in general, benefits include:
• Clear and measurable targets and structures for achieving rewards are in place• Achievement, capability and experience are recognised and rewarded; and• Contribution to shareholder wealth creation is rewarded because STIs are tied to the company’s profit or the profit its
key geographic divisions achieve and additional LTIs are in place to reward executives for developing businesses that deliver sustainable growth over a longer horizon
For shareholders, benefits include:
• A clear short and long-term performance improvement focus, as year-on-year profit growth is a core component of FLT’s remuneration system. KMP must deliver reasonable year-on-year growth to maintain consistent earnings.
• A focus on sustained growth in shareholder wealth, as outlined above; and• The ability to attract and retain high calibre executives
1III) DIRECTOR REMUNERATION
HOW ARE NEDS REMUNERATED?
To preserve their independence, NEDs receive fixed fees. They are not eligible to participate in the ESP or BOS program and are not included in the TIP or LTRP.
The fees, which the RNC reviews and benchmarks annually, reflect the positions’ demands and responsibilities and are determined within an aggregate directors’ fee pool, which is periodically recommended for shareholder approval. The pool currently stands at $1.1million per annum, as approved by shareholders on 22 October 2018.
During FY19, FLT paid 69% of this pool to its NEDs.
Fees paid to individual directors were in line with those paid during FY18. These fees – in the order of $170,000 for directors and $250,000 for the chairman – remain below the median for ASX 50-100 companies of $180,864 and $396,080 respectively (Source: CGI Glass Lewis 2018) and are set to be reviewed early in FY20.
HOW ARE CHAIRMAN’S FEES DETERMINED?
The chairman’s fees are determined independently and are benchmarked against comparable roles in other listed entities. The chairman does not attend Board and RNC discussions relating to his remuneration.

ANNUAL REPORT 2019 FLIGHT CENTRE TRAVEL GROUP 23
REMUNERATION REPORT – AUDITED (CONTINUED)
1IV) EXECUTIVE KMP REMUNERATION STRUCTURES
WHAT ARE KMP STIS BASED ON?
During FY19, KMP STIs were based on:
• FLT’s Underlying PBT for the CEO, CFO and COO. Targeted STIs for these three executives were based on FLT delivering a $400million underlying PBT, 4% year-on-year growth; and
• A combination of divisional PBT/EBIT (70%) and FLT underlying PBT (30%) for the leaders of FLT’s businesses in the Americas (Dean Smith) and EMEA (Chris Galanty)
No executives were remunerated on external factors.
FLT’s broader STI structure is outlined in Table 4 below.
TABLE 4: STI SUMMARY – KMP
Participants: All KMP (excluding NEDs) are targeted to earn performance-based STIs as part of their normal remuneration packages.
Award Type:Cash payments that are made annually to the CEO and CFO and monthly to the three other executives who are classed as KMP.
Performance conditions:
KMP STIs are not guaranteed – in part or in full – and are strictly tied to the company's PBT (underlying) or the PBT/EBIT achieved within its key geographic divisions.
Structure:
KMP receive a small percentage of the company's PBT and, in some cases, the PBT/EBIT achieved within its key geographic divisions. For an executive to achieve 100% of his or her targeted STIs, the company or the relevant division must achieve a predetermined target for the year. If the executive’s business exceeds its targets, he or she will be entitled to additional stretch STIs. Conversely, executives will earn less than 100% of his or her targeted STIs if the KPIs are not met.
Limits:
While KMP STIs are theoretically uncapped, several factors will curb an executive's earning potential. Firstly, FLT's maturity means it is unlikely to achieve extraordinary underlying PBT growth in any given year. Secondly, decelerator mechanisms are in place to slow an executive's salary growth if the company or his or her business exceeds pre-determined 'stretch profit' targets. Where a business is acquired, profit targets are adjusted to reflect the acquired business’s expected contribution.
Deferral: Not applicable.
Clawback: Adjustments can be made to claw-back over-payments or to top-up under-payments.
FY19 Outcomes: The STI outcomes for KMP have been outlined in Table 4 in John Eales' overview.
WHAT PERCENTAGE OF OVERALL REMUNERATION IS FIXED FOR FLT EXECUTIVES?
For each executive who is classed as KMP, 90% of targeted remuneration is fixed and 10% is tied to STIs (variable).
In any given year and as outlined in previous sections, an executive may earn more or less than the targeted amount of 10% because STIs are tied to actual results achieved.
When profit growth exceeds expectations, STIs will exceed the targeted levels and a larger portion of earnings will have been at risk. Conversely, when profit growth is below expectations, STIs will be lower than the targeted levels and a larger portion of earnings for the year will have been fixed.
HOW DO THE TARGETED SALARY PACKAGES THAT KMP ARE OFFERED DIFFER FROM OVERALL EARNINGS DISCLOSED IN THIS REPORT?
Targeted packages will differ from Actual and Total remuneration for three main reasons:
1. KMP may earn additional income that is not factored into the targeted remuneration packages that are offered at the beginning of each year. For example, interest earned on the executive’s BOS investment (see KMP remuneration table, page 28)
2. Statutory remuneration includes other accruals and provisions (KMP remuneration table, page 28). For example, BOS Multiplier accruals and LSL provisions. These amounts can be positive or negative; and
3. STIs can exceed or fall short of the targeted amount, as outlined above

24 ANNUAL REPORT 2019 FLIGHT CENTRE TRAVEL GROUP
DIRECTORS’ REPORT CONTINUED
REMUNERATION REPORT – AUDITED (CONTINUED)The diagrams below illustrate the differences between FLT executives’ targeted remuneration packages and statutory (reported) remuneration.
Base pay (retainer)
Actual STI earnings (targeted & stretch)
Superannuation
Other provision & accruals (LSL, BOS multiplier, LTRP)
Interest earned on BOS
investment
Statutory (reported) earnings
Base Pay(retainer)
Superannuation
Targeted STI earnings
Targeted packages
ARE NON-FINANCIAL KPIS USED?
No KMP are currently rewarded on non-financial KPIs, although the company plans to introduce an additional customer metric into its executive KPIs during FY21.
HOW DOES FLT LIMIT EXECUTIVE STIS?
While KMP STI earnings are theoretically uncapped, structures, governance processes and natural curbs are in place to ensure that executive earnings are aligned to shareholders’ interests and do not reach unacceptable levels.
Effectively, KMP earn a small percentage of global profit and, in some cases, a small percentage of their geographic division’s profit. As outlined previously, this percentage is calculated in such a way that the executive will earn his or her targeted STIs if FLT or the executive’s business achieves its pre-determined profit growth target.
For example, an executive who was targeted to earn $40,000 in targeted STIs if FLT achieved a $400million PBT could be offered a 0.01% share of FLT’s audited profit result for the year.
If the company significantly exceeds its profit goal and reaches “stretch” targets, decelerator mechanisms will kick-in to slow the executive’s earnings growth. For FY19, a decelerator would have applied to the global portion of STIs had an executive earned 150% of his or her targeted salary package. This decelerator is again in place for FY20.
A number of other factors will also limit earnings growth for KMP:
• Firstly, STIs are tied to results achieved by businesses that are now reasonably mature and are, therefore, limited by the relevant business’s earnings growth potential; and
• Secondly, the percentage of profit the executive earns under his or her KPIs is relatively small. In a year of normal profit growth, executive STIs will not significantly increase
The graph below shows the impact various profit growth scenarios would have had on Graham Turner’s, Adam Campbell’s and Melanie Waters-Ryan’s targeted earnings for FY19.
GRAPH: FIXED PAY AND STIS
$0.0
$0.5
$1.0
$1.5
$2.0
$2.5
$3.0
$3.5
$4.0
4% PBT Growth
Graham Turner
20% PBT Growth 50% PBT Growth 100% PBT Growth
Adam Campbell Melanie Waters-Ryan
Mill
ions
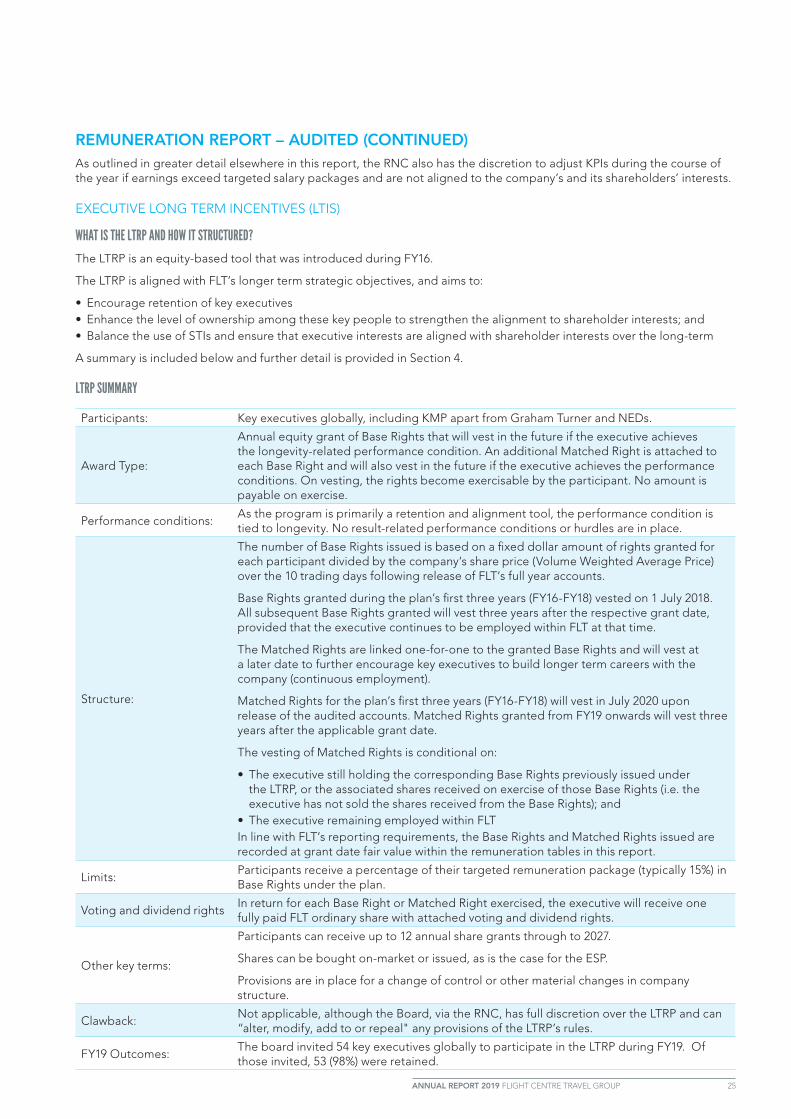
ANNUAL REPORT 2019 FLIGHT CENTRE TRAVEL GROUP 25
REMUNERATION REPORT – AUDITED (CONTINUED) As outlined in greater detail elsewhere in this report, the RNC also has the discretion to adjust KPIs during the course of the year if earnings exceed targeted salary packages and are not aligned to the company’s and its shareholders’ interests.
EXECUTIVE LONG TERM INCENTIVES (LTIS)
WHAT IS THE LTRP AND HOW IT STRUCTURED?
The LTRP is an equity-based tool that was introduced during FY16.
The LTRP is aligned with FLT’s longer term strategic objectives, and aims to:
• Encourage retention of key executives• Enhance the level of ownership among these key people to strengthen the alignment to shareholder interests; and• Balance the use of STIs and ensure that executive interests are aligned with shareholder interests over the long-term
A summary is included below and further detail is provided in Section 4.
LTRP SUMMARY
Participants: Key executives globally, including KMP apart from Graham Turner and NEDs.
Award Type:
Annual equity grant of Base Rights that will vest in the future if the executive achieves the longevity-related performance condition. An additional Matched Right is attached to each Base Right and will also vest in the future if the executive achieves the performance conditions. On vesting, the rights become exercisable by the participant. No amount is payable on exercise.
Performance conditions:As the program is primarily a retention and alignment tool, the performance condition is tied to longevity. No result-related performance conditions or hurdles are in place.
Structure:
The number of Base Rights issued is based on a fixed dollar amount of rights granted for each participant divided by the company’s share price (Volume Weighted Average Price) over the 10 trading days following release of FLT’s full year accounts.
Base Rights granted during the plan’s first three years (FY16-FY18) vested on 1 July 2018. All subsequent Base Rights granted will vest three years after the respective grant date, provided that the executive continues to be employed within FLT at that time.
The Matched Rights are linked one-for-one to the granted Base Rights and will vest at a later date to further encourage key executives to build longer term careers with the company (continuous employment).
Matched Rights for the plan’s first three years (FY16-FY18) will vest in July 2020 upon release of the audited accounts. Matched Rights granted from FY19 onwards will vest three years after the applicable grant date.
The vesting of Matched Rights is conditional on:
• The executive still holding the corresponding Base Rights previously issued under the LTRP, or the associated shares received on exercise of those Base Rights (i.e. the executive has not sold the shares received from the Base Rights); and
• The executive remaining employed within FLTIn line with FLT’s reporting requirements, the Base Rights and Matched Rights issued are recorded at grant date fair value within the remuneration tables in this report.
Limits:Participants receive a percentage of their targeted remuneration package (typically 15%) in Base Rights under the plan.
Voting and dividend rightsIn return for each Base Right or Matched Right exercised, the executive will receive one fully paid FLT ordinary share with attached voting and dividend rights.
Other key terms:
Participants can receive up to 12 annual share grants through to 2027.
Shares can be bought on-market or issued, as is the case for the ESP.
Provisions are in place for a change of control or other material changes in company structure.
Clawback:Not applicable, although the Board, via the RNC, has full discretion over the LTRP and can “alter, modify, add to or repeal" any provisions of the LTRP’s rules.
FY19 Outcomes:The board invited 54 key executives globally to participate in the LTRP during FY19. Of those invited, 53 (98%) were retained.

26 ANNUAL REPORT 2019 FLIGHT CENTRE TRAVEL GROUP
DIRECTORS’ REPORT CONTINUED
REMUNERATION REPORT – AUDITED (CONTINUED)
WHY AREN’T RESULT-RELATED PERFORMANCE HURDLES IN PLACE FOR THE LTRP?
Given that the LTRP is not a traditional LTI and is primarily a tool to help retain key executives for the long-term, no result-related performance hurdles apply. Rights can be granted to participants each year while they remain part of the program and while they remain part of FLT.
While FLT met with various stakeholders and considered including performance hurdles in the plan when it was reviewed during FY18, the company elected to continue under the original structure, given the plan’s success in achieving its primary strategic objective of retaining key individuals.
A total of 53 participants in the FY19 program were retained and only four participating executives have elected to resign since the program was introduced during FY16.
The company also believes that its program gives executives a stronger sense of ownership and alignment with shareholders than other plans that are tied to longer term performance hurdles, which may or may not be achieved. Like other shareholders, LTRP participants gain an immediate sense of share ownership when they are invited to become part of the program, rather than the possibility of a longer term reward, and see the same short-term benefits (excluding dividends and voting rights), while also being motivated as an owner to deliver longer term value.
ARE OTHER LTIS IN PLACE FOR KMP?
FLT’s senior executives are integral to the success of its key businesses and the company overall.
To help retain these key people and to encourage them to build businesses that deliver sustainable profits into the future, the company has tailored an additional LTI that is aligned to the BOS. Three KMP have been included in this BOS Multiplier program, which is outlined in section 3.
Under this program, each participating executive becomes entitled to a one-off BOS return multiplier upon the BOS note’s redemption if he or she remains in his or her role, or an equivalent or more senior position, for between five and 15 years.
There is also a transformation incentive plan (TIP), however KMP are not eligible to participate.
1V) REMUNERATION GOVERNANCE
HOW IS EXECUTIVE REMUNERATION MONITORED TO ENSURE FLT ACHIEVES ITS REWARD OBJECTIVES?
FLT’s RNC, which includes the company’s NEDs, oversees and monitors executive remuneration and provides specific recommendations on remuneration and incentive structures, policies and practices and other employment terms for directors and senior executives.
In making its recommendations, the RNC considers:
• External benchmarks against ASX-listed companies, other global travel companies and retailers in general• Targeted earnings being aligned with targeted PBT growth; and• Three-five years’ salary data for the position to ensure earnings are aligned with results over the longer term
During the course of the year, the RNC receives regular updates in relation to employee earnings. This allows the RNC to monitor executives’ potential earnings against their divisions’ performance and the targets that were set at the start of the year.
The RNC also has the discretion to withhold STI payments if deemed appropriate.
The RNC can adjust KPIs if actual earnings are likely to excessively exceed targeted packages or if a material change occurs within the business. For example, the RNC can normalise earnings by excluding unforeseen items or including an acquired business’s contributions for the purposes of calculating STIs.
The RNC can “alter, modify, add to or repeal any provisions of the LTRP’s rules in any way it believes is necessary or desirable to better secure or protect the company’s rights”. Subject to some conditions, the committee can, at any time, “amend, add to, revoke or substitute all or any of the provisions of the LTRP rules”.
Under the LTRP, amendments can be made if the company is subject to a takeover bid or if the company’s capital is consolidated, subdivided, returned, reduced or cancelled.
The RNC is supported by local committees that operate within FLT’s key geographic divisions. These local committees generally meet quarterly and include the local EGM, CFO and HR (Peopleworks) leader.

ANNUAL REPORT 2019 FLIGHT CENTRE TRAVEL GROUP 27
REMUNERATION REPORT – AUDITED (CONTINUED)
WITHIN ITS EXECUTIVE REMUNERATION STRUCTURES, HOW DOES THE COMPANY ENSURE THAT KMP ARE FOCUSED ON PROTECTING AND GROWING SHAREHOLDER VALUE NOW AND INTO THE FUTURE?
Through the tailor-made programs that the company has developed and refined, it has created a remuneration program that rewards executives for surpassing the prior year’s achievement, but also for delivering results that can be sustained in to the future.
Executive STIs are tied to FLT’s underlying profits for the year, which are subject to rigorous internal and external checks and reviews and can be adjusted (clawed back or topped up) if required.
Within this STI structure, executives are also rewarded for adopting strategies that deliver long-term growth, as future STIs and BOS interest are dependent on the business achieving ongoing profit growth. This focus on ongoing growth promotes longer term thinking and sustainability, as an executive who took a short-term approach to profit growth and earned higher STIs in any given year would be adversely affected in future years.
To further encourage long-term thinking and to ensure key people are focussed on building businesses that can deliver sustainable returns for the future, KMP (excluding directors) have been included in the LTRP. In addition to aiding executive retention, this has delivered a stronger sense of ownership and a clear alignment with shareholders’ long-term interests.
Three KMP also participate in the BOS, which is another key LTI.
2 DETAILS OF REMUNERATIONThe following tables outline KMP remuneration details for the company and consolidated entity consisting of FLT and the entities it controlled for the year ended 30 June 2019. Board and KMP are as defined in AASB 124 Related Party Disclosures and are responsible for planning, directing and controlling the entity’s activities.
BOARD OF DIRECTORS
Non-Executive Directors
G.W. Smith – ChairmanJ.A. EalesR.A. Baker C.M. Garnsey
Executive Director
G.F. Turner
OTHER GROUP KMP
M. Waters-Ryan – COOA. Campbell – CFOC. Galanty – EGM – EMEAD.W. Smith – EGM – The Americas
PARENT ENTITY
With the exception of C. Galanty and D.W. Smith, the executives listed above were also Parent Entity executives.
SERVICE AGREEMENTS
No fixed-term service agreements are in place with FLT’s directors or KMP. Senior executives are bound by independent and open-ended employment contracts that are reviewed annually.
The company does not pay sign-on bonuses and requires KMP to provide at least 12 weeks written notice of their intention to leave FLT. Termination payments to executives and other employees who are displaced as a result of their roles becoming redundant are assessed on a case-by-case basis and are capped by law. If the terminated senior executive has a BOS note (refer to note D2), FLT will also be required to repay the BOS note’s face value and any applicable one-off BOS multiplier payment (refer to section 3), to the executive, in line with the redemption rules that apply to the BOS program generally. FLT is not bound, under the terms of any executive’s employment contract, to provide termination benefits beyond those that are required by law.
As is the case for all employees, KMP employment may be terminated immediately for serious misconduct.

28 ANNUAL REPORT 2019 FLIGHT CENTRE TRAVEL GROUP
DIRECTORS’ REPORT CONTINUED
REMUNERATION REPORT – AUDITED (CONTINUED)
KMP
The following table shows the remuneration paid and payable to KMP for the year ended 30 June 2019. Remuneration amounts are determined in accordance with the Corporations Act 2001’s requirements and are set out in the table below and in conjunction with the table on page 29 of this report.
NAME
PAID AND PAYABLE REMUNERATION
TOTAL PAID AND PAYABLE
REMUNERATION $
SHORT-TERM EMPLOYEE BENEFITS
POST EMPLOYMENT BENEFITS1
CASH SALARY AND FEES2
$
SHORT TERM INCENTIVE2
$BOS INTEREST3
$SUPERANNUATION
$
NON-EXECUTIVE DIRECTORSG.W. Smith
2019 229,469 - - 20,531 250,000
2018 230,384 - - 20,049 250,433
J.A. Eales
2019 155,251 - - 14,749 170,000
2018 155,251 - - 14,749 170,000
R.A. Baker
2019 155,251 - - 14,749 170,000
2018 155,251 - - 14,749 170,000
C.M. Garnsey
2019 155,251 - - 14,749 170,000
2018 62,100 - - 5,900 68,000
EXECUTIVE DIRECTORSG.F. Turner
2019 654,469 - - 20,531 675,000
2018 654,951 445,833 - 20,049 1,120,833
OTHER GROUP KMPM. Waters-Ryan
2019 672,469 - 497,748 20,531 1,190,748
2018 674,957 445,805 611,073 20,049 1,751,884
A. Campbell
2019 955,969 - - 20,531 976,500
2018 840,821 568,599 - 20,049 1,429,469
C. Galanty
2019 569,912 30,842 969,722 - 1,570,476
2018 547,057 252,275 850,896 - 1,650,228
D.W. Smith
2019 880,585 245,772 782,335 - 1,908,692
2018 812,501 541,668 496,512 - 1,850,681
TOTAL KMP COMPENSATION (EXCLUDING LONG TERM BENEFITS)2019 4,428,626 276,614 2,249,805 126,371 7,081,416
2018 4,133,273 2,254,180 1,958,481 115,594 8,461,528
1 No termination benefits (leave entitlements and redundancy payments owing to employees at the date of termination) were paid during the year (2018: nil).2 For each executive who is classed as KMP, 90% of targeted remuneration package is effectively fixed for both 2019 and 2018.3 BOS interest shown above does not take into account financial liabilities (principal repayments) that may relate to this investment.

ANNUAL REPORT 2019 FLIGHT CENTRE TRAVEL GROUP 29
REMUNERATION REPORT - AUDITED (CONTINUED)NEDs receive fixed fees for service, do not receive STIs or LTIs and do not participate in the BOS or BOS Multiplier program. No components of their remuneration are at risk.
NAME
TOTAL PAID AND PAYABLE
REMUNERATION $
LONG-TERM EMPLOYEE BENEFITS
SHARE- BASED PAYMENTS
TOTAL REMUNERATION
$
PERCENTAGE PERFORMANCE
RELATED4 %
LONG SERVICE
LEAVE1 $
BOS MULTIPLIER PROVISION2
$
EQUITY SETTLED PLANS3
$
TOTAL NON EXECUTIVE DIRECTORS COMPENSATION
2019 760,000 - - - 760,000 -
2018 658,433 - - - 658,433 -
EXECUTIVE DIRECTORS
G.F. Turner
2019 675,000 (158,115) - - 516,885 -
2018 1,120,833 296,733 - - 1,417,566 31
OTHER GROUP KMP
M. Waters-Ryan
2019 1,190,748 (32,220) 852,000 144,692 2,155,220 63
2018 1,751,884 129,865 852,000 272,654 3,006,403 63
A. Campbell
2019 976,500 43,480 - 254,940 1,274,920 -
2018 1,429,469 37,783 - 314,983 1,782,235 31.9
C. Galanty
2019 1,570,476 - 1,844,781 144,692 3,559,949 80
2018 1,650,228 - 1,147,238 272,654 3,070,120 73
D.W. Smith
2019 1,908,692 - 1,105,878 149,611 3,164,181 67
2018 1,850,681 - 546,826 278,776 2,676,283 59
TOTAL KMP COMPENSATION
2019 7,081,416 (146,855) 3,802,659 693,935 11,431,155
2018 8,461,528 464,381 2,546,064 1,139,067 12,611,040
1 Long Service Leave (LSL) includes amounts accrued during the year. LSL provisions are linked to overall executive remuneration (which consists of the short-term benefits noted above) and, therefore, vary from year to year. Movements are based on total salary which is dependent on performance during the year. Negative amounts are sometimes recognised, as provisions naturally adjust after periods of stronger than anticipated growth.2 BOS Multiplier program provisions are linked to profit and, therefore, vary from year to year. Information on the BOS program is included in section 3.3 Share-based payments represent amounts expensed in relation to rights granted under LTRP Grant 2016 (Grant 1), Grant 2017 (Grant 2), Grant 2018 (Grant 3), and Grant 2019 (Grant 4). D.W.Smith’s and A. Campbell’s include matched rights granted under the ESP (refer section 4).4 Performance related percentage calculated as the sum of the STI and BOS interest, and BOS Multiplier divided by total remuneration.
DETAILS OF REMUNERATION PAID AND FORFEITED
For each short term incentive, the percentage of the available bonus that was paid, or that vested, in the financial year and the percentage that was forfeited because the person did not meet the service and performance criteria is set out below. No part of the bonus is payable in future years.
INCENTIVES
OTHER GROUP KMP PAID % FORFEITED %
G.F. Turner 0% 100%
M. Waters-Ryan 0% 100%
C. Galanty 49% 51%
D.W. Smith 100% 0%
A. Campbell 0% 100%
Additional stretch incentives were paid to KMP for exceeding target STI PBT expectations.
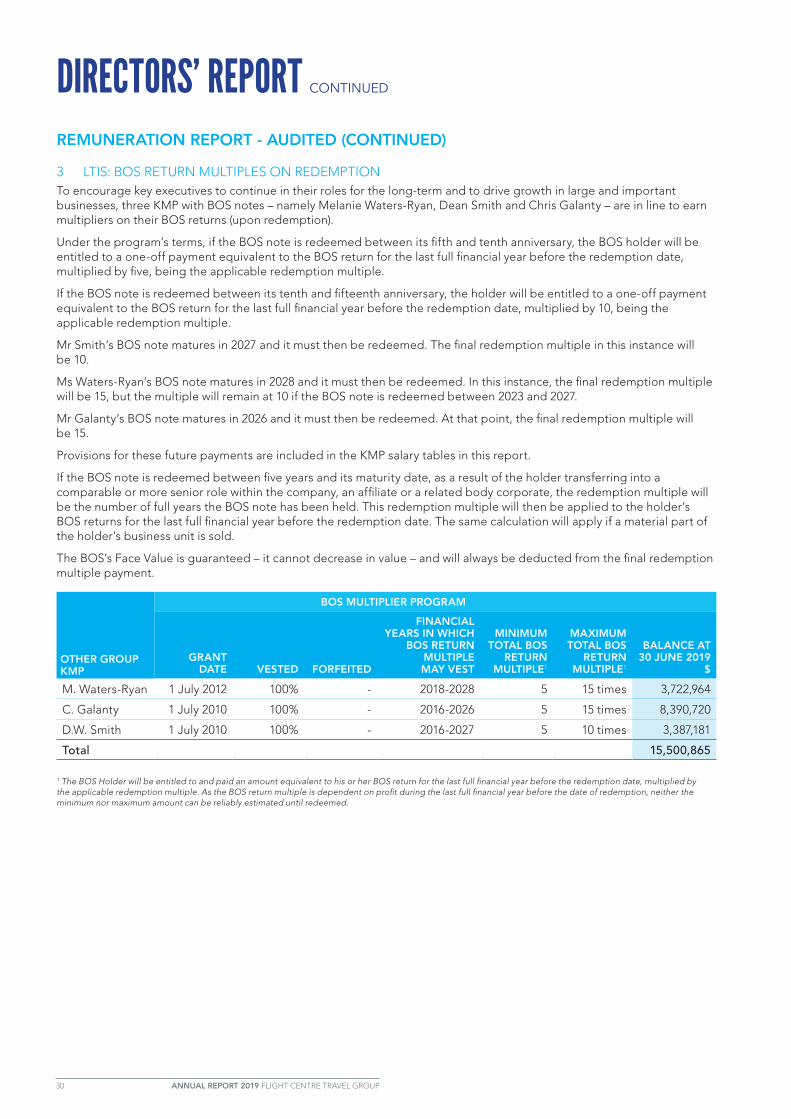
30 ANNUAL REPORT 2019 FLIGHT CENTRE TRAVEL GROUP
DIRECTORS’ REPORT CONTINUED
REMUNERATION REPORT - AUDITED (CONTINUED)
3 LTIS: BOS RETURN MULTIPLES ON REDEMPTION To encourage key executives to continue in their roles for the long-term and to drive growth in large and important businesses, three KMP with BOS notes – namely Melanie Waters-Ryan, Dean Smith and Chris Galanty – are in line to earn multipliers on their BOS returns (upon redemption).
Under the program’s terms, if the BOS note is redeemed between its fifth and tenth anniversary, the BOS holder will be entitled to a one-off payment equivalent to the BOS return for the last full financial year before the redemption date, multiplied by five, being the applicable redemption multiple.
If the BOS note is redeemed between its tenth and fifteenth anniversary, the holder will be entitled to a one-off payment equivalent to the BOS return for the last full financial year before the redemption date, multiplied by 10, being the applicable redemption multiple.
Mr Smith’s BOS note matures in 2027 and it must then be redeemed. The final redemption multiple in this instance will be 10.
Ms Waters-Ryan’s BOS note matures in 2028 and it must then be redeemed. In this instance, the final redemption multiple will be 15, but the multiple will remain at 10 if the BOS note is redeemed between 2023 and 2027.
Mr Galanty’s BOS note matures in 2026 and it must then be redeemed. At that point, the final redemption multiple will be 15.
Provisions for these future payments are included in the KMP salary tables in this report.
If the BOS note is redeemed between five years and its maturity date, as a result of the holder transferring into a comparable or more senior role within the company, an affiliate or a related body corporate, the redemption multiple will be the number of full years the BOS note has been held. This redemption multiple will then be applied to the holder’s BOS returns for the last full financial year before the redemption date. The same calculation will apply if a material part of the holder’s business unit is sold.
The BOS’s Face Value is guaranteed – it cannot decrease in value – and will always be deducted from the final redemption multiple payment.
OTHER GROUP KMP
BOS MULTIPLIER PROGRAM
GRANT DATE VESTED FORFEITED
FINANCIAL YEARS IN WHICH
BOS RETURN MULTIPLE MAY VEST
MINIMUM TOTAL BOS
RETURN MULTIPLE1
MAXIMUM TOTAL BOS
RETURN MULTIPLE1
BALANCE AT 30 JUNE 2019
$
M. Waters-Ryan 1 July 2012 100% - 2018-2028 5 15 times 3,722,964
C. Galanty 1 July 2010 100% - 2016-2026 5 15 times 8,390,720
D.W. Smith 1 July 2010 100% - 2016-2027 5 10 times 3,387,181
Total 15,500,865
1 The BOS Holder will be entitled to and paid an amount equivalent to his or her BOS return for the last full financial year before the redemption date, multiplied by the applicable redemption multiple. As the BOS return multiple is dependent on profit during the last full financial year before the date of redemption, neither the minimum nor maximum amount can be reliably estimated until redeemed.

ANNUAL REPORT 2019 FLIGHT CENTRE TRAVEL GROUP 31
REMUNERATION REPORT - AUDITED (CONTINUED)
4 SHARE-BASED COMPENSATION In line with FLT’s philosophies, share-based plans are in place to allow KMP (excluding directors) and employees in general to take an equity interest in the company. These plans include the LTRP and the ESP.
LTRP
The LTRP was introduced to provide equity based compensation with a focus on balancing FLTs use of STIs, long-term shareholder alignment and retention of key executives.
General terms
Invited participants are granted base rights, for no consideration, in annual tranches over a 12-year period with vesting conditions based upon continued service. When these base rights are granted, participants are also granted a corresponding number of matched rights for no consideration (one matched right for each base right granted).
Rights granted under the plan carry no dividend or voting rights. When exercisable, each right is convertible into one ordinary FLT share.
The plan’s rules stipulate that the number of shares resulting from exercising all unexercised rights cannot exceed 5% of the company’s issued capital (currently less than 1%).
Vesting requirements
Base rights granted to participants for each tranche will vest on the base rights’ vesting dates as noted in the table below, subject to the service condition being satisfied (participants remain employed by the company at the vesting date).
Matched rights granted to participants for each tranche will vest on the matched rights’ vesting dates as noted in the table below, subject to the service condition being satisfied (participants remain employed by the company at the vesting date) and the base rights (or shares) in respect of the respective grant continue to be held.
Method of settlement
The base rights and matched rights may be newly issued by FLT, purchased on-market or allocated from treasury shares.
Valuation
The fair value of base and matched rights under the plan is estimated at the date of grant using a fixed dollar amount of rights granted for each participant and the Black-Scholes option pricing model. The fair value is allocated equally over the period from grant date to vesting date, and is included in the remuneration report compensation tables.
Details of rights provided as remuneration to KMP are set out below:
GRANT NUMBER GRANT DATE
BASE RIGHTS MATCHING RIGHTS
DATE/YEAR VESTED AND EXERCISABLE EXPIRY DATE
VALUE PER RIGHT AT
GRANT DATE
DATE/YEAR VESTED AND EXERCISABLE EXPIRY DATE
VALUE PER RIGHT AT
GRANT DATE
1 1 Jan 2016 1 July 2018 1 July 2030 $31.93 1 July 2020 1 July 2030 $28.91
2 1 July 2016 1 July 2018 1 July 2030 $32.99 1 July 2020 1 July 2030 $29.58
3 1 July 2017 1 July 2018 1 July 2030 $46.63 1 July 2020 1 July 2030 $42.46
4 1 July 2018 August 2021 1 July 2030 $54.26 August 2021 1 July 2030 $54.26

32 ANNUAL REPORT 2019 FLIGHT CENTRE TRAVEL GROUP
DIRECTORS’ REPORT CONTINUED
REMUNERATION REPORT - AUDITED (CONTINUED)
RIGHTS HOLDINGS
The number of rights over ordinary FLT shares held during the financial year by FLT’s group KMP, including the number granted, vested, exercised and forfeited is set out below:
OTHER GROUP KMP
BALANCE AT 1 JULY 2018 DURING THE YEAR
BALANCE AT30 JUNE 2019
VALUE OF RIGHTS
GRANTED DURING THE
YEAR
RIGHTSUNVESTED
NUMBERGRANTED NUMBER
VESTED NUMBER
EXERCISED NUMBER
VESTED AND EXERCISABLE
NUMBERUNVESTED
NUMBER $
M. WATERS-RYAN
Grant 1 Base 3,066 - 3,066 - 3,066 - -
Match 3,066 - - - - 3,066 -
Grant 2 Base 3,082 - 3,082 - 3,082 - -
Match 3,082 - - - - 3,082 -
Grant 3 Base 2,306 - 2,306 - 2,306 - -
Match 2,306 - - - - 2,306 -
Grant 4 Base - 1,923 - - - 1,923 104,352
Match - 1,923 - - - 1,923 104,352
C. GALANTY
Grant 1 Base 3,066 - 3,066 - 3,066 - -
Match 3,066 - - - - 3,066 -
Grant 2 Base 3,082 - 3,082 - 3,082 - -
Match 3,082 - - - - 3,082 -
Grant 3 Base 2,306 - 2,306 - 2,306 - -
Match 2,306 - - - - 2,306 -
Grant 4 Base - 1,923 - - - 1,923 104,352
Match - 1,923 - - - 1,923 104,352
D.W. SMITH
Grant 1 Base 3,066 - 3,066 (3,066) - - -
Match 3,066 - - - - 3,066 -
Grant 2 Base 3,082 - 3,082 (3,082) - - -
Match 3,082 - - - - 3,082 -
Grant 3 Base 2,306 - 2,306 (2,306) - - -
Match 2,306 - - - - 2,306 -
Grant 4 Base - 1,923 - - - 1,923 104,352
Match - 1,923 - - - 1,923 104,352
A. CAMPBELL
Grant 1 Base 2,453 - 2,453 - 2,453 - -
Match 2,453 - - - - 2,453 -
Grant 2 Base 3,534 - 3,534 - 3,534 - -
Match 3,534 - - - - 3,534 -
Grant 3 Base 2,941 - 2,941 - 2,941 - -
Match 2,941 - - - - 2,941 -
Grant 4 Base - 4,637 - - - 4,637 251,605
Match - 4,637 - - - 4,637 251,605
No rights were forfeited during the period (prior year: nil). The relevant portion of the expense relating to these rights was recognised during the year ended 30 June 2019. Refer to note D3.

ANNUAL REPORT 2019 FLIGHT CENTRE TRAVEL GROUP 33
REMUNERATION REPORT - AUDITED (CONTINUED)
ESP
General terms
Under the ESP, eligible employees are granted a conditional right to one matched share for every two shares purchased (for cash consideration), subject to vesting conditions.
To receive his or her matched shares, a participant must hold the acquired shares for a period of two years and one month and still be employed with FLT at the end of that time. If acquired shares are sold before the end of the vesting period, conditional rights to the matched shares are forfeited.
The matched shares may be newly issued by FLT, purchased on-market or allocated from treasury shares.
SHAREHOLDINGS
The number of ordinary shares held during the financial year by FLT’s directors and KMP is set out below:
2019 FLT DIRECTORS
BALANCE AT THE START
OF THE YEAR
RECEIVED ON THE EXERCISE
OF RIGHTS
ESP PURCHASED
SHARES1ESP MATCHED
SHARES VESTED1OTHER
CHANGES
BALANCE AT THE END OF
THE YEAR
G.W. Smith 15,000 - - - - 15,000
J.A. Eales 3,000 - - - - 3,000
R.A. Baker 2,500 - - - 1,000 3,500
C.M. Garnsey 3,000 - - - - 3,000
G.F. Turner 15,242,950 - - - 2,062 15,245,012
OTHER GROUP KMP
M. Waters-Ryan 50,725 - - - - 50,725
A. Campbell1 1,634 - 214 132 - 1,980
C. Galanty 2,002 - - - - 2,002
D.W. Smith1 2,694 8,454 297 170 - 11,615
1 A. Campbell and D.W. Smith participated in the ESP and were issued with ordinary shares under the same terms and conditions as all other ESP participants. At period end A. Campbell held 151 and D.W. Smith held 204 conditional matched rights that had been granted under the ESP but had not yet vested.
5 LOANS TO KEY MANAGEMENT PERSONNELA loan has been provided to C. Galanty, a KMP, at UK commercial interest rate of 1.2%. The loan period was amended during the year. As a result a portion is classified as a current loan (refer note C3) as it is repayable within 12 months of year end and the remainder classified as non-current loan (refer note C3) as it is repayable within two years of year end.
LOAN TO KMP NOTES2019
$
Beginning of the year 462,865
Loans repaid (106,724)
Interest charged 4,127
Foreign currency translation 1,378
End-of-year C3 361,646
No provision for doubtful debts has been raised in relation to the outstanding balances.
34 ANNUAL REPORT 2019 FLIGHT CENTRE TRAVEL GROUP
DIRECTORS’ REPORT CONTINUED
INDEMNIFICATION AND INSURANCE OF OFFICERSAn Officers’ Deed of Indemnity, Access and Insurance is in place for directors, KMP, the company secretary and some other executives. Liabilities covered include legal costs that may be incurred in defending civil or criminal proceedings that may be brought against the officers in their capacity as officers of the company or its controlled entities. Disclosure of premiums paid is prohibited under the insurance contract. No payment has been made to indemnify a director, KMP, the company secretary or other executives during or since the financial year.
INDEMNIFICATION OF AUDITORTo the extent permitted by law, FLT has agreed to indemnify its auditor, Ernst & Young, as part of the terms of its audit engagement agreement against claims by third parties arising from the audit (for an unspecified amount). No payment has been made to indemnify Ernst & Young during or since the financial year.
PROCEEDINGS ON BEHALF OF THE COMPANYNo proceedings have been brought or intervened in on behalf of the company with leave of the Court under section 237 of the Corporations Act 2001.
NON-AUDIT SERVICESThe company may decide to employ the auditor on assignments additional to its statutory audit duties where the auditor’s expertise and experience with the company and/or the group are important.
Details of the amounts paid or payable to the auditor (Ernst & Young) for audit and non-audit services provided to the consolidated group during the year are set out in note F11.
The board has considered the position and, in accordance with the advice received from the audit and risk committee, is satisfied that the provision of non-audit services is compatible with the general standard of independence for auditors imposed by the Corporations Act 2001. The directors are satisfied that the auditor’s provision of non-audit services did not compromise the Act’s independence requirements because none of the services undermine the general principles relating to auditor independence as set out in APES110 Code of Ethics for Professional Accountants.
The audit and risk committee reviewed all non-audit services to ensure they did not impact the auditor’s impartiality and objectivity.
AUDITOR’S INDEPENDENCE DECLARATIONA copy of the auditor’s independence declaration, as required under section 307C of the Corporations Act 2001, is set out on page 35.
ROUNDING OF AMOUNTS The company is of a kind referred to in Instrument 2016/191, issued by the Australian Securities and Investments Commission, relating to the rounding off of amounts in the directors’ report. Amounts in the directors’ report have been rounded off in accordance with that Instrument to the nearest thousand dollars or, in certain cases, to the nearest dollar.
This report is made in accordance with a directors’ resolution.
G.F. Turner Director BRISBANE

ANNUAL REPORT 2019 FLIGHT CENTRE TRAVEL GROUP 35
AUDITOR’S INDEPENDENCE DECLARATION
A member firm of Ernst & Young Global Limited Liability limited by a scheme approved under Professional Standards Legislation
Ernst & Young 111 Eagle Street Brisbane QLD 4000 Australia GPO Box 7878 Brisbane QLD 4001
Tel: +61 7 3011 3333 Fax: +61 7 3011 3100 ey.com/au
Auditor’s Independence Declaration to the Directors of Flight Centre Travel Group Limited As lead auditor for the audit of the financial report of Flight Centre Travel Group Limited for the financial year ended 30 June 2019, I declare to the best of my knowledge and belief, there have been:
a) no contraventions of the auditor independence requirements of the Corporations Act 2001 in relation to the audit; and
b) no contraventions of any applicable code of professional conduct in relation to the audit. This declaration is in respect of Flight Centre Travel Group Limited and the entities it controlled during the financial year.
Ernst & Young
Ric Roach Partner 22 August 2019
A member firm of Ernst & Young Global Limited Liability limited by a scheme approved under Professional Standards Legislation

NOTES TO THE FINANCIAL STATEMENTS
36 ANNUAL REPORT 2019 FLIGHT CENTRE TRAVEL GROUP
NOTES
YEAR ENDED 30 JUNE
2019 $’000
2018 $’000
RESTATED1
REVENUE A2 3,055,268 2,922,985
Fair value gain on change in control A3 20,318 61
Other income A3 34,923 30,431
Share of profit of joint ventures and associates E1 1,147 2,240
Employee benefits F1 (1,591,965) (1,510,897)
Sales and marketing (194,111) (196,744)
Rental expense relating to operating leases F1 (165,616) (167,887)
Tour & hotel operations - cost of sales (157,231) (127,843)
Amortisation and depreciation B7 (82,370) (77,802)
Finance costs A4 (25,592) (25,516)
Impairment charge A5 (29,777) -
Other expenses A4 (521,537) (484,756)
Profit before income tax expense 343,457 364,272
Income tax expense F10 (79,283) (99,490)
Profit after income tax expense 264,174 264,782
Profit attributable to
Company owners 263,825 263,577
Non-controlling interests 349 1,205
264,174 264,782
Earnings per share for profit attributable to the ordinary equity holders of the company:
NOTES CENTSCENTS
RESTATED1
Basic earnings per share F2 261.6 261.1
Diluted earnings per share F2 260.2 259.9
1 Refer to note I(b) for details regarding the restatements for changes in accounting policies on adoption of AASB 15.
The above consolidated statement of profit or loss should be read in conjunction with the accompanying notes.
STATEMENT OF PROFIT OR LOSS
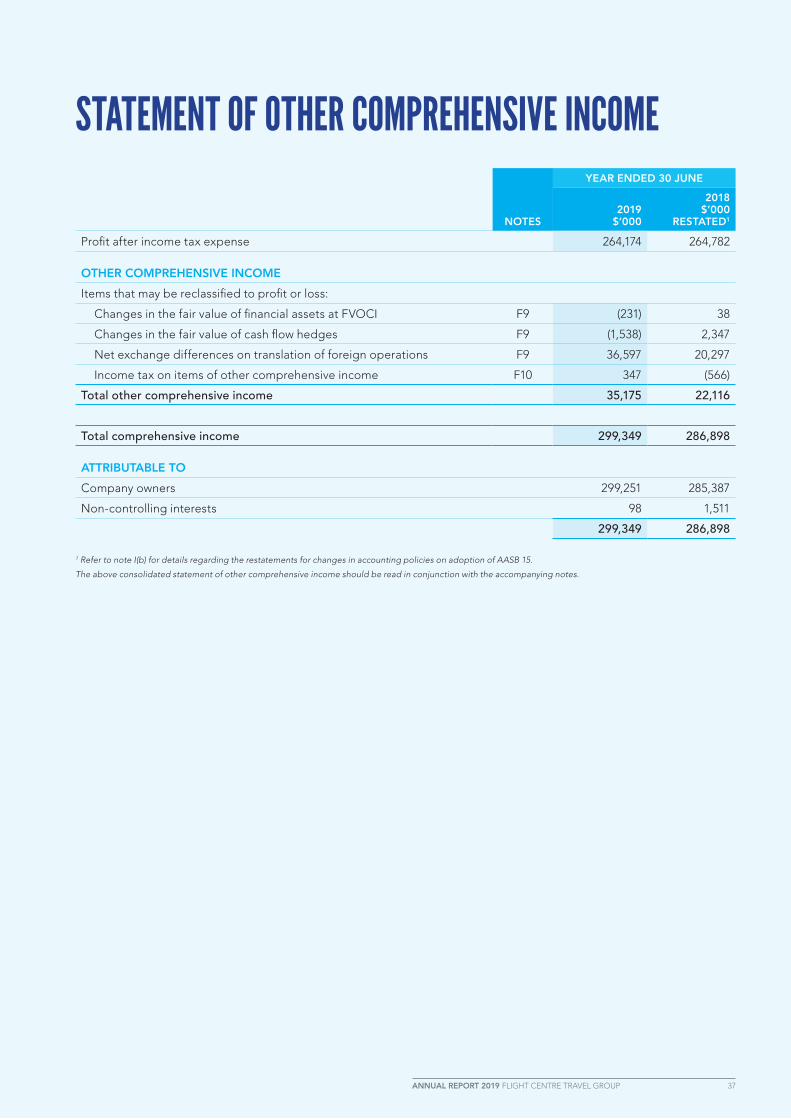
ANNUAL REPORT 2019 FLIGHT CENTRE TRAVEL GROUP 37
NOTES
YEAR ENDED 30 JUNE
2019 $’000
2018 $’000
RESTATED1
Profit after income tax expense 264,174 264,782
OTHER COMPREHENSIVE INCOME
Items that may be reclassified to profit or loss:
Changes in the fair value of financial assets at FVOCI F9 (231) 38
Changes in the fair value of cash flow hedges F9 (1,538) 2,347
Net exchange differences on translation of foreign operations F9 36,597 20,297
Income tax on items of other comprehensive income F10 347 (566)
Total other comprehensive income 35,175 22,116
Total comprehensive income 299,349 286,898
ATTRIBUTABLE TO
Company owners 299,251 285,387
Non-controlling interests 98 1,511
299,349 286,898
1 Refer to note I(b) for details regarding the restatements for changes in accounting policies on adoption of AASB 15.
The above consolidated statement of other comprehensive income should be read in conjunction with the accompanying notes.
STATEMENT OF OTHER COMPREHENSIVE INCOME

NOTES TO THE FINANCIAL STATEMENTS
38 ANNUAL REPORT 2019 FLIGHT CENTRE TRAVEL GROUP
CASH FLOWS FROM OPERATING ACTIVITIES NOTES
YEAR ENDED 30 JUNE
2019 $’000
2018 $’000
Receipts from customers1 3,127,961 2,884,573
Payments to suppliers and employees1 (2,757,114) (2,480,898)
Royalties received 412 694
Interest received 23,739 21,210
Interest paid (25,439) (25,832)
Income taxes paid (90,676) (85,410)
Net cash inflow from operating activities B1 278,883 314,337
CASH FLOWS FROM INVESTING ACTIVITIES
Acquisition of subsidiaries, net of cash acquired A6 (115,163) (60,019)
Acquisition of non-controlling interests in subsidiaries F9 (29,774) -
Acquisition of joint ventures and associates E1 (56,203) (1,094)
Payments of contingent consideration A7 (9,883) -
Payments for property, plant and equipment F5 (53,352) (50,957)
Payments for intangibles A5 (47,630) (36,326)
Payments for the purchase of financial asset investments B2 (19,743) (1,124)
Proceeds from sale of financial asset investments B2 112,571 -
Dividends received from joint ventures and associates 568 533
Loans repaid by related parties E2 107 3,017
Loans advanced to related parties E2 - (474)
Loans repaid by external parties C3 200 -
Net cash (outflow) from investing activities (218,302) (146,444)
CASH FLOWS FROM FINANCING ACTIVITIES
Proceeds from borrowings B4 197,541 210,645
Repayment of borrowings B4 (48,855) (232,876)
Payments for purchase of shares on market D4 (2,139) -
Proceeds from issue of shares D4 1,428 1,153
Payments for purchase of treasury shares D4 (7,698) (13,449)
Proceeds from allocation of treasury shares D4 4,442 3,994
Dividends paid to non-controlling interests (346) (35)
Dividends paid to company owners B6 (319,441) (155,629)
Net cash (outflow) from financing activities (175,068) (186,197)
Net (decrease) in cash held (114,487) (18,304)
Cash and cash equivalents at the beginning of the financial year 1,272,992 1,281,648
Effects of exchange rate changes on cash and cash equivalents 13,747 9,648
Cash and cash equivalents at end of the financial year B1 1,172,252 1,272,992
1 Including consumption tax
The above consolidated statement of cash flows should be read in conjunction with the accompanying notes.
STATEMENT OF CASH FLOWS

NOTES TO THE FINANCIAL STATEMENTS CONTINUED
ANNUAL REPORT 2019 FLIGHT CENTRE TRAVEL GROUP 39
ASSETS Current assets NOTES
YEAR ENDED 30 JUNE
2019 $’000
2018 $’000
RESTATED1
Cash and cash equivalents B1 1,172,252 1,272,992Financial asset investments B2 115,447 204,148Trade receivables F3 559,420 525,047Contract assets F4 356,124 322,689Other assets F3 69,680 72,897Other financial assets C3 13,243 25,121Current tax receivables 12,452 8,479Inventories 1,635 1,625Derivative financial instruments C2 7,494 12,570Total current assets 2,307,747 2,445,568Non-current assets
Property, plant and equipment F5 239,868 247,554Intangible assets A5 768,635 586,335Other assets 11,543 3,753Other financial assets C3 8,022 7,227Investments in joint ventures and associates E1 85,549 38,970Deferred tax assets F10 72,050 69,592Total non-current assets 1,185,667 953,431Total assets 3,493,414 3,398,999
LIABILITIES Current liabilities
Trade and other payables F6 1,517,845 1,505,573Deferred revenue F7 68,660 74,748Contingent consideration A7 15,400 10,627Borrowings B4 84,710 34,846Provisions F8 54,894 48,663Current tax liabilities 10,769 20,369Derivative financial instruments C2 2,797 3,995Total current liabilities 1,755,075 1,698,821Non-current liabilities
Trade and other payables F6 59,530 60,427Deferred revenue F7 48,469 55,721Contingent consideration A7 3,181 15,825Borrowings B4 100,375 652Provisions F8 48,098 40,921Deferred tax liabilities F10 16,368 12,077Total non-current liabilities 276,021 185,623Total liabilities 2,031,096 1,884,444Net assets 1,462,318 1,514,555
EQUITYContributed equity D4 405,626 404,023Treasury shares D4 (11,993) (10,934)Reserves F9 15,397 8,124Retained profits 1,053,010 1,108,626Equity attributable to the Company owners 1,462,040 1,509,839Non-controlling interests 278 4,716Total equity 1,462,318 1,514,555
1 Refer to note I(b) for details regarding the restatements for changes in accounting policies on adoption of AASB 15.
The above consolidated balance sheet should be read in conjunction with the accompanying notes.
BALANCE SHEET

40 ANNUAL REPORT 2019 FLIGHT CENTRE TRAVEL GROUP
NO
TES
FOR
TH
E Y
EA
R E
ND
ED
30
JUN
E
CO
NTR
IBU
TED
E
QU
ITY
$’
00
0
TRE
ASU
RY
SH
AR
ES
$’0
00
RE
SER
VE
S $’
00
0
RE
TAIN
ED
P
RO
FIT
S $’
00
0TO
TAL
$’0
00
NO
N-
CO
NTR
OLL
ING
IN
TER
ES
T $’
00
0
TOTA
L E
QU
ITY
$’
00
0
Bal
ance
at
1 Ju
ly 2
017
402,
759
(1,8
01)
(19,
584)
1,01
5,03
31,
396,
407
-1,
396,
407
Acc
oun
ting
po
licy
chan
ge1
I-
--
(14,
355)
(14,
355)
(65)
(14,
420)
Res
tate
d b
alan
ce a
s at
1 J
uly
2017
402,
759
(1,8
01)
(19,
584)
1,00
0,67
81,
382,
052
(65)
1,38
1,98
7
Pro
fit fo
r th
e ye
ar a
s o
rigin
ally
pre
sent
ed-
--
262,
930
262,
930
1,28
326
4,21
3
Acc
oun
ting
po
licy
chan
ge1
I-
--
647
647
(78)
569
Pro
fit fo
r th
e ye
ar r
esta
ted
1-
--
263,
577
263,
577
1,20
526
4,78
2
Oth
er c
om
pre
hens
ive
inco
me
--
21,8
10-
21,8
1030
622
,116
Tota
l co
mp
rehe
nsiv
e in
com
e fo
r th
e ye
ar-
-21
,810
263,
577
285,
387
1,51
128
6,89
8
Tran
sact
ion
s w
ith
ow
ners
in t
heir
cap
acit
y as
ow
ners
:
Acq
uisi
tion
rese
rve
F9-
-(4
,749
)-
(4,7
49)
-(4
,749
)
No
n-co
ntro
lling
inte
rest
rec
og
nise
d o
n ch
ang
e in
co
ntro
lA
6-
--
--
3,30
53,
305
Em
plo
yee
shar
e-b
ased
pay
men
tsD
4/F9
1,26
4-
10,6
37-
11,9
01-
11,9
01
Trea
sury
sha
res
D4/
F9-
(9,1
33)
10-
(9,1
23)
-(9
,123
)
Div
iden
ds
pro
vid
ed fo
r o
r p
aid
B6
--
-(1
55,6
29)
(155
,629
)(3
5)(1
55,6
64)
Res
tate
d b
alan
ce a
t 30
Jun
e 20
1840
4,02
3(1
0,93
4)8,
124
1,10
8,62
61,
509,
839
4,71
61,
514,
555
Pro
fit fo
r th
e ye
ar-
--
263,
825
263,
825
349
264,
174
Oth
er c
om
pre
hens
ive
inco
me
--
35,4
26-
35,4
26(2
51)
35,1
75
Tota
l co
mp
rehe
nsiv
e in
com
e fo
r th
e ye
ar-
-35
,426
263,
825
299,
251
9829
9,34
9
Tran
sact
ion
s w
ith
ow
ners
in t
heir
cap
acit
y as
ow
ners
:
Acq
uisi
tion
rese
rve
F9-
-(2
5,56
6)-
(25,
566)
(4,1
90)
(29,
756)
Em
plo
yee
shar
e-b
ased
pay
men
tsD
4/F9
1,60
3-
18-
1,62
1-
1,62
1
Trea
sury
sha
res
D4/
F9-
(1,0
59)
(2,6
05)
-(3
,664
)-
(3,6
64)
Div
iden
ds
pro
vid
ed fo
r o
r p
aid
B6
--
-(3
19,4
41)
(319
,441
)(3
46)
(319
,787
)
Bal
ance
at
30 J
une
2019
405,
626
(11,
993)
15,3
971,
053,
010
1,46
2,04
027
81,
462,
318
1 Ref
er to
no
te I(
b) f
or d
etai
ls re
gar
din
g t
he re
stat
emen
ts fo
r cha
nges
in a
cco
untin
g p
olic
ies
on
ado
ptio
n o
f AA
SB 1
5.
The
abo
ve c
ons
olid
ated
sta
tem
ent o
f cha
nges
in e
qui
ty s
houl
d b
e re
ad in
co
njun
ctio
n w
ith t
he a
cco
mp
anyi
ng n
ote
s.
STATEMENT OF CHANGES IN EQUITY

ANNUAL REPORT 2019 FLIGHT CENTRE TRAVEL GROUP 41
NOTES TO THE FINANCIAL STATEMENTSSIGNIFICANT MATTERS 42
A FINANCIAL OVERVIEW 44
A1 Segment information 44
A2 Revenue 48
A3 Other income 50
A4 Expenses 50
A5 Intangible assets 51
A6 Business combinations 54
A7 Contingent consideration 57
B CASH MANAGEMENT 59
B1 Cash and cash equivalents 59
B2 Financial asset investments 60
B3 Cash and financial asset investments – financial risk management 61
B4 Borrowings 62
B5 Ratios 64
B6 Dividends 65
B7 Capital expenditure 66
C FINANCIAL RISK MANAGEMENT 67
C1 Financial risk management 67
C2 Derivative financial instruments 70
C3 Other financial assets 74
D REWARD AND RECOGNITION 75
D1 Key management personnel 75
D2 Business ownership scheme (BOS) 76
D3 Share-based payments 77
D4 Contributed equity and treasury shares 81
E RELATED PARTIES 82
E1 Investments accounted for using the equity method 82
E2 Related party transactions 84
F OTHER INFORMATION 86
F1 Other expenses 86
F2 Earnings per share 87
F3 Trade receivables and other assets 88
F4 Contract assets 89
F5 Property, plant and equipment 91
F6 Trade and other payables 92
F7 Deferred revenue 93
F8 Provisions 93
F9 Reserves 94
F10 Tax 97
F11 Auditor's remuneration 99
F12 Seasonality 99
G GROUP STRUCTURE 100
G1 Subsidiaries 100
G2 Deed of cross guarantee 100
G3 Parent entity financial information 103
H UNRECOGNISED ITEMS 105
H1 Commitments 105
H2 Contingencies 105
H3 Events occurring after the end of the reporting period 105
I SUMMARY OF ACCOUNTING POLICIES 106
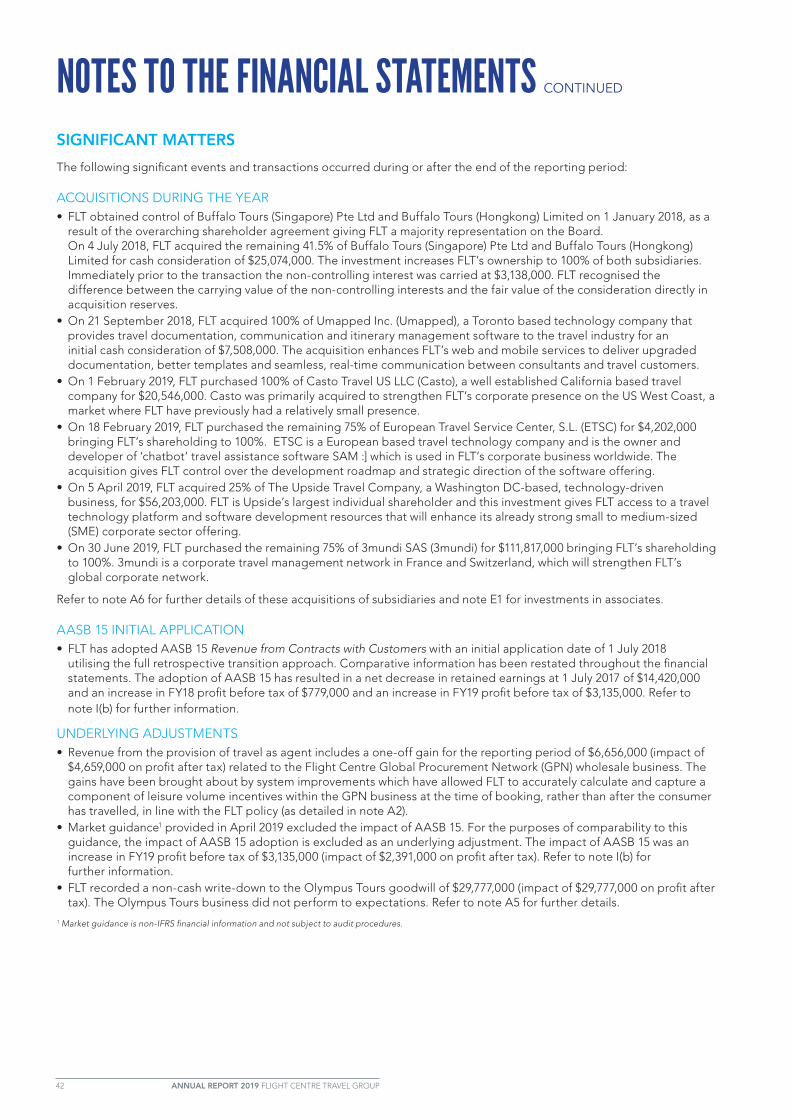
42 ANNUAL REPORT 2019 FLIGHT CENTRE TRAVEL GROUP
NOTES TO THE FINANCIAL STATEMENTS CONTINUED
SIGNIFICANT MATTERS
The following significant events and transactions occurred during or after the end of the reporting period:
ACQUISITIONS DURING THE YEAR • FLT obtained control of Buffalo Tours (Singapore) Pte Ltd and Buffalo Tours (Hongkong) Limited on 1 January 2018, as a
result of the overarching shareholder agreement giving FLT a majority representation on the Board. On 4 July 2018, FLT acquired the remaining 41.5% of Buffalo Tours (Singapore) Pte Ltd and Buffalo Tours (Hongkong) Limited for cash consideration of $25,074,000. The investment increases FLT’s ownership to 100% of both subsidiaries. Immediately prior to the transaction the non-controlling interest was carried at $3,138,000. FLT recognised the difference between the carrying value of the non-controlling interests and the fair value of the consideration directly in acquisition reserves.
• On 21 September 2018, FLT acquired 100% of Umapped Inc. (Umapped), a Toronto based technology company that provides travel documentation, communication and itinerary management software to the travel industry for an initial cash consideration of $7,508,000. The acquisition enhances FLT’s web and mobile services to deliver upgraded documentation, better templates and seamless, real-time communication between consultants and travel customers.
• On 1 February 2019, FLT purchased 100% of Casto Travel US LLC (Casto), a well established California based travel company for $20,546,000. Casto was primarily acquired to strengthen FLT’s corporate presence on the US West Coast, a market where FLT have previously had a relatively small presence.
• On 18 February 2019, FLT purchased the remaining 75% of European Travel Service Center, S.L. (ETSC) for $4,202,000 bringing FLT’s shareholding to 100%. ETSC is a European based travel technology company and is the owner and developer of ‘chatbot’ travel assistance software SAM :] which is used in FLT’s corporate business worldwide. The acquisition gives FLT control over the development roadmap and strategic direction of the software offering.
• On 5 April 2019, FLT acquired 25% of The Upside Travel Company, a Washington DC-based, technology-driven business, for $56,203,000. FLT is Upside’s largest individual shareholder and this investment gives FLT access to a travel technology platform and software development resources that will enhance its already strong small to medium-sized (SME) corporate sector offering.
• On 30 June 2019, FLT purchased the remaining 75% of 3mundi SAS (3mundi) for $111,817,000 bringing FLT’s shareholding to 100%. 3mundi is a corporate travel management network in France and Switzerland, which will strengthen FLT’s global corporate network.
Refer to note A6 for further details of these acquisitions of subsidiaries and note E1 for investments in associates.
AASB 15 INITIAL APPLICATION• FLT has adopted AASB 15 Revenue from Contracts with Customers with an initial application date of 1 July 2018
utilising the full retrospective transition approach. Comparative information has been restated throughout the financial statements. The adoption of AASB 15 has resulted in a net decrease in retained earnings at 1 July 2017 of $14,420,000 and an increase in FY18 profit before tax of $779,000 and an increase in FY19 profit before tax of $3,135,000. Refer to note I(b) for further information.
UNDERLYING ADJUSTMENTS• Revenue from the provision of travel as agent includes a one-off gain for the reporting period of $6,656,000 (impact of
$4,659,000 on profit after tax) related to the Flight Centre Global Procurement Network (GPN) wholesale business. The gains have been brought about by system improvements which have allowed FLT to accurately calculate and capture a component of leisure volume incentives within the GPN business at the time of booking, rather than after the consumer has travelled, in line with the FLT policy (as detailed in note A2).
• Market guidance1 provided in April 2019 excluded the impact of AASB 15. For the purposes of comparability to this guidance, the impact of AASB 15 adoption is excluded as an underlying adjustment. The impact of AASB 15 was an increase in FY19 profit before tax of $3,135,000 (impact of $2,391,000 on profit after tax). Refer to note I(b) for further information.
• FLT recorded a non-cash write-down to the Olympus Tours goodwill of $29,777,000 (impact of $29,777,000 on profit after tax). The Olympus Tours business did not perform to expectations. Refer to note A5 for further details.
1 Market guidance is non-IFRS financial information and not subject to audit procedures.

ANNUAL REPORT 2019 FLIGHT CENTRE TRAVEL GROUP 43
SIGNIFICANT MATTERS (CONTINUED)
OTHER MATTERS• On 20 February 2019, FLT entered into a series of bilateral debt facilities totalling $250,000,000 to provide additional
liquidity to fund acquisitions. The three year revolving credit facilities are guaranteed by certain members of the group and are unsecured. FLT has complied with all financial covenants contained in the facilities. The total amount drawn down at the reporting date was $160,000,000 with $60,000,000 repaid on 4 July 2019. Refer to note B4 for further details.
• On 21 February 2019, the board declared a special dividend of 149 cents per share fully franked payable on 12 April 2019 to shareholders registered on 22 March 2019, which was paid out of existing company general cash. Refer to note B6 for further details.
MATTERS SUBSEQUENT TO THE END OF THE REPORTING PERIOD• On 1 August 2019, FLT acquired the remaining 25% of Les Voyages Laurier du Vallon (LDV) under the terms of a
rolling put/call option that was agreed when FLT initially invested in the Quebec-based business. This brings FLT’s shareholding to 100%. An initial payment of $6,159,000 has been made, with the final payment subject to finalisation of the LDV financial statements. Refer to note A7 for further details.

44 ANNUAL REPORT 2019 FLIGHT CENTRE TRAVEL GROUP
NOTES TO THE FINANCIAL STATEMENTS CONTINUED
A FINANCIAL OVERVIEWThis section provides information that is most relevant to explaining the group’s performance during the year, and where relevant, the accounting policies that have been applied and significant estimates and judgements made.
A1 Segment information
A2 Revenue
A3 Other income
A4 Expenses
A5 Intangible assets
A6 Business combinations
A7 Contingent consideration
A1 SEGMENT INFORMATION
(A) IDENTIFICATION AND DESCRIPTION OF SEGMENTSFLT has identified its operating segments based on the internal reports that are reviewed and used by the board and global task force (chief operating decision makers – “CODM”) in assessing performance and in determining resource allocation. The company’s global task force currently consists of the following members:
• Managing director• Chief financial officer• Chief operating officer• Executive general manager – Europe, Middle East and Africa (EMEA); and• Executive general manager – the Americas.
FLT and its controlled entities operate predominantly in the sale of travel and travel-related services. The board and task force consider, organise and manage the business from a geographic perspective (with the exception of Other Segment as noted below), being the country of origin where the service was provided. Discrete financial information about each of these operating businesses is reported monthly to the board and executive team, via a group financial report.
AGGREGATION OF OPERATING BUSINESSES
Where geographic operating businesses are managed by the same member of the global task force, are reported together to the board and executive team, have similar business models, types of customers, distribution methods and regulatory environments, they have been aggregated into the one reportable segment.
AUSTRALIA AND NEW ZEALAND
Australia and New Zealand segment is managed by the group Managing director.
EUROPE, MIDDLE EAST AND AFRICA
EMEA segment includes businesses in the United Kingdom, France, Germany, Ireland, Netherlands, Nordics, Switzerland, United Arab Emirates (UAE) and South Africa. These are managed by one EGM.
THE AMERICAS
The Americas segment includes businesses in the United States, Canada and Mexico, as well as the Student Universe (SU) business, which is centrally managed by the United States business. These are managed by one EGM.
ASIA
Asia segment includes businesses in China, Singapore, Philippines, Malaysia and India. These are managed by the Chief operating officer.
OTHER SEGMENT
Other segment includes the Travel Experience Network and other Brisbane-based support businesses that support the global network. It also includes individual businesses, not part of a larger group, that report directly to head office.
The group consolidation adjustments are also included in this segment.

ANNUAL REPORT 2019 FLIGHT CENTRE TRAVEL GROUP 45
A1 SEGMENT INFORMATION (CONTINUED)
(B) MAJOR CUSTOMERSFLT provides services to and derives revenue from a number of customers. The company does not derive more than 10% of total consolidated revenue from any one customer.
(C) UNDERSTANDING THE SEGMENT RESULT
SEGMENT REVENUE
The measurement of segment revenue has changed in the reporting period due to the application of AASB 15 Revenue from Contracts with Customers. Refer to note A2 for details of revenue policies and note I(b) for further details on transition adjustments.
Sales between segments are carried out at arm’s length and are eliminated on consolidation.
ALTERNATIVE PROFIT MEASURES
In addition to using profit as a measure of the group and its segments’ financial performance, FLT uses statutory EBIT and statutory EBITDA. These measures are not defined under IFRS and are, therefore, termed “non-IFRS” measures.
Statutory EBIT is defined as group earnings before net interest and tax, while statutory EBITDA is earnings before net interest, tax, depreciation and amortisation. These non-IFRS measures are commonly used by management, investors and financial analysts to evaluate companies’ performance.
The segment result is adjusted EBIT. FLT’s chief operating decision makers use this adjusted EBIT measure to assess the group’s performance. The adjustments take into account various operational items that are integral to the business’s performance, including interest paid on the BOS unsecured note program and finance leases and interest received on cash generated by FLT’s wholesale businesses. Further adjustments may also occur to reflect specific items that are not trading related.
A reconciliation of these non-IFRS measures and specific items to the nearest measure prepared in accordance with IFRS is included in the tables on the following pages.
SEGMENT ASSETS AND LIABILITIES
The amounts provided to the board and task force in respect of total assets and total liabilities are measured in a manner consistent with that of the financial statements. These reports do not allocate total assets or total liabilities based on the operations of each segment or by geographical location.
FLT has not disclosed non-current assets by geographical location as this information is not provided to or reviewed by the chief operating decision makers nor produced for other reasons and, as such, the cost of developing and providing this information exceeds the attributable benefits.
TOTAL TRANSACTION VALUE (TTV)
TTV is un-audited, non-IFRS financial information and does not represent revenue in accordance with Australian Accounting Standards. TTV represents the price at which travel products and services have been sold across the group’s various operations, both as agent for various airlines and other service providers and as principal, plus revenue from other sources. FLT’s revenue is, therefore, derived from TTV.
(D) SEGMENT INFORMATION PRESENTED TO THE BOARD OF DIRECTORS AND GLOBAL TASK FORCEThe segment information provided to the board and task force for the reportable segments for the years ended 30 June 2019 and 30 June 2018 is shown in the tables on the following pages.

46 ANNUAL REPORT 2019 FLIGHT CENTRE TRAVEL GROUP
NOTES TO THE FINANCIAL STATEMENTS CONTINUED
A1 SEGMENT INFORMATION (CONTINUED)
30 JUNE 2019
AUSTRALIA & NZ $’000
AMERICAS2 $’000
EMEA2 $’000
ASIA $’000
OTHER SEGMENT2
$’000TOTAL $’000
Segment information
TTV 1 12,506,125 5,537,226 3,411,781 1,945,981 326,676 23,727,789
Agency revenue from the provision of travel
1,442,671 620,238 426,937 92,730 36,077 2,618,653
Principal revenue from the provision of travel
105,984 25,472 8,126 274 4,105 143,961
Revenue from tour & hotel operations - - - - 246,515 246,515
Revenue from other businesses 19,740 4,183 5,456 5,769 10,991 46,139
Total revenue from contracts with customers
1,568,395 649,893 440,519 98,773 297,688 3,055,268
Statutory EBITDA 241,566 113,874 115,669 16,939 (60,765) 427,283
Depreciation and amortisation (44,317) (15,267) (13,935) (2,627) (6,224) (82,370)
Statutory EBIT 197,249 98,607 101,734 14,312 (66,989) 344,913
Interest income 6,275 8,500 11,617 946 (3,202) 24,136
BOS interest expense (19,051) (2,765) (3,254) - 2,733 (22,337)
Other interest expense (3,958) (1,853) (2,559) (3,650) 8,765 (3,255)
Net profit before tax and royalty 180,515 102,489 107,538 11,608 (58,693) 343,457
Royalty 16,454 (3,240) (13,049) (165) - -
Net profit before tax and after royalty 196,969 99,249 94,489 11,443 (58,693) 343,457
Reconciliation of Statutory EBIT to Adjusted EBIT
Statutory EBIT 197,249 98,607 101,734 14,312 (66,989) 344,913
Interest income3 1,268 58 720 - 12,437 14,483
BOS interest expense (19,051) (2,765) (3,254) - 2,733 (22,337)
Net FX (gains) / losses on intercompany loans
- - (1) - (3,433) (3,434)
GPN revenue alignment - - - - (6,656) (6,656)
Olympus Tours impairment - - - - 29,777 29,777
Fair value gain on ETSC - - (718) - - (718)
Fair value gain on 3mundi - - (19,600) - - (19,600)
Impact of AASB 15 adjustments4 (1,854) - - - (1,281) (3,135)
Other non-material items (1,568) 2,723 28 (870) (7,227) (6,914)
Adjusted EBIT / Segment Result 176,044 98,623 78,909 13,442 (40,639) 326,379
1 TTV is an un-audited, non-IFRS measure.2 The results of the new acquisitions and investments made during the period are shown in the following segments: Umapped and Upside in the Other segment and Casto in the Americas segment. Upon change in control from associate to subsidiary ETSC is now shown in the Other segment and 3mundi continues to be shown in the EMEA segment. 3 Land wholesale interest only.4 Refer to note I(b) for details regarding the restatements for changes in accounting policies on adoption of AASB 15.

ANNUAL REPORT 2019 FLIGHT CENTRE TRAVEL GROUP 47
A1 SEGMENT INFORMATION (CONTINUED)
30 JUNE 2018 - RESTATED1
AUSTRALIA & NZ2 $’000
AMERICAS2 $’000
EMEA2 $’000
ASIA $’000
OTHER SEGMENT2
$’000TOTAL $’000
Segment information
TTV3 12,319,217 4,755,164 3,096,643 1,386,166 260,769 21,817,959
Agency revenue from the provision of travel
1,483,663 539,248 409,381 87,019 31,755 2,551,066
Principal revenue from the provision of travel
107,357 21,532 5,297 193 3,924 138,303
Revenue from tour & hotel operations - - - - 190,096 190,096
Revenue from other businesses 16,394 5,431 5,795 7,073 8,827 43,520
Total revenue from contracts with customers
1,607,414 566,211 420,473 94,285 234,602 2,922,985
Statutory EBITDA 308,236 86,136 87,463 10,301 (49,892) 442,244
Depreciation and amortisation (44,114) (14,091) (12,030) (2,908) (4,659) (77,802)
Statutory EBIT 264,122 72,045 75,433 7,393 (54,551) 364,442
Interest income 5,759 3,150 9,835 253 6,349 25,346
BOS interest expense (20,416) (2,613) (2,503) - 2,810 (22,722)
Other interest expense (3,180) (1,423) (2,411) (2,460) 6,680 (2,794)
Net profit before tax and royalty 246,285 71,159 80,354 5,186 (38,712) 364,272
Royalty 20,068 (4,047) (15,044) (977) - -
Net profit before tax and after royalty 266,353 67,112 65,310 4,209 (38,712) 364,272
Reconciliation of Statutory EBIT to Adjusted EBIT
Statutory EBIT 264,122 72,045 75,433 7,393 (54,551) 364,442
Interest income4 1,244 74 1,061 - 11,707 14,086
BOS interest expense (20,416) (2,613) (2,503) - 2,810 (22,722)
Net FX (gains) / losses on intercompany loans
- - 1 - 247 248
ACCC penalty & associated costs - - - - 13,250 13,250
New Zealand Holidays Act remediation 8,004 - - - - 8,004
Impact of AASB 15 adjustments1 (133) - - - (646) (779)
Other non-material items (365) (58) (15) - (2,864) (3,302)
Adjusted EBIT / Segment Result 252,456 69,448 73,977 7,393 (30,047) 373,227
1 Refer to note I(b) for details regarding the restatements for changes in accounting policies on adoption of AASB 15.2 The results of the new acquisitions and investments are shown in the following segments: Travel Partners, ETL and TMG in the Australia & NZ segment, LDV in the Americas segment, ETSC investment in associate in the EMEA segment and BHMA and Olympus in the Other segment. Buffalo Tours continues to be presented in the Other segment. 3 TTV is an un-audited, non-IFRS measure.4 Land wholesale interest only.

48 ANNUAL REPORT 2019 FLIGHT CENTRE TRAVEL GROUP
NOTES TO THE FINANCIAL STATEMENTS CONTINUED
A2 REVENUE
2019 $’000
2018 $’000
RESTATED1
Agency revenue from the provision of travel2 2,618,653 2,551,066
Principal revenue from the provision of travel 143,961 138,303
Revenue from tour & hotel operations 246,515 190,096
Revenue from other businesses 46,139 43,520
Total revenue from contracts with customers 3,055,268 2,922,985
1 Refer to note I(b) for details regarding the restatements for changes in accounting policies on adoption of AASB 15.2 Agency revenue from the provision of travel includes a one-off gain in the current reporting period of $6,656,000 related to the Flight Centre Global Procurement Network (GPN) wholesale business. The gains have been brought about by system improvements which have allowed FLT to accurately calculate and capture a component of leisure volume incentives within the GPN business at the time of booking using the most likely method, rather than after the consumer has travelled, in line with the FLT policy as detailed below.
Additional disaggregation of revenue by geographic region is presented in note A1 Segment Information.
ACCOUNTING POLICY
REVENUE FROM CONTRACTS WITH CUSTOMERS
Agency revenue from the provision of travel
Revenue is generated when FLT, acting as an agent, arrange and book travel and travel related products to be provided by suppliers to retail and corporate consumers. The supplier of the travel products is the principal in the wider travel sales transaction. From FLT's perspective (under AASB 15), the supplier of the travel products is the customer in the agency relationship.
The service is paid for in a variety of ways, including guaranteed base payments, commissions, mark-ups, transaction fees, and other ancillary fees. Rebates are received for using travel consolidator systems known as Global Distribution Systems (GDS) to access and book travel supplier products. In addition, volume incentives are received from suppliers for achieving annual targets.
Guaranteed base payments, commission, mark-ups, transaction fees are paid for and received at the time of booking. Rebates and volume incentive payments received will vary depending on the terms of the contract. Receipt of payment can vary between upfront to post contract completion once availed data is known.
The revenue is recognised over time as the supplier (the customer in the agency relationship under AASB 15) simultaneously receives and consumes the benefit of the travel agency services. The most likely method for revenue recognition is used and practically revenue is recognised when the booking is finalised as this is when the performance obligation is satisfied.
The revenue is variable, however it is not subject to material constraints, except for volume incentives which are recorded by applying the following:
• Year-end differences – judgements and estimation techniques are required to determine revenue from consumers anticipated to travel over the remaining contract year and the associated incentive rate applicable to these forecast levels. A combination of historical data and actual ticketed data from external sources is used to predict the anticipated travel revenue and associated incentive rate.
• Utilisation rates – the likelihood of the consumer cancelling the travel prior to departure.
The travel supplier, as principal, is responsible for refunds to the front end customer, not FLT as agent.
FLT have applied practical expedient AASB 15(121) where revenue to be recognised in future periods, for unsatisfied or partially satisfied performance obligations as at reporting date, is not disclosed as the performance obligation will be completed within 12 months or less.

ANNUAL REPORT 2019 FLIGHT CENTRE TRAVEL GROUP 49
A2 REVENUE (CONTINUED)Supplier incentives and lump-sum revenue
From time-to-time, incentives or lump sum amounts are received from suppliers. The supplier of the travel products is the customer in the agency relationship under AASB 15. The recognition pattern is dependent on the specific terms of each contract. The revenue is only recognised upfront where there has been a distinct service transferred upfront, otherwise it is recognised over the term of the contract in line with the delivery of the performance obligation. The revenue can be either fixed or variable and is constrained where contract terms require the supplier to be refunded in part or full upon termination of the contract.
Associated contract costs may be eligible for capitalisation as fulfilment assets and amortised over the same period.
Lump sum deferred revenue is recognised over the contract terms which typically range between 1 – 10 years.
Principal revenue from the provision of travel
Revenue is generated when FLT, acting as principal, provides other services to the customer such as hotel management through the BHMA brand, events and production management, conferences, marketing campaigns, Travel Money currency sales and franchise programs. In addition, from time-to-time FLT will develop and offer products in its retail and corporate agency business’ for which FLT is principal.
Revenue is recognised when the performance obligation has been satisfied. The revenue may be variable or fixed and is typically recognised over time as the service is provided. The most likely method is used for variable revenue recognition. The revenue is not subject to material constraints.
As principal, FLT are responsible for refunds to the customer.
FLT have applied practical expedient AASB 15(121) where revenue to be recognised in future periods, for unsatisfied or partially satisfied performance obligations as at reporting date, is not disclosed as the performance obligation will be completed within 12 months or less.
Revenue from tour and hotel operations
FLT have a number of touring and ground-handling operations provided through the brands Top Deck, Back-Roads, Buffalo Tours and Olympus Tours. In addition FLT provide hotel operations through Away Camakila.
Revenue is generated from tour and hotel operations when FLT, acting as principal, provide tours, ground-handling services and hotel accommodation and other hotel services (eg restaurant, spa). Revenue is variable and includes the gross amount sold less any cancellations/refunds.
Revenue is recognised over the duration of the tour/accommodation period or when the ground-handling service or hotel service is provided. The costs associated with fulfilling these services such as transport, accommodation costs, wages and food and beverage are expensed over the same duration and disclosed as cost of tour and hotel operations in the statement of profit or loss.
As principal, FLT are responsible for refunds to the customer. An allowance for refunds is recorded based on historical experience.
FLT have applied practical expedient AASB 15(121) where revenue to be recognised in future periods, for unsatisfied or partially satisfied performance obligations as at reporting date, is not disclosed as the performance obligation will be completed within 12 months or less.
Revenue from other businesses
Revenue is generated when FLT, typically acting as principal, provide other services to customers. This includes services provided by the brands Healthwise, Moneywise, and FC Business School. Revenue is recognised when the performance obligation has been satisfied. The revenue may be variable or fixed and is typically recognised over time as the service is provided. The most likely method is used for variable revenue recognition. The revenue is not subject to material constraints.
An allowance for refunds is booked based on historical experience.
FLT have applied practical expedient AASB 15(121) where revenue to be recognised in future periods, for unsatisfied or partially satisfied performance obligations as at reporting date, is not disclosed as the performance obligation will be completed within 12 months or less.

50 ANNUAL REPORT 2019 FLIGHT CENTRE TRAVEL GROUP
NOTES TO THE FINANCIAL STATEMENTS CONTINUED
A3 OTHER INCOME
FAIR VALUE GAIN ON CHANGE IN CONTROL NOTES2019
$’000
2018 $’000
RESTATED1
Fair value gain on ETSC 718 -
Fair value gain on 3mundi 19,600 -
Fair value gain on Buffalo Tours - 61
Total A6 20,318 61
OTHER INCOME
Interest 24,136 25,346
Rent and sub-lease rentals 2,504 2,465
Net foreign exchange gains 4,507 -
Gain on contingent consideration A7 3,776 2,620
Total 34,923 30,431
1 Refer to note I(b) for details regarding the restatements for changes in accounting policies on adoption of AASB 15.
A4 EXPENSESProfit before income tax includes the following expenses:
FINANCE COSTS NOTES2019
$’000
2018 $’000
RESTATED1
BOS interest expense D2 22,337 22,722
Interest and finance charges paid/payable 2,618 2,208
Unwind of make good provision discount F8 637 586
Total finance costs 25,592 25,516
OTHER EXPENSES
Other occupancy costs 71,266 67,338
Consulting fees 84,348 69,929
Independent agent consulting fees2 35,737 22,980
Communication and IT 119,284 97,529
Net foreign exchange losses - 131
New Zealand Holidays Act remediation3 - 8,004
ACCC penalty and associated costs4 - 13,250
Other expenses 210,902 205,595
Total other expenses 521,537 484,756
1 Refer to note I(b) for details regarding the restatements for changes in accounting policies on adoption of AASB 15.2 Due to the growth in the independent agent model, independent agent consulting fees are separately disclosed from other consulting fees. Comparatives have been restated to align disclosure.
3 In the prior period FLT recognised the cost of the New Zealand Holidays Act remediation relating to historic annual leave balances and associated costs of $8,004,000.
4 In the prior period FLT paid the ACCC penalty and associated costs of $13,250,000.

ANNUAL REPORT 2019 FLIGHT CENTRE TRAVEL GROUP 51
A5 INTANGIBLE ASSETS
OVERVIEWFLT continues to focus on enhancing productivity, reducing costs and making it easier for customers to interact and transact with its brands and people across all channels. Growing digital capabilities has also been a priority. These strategies are reflected in the growth in intangibles through both additions and acquisitions.
Opening balance at 1 July 2017GOODWILL
$’000
BRAND NAMES, LICENCES
AND CUSTOMER RELATIONSHIPS1
$’000SOFTWARE2
$’000TOTAL $’000
Cost4 411,359 88,006 149,345 648,710
Accumulated amortisation (including accumulated impairment losses)
(71,899) (73,184) (64,481) (209,564)
Net book amount at 1 July 2017 339,460 14,822 84,864 439,146
Additions - - 36,326 36,326
Acquisitions 106,022 4,142 142 110,306
Other 1,651 - - 1,651
Disposals3 - - (2,958) (2,958)
Exchange differences4 12,429 423 2,592 15,444
Amortisation - (172) (13,408) (13,580)
Net book amount at 30 June 2018 459,562 19,215 107,558 586,335
Opening balance at 1 July 2018
Cost 534,427 94,457 182,366 811,250
Accumulated amortisation (including accumulated impairment losses)
(74,865) (75,242) (74,808) (224,915)
Net book amount at 1 July 2018 459,562 19,215 107,558 586,335
Additions - 17 47,613 47,630
Acquisitions 148,609 - 13,334 161,943
Other 832 - - 832
Impairment (29,777) - - (29,777)
Disposals3 - - (75) (75)
Exchange differences4 19,413 660 975 21,048
Amortisation - (1,089) (18,212) (19,301)
Net book amount at 30 June 2019 598,639 18,803 151,193 768,635
At 30 June 2019
Cost 707,426 96,861 244,819 1,049,106
Accumulated amortisation (including accumulated impairment losses)
(108,787) (78,058) (93,626) (280,471)
Net book amount at 30 June 2019 598,639 18,803 151,193 768,635
1 Definite life brand names are amortised over their expected useful life, not exceeding 15 years. Customer relationships are amortised over their expected useful life, not exceeding seven years. 2 Relates predominately to software which is amortised using the straight-line method over the project’s period of expected future benefits, which varies from 2.5 to 5 years, with some core software products amortised over 10 to 15 years. 3 Balances shown net of accumulated amortisation.4 Goodwill related to foreign subsidiaries is recognised in the functional currency of the subsidiaries. Exchange differences arising on the translation of the Goodwill of subsidiaries with functional currencies other than the Australian dollar are recognised directly in the foreign currency translation reserve. Comparative figures have been adjusted to measure them on the same basis as current period figures. The goodwill and foreign currency transaction reserve have been adjusted for 1 July 2017 by $32,348,000 and for 1 July 2018 $26,036,000.

52 ANNUAL REPORT 2019 FLIGHT CENTRE TRAVEL GROUP
NOTES TO THE FINANCIAL STATEMENTS CONTINUED
A5 INTANGIBLE ASSETS (CONTINUED)
IMPAIRMENT TESTS
CRITICAL ACCOUNTING ESTIMATES, ASSUMPTIONS AND JUDGEMENTS – IMPAIRMENT OF GOODWILL AND INDEFINITE LIFE INTANGIBLESThe group tests goodwill and indefinite life intangibles (mainly brand names) annually for impairment, in accordance with the accounting policy stated in note I(g). For all cash-generating units (CGUs) which contain goodwill or indefinite life intangibles and all other CGUs which show an indicator of impairment, the recoverable amounts have been determined based on the higher of fair value less costs of disposal or value-in-use calculations. These calculations use cash flow projections based on management-approved financial budgets and cover a four to five-year period. Refer below for details of these assumptions and the potential impacts of reasonable changes to the assumptions.
Goodwill and indefinite life intangibles are allocated to the CGUs, identified according to relevant business and country of operation.
Each segment includes a number of separately identifiable CGUs. Goodwill and indefinite life intangibles allocated to individually significant CGUs are presented at the net book amount below:
GOODWILLINDEFINITE LIFE
BRAND NAMES & LICENCES
2019 $’000
2018 $’000
RESTATED22019
$’0002018
$’000
Australia Leisure 131,521 122,027 - -
3mundi 118,406 - - -
USA Corporate 49,581 28,365 - -
UK Corporate 45,522 44,706 - -
Global Touring 35,412 34,777 11,145 11,145
Australia FCM 30,446 30,446 - -
Buffalo Tours 28,662 26,997 -
Canada 20,258 18,580 -
Student universe 18,539 17,591 -
Olympus - 28,822 - -
Other1 120,292 107,251 1,329 1,308
Total 598,639 459,562 12,474 12,453
1 Other includes the Indian CGU, and other CGUS which are not individually significant. 2 As outlined in the goodwill note above, comparative figures have been adjusted to measure them on the same basis as current period figures.
FLT owns these brands and licences and intends to continue to use them indefinitely.
CURRENT YEARFLT recorded a non-cash write-down to goodwill of $29,777,000 in Olympus Tours. FLT acquired 100% of the share capital of Olympus Tours on 1 August 2017 for cash consideration of $27,565,000 which on consolidation initially gave rise to $28,822,000 of goodwill. The services provided by Olympus Tours include transfers, excursions and day-trips, arrangements for meetings and incentive groups and land arrangements for cruises and other tour groups in Mexico, Dominican Republic and Costa Rica. Post impairment, there is no remaining goodwill in the business.
Olympus Tours has generally not delivered the profit that FLT initially expected since acquisition. Post-acquisition the business has been negatively impacted by the loss of key customers, a decline in local Mexico sales, a change in local management and most recently a decline in USA tourists into the Dominican Republic. The business has set a range of strategies to move forward which include focusing on growing direct group sales out of FC USA; entering into new markets for customer acquisition such as Europe; offering new products such as accommodation and implementing a new booking platform capable of transacting on a B2B basis.
The recoverable amount of the Olympus Tours CGU was determined by reference to the fair-value less costs to sell. This was based on the present value of the existing business acquired along with a forecast of the long term view of Olympus Tours. This was estimated using a discounted cash flow over 5 years which is classified as a Level 3 input in the fair value hierarchy.

ANNUAL REPORT 2019 FLIGHT CENTRE TRAVEL GROUP 53
A5 INTANGIBLE ASSETS (CONTINUED)The basis of estimation of the cash flows uses the following key operating assumptions:
• Budgeted EBITDA is based on management’s forecasts of revenue growth in each country from the provision of destination management company (DMC)/ground handling services
• Revenue forecasts take into account historical revenue and consider external factors such as market sector and geography and the entry into new markets
• Costs are calculated taking into account historical margins, known increases and estimated inflation rates over the period consistent with the locations in which Olympus Tours operate
In calculating the fair value less costs to sell, country specific post-tax discount rates of between 14.7% and 37.0% were applied to the post-tax cash flows. Management has calculated the discount rates based on available market data including reference to data from comparable listed companies within the travel sector.
The model uses a long-term growth rate of 3% - 4% depending on the country specific long term Central Bank rates.
Management has performed a series of sensitivity analyses and any change in a key assumption would cause the Olympus Tours CGU’s carrying value to exceed its recoverable amount.
PRIOR YEARThere were no indicators of impairment of any CGU’s within FLT. Consistent with other periods, a value-in-use calculation was prepared using the key estimates in (a) below.
There were no impairment charges in the prior year.
(A) KEY ASSUMPTIONS USED FOR VALUE-IN-USE CALCULATIONS
GOODWILL & BRANDNAMES CGU
PRE-TAX DISCOUNT RATE
2019 %
2018 %
Australia, including Leisure & FCM 11.1 13.5
3mundi 10.1 -
United States, including Retail, Corporate & Student Universe 13.3 14.3
UK Corporate 9.5 11.3
Global Touring 15.7 12.1
Buffalo Tours 21.1 -
India 21.3 21.0
Other countries (excluding those listed above) 10.6 13.2
The discount rates shown were applied to CGUs within each of the geographic segments. For the purposes of impairment testing, under the value-in-use model terminal values were not applied to all CGUs as they were not required to support the carrying amount. The exception was Global Touring CGU in the current year and in the prior year, where a rate of 2.0% (2018: 2.0%) was used to extrapolate cash flows beyond the budget period and calculate a terminal value.
These assumptions have been used for the analysis of each CGU within the business segment, in line with local long-term inflation.
The basis of estimation of the four to five-year cash flows uses the following key operating assumptions:
• Four to five-year budgeted EBITDA is based on management’s forecasts of revenue from travel services, taking into account expected TTV/sales growth
• Revenue forecasts take into account historical revenue and consider external factors such as market sector and geography
• Costs are calculated taking into account historical margins, forecast increases and estimated inflation rates over the period, consistent with the locations in which the CGUs operate
Management has calculated the discount rates based on available market data and data from comparable listed companies within the travel sector.

54 ANNUAL REPORT 2019 FLIGHT CENTRE TRAVEL GROUP
NOTES TO THE FINANCIAL STATEMENTS CONTINUED
A5 INTANGIBLE ASSETS (CONTINUED)
(B) IMPACT OF POSSIBLE CHANGES IN KEY ASSUMPTIONS
Management has performed sensitivity analysis and given the increased discount rate to 15.7% (2018: 12.1%), the Global Touring CGU would require a decrease of 30% to forecast EBITDA in each of the five years cash flows in order for the carrying value to equal the recoverable amount.
Other than noted above there are no reasonably possible changes in key assumptions that would cause a CGU's carrying value to exceed its recoverable amount in the current or prior comparative period.
Goodwill is recorded based on the fair value of the business acquired on the acquisition date. Should this value fall, impairment of assets (including goodwill may arise in future periods).
A6 BUSINESS COMBINATIONS
(A) CURRENT YEAR ACQUISITIONS
SUMMARY OF ACQUISITIONS
During the period FLT announced the acquisitions as set out below.
UMAPPED
On 21 September 2018, FLT acquired 100% of Umapped Inc., a Toronto based technology company that provides travel documentation, communication and itinerary management software to the travel industry for an initial cash consideration of $7,508,000.
The acquisition enhances FLT’s web and mobile services to deliver upgraded documentation, better templates and seamless, real-time communication between consultants and travel customers.
The goodwill represents the synergies that the software will bring to FLT such as productivity improvements, conversion improvements and the ability to cross sell other FLT products/offerings.
The accounting for the business combination is final.
Details of the purchase consideration, the net assets acquired and goodwill are set out in the table below.
CASTO
On 1 February 2019, FLT purchased 100% of Casto Travel US LLC (Casto), for $20,546,000 (US$14,911,000). Casto is a leading well established corporate and leisure travel company based in San Jose, California serving the San Francisco Bay Area since 1974. Casto was primarily acquired to strengthen FLT’s corporate presence on the US West Coast, a market where FLT have previously had a relatively small presence.
The goodwill represents the benefit the presence in the US West Coast provides in terms of broadening the FCM network in the United States and the opportunity FCM can realise in delivering a wholly owned global service offering to the Casto customer base, which Casto was unable to deliver prior to the acquisition.
The initial accounting for the business combination is provisional.
Details of the purchase consideration, the provisional net assets acquired and provisional goodwill are set out in the table below.
ETSC
On 18 February 2019, FLT purchased the remaining 75% of European Travel Service Center, S.L. (ETSC) for $4,202,000 bringing FLT’s shareholding to 100%. ETSC is a European based travel technology company and is the owner and developer of ‘chatbot’ travel assistance software SAM :] which is used in FLT’s corporate business worldwide.
The acquisition gives FLT control over the development roadmap and strategic direction of the software offering.
The accounting for the business combination is final.
Details of the purchase consideration, the net assets acquired and goodwill are set out in the table below.

ANNUAL REPORT 2019 FLIGHT CENTRE TRAVEL GROUP 55
A6 BUSINESS COMBINATIONS (CONTINUED)
3MUNDI
On 30 June 2019, FLT purchased the remaining 75% of 3mundi for $111,817,000 bringing FLT’s shareholding to 100%. 3mundi is a corporate travel management network in France and Switzerland, which will strengthen FLT’s global corporate network.
The initial accounting for the business combination is provisional pending finalisation of the take on balance sheet.
Details of the purchase consideration, the provisional net assets acquired and provisional goodwill are set out in the table below.
Details of the purchase consideration, net assets acquired and goodwill are as follows:
% OWNERSHIP NOTE
UMAPPED $’000 100%
CASTO $’000 100%
ETSC $’000 100%
3MUNDI $’000 100%
TOTAL $’000
Purchase Consideration
Cash consideration 7,508 20,546 4,202 101,050 133,357
Settlement of pre-existing shareholder loans - - - 10,767 10,767
Contingent consideration A7 4,789 - - - 4,789
Total purchase consideration 12,297 20,546 4,202 111,817 148,862
Assets and liabilities acquired at fair value
Cash and cash equivalents 10 1,918 323 15,892 18,143
Trade and other receivables2 101 689 264 27,930 28,984
Prepayments 19 - - 1,498 1,517
Other assets - 137 27 - 164
Property, plant and equipment F5 19 29 54 373 475
Intangible assets A5 7,768 - 1,773 3,793 13,334
Trade and other payables (175) (1,552) (859) (34,906) (37,492)
Borrowings - - (4) - (4)
Loans between related parties immediately prior to acquisition
- - (224) 4,976 4,752
Deferred tax liabilities (2,058) - - - (2,058)
Net identifiable assets and liabilities acquired 5,684 1,221 1,354 19,556 27,815
Equity accounted value of previous interest - - (699) (6,545) (7,244)
Fair value (gain) on change in control A3 - - (718) (19,600) (20,318)
Fair value of previous interest held - - (1,417) (26,145) (27,562)
Goodwill arising on acquisition1 A5 6,613 19,325 4,265 118,406 148,609
12,297 20,546 4,202 111,817 148,862
1 Goodwill arising on the Casto and 3mundi acquisitions is provisional pending the results of audit and valuation of the acquired intangible assets. Goodwill arising on the 3mundi acquisition is provisional pending the finalisation of the take-on balance sheet.2 The accounts receivable recorded above approximate the fair value at acquisition date due to the short term nature. The entire receivable is expected to be recovered.

56 ANNUAL REPORT 2019 FLIGHT CENTRE TRAVEL GROUP
NOTES TO THE FINANCIAL STATEMENTS CONTINUED
A6 BUSINESS COMBINATIONS (CONTINUED)
UMAPPED $’000
CASTO $’000
ETSC $’000
3MUNDI $’000
TOTAL $’000
Purchase Consideration - cash outflow
Cash consideration 7,508 20,546 4,202 101,050 133,357
Less: balances acquired (10) (1,918) (323) (15,892) (18,143)
Total cash (inflow)/outflow - investing activities 7,498 18,628 3,879 85,158 115,163
FLT has recognised revenue and profit contributions from the date of acquisition to the year-end as follows:
UMAPPED $’000
CASTO $’000
ETSC $’000
3MUNDI $’000
TOTAL $’000
Revenue & profit contribution from the date of acquisition to year-end
Revenue 812 6,046 516 - 7,374
Profit / (Loss) before tax (512) 372 206 - 66
Had the acquisitions occurred on 1 July 2018, revenue and profit contribution for the year would have been:
Revenue & profit contribution for year ended 30 June 2019
Revenue 967 14,480 892 43,613 59,952
Profit / (Loss) before tax (738) 1,275 (158) 13,325 13,704
Umapped and ETSC are reported within the Other Segment, Casto is reported within the Americas segment and 3mundi is reported within the EMEA segment (refer to note A1).
ACQUISITION COSTS
Acquisition-related costs of $1,716,000 have been recognised in the statement of profit or loss (other expenses) and in operating cash flows in the statement of cash flows (payments to suppliers and employees).
(b) Reconciliation to cash flow statement
$'000
Acquisition of subsidiary - net cash outflow 115,163
Total outflow of cash - investing activities 115,163
(b) Prior year acquisitions
The purchase price accounting for Bespoke Hospitality Management Asia Limited (BHMA), Les Voyages Laurier Du Vallon (LDV), Olympus Tours, Travel Managers Group Limited (TMG), Executive Travel Limited (ETL), Travel Partners Holdings Pty Limited (Travel Partners), Buffalo Tours (Singapore) Pte Ltd and Buffalo Tours (Hongkong) Limited have been finalised with no significant changes.

ANNUAL REPORT 2019 FLIGHT CENTRE TRAVEL GROUP 57
A7 CONTINGENT CONSIDERATION
CURRENT
2019 $’000
2018 $’000
Contingent consideration 15,400 10,627
Total current contingent consideration 15,400 10,627
NON-CURRENT
Contingent consideration 3,181 15,825
Total non-current contingent consideration 3,181 15,825
Contingent consideration is recognised in relation to the acquisitions listed below. FLT has determined that it is classified as Level 3 (2018: Level 3) under the AASB 13 Fair value measurement hierarchy as the main valuation inputs outlined below are unobservable.
Any changes in the fair value of these liabilities are recorded through other income, finance costs or other expenses in the statement of profit or loss.
The put option liabilities that exist, outlined for each company below, have been recognised as a financial liability and in the acquisition reserve of the parent entity.
TOP DECK TOURS LIMITED (TDT)
During the year FLT acquired the remaining 10% of TDT for $4,735,000 giving FLT 100% ownership. No contingent consideration remains at year end.
AVMIN PTY LIMITED (AVMIN)
The financial liability related to the put option for AVMIN ($1,368,000) has been recorded as part of non-current contingent consideration. The potential undiscounted amount of this liability has been estimated as the value of future expected cash flows for the settlement of the put option for AVMIN. The expected cash flows are based on a multiple of the probability-adjusted EBITDA of between $745,000 and $924,000 at the expected date of exercise in October 2020.
IGNITE TRAVEL GROUP LIMITED (IGNITE)
The financial liability related to the earn out payment for Ignite ($2,604,000) has been derecognised during the year as both FLT and Ignite are working towards an alternate arrangement which does not include any contingent consideration.
TRAVEL TOUR GROUPS INDIA (TTG)
The financial liability related to the TTG acquisition was settled for $2,861,000 during the period. No contingent consideration remains at year end.
BESPOKE HOSPITALITY MANAGEMENT ASIA LIMITED (BHMA)
Contingent consideration of $2,386,000 to be paid to the shareholders has been recorded as part of current contingent consideration. The potential undiscounted amount payable under the agreement is between $nil and $2,386,000. The calculation is based on a multiple of revenue growth within the Asia and Non-Asia markets between the calendar years ended 31 December 2018 and 2019.
EXECUTIVE TRAVEL LIMITED (EXECUTIVE TRAVEL)
During the year the liability in relation to Executive Travel was settled for $2,287,000. No contingent consideration remains at year end.
LDV LES VOYAGES LAURIER DU VALLON (LDV)
The financial liability related to the put option for LDV ($9,498,000) has been recorded as part of current contingent consideration as the option is exercisable after two years from the acquisition date.
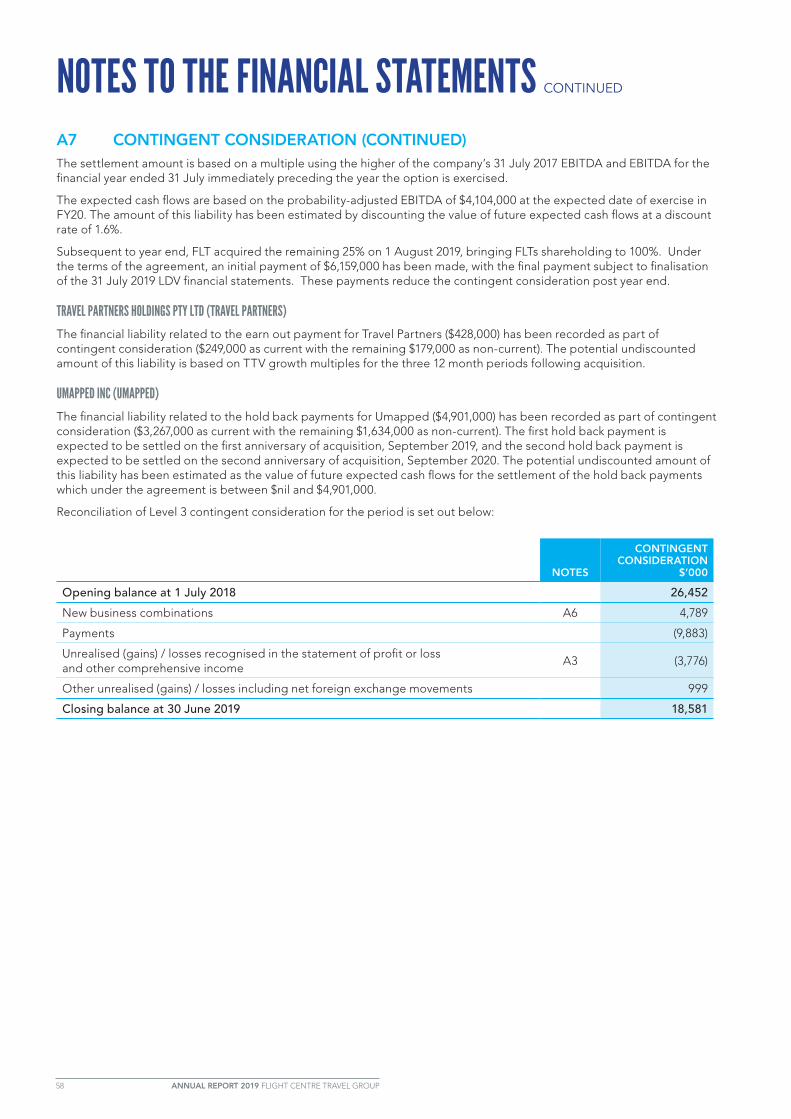
58 ANNUAL REPORT 2019 FLIGHT CENTRE TRAVEL GROUP
NOTES TO THE FINANCIAL STATEMENTS CONTINUED
A7 CONTINGENT CONSIDERATION (CONTINUED)The settlement amount is based on a multiple using the higher of the company’s 31 July 2017 EBITDA and EBITDA for the financial year ended 31 July immediately preceding the year the option is exercised.
The expected cash flows are based on the probability-adjusted EBITDA of $4,104,000 at the expected date of exercise in FY20. The amount of this liability has been estimated by discounting the value of future expected cash flows at a discount rate of 1.6%.
Subsequent to year end, FLT acquired the remaining 25% on 1 August 2019, bringing FLTs shareholding to 100%. Under the terms of the agreement, an initial payment of $6,159,000 has been made, with the final payment subject to finalisation of the 31 July 2019 LDV financial statements. These payments reduce the contingent consideration post year end.
TRAVEL PARTNERS HOLDINGS PTY LTD (TRAVEL PARTNERS)
The financial liability related to the earn out payment for Travel Partners ($428,000) has been recorded as part of contingent consideration ($249,000 as current with the remaining $179,000 as non-current). The potential undiscounted amount of this liability is based on TTV growth multiples for the three 12 month periods following acquisition.
UMAPPED INC (UMAPPED)
The financial liability related to the hold back payments for Umapped ($4,901,000) has been recorded as part of contingent consideration ($3,267,000 as current with the remaining $1,634,000 as non-current). The first hold back payment is expected to be settled on the first anniversary of acquisition, September 2019, and the second hold back payment is expected to be settled on the second anniversary of acquisition, September 2020. The potential undiscounted amount of this liability has been estimated as the value of future expected cash flows for the settlement of the hold back payments which under the agreement is between $nil and $4,901,000.
Reconciliation of Level 3 contingent consideration for the period is set out below:
NOTES
CONTINGENT CONSIDERATION
$’000
Opening balance at 1 July 2018 26,452
New business combinations A6 4,789
Payments (9,883)
Unrealised (gains) / losses recognised in the statement of profit or loss and other comprehensive income
A3 (3,776)
Other unrealised (gains) / losses including net foreign exchange movements 999
Closing balance at 30 June 2019 18,581

ANNUAL REPORT 2019 FLIGHT CENTRE TRAVEL GROUP 59
B CASH MANAGEMENTFLT has a focus on maintaining a strong balance sheet through increasing cash and investments and keeping low levels of debt. The strategy also considers the group’s expenditure, growth and acquisition requirements, and the desire to return dividends to shareholders.
B1 Cash and cash equivalents
B2 Financial asset investments
B3 Cash and financial asset investments - financial risk management
B4 Borrowings
B5 Ratios • Net debt • Gearing ratio
B6 Dividends
B7 Capital expenditure
B1 CASH AND CASH EQUIVALENTS
ACCOUNTING POLICY
Client cash represents amounts from customers held before release to service and product suppliers.
Additional information on cash accounting policies is included in note I(j).
2019 $’000
2018 $’000
General cash at bank and on hand 336,523 444,536
Client cash 835,729 828,456
Total cash and cash equivalents 1,172,252 1,272,992
RECONCILIATION OF PROFIT AFTER TAX TO NET CASH INFLOW FROM OPERATING ACTIVITIES
Profit after income tax for the year 264,174 264,782
Depreciation and amortisation 82,370 77,802
Net (gain)/loss on disposal of non-current assets 2,724 7,084
Net (gain) /loss on sale of financial assets at fair value (3,168) (3,269)
Share of (profits)/loss of joint ventures & associates (1,147) (2,240)
Impairment charges 29,777 -
Net (gain)/loss on financial assets (3,955) (3,014)
Fair value gain on change in control (20,318) (61)
Fair value adjustment to contingent consideration (3,776) (2,620)
Non-cash employee benefits expense - share based payments 2,532 9,161
Net exchange differences (4,814) (8,617)
(Increase) / decrease in trade and other receivables, contracts assets and other assets (38,516) (74,936)
(Increase) / decrease in deferred tax assets and liabilities (106) (12,861)
(Increase) / decrease in inventories (34) (407)
Increase / (decrease) in trade creditors and other payables (26,470) 41,070
Increase / (decrease) in net income taxes payable (13,575) 12,657
Increase / (decrease) in other provisions 13,185 9,806
Net cash inflow from operating activities 278,883 314,337

60 ANNUAL REPORT 2019 FLIGHT CENTRE TRAVEL GROUP
NOTES TO THE FINANCIAL STATEMENTS CONTINUED
B2 FINANCIAL ASSET INVESTMENTS
2019 $’000
2018 $’000
Equity investments - Fair value through profit or loss (FVTPL)1 3,111 1,767
Debt securities - Fair value through profit or loss (FVTPL)1 4,661 9,697
Debt securities - Fair value through other comprehensive income (FVOCI)1 7,987 96,996
Debt securities - Amortised cost2 99,688 95,688
Total financial asset investments 115,447 204,148
1 These are investments of general cash.2 These are investments of client cash.
Debt securities measured at FVTPL do not have contractual cash flow characteristics.
Debt securities measured at FVOCI have contractual cash flow characteristics that are solely payment of principal and interest and are held in a business model whose objective is achieved by both collecting contractual cash flows and selling financial assets.
Debt securities and repurchase receivables are measured at amortised cost only if both the following conditions are met:
• it is held within a business model whose objective is to hold assets in order to collect contractual cash flows • the contractual terms of the financial asset represent contractual cash flows that are solely payments of principal
and interest
Debt securities at FVOCI and debt securities at FVTPL are measured at fair value, which is determined by reference to price quotations in a market for identical assets. As the assets are not heavily traded, FLT has determined that they are classified as Level 2 (2018: Level 2) under the AASB 13 Fair value measurement hierarchy.
Equity investments at FVTPL are measured at fair value, which is determined by an independent qualified valuer in accordance with Australian Accounting Standards (AASB’s) and International Private Equity and Venture Capital Valuation Guidelines as adopted by Australian Private Equity and Venture Capital Association Limited. FLT has determined that they are classified as Level 3 (2018: Level 3) under the AASB 13 Fair value measurement hierarchy, based on the valuation technique as described above.
From time-to-time, FLT utilises a repurchase agreement to enter into short-term borrowings to manage liquidity risk and / or maximise investment returns. Debt securities are pledged as security for these borrowings. These securities are separately disclosed as “Repurchase receivable - Amortised cost” above and “short-term borrowings” in note B4. The counterparty has an obligation to return the securities to FLT. There were no repurchase agreements in place as at 30 June 2019 or 30 June 2018. There are no other significant terms and conditions associated with the use of collateral.

ANNUAL REPORT 2019 FLIGHT CENTRE TRAVEL GROUP 61
B3 CASH AND FINANCIAL ASSET INVESTMENTS - FINANCIAL RISK MANAGEMENT
CREDIT RISKCredit risk arising from cash and cash equivalents and financial asset investments is managed in accordance with group treasury policy. Limits are set on credit rating, type of security, counterparty exposure and maturity.
Credit quality has been assessed by reference to external credit ratings (if available) or to historical information about counterparty default rates. There has been no significant increase to credit risk for cash and cash equivalents and financial assets.
AT 30 JUNE 2019
EQUIVALENT S&P RATING
AA AND
ABOVE $’000
AA- TO A- $’000
BBB+ TO BBB-
$’000
NON INVESTMENT
GRADE / UNRATED
$’000
UNRATED - FX BUSINESS
CURRENCY HOLDINGS
$’000TOTAL $’000
Cash and cash equivalents - 952,209 110,945 72,522 36,576 1,172,252
Equity investments - FVTPL - - - 3,111 - 3,111
Debt securities - FVTPL 3,077 - - 1,584 - 4,661
Debt securities - FVOCI 500 3,839 3,648 - - 7,987
Debt securities - Amortised cost - 89,720 9,968 - - 99,688
AT 30 JUNE 2018
Cash and cash equivalents - 1,029,673 137,505 65,295 40,519 1,272,992
Equity investments - FVTPL - - - 1,767 - 1,767
Debt securities - FVTPL 9,697 - - - - 9,697
Debt securities - FVOCI - 83,133 13,863 - - 96,996
Debt securities - Amortised cost - 85,792 9,896 - - 95,688
ACCOUNTING POLICY
FLT has applied the simplified approach for provisioning for expected credit losses prescribed by AASB 9. Additional information on trade and other receivables accounting policies is included in note I(a) and I(m).
The maximum exposure to credit risk is the carrying amount of financial assets and the carrying amount of cash and cash equivalents as disclosed above. Unrated FX business currency holdings consists of cash on hand for trading purposes as part of the Travel Money foreign exchange business.
MARKET RISK
INTEREST RATE AND FOREIGN CURRENCY RISK
The group holds investments at variable rates. FLT’s profit and operating cash flows are, therefore, exposed to changes in market interest rates. The group constantly analyses its interest rate exposure.
Refer to note C1 for sensitivity of interest rate risk and foreign currency risk.

62 ANNUAL REPORT 2019 FLIGHT CENTRE TRAVEL GROUP
NOTES TO THE FINANCIAL STATEMENTS CONTINUED
B4 BORROWINGS
CURRENT NOTES2019
$’0002018
$’000
Bank loans 72,269 24,525
Net unsecured notes principal D2 12,441 10,321
Total current borrowings 84,710 34,846
NON-CURRENT
Bank loans 100,375 652
Total non-current borrowings 100,375 652
Refer to note D2 for further information on the net unsecured notes that form part of the Business Ownership Scheme (BOS).
CHANGES IN LIABILITIES ARISING FROM FINANCING ACTIVITIES
BORROWINGS2019
$’000
Opening balance at 1 July 2018 35,498
Cashflow - Proceeds from borrowings1 197,541
Cashflow - Repayment of borrowings1 (48,855)
Foreign exchange movement 813
Other 84
Acquired through business combination 4
Closing balance at 30 June 2019 185,085
1 This includes the bilateral debt facilities, the periodic use of the repurchase facility and operation of the Business Ownership Scheme (BOS) during the year. Further details of BOS are included in note D2.
The Group classifies interest paid as cash flows from operating activities.
FINANCIAL RISK MANAGEMENT
CAPITAL MANAGEMENT
On 20 February 2019, FLT entered into a series of bilateral debt facilities totalling $250,000,000 to provide additional liquidity to fund acquisitions. The three year revolving credit facilities are guaranteed by certain members of the group and are unsecured. FLT has complied with all financial covenants contained in the facilities.
The total amount drawn down at the reporting date was $160,000,000 with $60,000,000 repaid on 4 July 2019.
The fair value of the bank loans includes the transaction costs on establishment of the facilities which are being released over the facility term.
CASH FLOW AND FAIR VALUE INTEREST RATE RISK
The group holds borrowings which are issued at variable rates. FLT’s profit and operating cash flows are, therefore, exposed to changes in market interest rates.
The group constantly analyses its interest rate exposure, taking into consideration refinancing, renewal of existing positions and alternative financing. The group calculates the impact a defined interest rate shift will have on profit or loss. For each analysis, the same interest rate shift is used for all currencies.
Under group policy, the maximum percentage of outstanding external group debt that may be maintained at a fixed interest rate is 50%, unless the global CFO and global treasurer approve otherwise.
Current loan facilities are subject to annual review (except the three year bilateral facilities) and are a mix of fixed and floating interest rates. Non-current loan facilities have maturities between 1-3 years (2018: 1-4 years) and are at a mix of fixed and floating rates.
The current interest rates on loan facilities range from 2.36% - 8.25% (2018: 3.51% - 8.45%).

ANNUAL REPORT 2019 FLIGHT CENTRE TRAVEL GROUP 63
B4 BORROWINGS (CONTINUED)
LIQUIDITY RISK
To manage liquidity risk, the group has access to additional financing via unused bank loan facilities, repurchase agreements, credit card facilities, bank guarantees and letter of credit facilities.
BANK LOANS & LEASING FACILITIES CREDIT CARDS
BANK GUARANTEES & LETTERS OF CREDIT
2019 $’000
2018 $’000
2019 $’000
2018 $’000
2019 $’000
2018 $’000
Unused 116,204 22,822 118,335 104,463 52,113 67,740
Used 173,541 26,109 64,443 53,046 88,808 93,477
Total facilities 289,745 48,931 182,778 157,509 140,921 161,217
Bank guarantees and letters of credit are provided as security on various facilities with vendors and in accordance with local travel agency licensing and International Air Transport Association (IATA) regulations.
Refer to note C1 for a sensitivity analysis of borrowings’ interest rate risk and details of borrowings’ maturity profiles and associated liquidity risks.
There have been no defaults during the period.
FAIR VALUEThe carrying amount of the group’s borrowings approximates their fair values, as commercial rates of interest are paid and the impact of discounting is not significant.
ASSETS PLEDGED AS SECURITY
From time-to-time, FLT enters into short term borrowings to manage liquidity and / or maximise investment returns. When this occurs, unlisted debt securities are pledged as security for these borrowings as set out below.
In addition, FLT has allocated cash invested with the providers of certain bank guarantees and letter of credit facilities as collateral as set out below.
2019 $’000
2018 $’000
Current 238 233
Non-current 149 143
Total secured bank loans 387 376
Cash and cash equivalents 59,600 58,000
Total assets pledged as security 59,600 58,000
Other than the items listed in section B4 above, no other group assets have been pledged as security.
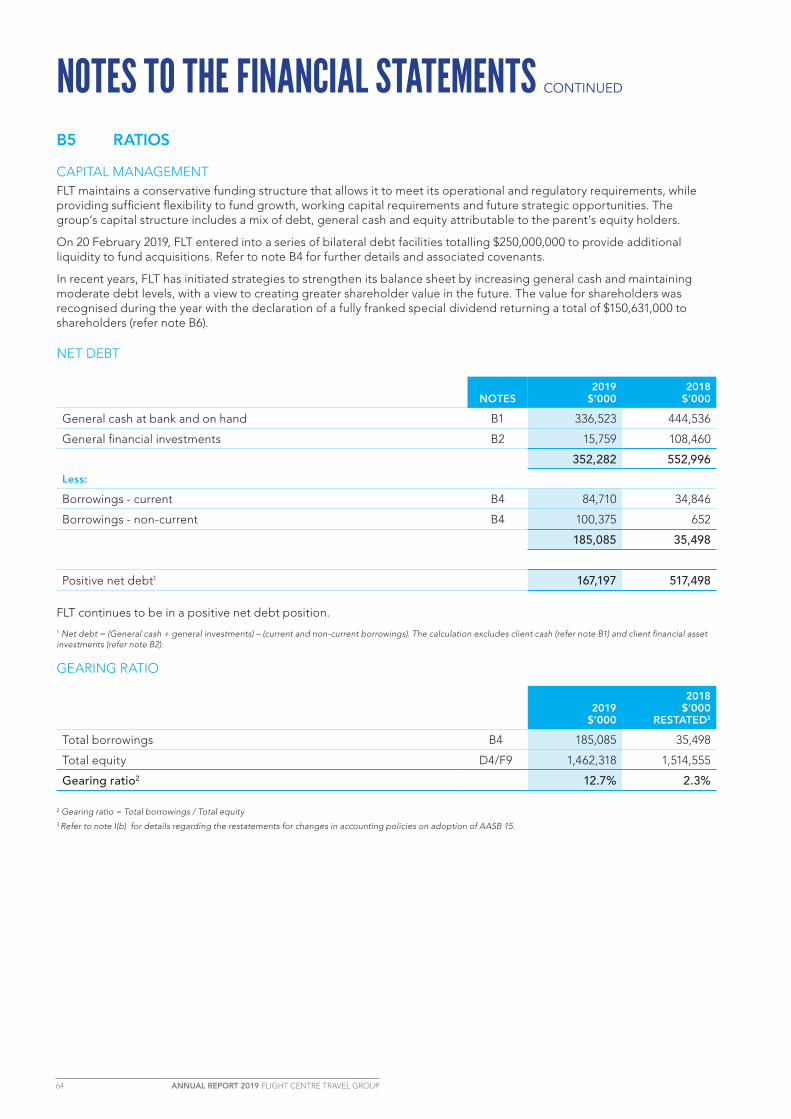
64 ANNUAL REPORT 2019 FLIGHT CENTRE TRAVEL GROUP
NOTES TO THE FINANCIAL STATEMENTS CONTINUED
B5 RATIOS
CAPITAL MANAGEMENTFLT maintains a conservative funding structure that allows it to meet its operational and regulatory requirements, while providing sufficient flexibility to fund growth, working capital requirements and future strategic opportunities. The group’s capital structure includes a mix of debt, general cash and equity attributable to the parent’s equity holders.
On 20 February 2019, FLT entered into a series of bilateral debt facilities totalling $250,000,000 to provide additional liquidity to fund acquisitions. Refer to note B4 for further details and associated covenants.
In recent years, FLT has initiated strategies to strengthen its balance sheet by increasing general cash and maintaining moderate debt levels, with a view to creating greater shareholder value in the future. The value for shareholders was recognised during the year with the declaration of a fully franked special dividend returning a total of $150,631,000 to shareholders (refer note B6).
NET DEBT
NOTES2019
$’0002018
$’000
General cash at bank and on hand B1 336,523 444,536
General financial investments B2 15,759 108,460
352,282 552,996
Less:
Borrowings - current B4 84,710 34,846
Borrowings - non-current B4 100,375 652
185,085 35,498
Positive net debt1 167,197 517,498
FLT continues to be in a positive net debt position. 1 Net debt = (General cash + general investments) – (current and non-current borrowings). The calculation excludes client cash (refer note B1) and client financial asset investments (refer note B2).
GEARING RATIO
2019 $’000
2018 $’000
RESTATED3
Total borrowings B4 185,085 35,498
Total equity D4/F9 1,462,318 1,514,555
Gearing ratio2 12.7% 2.3%
2 Gearing ratio = Total borrowings / Total equity3 Refer to note I(b) for details regarding the restatements for changes in accounting policies on adoption of AASB 15.
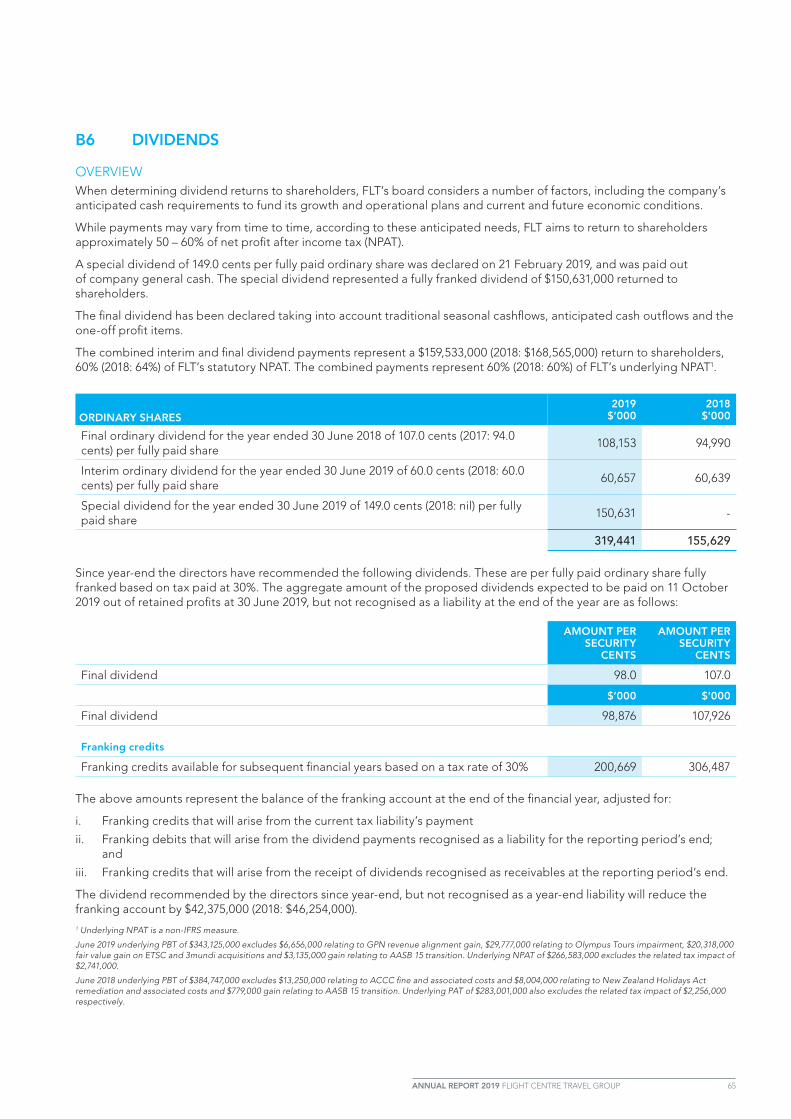
ANNUAL REPORT 2019 FLIGHT CENTRE TRAVEL GROUP 65
B6 DIVIDENDS
OVERVIEWWhen determining dividend returns to shareholders, FLT’s board considers a number of factors, including the company’s anticipated cash requirements to fund its growth and operational plans and current and future economic conditions.
While payments may vary from time to time, according to these anticipated needs, FLT aims to return to shareholders approximately 50 – 60% of net profit after income tax (NPAT).
A special dividend of 149.0 cents per fully paid ordinary share was declared on 21 February 2019, and was paid out of company general cash. The special dividend represented a fully franked dividend of $150,631,000 returned to shareholders.
The final dividend has been declared taking into account traditional seasonal cashflows, anticipated cash outflows and the one-off profit items.
The combined interim and final dividend payments represent a $159,533,000 (2018: $168,565,000) return to shareholders, 60% (2018: 64%) of FLT’s statutory NPAT. The combined payments represent 60% (2018: 60%) of FLT’s underlying NPAT1.
ORDINARY SHARES 2019
$’0002018
$’000
Final ordinary dividend for the year ended 30 June 2018 of 107.0 cents (2017: 94.0 cents) per fully paid share
108,153 94,990
Interim ordinary dividend for the year ended 30 June 2019 of 60.0 cents (2018: 60.0 cents) per fully paid share
60,657 60,639
Special dividend for the year ended 30 June 2019 of 149.0 cents (2018: nil) per fully paid share
150,631 -
319,441 155,629
Since year-end the directors have recommended the following dividends. These are per fully paid ordinary share fully franked based on tax paid at 30%. The aggregate amount of the proposed dividends expected to be paid on 11 October 2019 out of retained profits at 30 June 2019, but not recognised as a liability at the end of the year are as follows:
AMOUNT PER SECURITY
CENTS
AMOUNT PER SECURITY
CENTS
Final dividend 98.0 107.0
$’000 $’000
Final dividend 98,876 107,926
Franking credits
Franking credits available for subsequent financial years based on a tax rate of 30% 200,669 306,487
The above amounts represent the balance of the franking account at the end of the financial year, adjusted for:
i. Franking credits that will arise from the current tax liability’s payment
ii. Franking debits that will arise from the dividend payments recognised as a liability for the reporting period’s end; and
iii. Franking credits that will arise from the receipt of dividends recognised as receivables at the reporting period’s end.
The dividend recommended by the directors since year-end, but not recognised as a year-end liability will reduce the franking account by $42,375,000 (2018: $46,254,000).1 Underlying NPAT is a non-IFRS measure.
June 2019 underlying PBT of $343,125,000 excludes $6,656,000 relating to GPN revenue alignment gain, $29,777,000 relating to Olympus Tours impairment, $20,318,000 fair value gain on ETSC and 3mundi acquisitions and $3,135,000 gain relating to AASB 15 transition. Underlying NPAT of $266,583,000 excludes the related tax impact of $2,741,000.
June 2018 underlying PBT of $384,747,000 excludes $13,250,000 relating to ACCC fine and associated costs and $8,004,000 relating to New Zealand Holidays Act remediation and associated costs and $779,000 gain relating to AASB 15 transition. Underlying PAT of $283,001,000 also excludes the related tax impact of $2,256,000 respectively.

66 ANNUAL REPORT 2019 FLIGHT CENTRE TRAVEL GROUP
NOTES TO THE FINANCIAL STATEMENTS CONTINUED
B6 DIVIDENDS (CONTINUED)CHANGES IN LIABILITIES ARISING FROM FINANCING ACTIVITIES
DIVIDENDS PAYABLE2019
$’000
Opening balance at 1 July 2018 -
Dividends declared - parent entity 319,441
Dividends declared - attributable to non-controlling interest 346
Cashflow - Dividend payment (319,787)
Closing balance at 30 June 2019 -
B7 CAPITAL EXPENDITURE
OVERVIEWIn the current and prior year FLT has focused on its technological offering, through the acquisition of a number of technology companies and the development of a number of IT projects to support FLT’s future strategy.
DEPRECIATION NOTES2019
$’0002018
$’000
Buildings F5 837 1,028
Plant and equipment F5 62,232 63,194
Total depreciation 63,069 64,222
AMORTISATION
Brand names, licences and customer relationships A5 1,089 172
Software A5 18,212 13,408
Total amortisation 19,301 13,580
Total depreciation and amortisation 82,370 77,802
ADDITIONS
Plant and equipment F5 53,352 52,355
Intangibles A5 47,630 36,326
Total additions 100,982 88,681
In addition to the depreciation & amortisation disclosed above, ‘Tour & hotel operations - Cost of sales’ in the income statement includes $657,000 (2018: $nil) relating to depreciation & amortisation directly attributable to the delivery of tour and hotel services.
CONTRACTUAL COMMITMENTSNeither the parent entity, nor the group, have any contractual obligations to purchase plant and equipment or intangible assets at balance date (2018: $nil).

ANNUAL REPORT 2019 FLIGHT CENTRE TRAVEL GROUP 67
C FINANCIAL RISK MANAGEMENTThis section provides information relating to FLT group’s exposure to financial risks, how they affect the group’s financial position and performance and how the risks are managed.
C1 Financial risk management
C2 Derivative financial instruments
C3 Other financial assets
C1 FINANCIAL RISK MANAGEMENT
OVERVIEWThe group’s activities expose it to a variety of financial risks: market risk (including foreign exchange risk and interest rate risk), credit risk and liquidity risk. The group’s overall risk management program focuses on financial markets’ unpredictability and seeks to minimise potential adverse effects on the group’s financial performance.
A central treasury department oversees financial risk under board-approved policies that cover specific areas, such as foreign exchange risk, interest rate risk and credit risk, use of derivative financial instruments and non-derivative financial instruments and investment of excess liquidity. Treasury identifies, evaluates and hedges financial risks in co-operation with the group’s operating units. The board provides written principles for overall risk management, as well as policies covering the specific areas noted above.
Market risk and credit risk are analysed within the relevant balance sheet note disclosures with the exception of the effects of hedge accounting, which is set out below. Liquidity risk and sensitivities are also set out below.
LIQUIDITY RISKPrudent liquidity risk management requires FLT to maintain sufficient cash and marketable securities, access to additional funding through an adequate amount of committed credit facilities and the ability to close out market positions. The group manages liquidity risk by continuously monitoring forecast and actual cash flows and matching the maturity profiles of financial assets and liabilities. At year-end, FLT held deposits at call of $837,528,000 (2018: $739,956,000), included as part of the cash balance, that are readily available for managing liquidity risk.
Management monitors rolling forecasts of the group’s liquidity reserve and cash and cash equivalents (refer to note B1) on the basis of expected cash flows. This is generally carried out at local level in the group’s operating companies, in accordance with established practices and limits. These limits vary by location to take into account local market liquidity. In addition, the group’s liquidity management policy involves projecting cash flows in major currencies and considering the level of liquid assets necessary to meet these, monitoring balance sheet liquidity ratios against internal and external regulatory requirements and maintaining debt financing plans.
The group’s access to undrawn borrowing facilities at the reporting period’s end are disclosed in note B4.

68 ANNUAL REPORT 2019 FLIGHT CENTRE TRAVEL GROUP
NOTES TO THE FINANCIAL STATEMENTS CONTINUED
C1 FINANCIAL RISK MANAGEMENT
MATURITIES OF FINANCIAL LIABILITIES
The tables below analyse the group’s financial liabilities and net and gross settled derivative financial instruments into relevant maturity groupings. Groupings are based on the remaining period to the contractual maturity date at the reporting period’s end. The amounts disclosed in the table are the contractual undiscounted cash flows.
2019 NON-DERIVATIVES
LESS THAN 12 MONTHS
$’000
BETWEEN 1 AND 2
YEARS $’000
BETWEEN 2 AND 5
YEARS $’000
MORE THAN
5 YEARS $’000
TOTAL CONTRACTUAL
CASH FLOWS $’000
CARRYING AMOUNT (ASSETS)/
LIABILITIES $’000
Trade and other payables 1,461,127 - - - 1,461,127 1,461,127
Contingent consideration 15,400 3,181 - - 18,581 18,581
Borrowings 85,607 261 100,114 - 185,982 185,085
Total non-derivatives 1,562,134 3,442 100,114 - 1,665,690 1,664,793
Derivatives
Derivatives - net settled 2,797 - - - 2,797 2,797
2018 - RESTATED1 NON-DERIVATIVES
Trade and other payables 1,451,168 - - - 1,451,168 1,451,168
Contingent consideration 10,627 15,969 - - 26,596 26,452
Borrowings 34,846 59 593 - 35,498 35,498
Total non-derivatives 1,496,641 16,028 593 - 1,513,262 1,513,118
Derivatives
Derivatives - net settled 3,995 - - - 3,995 3,995
1 Refer to note I(b) for details regarding the restatements for changes in accounting policies on adoption of AASB 15.
SUMMARISED SENSITIVITY ANALYSISThe following table summarises the sensitivity of the group’s financial assets and financial liabilities to interest rate risk and foreign exchange risk.
The foreign exchange sensitivities are based on the Group’s exposures existing at balance date taking into account the Group’s designated cash flow hedges.
Interest rate sensitivities are based on reasonable changes in interest rates on that portion of cash, investments and borrowings affected.
Foreign currency risks, as defined by AASB 7 Financial Instruments: Disclosures, arise on account of financial instruments being denominated in a currency that is not the functional currency in which the financial instrument is measured. Differences from the translation of financial statements into the Group’s presentation currency are not taken into consideration in the sensitivity analysis. Foreign exchange sensitivities are based on reasonably possible changes in foreign exchanges rates.
For interest rate and foreign exchange rate sensitivities, all other variables are held constant. Sensitivity figures are pre tax. The movement in equity excludes movements in retained earnings.
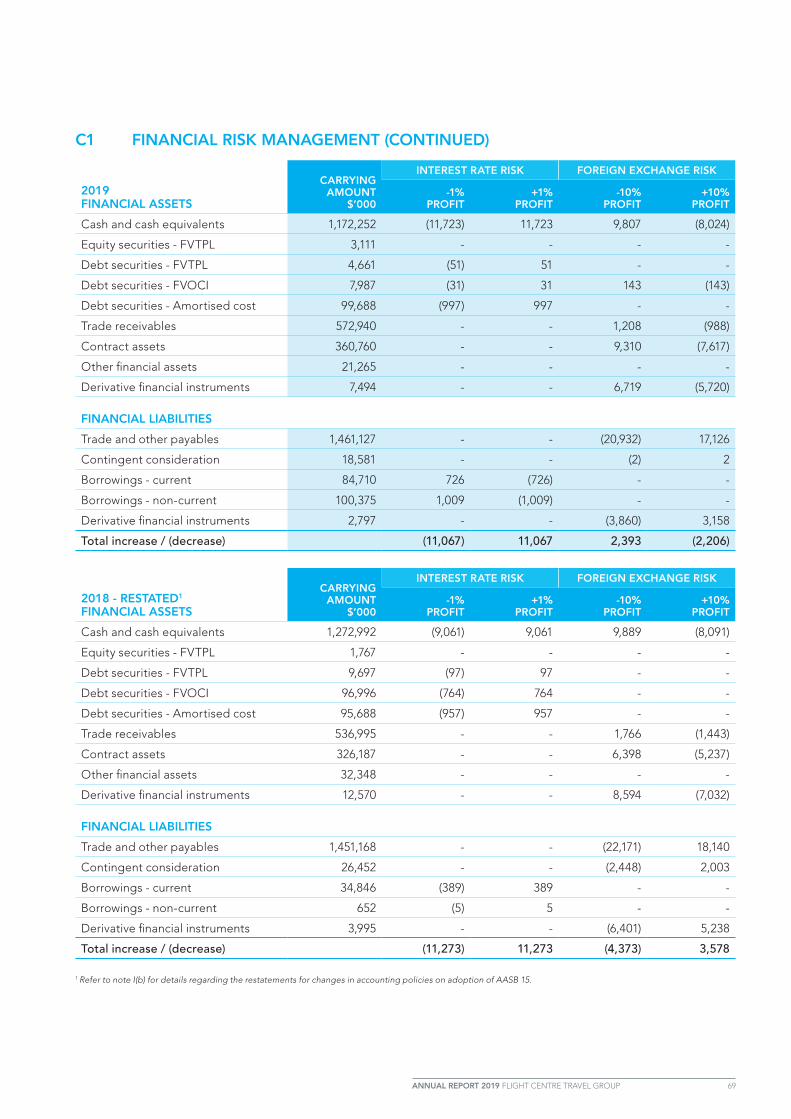
ANNUAL REPORT 2019 FLIGHT CENTRE TRAVEL GROUP 69
C1 FINANCIAL RISK MANAGEMENT (CONTINUED)
2019 FINANCIAL ASSETS
CARRYING AMOUNT
$’000
INTEREST RATE RISK FOREIGN EXCHANGE RISK
-1% PROFIT
+1% PROFIT
-10% PROFIT
+10% PROFIT
Cash and cash equivalents 1,172,252 (11,723) 11,723 9,807 (8,024)
Equity securities - FVTPL 3,111 - - - -
Debt securities - FVTPL 4,661 (51) 51 - -
Debt securities - FVOCI 7,987 (31) 31 143 (143)
Debt securities - Amortised cost 99,688 (997) 997 - -
Trade receivables 572,940 - - 1,208 (988)
Contract assets 360,760 - - 9,310 (7,617)
Other financial assets 21,265 - - - -
Derivative financial instruments 7,494 - - 6,719 (5,720)
FINANCIAL LIABILITIES
Trade and other payables 1,461,127 - - (20,932) 17,126
Contingent consideration 18,581 - - (2) 2
Borrowings - current 84,710 726 (726) - -
Borrowings - non-current 100,375 1,009 (1,009) - -
Derivative financial instruments 2,797 - - (3,860) 3,158
Total increase / (decrease) (11,067) 11,067 2,393 (2,206)
2018 - RESTATED1
FINANCIAL ASSETS
CARRYING AMOUNT
$’000
INTEREST RATE RISK FOREIGN EXCHANGE RISK
-1% PROFIT
+1% PROFIT
-10% PROFIT
+10% PROFIT
Cash and cash equivalents 1,272,992 (9,061) 9,061 9,889 (8,091)
Equity securities - FVTPL 1,767 - - - -
Debt securities - FVTPL 9,697 (97) 97 - -
Debt securities - FVOCI 96,996 (764) 764 - -
Debt securities - Amortised cost 95,688 (957) 957 - -
Trade receivables 536,995 - - 1,766 (1,443)
Contract assets 326,187 - - 6,398 (5,237)
Other financial assets 32,348 - - - -
Derivative financial instruments 12,570 - - 8,594 (7,032)
FINANCIAL LIABILITIES
Trade and other payables 1,451,168 - - (22,171) 18,140
Contingent consideration 26,452 - - (2,448) 2,003
Borrowings - current 34,846 (389) 389 - -
Borrowings - non-current 652 (5) 5 - -
Derivative financial instruments 3,995 - - (6,401) 5,238
Total increase / (decrease) (11,273) 11,273 (4,373) 3,578
1 Refer to note I(b) for details regarding the restatements for changes in accounting policies on adoption of AASB 15.

70 ANNUAL REPORT 2019 FLIGHT CENTRE TRAVEL GROUP
NOTES TO THE FINANCIAL STATEMENTS CONTINUED
C1 FINANCIAL RISK MANAGEMENT (CONTINUED)
2019 FINANCIAL ASSETS
CARRYING AMOUNT
$’000
INTEREST RATE RISK FOREIGN EXCHANGE RISK
-1% EQUITY
+1% EQUITY
-10% EQUITY
+10% EQUITY
Debt securities - FVOCI 7,987 16 (16) - -
Derivative financial instruments 7,494 - - 8,339 (6,823)
Financial liabilities
Derivative financial instruments 2,797 - - 5,203 (4,257)
16 (16) 13,542 (11,080)
2018 FINANCIAL ASSETS
CARRYING AMOUNT
$’000
INTEREST RATE RISK FOREIGN EXCHANGE RISK
-1% EQUITY
+1% EQUITY
-10% EQUITY
+10% EQUITY
Debt securities - FVOCI 96,996 (119) 114 - -
Derivative financial instruments 12,570 - - 22,829 (18,678)
Financial liabilities
Derivative financial instruments 3,995 - - 7,842 (6,416)
(119) 114 30,671 (25,094)
Other than disclosed in the table above, there are no other equity impacts as a result of movements in interest rates and foreign exchange rates.
There is no profit or equity impact as a result of other price risk.
C2 DERIVATIVE FINANCIAL INSTRUMENTS
CURRENT ASSETS2019 ’000
2018 $’000
Forward foreign exchange contracts - designated in a cash flow hedge 4,331 9,337
Forward foreign exchange contracts - FVTPL 2,061 3,233
Embedded derivative - FVTPL 1,102 -
Total current derivative financial instrument assets 7,494 12,570
CURRENT LIABILITIES
Forward foreign exchange contracts - designated in a cash flow hedge 1,260 1,557
Forward foreign exchange contracts - FVTPL 1,537 2,438
Total current derivative financial instrument liabilities 2,797 3,995
FINANCIAL RISK MANAGEMENT
FAIR VALUE
Forward foreign exchange contracts are measured at fair value, which is based on observable forward foreign exchange rates and the respective currencies’ yield curves, as well as the currency basis spreads between the respective currencies. The accounting for subsequent changes in fair value depends on whether the derivative is designated as a hedging instrument. See hedge accounting set out below for derivatives designated as part of a hedging relationship to which hedge accounting is applied. Changes in fair value for derivative instruments that do not qualify for hedge accounting are recognised immediately in the statement of profit or loss.
The forward foreign exchange contracts are classified as Level 2 (2018: Level 2) under the AASB 13 Fair value measurement hierarchy, based on the valuation technique described above.

ANNUAL REPORT 2019 FLIGHT CENTRE TRAVEL GROUP 71
C2 DERIVATIVE FINANCIAL INSTRUMENTS (CONTINUED)
CREDIT RISK
The maximum exposure to credit risk at the reporting period’s end is the fair value of all forward foreign exchange contracts as disclosed above. Credit quality can be assessed by reference to external credit ratings (if available) or to historical information about counterparty default rates. All forward foreign exchange contract counterparties have an equivalent S&P rating of AA- to A-.
HEDGE ACCOUNTING
ACCOUNTING POLICY
All derivatives are recognised in the balance sheet at fair value and are classified as FVTPL except where they are designated as part of an effective hedge relationship and classified as hedging derivatives. The carrying value of a derivative is remeasured at fair value throughout the life of the contract. Derivatives are carried as assets when the fair value is positive and as liabilities when the fair value is negative.
The method of recognising the resulting fair value gain or loss on a derivative depends on whether the derivative is designated as a hedging instrument and, if so, the nature of the item being hedged.
The group designates its derivatives as hedges of highly probable future cash flows attributable to a recognised foreign currency asset or liability or a highly probable foreign currency forecast transaction (cash flow hedges).
FLT documents at the inception of the transaction the relationship between hedging instruments and hedged items, the risk being hedged and the group’s risk management objective and strategy for undertaking these hedge transactions. The effectiveness of the cash flow hedge is measured throughout the life of the hedging relationship. Ineffectiveness arises in the event of over hedging, whereby the notional amount of the designated hedge instrument exceeds the notional amount of the hedged item attributable to the hedged risk, or timing mismatches. Where ineffectiveness is identified, any revaluation gains or losses on the ineffective portion of the hedging instrument are immediately recognised in the statement of profit or loss in foreign exchange gains or foreign exchange losses.
The effective portion of changes in the fair value of derivatives that are designated as cash flow hedges are recognised in the cash flow hedge reserve within equity. Amounts accumulated in equity are transferred to the statement of profit or loss in the period(s) in which the hedged item affects the statement of profit or loss.
RISK MANAGEMENT STRATEGY
The fundamental objective is to minimise risk. This is achieved by minimising the volatility in the statement of profit or loss and variations in cash flows. The objective is not to maximise revenue or minimise costs, however in certain situations hedging may deliver value to FLT by minimising downside risk. There is no speculation allowed and all treasury activities and transactions must be linked to underlying business requirements.
Hedge accounting has been applied in FLT’s Global Procurement (“GPN”) business and its UK based Global Touring business. GPN seeks to reduce variability by entering into forward foreign exchange contracts upon collection of customer deposits. Global Touring seeks to reduce variability on forecast payments to suppliers by entering into forward foreign exchange contracts upon publication of its brochures. Global Touring also enter into GBP forward exchange contracts to minimise variability in its London based head office costs.
The first $1 of notional amount of the hedging instrument is designated against the first $1 of forecast payments or forecast receipts. Hedges are entered into in the same currency as the underlying exposures as such ineffectiveness will mostly arise in the event of over hedging or timing mismatches, therefore the hedging ratio is 1:1.

72 ANNUAL REPORT 2019 FLIGHT CENTRE TRAVEL GROUP
NOTES TO THE FINANCIAL STATEMENTS CONTINUED
C2 DERIVATIVE FINANCIAL INSTRUMENTS (CONTINUED)
THE EFFECTS OF HEDGE ACCOUNTING
At 30 June 2019, FLT holds the following forward foreign exchange contracts to hedge its exposure on forecast foreign currency receipts and forecast foreign currency payments. The impact of hedging instruments designated in hedging relationships at 30 June 2019 on the balance sheet of the group is as follows. Note these are all shown in the consolidated balance sheet in current assets and liabilities as derivative financial instruments.
CASH FLOW HEDGES - 2019
NOTIONAL AMOUNT IN
LOCAL CURRENCY ‘000
CARRYING AMOUNT
$’000AVERAGE
FORWARD PRICE
CHANGE IN FAIR VALUE USED
FOR MEASURING INEFFECTIVENESS
FOR THE PERIOD $’000
South African Rand 78,420 (145) 10.0093 (145)
US Dollar 100,124 1,812 0.7092 1,812
Euro 51,645 291 0.6170 291
Singapore Dollar 11,850 166 0.9650 166
New Zealand Dollar 34,000 (152) 1.0470 (152)
Thai Baht 392,000 624 22.4705 624
Fiji Dollar 50,600 323 1.5200 323
Other1 152 152
3,071 3,071
CASH FLOW HEDGES - 2018
NOTIONAL AMOUNT IN
LOCAL CURRENCY ‘000
CARRYING AMOUNT
$’000AVERAGE
FORWARD PRICE
CHANGE IN FAIR VALUE USED
FOR MEASURING INEFFECTIVENESS
FOR THE PERIOD $’000
Euro 57,085 414 0.6391 414
Great British Pound 1,461 189 0.5658 189
Hong Kong Dollar 28,000 179 6.0256 179
New Zealand Dollar (26,200) 281 1.0797 281
US Dollar 100,400 5,615 0.7718 5,615
Fiji Dollar 46,600 449 1.5800 449
Other1 653 653
7,780 7,780
1 Other includes various other insignificant currencies to which hedge accounting is applied.

ANNUAL REPORT 2019 FLIGHT CENTRE TRAVEL GROUP 73
C2 DERIVATIVE FINANCIAL INSTRUMENTS (CONTINUED)The impact of hedged items designated in hedging relationships as at 30 June 2019 on the balance sheet of the group is as follows:
CASH FLOW HEDGES - 2019
CHANGE IN VALUE USED
FOR MEASURING INEFFECTIVENESS
$’000
CASH FLOW HEDGE RESERVE
$’000
Foreign currency receipts British Pound (139) 47
New Zealand Dollar 334 -
South African Rand 70 (1)
US Dollar 1,219 163
Other1 357 -
Foreign currency payments Euro (118) (189)
British Pound 227 (350)
US Dollar (3,189) 373
Other1 (1,743) 39
82
CASH FLOW HEDGES - 2018
CHANGE IN VALUE USED
FOR MEASURING INEFFECTIVENESS
$’000
CASH FLOW HEDGE RESERVE
$’000
Foreign currency receipts British Pound (39) 89
New Zealand Dollar (206) 2
South African Rand (214) (16)
US Dollar 4,152 -
Other1 109 -
Foreign currency payments Euro 77 49
British Pound 53 (4)
US Dollar (10,291) 1,219
Other1 (924) (64)
1,275
1 Other includes various other insignificant currencies to which hedge accounting is applied.
The impact of hedging instruments designated in hedging relationships at 30 June 2019 on the consolidated statement of profit or loss of the group is as follows. Note these are all shown in the consolidated statement of profit or loss in other expenses as net foreign exchange losses.
CASH FLOW HEDGES Hedges of forecast foreign currency transactions
HEDGING GAIN /(LOSS)
RECOGNISED IN OCI
$’000
IN-EFFECTIVENESS RECOGNISED
IN THE INCOME STATEMENT
$’000
2019 (1,538) 123
2018 2,347 1,060
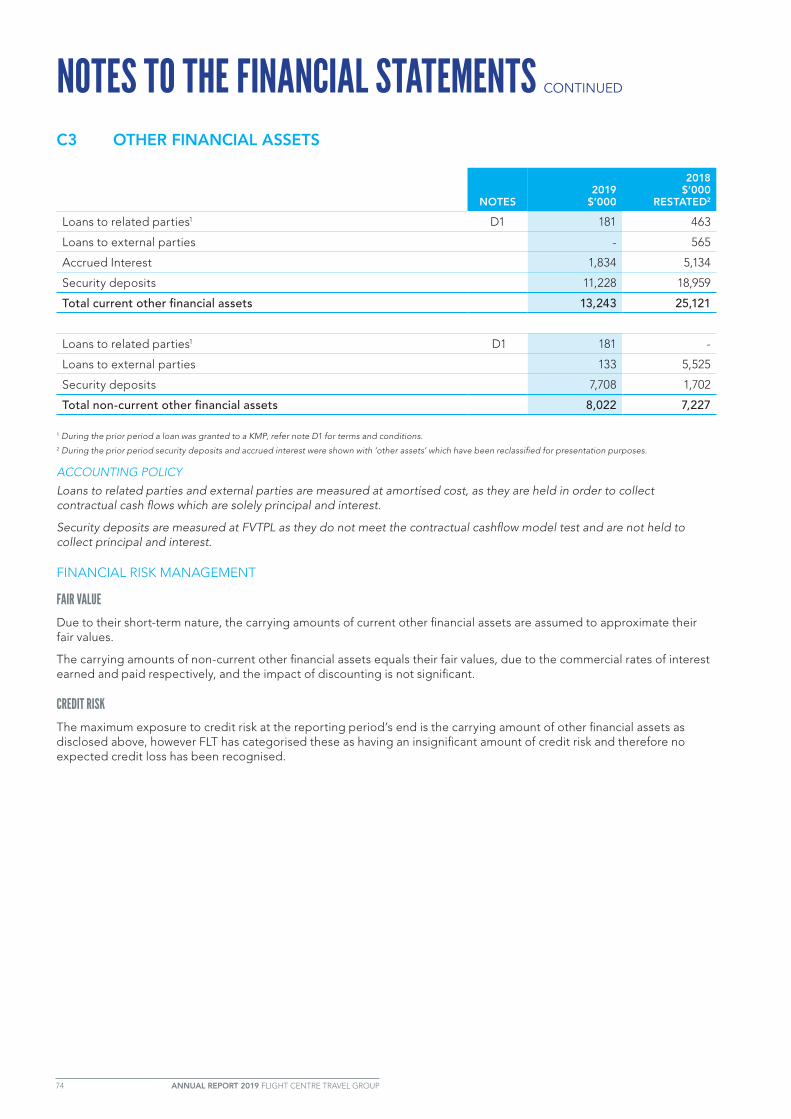
74 ANNUAL REPORT 2019 FLIGHT CENTRE TRAVEL GROUP
NOTES TO THE FINANCIAL STATEMENTS CONTINUED
C3 OTHER FINANCIAL ASSETS
NOTES2019
$’000
2018 $’000
RESTATED2
Loans to related parties1 D1 181 463
Loans to external parties - 565
Accrued Interest 1,834 5,134
Security deposits 11,228 18,959
Total current other financial assets 13,243 25,121
Loans to related parties1 D1 181 -
Loans to external parties 133 5,525
Security deposits 7,708 1,702
Total non-current other financial assets 8,022 7,227
1 During the prior period a loan was granted to a KMP, refer note D1 for terms and conditions. 2 During the prior period security deposits and accrued interest were shown with ‘other assets’ which have been reclassified for presentation purposes.
ACCOUNTING POLICY
Loans to related parties and external parties are measured at amortised cost, as they are held in order to collect contractual cash flows which are solely principal and interest.
Security deposits are measured at FVTPL as they do not meet the contractual cashflow model test and are not held to collect principal and interest.
FINANCIAL RISK MANAGEMENT
FAIR VALUE
Due to their short-term nature, the carrying amounts of current other financial assets are assumed to approximate their fair values.
The carrying amounts of non-current other financial assets equals their fair values, due to the commercial rates of interest earned and paid respectively, and the impact of discounting is not significant.
CREDIT RISK
The maximum exposure to credit risk at the reporting period’s end is the carrying amount of other financial assets as disclosed above, however FLT has categorised these as having an insignificant amount of credit risk and therefore no expected credit loss has been recognised.

ANNUAL REPORT 2019 FLIGHT CENTRE TRAVEL GROUP 75
D REWARD AND RECOGNITIONThis section provides a breakdown of the various programs FLT uses to reward and recognise employees and key executives, including Key Management Personnel (KMP).
FLT believes that these programs reinforce the value of ownership and incentives, both of which are key parts of the company's philosophies and culture, and drive performance both individually and collectively to deliver better returns to shareholders.
These programs also result in changes to the group's contributed equity.
D1 Key management personnel
D2 Business Ownership Scheme (BOS)
D3 Share-based payments • Long term retention plan (LTRP) • Employee Share Plan (ESP) • Transformation incentive plan (TIP)
D4 Contributed equity and treasury shares
D1 KEY MANAGEMENT PERSONNEL
KMP COMPENSATION
2019 $
2018 $
Short-term employee benefits 6,955,045 8,345,934
Post-employment benefits 126,371 115,594
Long-term benefits 3,655,804 3,010,445
Share-based payments 693,935 1,139,067
Total KMP compensation 11,431,155 12,611,040
Detailed remuneration disclosures are provided in section 2 of the remuneration report. Supporting information on director and KMP remuneration is included in the remuneration report in sections 3 and 4.
EQUITY INSTRUMENT DISCLOSURES RELATING TO KMPDetails of LTRP and ESP provided as remuneration to KMP and shares issued on the exercise of such, together with terms and conditions, can be found in section 4 of the remuneration report.
OTHER TRANSACTIONS WITH KMPDirectors and specified executives and their related companies receive travel services from FLT and its related companies on normal terms and conditions to employees and customers.
During the prior year, a loan was provided to C. Galanty, a KMP, at UK commercial interest rate of 1.2%. A portion is classified as a current loan (refer note C3) as it is repayable within 12 months of year end and the remainder classified as non-current loan (refer note C3) as it is repayable within two years of year end.
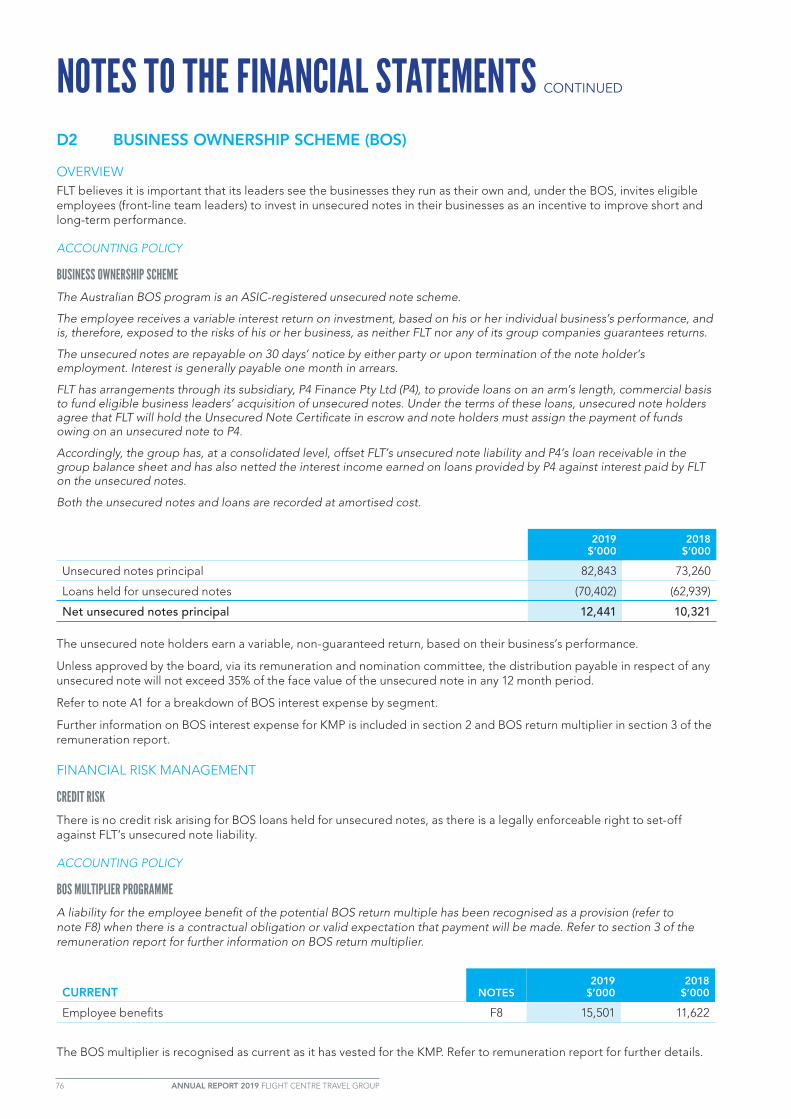
76 ANNUAL REPORT 2019 FLIGHT CENTRE TRAVEL GROUP
NOTES TO THE FINANCIAL STATEMENTS CONTINUED
D2 BUSINESS OWNERSHIP SCHEME (BOS)
OVERVIEWFLT believes it is important that its leaders see the businesses they run as their own and, under the BOS, invites eligible employees (front-line team leaders) to invest in unsecured notes in their businesses as an incentive to improve short and long-term performance.
ACCOUNTING POLICY
BUSINESS OWNERSHIP SCHEMEThe Australian BOS program is an ASIC-registered unsecured note scheme.
The employee receives a variable interest return on investment, based on his or her individual business’s performance, and is, therefore, exposed to the risks of his or her business, as neither FLT nor any of its group companies guarantees returns.
The unsecured notes are repayable on 30 days’ notice by either party or upon termination of the note holder’s employment. Interest is generally payable one month in arrears.
FLT has arrangements through its subsidiary, P4 Finance Pty Ltd (P4), to provide loans on an arm’s length, commercial basis to fund eligible business leaders’ acquisition of unsecured notes. Under the terms of these loans, unsecured note holders agree that FLT will hold the Unsecured Note Certificate in escrow and note holders must assign the payment of funds owing on an unsecured note to P4.
Accordingly, the group has, at a consolidated level, offset FLT’s unsecured note liability and P4’s loan receivable in the group balance sheet and has also netted the interest income earned on loans provided by P4 against interest paid by FLT on the unsecured notes.
Both the unsecured notes and loans are recorded at amortised cost.
2019 $’000
2018 $’000
Unsecured notes principal 82,843 73,260
Loans held for unsecured notes (70,402) (62,939)
Net unsecured notes principal 12,441 10,321
The unsecured note holders earn a variable, non-guaranteed return, based on their business’s performance.
Unless approved by the board, via its remuneration and nomination committee, the distribution payable in respect of any unsecured note will not exceed 35% of the face value of the unsecured note in any 12 month period.
Refer to note A1 for a breakdown of BOS interest expense by segment.
Further information on BOS interest expense for KMP is included in section 2 and BOS return multiplier in section 3 of the remuneration report.
FINANCIAL RISK MANAGEMENT
CREDIT RISK
There is no credit risk arising for BOS loans held for unsecured notes, as there is a legally enforceable right to set-off against FLT’s unsecured note liability.
ACCOUNTING POLICY
BOS MULTIPLIER PROGRAMME
A liability for the employee benefit of the potential BOS return multiple has been recognised as a provision (refer to note F8) when there is a contractual obligation or valid expectation that payment will be made. Refer to section 3 of the remuneration report for further information on BOS return multiplier.
CURRENT NOTES
2019 $’000
2018 $’000
Employee benefits F8 15,501 11,622
The BOS multiplier is recognised as current as it has vested for the KMP. Refer to remuneration report for further details.
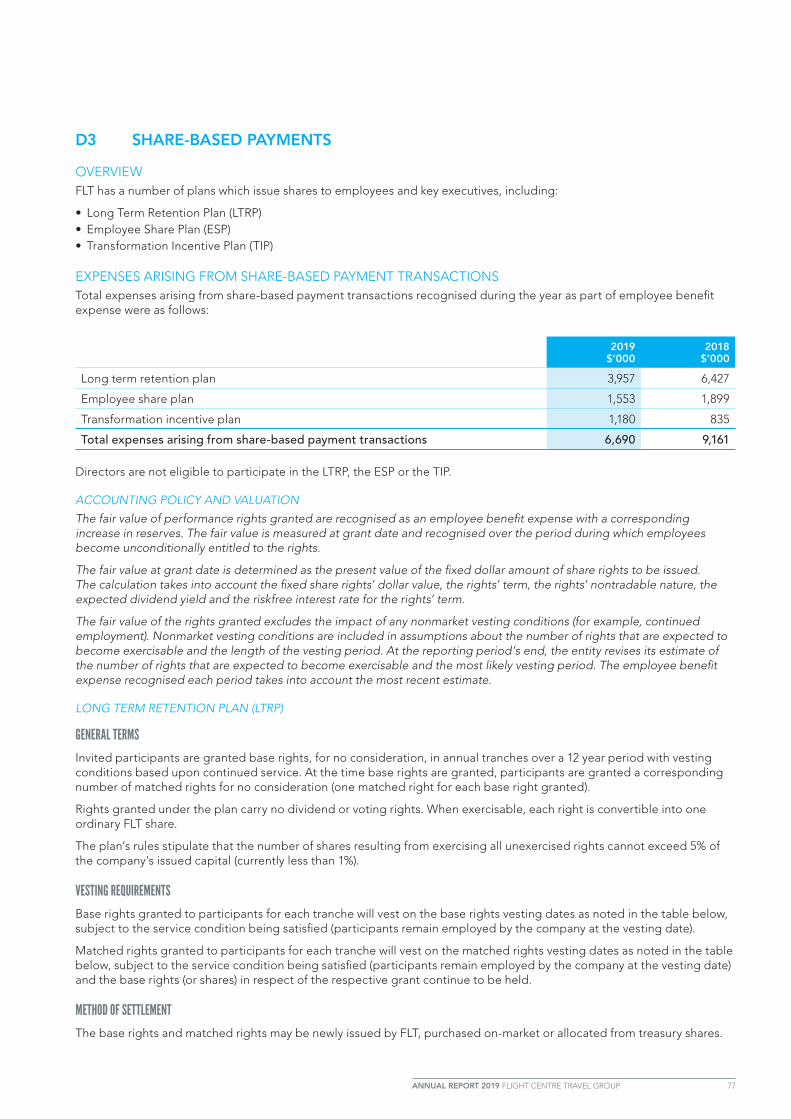
ANNUAL REPORT 2019 FLIGHT CENTRE TRAVEL GROUP 77
D3 SHARE-BASED PAYMENTS
OVERVIEWFLT has a number of plans which issue shares to employees and key executives, including:
• Long Term Retention Plan (LTRP)• Employee Share Plan (ESP)• Transformation Incentive Plan (TIP)
EXPENSES ARISING FROM SHARE-BASED PAYMENT TRANSACTIONSTotal expenses arising from share-based payment transactions recognised during the year as part of employee benefit expense were as follows:
2019 $’000
2018 $’000
Long term retention plan 3,957 6,427
Employee share plan 1,553 1,899
Transformation incentive plan 1,180 835
Total expenses arising from share-based payment transactions 6,690 9,161
Directors are not eligible to participate in the LTRP, the ESP or the TIP.
ACCOUNTING POLICY AND VALUATION
The fair value of performance rights granted are recognised as an employee benefit expense with a corresponding increase in reserves. The fair value is measured at grant date and recognised over the period during which employees become unconditionally entitled to the rights.
The fair value at grant date is determined as the present value of the fixed dollar amount of share rights to be issued. The calculation takes into account the fixed share rights’ dollar value, the rights’ term, the rights’ nontradable nature, the expected dividend yield and the riskfree interest rate for the rights’ term.
The fair value of the rights granted excludes the impact of any nonmarket vesting conditions (for example, continued employment). Nonmarket vesting conditions are included in assumptions about the number of rights that are expected to become exercisable and the length of the vesting period. At the reporting period’s end, the entity revises its estimate of the number of rights that are expected to become exercisable and the most likely vesting period. The employee benefit expense recognised each period takes into account the most recent estimate.
LONG TERM RETENTION PLAN (LTRP)
GENERAL TERMS
Invited participants are granted base rights, for no consideration, in annual tranches over a 12 year period with vesting conditions based upon continued service. At the time base rights are granted, participants are granted a corresponding number of matched rights for no consideration (one matched right for each base right granted).
Rights granted under the plan carry no dividend or voting rights. When exercisable, each right is convertible into one ordinary FLT share.
The plan’s rules stipulate that the number of shares resulting from exercising all unexercised rights cannot exceed 5% of the company’s issued capital (currently less than 1%).
VESTING REQUIREMENTS
Base rights granted to participants for each tranche will vest on the base rights vesting dates as noted in the table below, subject to the service condition being satisfied (participants remain employed by the company at the vesting date).
Matched rights granted to participants for each tranche will vest on the matched rights vesting dates as noted in the table below, subject to the service condition being satisfied (participants remain employed by the company at the vesting date) and the base rights (or shares) in respect of the respective grant continue to be held.
METHOD OF SETTLEMENT
The base rights and matched rights may be newly issued by FLT, purchased on-market or allocated from treasury shares.
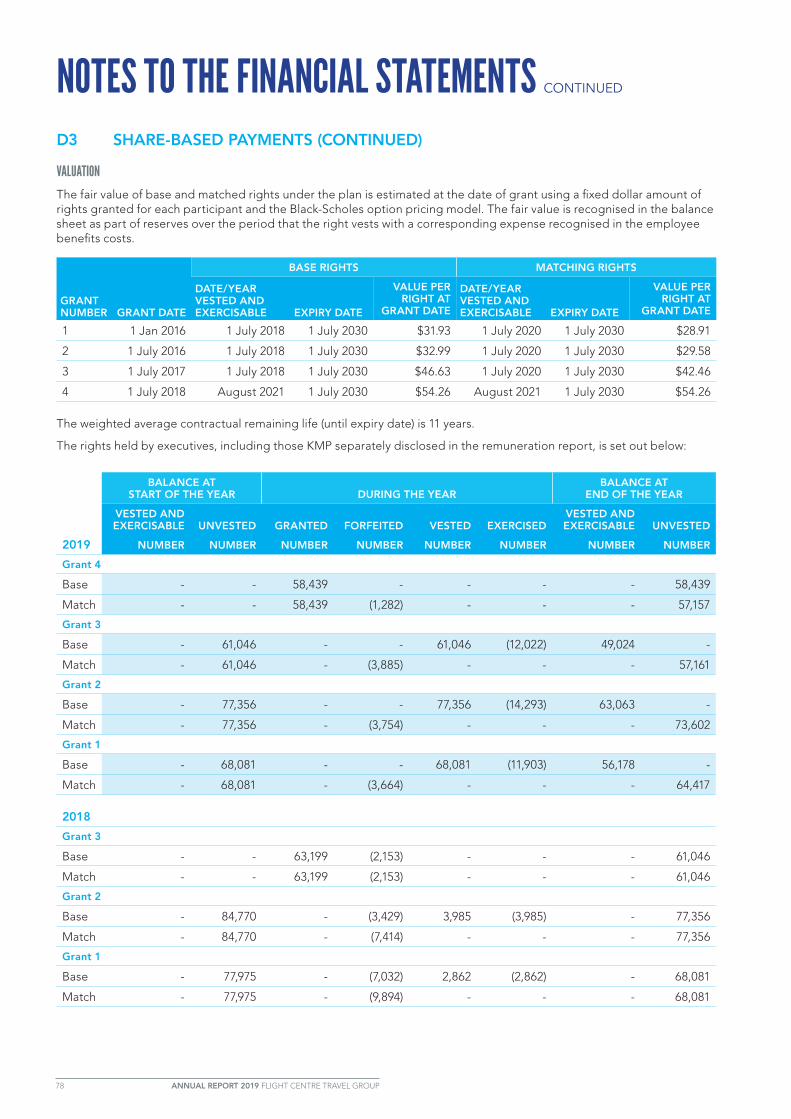
78 ANNUAL REPORT 2019 FLIGHT CENTRE TRAVEL GROUP
NOTES TO THE FINANCIAL STATEMENTS CONTINUED
D3 SHARE-BASED PAYMENTS (CONTINUED)
VALUATION
The fair value of base and matched rights under the plan is estimated at the date of grant using a fixed dollar amount of rights granted for each participant and the Black-Scholes option pricing model. The fair value is recognised in the balance sheet as part of reserves over the period that the right vests with a corresponding expense recognised in the employee benefits costs.
GRANT NUMBER GRANT DATE
BASE RIGHTS MATCHING RIGHTS
DATE/YEAR VESTED AND EXERCISABLE EXPIRY DATE
VALUE PER RIGHT AT
GRANT DATE
DATE/YEAR VESTED AND EXERCISABLE EXPIRY DATE
VALUE PER RIGHT AT
GRANT DATE
1 1 Jan 2016 1 July 2018 1 July 2030 $31.93 1 July 2020 1 July 2030 $28.91
2 1 July 2016 1 July 2018 1 July 2030 $32.99 1 July 2020 1 July 2030 $29.58
3 1 July 2017 1 July 2018 1 July 2030 $46.63 1 July 2020 1 July 2030 $42.46
4 1 July 2018 August 2021 1 July 2030 $54.26 August 2021 1 July 2030 $54.26
The weighted average contractual remaining life (until expiry date) is 11 years.
The rights held by executives, including those KMP separately disclosed in the remuneration report, is set out below:
2019
BALANCE AT START OF THE YEAR DURING THE YEAR
BALANCE AT END OF THE YEAR
VESTED AND EXERCISABLE UNVESTED GRANTED FORFEITED VESTED EXERCISED
VESTED AND EXERCISABLE UNVESTED
NUMBER NUMBER NUMBER NUMBER NUMBER NUMBER NUMBER NUMBER
Grant 4
Base - - 58,439 - - - - 58,439
Match - - 58,439 (1,282) - - - 57,157
Grant 3
Base - 61,046 - - 61,046 (12,022) 49,024 -
Match - 61,046 - (3,885) - - - 57,161
Grant 2
Base - 77,356 - - 77,356 (14,293) 63,063 -
Match - 77,356 - (3,754) - - - 73,602
Grant 1
Base - 68,081 - - 68,081 (11,903) 56,178 -
Match - 68,081 - (3,664) - - - 64,417
2018
Grant 3
Base - - 63,199 (2,153) - - - 61,046
Match - - 63,199 (2,153) - - - 61,046
Grant 2
Base - 84,770 - (3,429) 3,985 (3,985) - 77,356
Match - 84,770 - (7,414) - - - 77,356
Grant 1
Base - 77,975 - (7,032) 2,862 (2,862) - 68,081
Match - 77,975 - (9,894) - - - 68,081

ANNUAL REPORT 2019 FLIGHT CENTRE TRAVEL GROUP 79
D3 SHARE-BASED PAYMENTS (CONTINUED)EMPLOYEE SHARE PLAN (ESP)
GENERAL TERMS
Eligible employees are granted a conditional right to one matched share for every two shares purchased (for cash consideration), subject to vesting conditions.
Employees are eligible to participate if they have been employed full time or permanent part-time for at least three months.
VESTING REQUIREMENTS
A participant must hold the acquired shares for a period of two years and one month and still be employed with FLT at the end of that time. If acquired shares are sold before the end of the vesting period, conditional rights to the matched shares are forfeited.
METHOD OF SETTLEMENT
A participant who satisfies the vesting conditions will become entitled to the matched shares on the last day of the vesting period.
The matched shares may be newly issued by FLT, purchased on-market or allocated from treasury shares.
VALUATION – ACQUIRED SHARES
The market value of shares issued under the plan, measured as the weighted average price at which FLT’s shares are traded on the ASX during the five days following the date on which the contributions are paid, is recognised in the balance sheet as an issue of shares in the period the shares are acquired by the employee.
VALUATION – MATCHED SHARES
The fair value of matched shares allocated (but not issued) under the plan is estimated at the date of grant using the Black-Scholes option pricing model and is recognised in the balance sheet as part of reserves over the period that the matched share vests with a corresponding expense recognised in the employee benefits costs.
NUMBER OF MATCHED SHARES: NOTES 2019 2018
Allocated from the share trust to participating employees D4 39,530 13,200
Purchased on-market under the plan to participating employees 11,572 4,235
51,102 17,435
WEIGHTED AVERAGE MARKET PRICE OF MATCHED SHARES:
Allocated from share trust D4 $45.17 $50.06
Purchased on-market $42.82 $54.23
TRANSFORMATION INCENTIVE PLAN (TIP)
GENERAL TERMS
In March 2018, a long term incentive plan was approved by the Board. The TIP is designed to drive sustainable growth across the Group and remunerate key talent based on the Group’s five year growth targets, with performance hurdles aligned to the group transformation targets of 7% TTV cumulative annual growth rate (CAGR) and return to net margin of 2% by 2020-2022.
Rights granted under the plan carry no dividend or voting rights. When exercisable, each right is convertible into one ordinary FLT share.
The KMP and directors do not currently participate in the TIP.

80 ANNUAL REPORT 2019 FLIGHT CENTRE TRAVEL GROUP
NOTES TO THE FINANCIAL STATEMENTS CONTINUED
D3 SHARE-BASED PAYMENTS (CONTINUED)
VESTING REQUIREMENTS
Each performance right awarded is subject to the following vesting conditions:
• The participant must remain employed with FLT during the vesting period;• The participant must remain in a position of at least equal influence on the Group’s performance; and• Achievement of profit before tax targets by 2022.
METHOD OF SETTLEMENT
The maximum contractual term of the performance rights is four years and three months and there are no cash settlement alternatives for the participants. The ordinary shares may be newly issued by FLT, purchased on-market or allocated from treasury shares.
VALUATION
The rights were issued at no consideration. The assessed fair value at grant date was measured using the Black-Scholes method. The following table list the inputs to the model:
GRANT 1
Fair value at measurement date $46.70
Dividend yield (%) 3.92%
Exercise price ($) -
Risk-free interest rate (%) 2.48%
Expected life of performance rights (years) 4.32
Share price ($) $55.13
The fair value at grant date is recognised in the balance sheet as part of reserves over the period that the performance right vests with a corresponding expense recognised in the employee benefits costs.
MOVEMENTS DURING THE YEAR
GRANT DATE
EXPIRY DATE
BALANCE AT START
OF THE YEAR DURING THE YEAR
BALANCE AT END OF THE YEAR
VALUE PER RIGHT AT GRANT
DATE
WEIGHTED AVERAGE
REMAINING CONTRACTUAL
LIFE
UNVESTED BALANCE GRANTED FORFEITED VESTED UNVESTED
NUMBER NUMBER NUMBER NUMBER NUMBER
2019Grant 1
31/03/2018 30/06/2022 337,500 - (30,000) - 307,500 $46.70 3 years
2018Grant 11
31/03/2018 30/06/2022 - 337,500 - - 337,500 $46.70 4 years
No TIP rights were exercised during the period. No TIP rights were vested or exercisable at the end of the year.
1. The comparative figure was updated to reflect the maximum number of rights granted during the period.

ANNUAL REPORT 2019 FLIGHT CENTRE TRAVEL GROUP 81
D4 CONTRIBUTED EQUITY AND TREASURY SHARES
OVERVIEWTypically movements in contributed equity relate to shares issued under the ESP. This reinforces the importance that FLT places on ownership to drive business improvement and overall results. Where shares in FLT are acquired by on-market purchases prior to settling the vested entitlement, the cost of the acquired shares is carried as treasury shares and deducted from equity.
RECONCILIATION OF ORDINARY SHARE CAPITAL:The following reconciliation summarises the movements in authorised and issued capital during the year.
Issues of a similar nature have been grouped and the issue price shown is the weighted average. Detailed information on each issue of shares is publicly available via the ASX.
DETAILSNUMBER OF
SHARES
WEIGHTED AVERAGE
ISSUE PRICE $’000
Opening Balance 1 July 2017 101,048,815 402,759
ESP 24,836 $50.89 1,264
Closing Balance 30 June 2018 101,073,651 404,023
ESP 35,191 $45.58 1,603
Closing Balance 30 June 2019 101,108,842 405,626
RECONCILIATION OF TREASURY SHARES:The following reconciliation summarises the movements in treasury shares held in a share trust for future allocation to the employee share plan and LTRP.
Items of a similar nature have been grouped and the price shown is the weighted average.
DETAILSNUMBER OF
SHARES
WEIGHTED AVERAGE
ISSUE PRICE $’000
Opening Balance 1 July 2017 (53,114) (1,801)
Purchase of shares by share trust (263,547) $51.03 (13,449)
Allocation of shares to ESP 88,078 $49.11 4,326
Allocation of shares to ESP matched shares 13,200 $50.06 661
Allocation of shares to LTRP 6,847 $45.72 313
Gain/(loss) in equity on allocation of shares (984)
Closing Balance 30 June 2018 (208,536) (10,934)
Purchase of shares by share trust (143,669) $53.46 (7,698)
Allocation of shares to ESP 92,252 $46.70 4,308
Allocation of shares to ESP matched shares 39,530 $45.17 1,757
Allocation of shares to LTRP 5,344 $41.69 223
Gain/(loss) in equity on allocation of shares 351
Closing Balance 30 June 2019 (215,079) (11,993)
82 ANNUAL REPORT 2019 FLIGHT CENTRE TRAVEL GROUP
NOTES TO THE FINANCIAL STATEMENTS CONTINUED
E RELATED PARTIESThis section provides information relating to the FLT group related parties and the extent of related party transactions within the group and the impact they had on the group’s financial performance and position.
E1 Investments accounted for using the equity method
E2 Related party transactions
E1 INVESTMENTS ACCOUNTED FOR USING THE EQUITY METHOD
OVERVIEW
ASSOCIATES
During the period, the following changes occurred to FLT’s investments in associates:
• Biblos America LLC (Bibam) had a reorganisation of shareholdings and an overall reduction in the total number of shares issued resulting in FLT’s investment increasing to 28.8% (2018: 24.1%) with no additional shares acquired. Bibam is an Argentina based travel and technology group with a presence in the on and offline leisure, corporate and wholesale sectors.
• On 5 April 2019, FLT acquired 25% of The Upside Travel Company (Upside) for $56,203,0000. Upside is a Washington DC based, technology-driven business. FLT is Upside’s largest individual shareholder and this investment gives FLT access to a travel technology platform and software development resources that will enhance its already strong small to medium-sized (SME) corporate sector offering.
• FLT acquired the remaining 75% of both ETSC and 3mundi (refer note A6) and they are now accounted for as subsidiaries.
FLT continues to hold its investments in associate as follows:
• A 49% share in Ignite Travel Group Limited (Ignite). Ignite specialise in the development and distribution of innovative leisure market models including exclusively curated holiday packages, travel vouchers and rewards programs. Ignite are a group of private entities that are not listed on any public exchange. They are incorporated in Australia.
The contractual arrangements in place do not provide FLT with control nor joint control over the operating and financing decisions of the entities.
JOINT VENTURES
FLT holds investments in joint ventures as follows:
• A 50% shareholding in Pedal Group Pty Ltd. Significant shareholdings in Pedal Group include a 100% shareholding in 99 Bikes Pty Ltd, a Brisbane based national chain of retail bike stores, and a 100% shareholding in Advance Traders (Australia) Pty Ltd, a Brisbane based wholesale bike company. All companies are incorporated in Australia.
• A 51% shareholding in Go Vacation Vietnam Company Limited (GVVC) is held by Buffalo Tours One Member Vietnam Company Limited, a subsidiary of Buffalo Tours (Singapore) Pte Ltd. GVVC is a tour company incorporated in Vietnam. As part of the change in control on 1 January 2018, this is now shown as part of the FLT consolidated results as an investment in joint venture. Per the relevant agreements, Buffalo Tours only hold 50% voting rights in GVVC and hence have joint control over the entity’s economic activities, and therefore recognise this as an investment in a joint venture.
Contractual arrangements are in place to establish joint control over each entity’s economic activities, including financial and operating decisions.

ANNUAL REPORT 2019 FLIGHT CENTRE TRAVEL GROUP 83
E1 INVESTMENTS ACCOUNTED FOR USING THE EQUITY METHOD (CONTINUED)
SHARE OF JOINT VENTURE AND ASSOCIATES CARRYING VALUE AND RESULTSJoint venture and associates information is presented in accordance with the accounting policy described in note I(c)(ii) and is set out below.
2019 $’000
2018 $’000
Interest in joint ventures 15,629 13,349
Interest in associates 69,920 25,621
Total 85,549 38,970
SHARE OF RESULTS2019
$’0002018
$’000
Profit from joint ventures 2,213 3,635
(Loss) / profit from associates (1,066) (1,395)
Total comprehensive income 1,147 2,240
CONTRACTUAL COMMITMENTS
3MUNDI
As part of the initial 25% investment in 3mundi, FLT entered into a put and call option with the 3mundi shareholders over the remaining 75% of 3mundi’s share capital.
This was exercised and on 30 June 2019 FLT acquired the remaining 75%. Refer to note A4 for details of the business combination.
IGNITE
The original share sale agreement and subsequent amendments negotiated with Ignite contained multiple tranches with FLT ultimately gaining control of the business. This agreement is currently being re-negotiated in good faith by both parties with final terms and conditions yet to be finalised. As at 30 June 2019, no liability has been accrued for the future acquisition of the remaining 51% interest of Ignite.
FLT has no other commitments in relation to its joint venture and associate entities at 30 June 2019.

84 ANNUAL REPORT 2019 FLIGHT CENTRE TRAVEL GROUP
NOTES TO THE FINANCIAL STATEMENTS CONTINUED
E2 RELATED PARTY TRANSACTIONS
PARENT ENTITYFLT is the ultimate parent entity within the group.
SUBSIDIARIES AND JOINT VENTURESInterests in subsidiaries are set out in note G1 and interests in joint ventures and associate are set out in note E1.
Transactions between FLT and Buffalo Tours (31 December 2017), ETSC (7 April 2019) and 3mundi (29 June 2019) are disclosed as related party transactions up until the dates noted above, after which they became subsidiaries, and as such are no longer included in the below disclosures as all transactions eliminate on consolidation.
FLT is a joint venture (JV) partner in Pedal Group Pty Ltd. The other JV partners are related parties, namely Graham Turner’s family company, Gainsdale Pty Ltd 22.51% (June 2018: 22.51%), and Graham Turner’s son, Matthew Turner’s family company Hootie Blowfish Pty Ltd 15.85% (June 2018: 15.79%). The remaining 11.64% (June 2018: 11.70%) is held by other minor parties including employees who are not considered related parties.
KMP COMPENSATION AND OTHER TRANSACTIONSKMP disclosures are set out in note D1.
TRANSACTIONS WITH RELATED PARTIES
Income from joint venture & associate-related parties2019
$2018
$
Management fees 111,998 6,950
Travel and conference 296,805 313,474
Advertising and marketing 2,593 403
IT services 521,580 -
Interest income - 17,468
Override income 1,469,471 424,906
Other 101,543 87,870
Expenses to joint venture & associate-related parties
Management fees 231,282 -
Overrides 1,077,149 -
Other - 36,904
Income from director-related entities
Marketing 151,700 385,250
Travel and conference 172,374 93,161
Other 14,175 -
Expenses to director-related entities
Conference expense 124,123 170,368
From time to time, related entities may enter into transactions with FLT. These transactions are on the same terms and conditions as those entered into by other FLT subsidiaries or customers.
Joint venture and associate related parties can choose to use FLT group purchasing ability and any costs incurred are passed directly through. These transactions are included in the disclosure above.
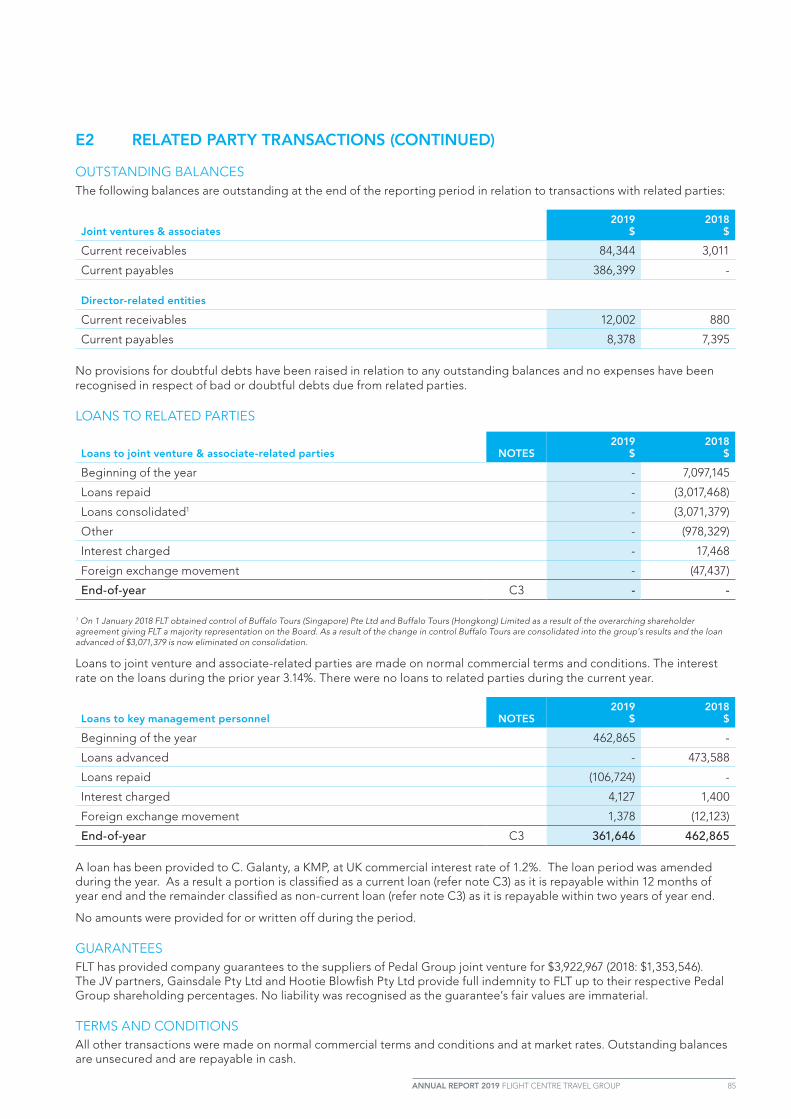
ANNUAL REPORT 2019 FLIGHT CENTRE TRAVEL GROUP 85
E2 RELATED PARTY TRANSACTIONS (CONTINUED)
OUTSTANDING BALANCESThe following balances are outstanding at the end of the reporting period in relation to transactions with related parties:
Joint ventures & associates2019
$2018
$
Current receivables 84,344 3,011
Current payables 386,399 -
Director-related entities
Current receivables 12,002 880
Current payables 8,378 7,395
No provisions for doubtful debts have been raised in relation to any outstanding balances and no expenses have been recognised in respect of bad or doubtful debts due from related parties.
LOANS TO RELATED PARTIES
Loans to joint venture & associate-related parties NOTES2019
$2018
$
Beginning of the year - 7,097,145
Loans repaid - (3,017,468)
Loans consolidated1 - (3,071,379)
Other - (978,329)
Interest charged - 17,468
Foreign exchange movement - (47,437)
End-of-year C3 - -
1 On 1 January 2018 FLT obtained control of Buffalo Tours (Singapore) Pte Ltd and Buffalo Tours (Hongkong) Limited as a result of the overarching shareholder agreement giving FLT a majority representation on the Board. As a result of the change in control Buffalo Tours are consolidated into the group’s results and the loan advanced of $3,071,379 is now eliminated on consolidation.
Loans to joint venture and associate-related parties are made on normal commercial terms and conditions. The interest rate on the loans during the prior year 3.14%. There were no loans to related parties during the current year.
Loans to key management personnel NOTES2019
$2018
$
Beginning of the year 462,865 -
Loans advanced - 473,588
Loans repaid (106,724) -
Interest charged 4,127 1,400
Foreign exchange movement 1,378 (12,123)
End-of-year C3 361,646 462,865
A loan has been provided to C. Galanty, a KMP, at UK commercial interest rate of 1.2%. The loan period was amended during the year. As a result a portion is classified as a current loan (refer note C3) as it is repayable within 12 months of year end and the remainder classified as non-current loan (refer note C3) as it is repayable within two years of year end.
No amounts were provided for or written off during the period.
GUARANTEESFLT has provided company guarantees to the suppliers of Pedal Group joint venture for $3,922,967 (2018: $1,353,546). The JV partners, Gainsdale Pty Ltd and Hootie Blowfish Pty Ltd provide full indemnity to FLT up to their respective Pedal Group shareholding percentages. No liability was recognised as the guarantee’s fair values are immaterial.
TERMS AND CONDITIONSAll other transactions were made on normal commercial terms and conditions and at market rates. Outstanding balances are unsecured and are repayable in cash.

86 ANNUAL REPORT 2019 FLIGHT CENTRE TRAVEL GROUP
NOTES TO THE FINANCIAL STATEMENTS CONTINUED
F OTHER INFORMATIONThis section provides the remaining information relating to the FLT financial report that must be disclosed to comply with the accounting standards and other pronouncements.
F1 Other expenses • Employee benefits • Rent expense • Operating lease commitments
F2 Earnings per share
F3 Trade and other receivables and other assets
F4 Contract assets
F5 Property, plant and equipment
F6 Trade and other payables
F7 Deferred revenue
F8 Provisions
F9 Reserves
F10 Tax
F11 Auditor's remuneration
F12 Seasonality
F1 OTHER EXPENSESThis note sets out other expenses, which have not been previously disclosed.
EMPLOYEE BENEFITS EXPENSE
2019 $’000
2018 $’000
RESTATED1
Defined contribution superannuation expense 80,159 77,103
Other employee benefits expense 1,511,806 1,433,794
Total employee benefits expense 1,591,965 1,510,897
Staff numbers2 19,993 20,257
In addition to the employee benefits expense disclosed above, ‘Tour & hotel operations - Cost of sales’ in the income statement includes $2,879,000 (2018: $3,667,000) relating to employee costs directly attributable to the delivery of tour and hotel services.
RENTAL EXPENSE RELATING TO OPERATING LEASES
Rent expense3 165,616 167,887
Sales teams2 2,832 2,882
1 Refer to note I(b) for details regarding the restatements for changes in accounting policies on adoption of AASB 15.2 Staff and sales teams are unaudited, non-IFRS, non-financial information. This information has been included to aid understanding of the relevant balances. The balances represent the number at the end of the period.3 Elements of rental expense are contingent upon such factors as CPI growth or fixed % increases (as stated in the lease agreement) and individual shop turnover. Total rental expense includes all elements of rent, including those that are contingent to the extent known.

ANNUAL REPORT 2019 FLIGHT CENTRE TRAVEL GROUP 87
F1 OTHER EXPENSES (CONTINUED)
OPERATING LEASE COMMITMENTSThe following table sets out FLT’s commitments for operating leases. These are not required to be recognised in the current year’s results and do not form part of other expenses noted above.
Commitments for minimum lease payments in relation to non-cancellable operating leases are payable as follows:
2019 $’000
2018 $’000
Within one year 158,088 134,465
Later than one year but not later than five years 369,779 353,558
Later than five years 152,311 146,191
Total operating lease commitments 680,178 634,214
The operating leases above relate primarily to occupancy leases of varying terms, generally between five and seven years, and have escalation clauses and renewal rights. Included in the above, are rental payments including escalation based on fixed dollar or percentage increases, as stated in the lease agreement.
F2 EARNINGS PER SHARE
OVERVIEWStatutory earnings per share (EPS) reached 261.6 cents (20181: 261.1 cents), up 0.2% on the prior comparative period. At an underlying level2, EPS decreased 5.4% to 264.0 cents (20181: 279.1 cents).
BASIC EARNINGS PER SHARE2019
CENTS
2018 CENTS
RESTATED1
Profit attributable to the company’s ordinary equity holders 261.6 261.1
DILUTED EARNINGS PER SHARE
Profit attributable to the company’s ordinary equity holders 260.2 259.9
RECONCILIATIONS OF EARNINGS USED IN CALCULATING EPS $’000 $’000
Profit attributable to the company’s ordinary equity holders used in calculating basic and diluted earnings per share
263,825 263,577
WEIGHTED AVERAGE NUMBER OF SHARES USED AS THE DENOMINATOR NUMBER NUMBER
Weighted average number of ordinary shares used as the denominator in calculating basic earnings per share3 100,836,225 100,943,195
Adjustments for calculation of diluted earnings per share:
Share rights 559,985 474,856
Weighted average number of ordinary shares and potential ordinary shares used as the denominator in calculating diluted earnings per share
101,396,210 101,418,051
1 Refer to note I(b) for details regarding the restatements for changes in accounting policies on adoption of AASB 15.2 Underlying EPS are un-audited, non-IFRS measures. Refer to note B6 for breakdown of underlying NPAT used in the calculation of underlying EPS.3 The basic EPS denominator is the aggregate of the weighted average number of ordinary shares after deduction of the weighted average number of treasury shares outstanding during the period.

88 ANNUAL REPORT 2019 FLIGHT CENTRE TRAVEL GROUP
NOTES TO THE FINANCIAL STATEMENTS CONTINUED
F2 EARNINGS PER SHARE (CONTINUED)
INFORMATION CONCERNING THE CLASSIFICATION OF SECURITIES
LTRP, ESP & TIP
Rights granted under the LTRP and entitlements to matched shares under the ESP are considered contingently issuable ordinary shares as at 30 June 2019. They are included in the determination of diluted earnings per share to the extent to which they are dilutive, based on the number of shares that would be issuable if the end of the period were the end of the contingency period.
Rights granted under the TIP are considered contingently issuable ordinary shares if the performance condition is satisfied at the balance sheet date. They are included in the determination of diluted earnings per share to the extent to which they are dilutive. At 30 June 2019, the performance conditions are not satisfied and as such are not included as part of the weighted average number of ordinary shares and potential ordinary shares used as the denominator in calculating diluted earnings per share.
The rights are not included in the determination of basic earnings per share. Details of the incentive plans are set out in note D3.
F3 TRADE RECEIVABLES AND OTHER ASSETS
2019 $’000
2018 $’000
RESTATED1
Trade receivables 572,940 536,995
Less: Provision for impairment of receivables (13,520) (11,948)
Total trade and other receivables 559,420 525,047
GST receivable 2,301 5,854
Prepayments 53,978 50,285
Fulfillment assets 13,401 16,758
Total other assets 69,680 72,897
1 Refer to note I(b) for details regarding the restatements for changes in accounting policies on adoption of AASB 15.
ACCOUNTING POLICY
FLT has applied the simplified approach for provisioning for expected credit losses prescribed by AASB 9. Additional information on trade and other receivables accounting policies is included in note I(a) and I(m).
FINANCIAL RISK MANAGEMENT
MARKET RISK
Interest rate risk
Receivables are generally non-interest bearing and are not, therefore, subject to interest rate risk. The exception is other receivables, which generally arise from transactions outside the group’s usual operating activities. Interest may be charged at commercial rates where the repayment terms exceed six months. Collateral is not normally obtained.
Foreign exchange risk
The group operates internationally and is subject to foreign exchange risk arising from exposure to foreign currencies.
In addition to identifying foreign exchange risk likely to arise from future commercial transactions, group treasury recognises assets and liabilities in foreign currencies and, where appropriate, uses forward exchange contracts to reduce foreign currency risk. All contracts expire within 12 months.

ANNUAL REPORT 2019 FLIGHT CENTRE TRAVEL GROUP 89
F3 TRADE RECEIVABLES AND OTHER ASSETS (CONTINUED)The group’s exposure to foreign currency risk at the end of the reporting period is set out below in Australian dollars:
TRADE RECEIVABLES2019
$’000
2018 $’000
RESTATED1
US Dollars 4,501 9,131
Euro 3,448 3,013
Great Britain Pounds 1,858 2,185
Other 3,429 2,469
Foreign exchange risk on trade payables is set out in note F6.
FAIR VALUE
Due to the short-term nature of these receivables, their carrying amount is assumed to approximate their fair value.
CREDIT RISK
Credit risk arises from exposure to corporate and retail customers, including outstanding receivables and committed transactions.
Credit risk management assesses corporate clients’ credit quality by analysing external credit ratings and financial position where appropriate. Individual risk limits are established for all corporate customers, in accordance with corporate credit policy, with regular monitoring and reporting to management. Sales to retail customers are settled in cash or via major credit cards, mitigating credit risk.
The maximum exposure to credit risk at the reporting period’s end is the receivables carrying amount. The group does not hold collateral as security and evaluates the concentration of risk in respect of receivables as low, as its customers are located in many locations, industries and markets.
PROVISION FOR IMPAIRMENT OF RECEIVABLES
Movements in the provision for impairment of receivables are as follows:2019
$’000
2018 $’000
RESTATED1
At 1 July 2018 11,948 11,604
Bad debts expense2 10,937 6,238
Changes due to foreign exchange translation 374 (72)
Receivables written off during the year as uncollectible (9,739) (5,822)
At 30 June 2019 13,520 11,948
1 Refer to note I(b) for details regarding the restatements for changes in accounting policies on adoption of AASB 15.2 The creation and release of the provision for impairment of receivables is included in other expenses in the statement of profit or loss.
F4 CONTRACT ASSETS
2019 $’000
2018 $’000
Volume incentive receivables 294,922 266,339
Accrued revenue 65,838 59,848
Loss allowance (4,636) (3,498)
Total contract assets 356,124 322,689

90 ANNUAL REPORT 2019 FLIGHT CENTRE TRAVEL GROUP
NOTES TO THE FINANCIAL STATEMENTS CONTINUED
F4 CONTRACT ASSETS (CONTINUED)
ACCOUNTING POLICY
A contract asset is the right to consideration in relation to volume incentive payments received from suppliers for achieving annual targets and other services transferred to the customer (under AASB 15) in advance of payment. If services are transferred to a customer before the customer pays consideration or before payment is due, a contract asset is recognised for the earned consideration that is conditional.
Refer to note A2 for accounting policy on recognition of volume incentive receivables.
SIGNIFICANT CHANGES IN CONTRACT ASSETSThe movement in contract assets each period is dependent on the contract period, volume, tier levels, rebate rates and payment terms as negotiated with each individual supplier.
FINANCIAL RISK MANAGEMENT
MARKET RISK
Interest rate risk
Contract assets are generally non-interest bearing and are not, therefore, subject to interest rate risk. Collateral is not normally obtained.
Foreign exchange risk
The group operates internationally and is subject to foreign exchange risk arising from exposure to foreign currencies.
In addition to identifying foreign exchange risk likely to arise from future commercial transactions, group treasury recognises assets and liabilities in foreign currencies and, where appropriate, uses forward exchange contracts to reduce foreign currency risk. All contracts expire within 12 months.
The group’s exposure to foreign currency risk at the end of the reporting period is set out below in Australian dollars:
CONTRACT ASSETS2019
$’0002018
$’000
US Dollars 70,113 51,462
Euro 4,434 1,813
NZ Dollars 2,367 535
Thai Baht 2,237 1,304
Fijian Dollars 2,209 1,069
Great Britain Pounds 1,610 839
Other 2,467 1,838
Fair value
Due to the short-term nature of these assets, their carrying amount is assumed to approximate their fair value.
CREDIT RISK
Credit risk arises from exposure to suppliers, corporate and retail customers, including outstanding receivables and committed transactions.
Credit risk management assesses supplier and corporate clients’ credit quality by analysing external credit ratings and financial position where appropriate. Individual risk limits are established for all supplier and corporate customers, in accordance with corporate credit policy, with regular monitoring and reporting to management. Sales to retail customers are settled in cash or via major credit cards, mitigating credit risk.
The maximum exposure to credit risk at the reporting period’s end is the contract assets carrying amount. The group does not hold collateral as security and evaluates the concentration of risk in respect of contract assets as low, as its customers are located in many locations, industries and markets.

ANNUAL REPORT 2019 FLIGHT CENTRE TRAVEL GROUP 91
F4 CONTRACT ASSETS (CONTINUED)
LOSS ALLOWANCE OF CONTRACT ASSETS
Movements in the loss allowance of contract assets are as follows:2019
$’0002018
$’000
At 1 July 2018 3,498 1,518
Loss allowance expense 1,001 2,011
Changes due to foreign exchange translation 137 (31)
At 30 June 2019 4,636 3,498
F5 PROPERTY, PLANT AND EQUIPMENT
ACCOUNTING POLICY
USEFUL LIVESLand is not depreciated. For other assets, depreciation is calculated using the straight-line method to allocate their cost or revalued amounts, net of their residual values, over their estimated useful lives, as follows:
• Buildings 30 years• Plant and equipment 2 - 8 years
The assets’ residual values and useful lives are reviewed and adjusted if appropriate at each reporting period’s end.
Additional information on property, plant and equipment accounting policies is included in note I(n).
Opening balance at 1 July 2017 NOTES
FREEHOLD LAND &
BUILDINGS $’000
PLANT & EQUIPMENT
$’000TOTAL $’000
Cost 33,087 528,446 561,533Accumulated depreciation (7,867) (297,470) (305,337)Net book amount at 1 July 2017 25,220 230,976 256,196
Additions 399 51,956 52,355Acquisitions - 4,471 4,471Disposals1 - (3,003) (3,003)Depreciation expense (1,028) (63,194) (64,222)Exchange differences (111) 1,868 1,757Net book amount at 30 June 2018 24,480 223,074 247,554
Opening balance at 1 July 2018
Cost 33,355 551,258 584,613Accumulated depreciation (8,875) (328,184) (337,059)Net book amount at 1 July 2018 24,480 223,074 247,554
Additions - 53,352 53,352Acquisitions A6 - 475 475Disposals1 - (3,358) (3,358)Depreciation expense (837) (62,232) (63,069)Exchange differences 203 4,711 4,914Net book amount at 30 June 2019 23,846 216,022 239,868At 30 June 2019
Cost 33,611 592,360 625,971
Accumulated depreciation (9,765) (376,338) (386,103)Net book amount at 30 June 2019 23,846 216,022 239,868
1 Balances shown net of accumulated depreciation.

92 ANNUAL REPORT 2019 FLIGHT CENTRE TRAVEL GROUP
NOTES TO THE FINANCIAL STATEMENTS CONTINUED
F6 TRADE AND OTHER PAYABLES
CURRENT2019
$’000
2018 $’000
RESTATED1
Trade payables 485,463 480,365
Client creditors 972,575 967,967
Accrued unsecured note interest 3,089 2,836
Annual leave 46,722 45,192
Straight-line lease & lease incentive liability 9,996 9,213
Total current trade payables 1,517,845 1,505,573
NON-CURRENT
Straight-line lease & lease incentive liability 59,530 60,427
Total non-current trade payables 59,530 60,427
1 Refer to note I(b) for details regarding the restatements for changes in accounting policies on adoption of AASB 15.
FINANCIAL RISK MANAGEMENT
MARKET RISK
Foreign exchange risk
The group’s exposure to foreign currency risk on trade and other payables at the end of the reporting period is set out below:
2019 $’000
2018 $’000
US Dollars 217,774 242,572
Euro 60,306 60,723
Fijian Dollars 27,322 24,644
Great Britain Pounds 18,819 18,403
NZ Dollars 16,228 16,187
Hong Kong Dollars 16,071 4,397
Thai Baht 16,001 17,720
Singapore Dollars 10,464 10,405
Canadian Dollars 9,723 11,976
French Polynesian Franc 2,904 3,494
UAE Dirham 2,709 3,077
Japanese Yen 2,547 4,477
Other 13,021 9,870
Refer to note F3 for the group’s approach to foreign exchange risk and the group’s exposure to foreign currency risk on trade receivables.
FAIR VALUE
The trade and other payables’ carrying amounts are assumed to approximate their fair values given their short term nature.

ANNUAL REPORT 2019 FLIGHT CENTRE TRAVEL GROUP 93
F7 DEFERRED REVENUE
CURRENT2019
$’0002018
$’000
Deferred revenue 68,660 74,748
Total deferred revenue 68,660 74,748
NON-CURRENT
Deferred revenue 48,469 55,721
Total deferred revenue 48,469 55,721
ACCOUNTING POLICY
Deferred revenue typically relates to revenue for tours and lump sum payments from suppliers. It represents revenue received in advance of the completion of the performance obligation under the contract. It is recognised when the consideration is received or is due (whichever is earlier).
Deferred revenue is released to the statement of profit or loss over time as the performance obligation is met.
SIGNIFICANT CHANGES IN DEFERRED REVENUEThe movement in deferred revenue is dependent on timing and volume of tours at each reporting period and any significant lump sum payments received within a contract period. Revenue released from opening deferred revenue to the statement of profit or loss during FY19 was $73,718,000.
F8 PROVISIONS
CURRENT NOTES2019
$’0002018
$’000
Employee benefits - long service leave 39,113 36,593
Employee benefits - BOS Multiplier D2 15,501 11,622
Make good provision 280 448
Total current provisions 54,894 48,663
NON-CURRENT
Employee benefits - long service leave 21,675 17,682
Employee benefits 3,700 533
Make good provision 22,723 22,706
Total non-current provisions 48,098 40,921
MOVEMENTS IN PROVISIONS
Movements in each class of provision, other than employee benefits, for the financial year are set out below:
MAKE GOOD PROVISION NOTES2019
$’000
Carrying amount at start of year 23,154
Additional provisions recognised 424
(Decrease) / increase in discounted amount arising from passage of time and discount rate adjustments
A4 637
Utilised (1,352)
Other changes 140
Carrying amount at end of year 23,003

94 ANNUAL REPORT 2019 FLIGHT CENTRE TRAVEL GROUP
NOTES TO THE FINANCIAL STATEMENTS CONTINUED
F8 PROVISIONS (CONTINUED)
LONG SERVICE LEAVE (LSL)
AMOUNTS NOT EXPECTED TO BE SETTLED WITHIN 12 MONTHS
The current portion of the LSL provision represents the amount where the group does not have an unconditional right to defer settlement for at least 12 months after the reporting date, as the employees have completed the required service period and also certain circumstances where employees are entitled to pro-rata payments. However, based on past experience, the group does not expect all employees to take the full amount of accrued long service leave or require payment within the next 12 months.
The following amounts reflect this leave that is not expected to be taken or paid within the next 12 months:
2019 $’000
2018 $’000
Long service leave obligations expected to be settled after 12 months 32,801 28,633
F9 RESERVES
RESERVES
2019 $’000
2018 $’000
RESTATED1
Cashflow hedge reserve 82 1,275
Financial assets at FVOCI reserve 321 550
Share-based payments reserve 25,532 28,119
Acquisition Reserve (39,291) (13,725)
Foreign currency translation reserve 28,808 (7,789)
Total reserves 15,452 8,430
Total reserves includes $55,000 (2018: $306,000) attributable to non-controlling interests as outlined in the statement of comprehensive income and statement of contributed equity.
MOVEMENTS IN RESERVES:
CASH FLOW HEDGE RESERVE
NOTES2019
$’0002018
$’000
Balance 1 July 1,275 (428)
Gains/(losses) on cash flow hedges (1,538) 2,347
Deferred tax F10 345 (644)
Balance 30 June 82 1,275
FLT apply hedge accounting under AASB 9 Financial Instruments. See note C2 for further details.
The cash flow hedge reserve is used to record gains or losses on hedging instruments on a cash flow hedge that are recorded as other comprehensive income. Amounts are reclassified to the statement of profit or loss in accordance with our hedging policy as described in note C2.
Ineffectiveness of $123,000 (2018: $1,060,000) has been recognised in the statement of profit or loss.

ANNUAL REPORT 2019 FLIGHT CENTRE TRAVEL GROUP 95
F9 RESERVES (CONTINUED)
FINANCIAL ASSETS AT FVOCI REVALUATION RESERVE
NOTES2019
$’0002018
$’000
Balance 1 July 550 434
Revaluation gross (231) 38
Deferred tax F10 2 78
Balance 30 June 321 550
Changes in the fair value and exchange differences arising on translation of investments that are classified as financial assets at FVOCI are recognised in other comprehensive income, as described in note I(k), and accumulated in a separate reserve within equity. Amounts are reclassified to profit or loss when the associated assets are sold or impaired.
SHARE-BASED PAYMENTS RESERVE
NOTES2019
$’0002018
$’000
Balance 1 July 28,119 17,472
Share-based payments expense 4,176 8,885
Treasury share transactions (2,605) 10
Deferred tax F10 (4,158) 1,752
Balance 30 June 25,532 28,119
The share-based payments reserve is used to recognise the fair value of rights issued under the LTRP, ESP and TIP as they vest over the vesting period.
ACQUISITION RESERVE
2019 $’000
2018 $’000
Balance 1 July (13,725) (8,976)
Put/Call options entered into as a result of business combinations - (6,373)
Gain on change in interest ownership of NCI (25,566) -
Derecognition of NCI on acquisition - 1,624
Balance 30 June (39,291) (13,725)
The acquisition reserve is used to record the initial Put/Call Options that occur through business combinations in relation to non-controlling interests. Gains/(losses) on change in interest ownership of NCI must be recognised in equity, FLT has elected to recognise this in the acquisition reserve.
FLT obtained control of Buffalo Tours (Singapore) Pte Ltd and Buffalo Tours (Hongkong) Limited on 1 January 2018 as a result of the overarching shareholder agreement giving FLT a majority representation on the Board. On 4 July 2018, FLT acquired the remaining 41.5% of Buffalo Tours (Singapore) Pte Ltd and Buffalo Tours (Hongkong) Limited for cash consideration of $25,074,000. The investment increases FLT’s ownership to 100% of both subsidiaries. Immediately prior to the transaction the non-controlling interest was carried at $3,138,000. FLT recognised the difference between the carrying value of the non-controlling interests and the consideration directly in acquisition reserves.
On 29 May 2019, FLT acquired the remaining 32.99% of Back Roads Touring Co. for $4,700,000. The acquisition increases FLT’s ownership to 100%. Immediately prior to the transaction the non-controlling interest was carried at $1,070,000. FLT recognised the difference between the carrying value of the non-controlling interests and the consideration directly in acquisition reserves.
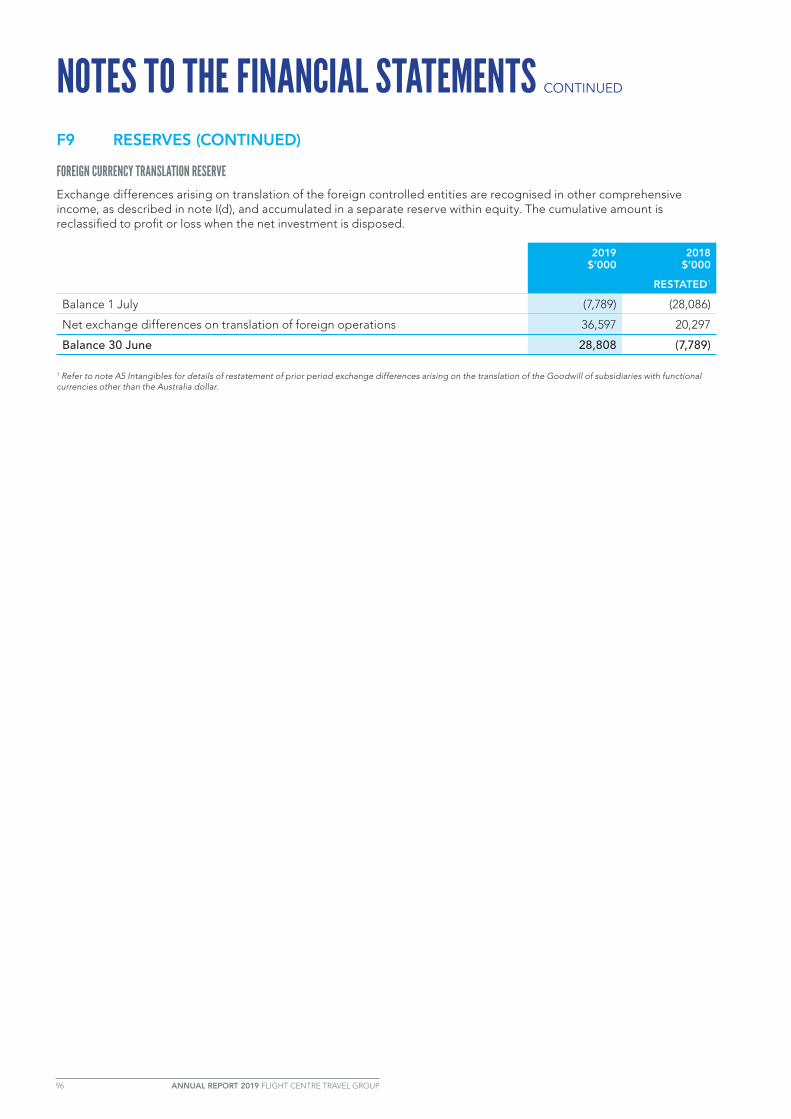
96 ANNUAL REPORT 2019 FLIGHT CENTRE TRAVEL GROUP
NOTES TO THE FINANCIAL STATEMENTS CONTINUED
F9 RESERVES (CONTINUED)
FOREIGN CURRENCY TRANSLATION RESERVE
Exchange differences arising on translation of the foreign controlled entities are recognised in other comprehensive income, as described in note I(d), and accumulated in a separate reserve within equity. The cumulative amount is reclassified to profit or loss when the net investment is disposed.
2019 $’000
2018 $’000
RESTATED1
Balance 1 July (7,789) (28,086)
Net exchange differences on translation of foreign operations 36,597 20,297
Balance 30 June 28,808 (7,789)
1 Refer to note A5 Intangibles for details of restatement of prior period exchange differences arising on the translation of the Goodwill of subsidiaries with functional currencies other than the Australia dollar.
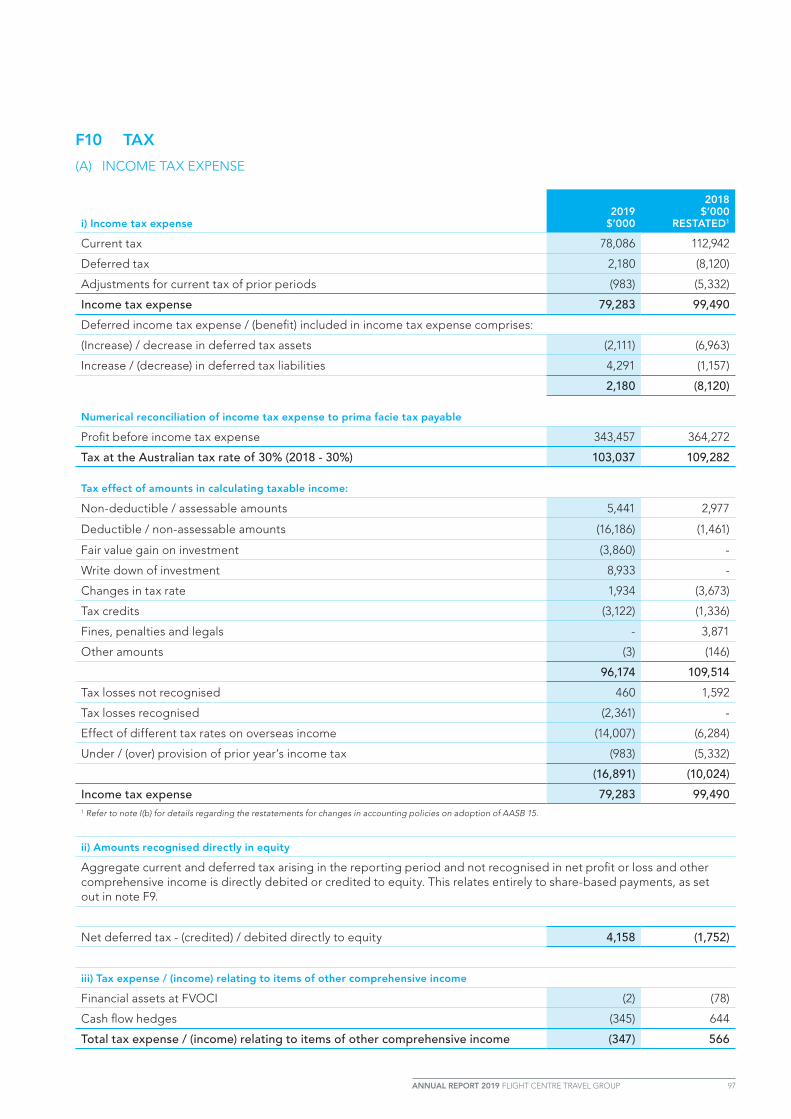
ANNUAL REPORT 2019 FLIGHT CENTRE TRAVEL GROUP 97
F10 TAX
(A) INCOME TAX EXPENSE
i) Income tax expense2019
$’000
2018 $’000
RESTATED1
Current tax 78,086 112,942
Deferred tax 2,180 (8,120)
Adjustments for current tax of prior periods (983) (5,332)
Income tax expense 79,283 99,490
Deferred income tax expense / (benefit) included in income tax expense comprises:
(Increase) / decrease in deferred tax assets (2,111) (6,963)
Increase / (decrease) in deferred tax liabilities 4,291 (1,157)
2,180 (8,120)
Numerical reconciliation of income tax expense to prima facie tax payable
Profit before income tax expense 343,457 364,272
Tax at the Australian tax rate of 30% (2018 - 30%) 103,037 109,282
Tax effect of amounts in calculating taxable income:
Non-deductible / assessable amounts 5,441 2,977
Deductible / non-assessable amounts (16,186) (1,461)
Fair value gain on investment (3,860) -
Write down of investment 8,933 -
Changes in tax rate 1,934 (3,673)
Tax credits (3,122) (1,336)
Fines, penalties and legals - 3,871
Other amounts (3) (146)
96,174 109,514
Tax losses not recognised 460 1,592
Tax losses recognised (2,361) -
Effect of different tax rates on overseas income (14,007) (6,284)
Under / (over) provision of prior year’s income tax (983) (5,332)
(16,891) (10,024)
Income tax expense 79,283 99,4901 Refer to note I(b) for details regarding the restatements for changes in accounting policies on adoption of AASB 15.
ii) Amounts recognised directly in equity
Aggregate current and deferred tax arising in the reporting period and not recognised in net profit or loss and other comprehensive income is directly debited or credited to equity. This relates entirely to share-based payments, as set out in note F9.
Net deferred tax - (credited) / debited directly to equity 4,158 (1,752)
iii) Tax expense / (income) relating to items of other comprehensive income
Financial assets at FVOCI (2) (78)
Cash flow hedges (345) 644
Total tax expense / (income) relating to items of other comprehensive income (347) 566

98 ANNUAL REPORT 2019 FLIGHT CENTRE TRAVEL GROUP
NOTES TO THE FINANCIAL STATEMENTS CONTINUED
F10 TAX (CONTINUED)
iv) Unrecognised potential deferred tax assets2019
$’0002018
$’000
Unused tax losses for which no deferred tax asset has been recognised (non-capital) 762 15,982
Temporary differences relating to brand name impairment (capital) and other intangibles
42,476 42,289
Other 3,394 2,800
46,632 61,071
Potential tax benefit at 30% (2018 - 30%) 13,990 18,321
Unused tax losses in 2019 were incurred by entities in Hong Kong, Indonesia, Thailand and USA (2018: Australia, Hong Kong, Mexico, Malaysia, Philippines and Singapore). In most cases, the unused tax losses have no expiry date. 1 Refer to note I(b) for details regarding the restatements for changes in accounting policies on adoption of AASB 15.
(B) DEFERRED TAX ASSETS (DTA)
The balance comprises temporary differences attributable to:2019
$’000
2018 $’000
RESTATED1
Employee benefits 36,674 33,786
Property, plant and equipment and intangibles 22,097 15,018
Leasing 18,446 17,480
Accruals 6,467 9,318
Losses 7,521 4,097
Provisions 1,856 217
Doubtful debts 3,510 3,824
Trade and other receivables 4,432 4,387
Other 1,936 7,786
102,939 95,913
Set-off of deferred tax liabilities pursuant to set-off provisions (30,889) (26,321)
Net deferred tax assets 72,050 69,592
All movements in DTA were recognised in the statement of profit or loss and other comprehensive income, with the exception of items stated in note F10(a)(ii) and (iii).
(C) DEFERRED TAX LIABILITIES (DTL)
The balance comprises temporary differences attributable to:2019
$’0002018
$’000
Trade and other receivables 21,763 22,064
Property, plant and equipment and intangibles 15,445 13,981
Leasing 5,346 317
Other 4,703 2,036
47,257 38,398
Set-off of deferred tax liabilities pursuant to set-off provisions (30,889) (26,321)
Net deferred tax liabilities 16,368 12,077
All movements in DTL were recognised in the statement of profit or loss and other comprehensive income, with the exception of items stated in note F10 (a)(iii). 1 Refer to note I(b) for details regarding the restatements for changes in accounting policies on adoption of AASB 15.

ANNUAL REPORT 2019 FLIGHT CENTRE TRAVEL GROUP 99
F11 AUDITOR’S REMUNERATIONDuring the year, the following fees were paid or payable for services provided by the Lead Auditor of the consolidated entity, its related practices and non-related audit firms:
AMOUNTS RECEIVED OR DUE AND RECEIVABLE BY ERNST & YOUNG FOR:2019
$’0002018
$’000
An audit or review of the financial report of FLT and any other entity in the consolidated group
1,320,239 1,365,445
Other services in relation to FLT and any other entity in the consolidated group
Tax services 597,533 164,181
Other assurance services 132,791 89,753
2,050,563 1,619,379
AMOUNTS RECEIVED OR DUE AND RECEIVABLE BY RELATED PRACTICES OF ERNST & YOUNG FOR:
An audit or review of the financial report of FLT and any other entity in the consolidated group
1,566,345 1,386,642
Other services in relation to FLT and any other entity in the consolidated group
Tax services 176,928 195,187
Other assurance services 206,672 105,181
1,949,945 1,687,010
4,000,508 3,306,389
AMOUNTS RECEIVED OR DUE AND RECEIVABLE BY NON LEAD AUDITOR AUDIT FIRMS FOR:
An audit or review of the financial report of FLT and any other entity in the consolidated group
289,417 27,126
Other services in relation to FLT and any other entity in the consolidated group
Other assurance services 165,957 5,075
455,374 32,201
F12 SEASONALITYDue to the seasonal nature of a number of key segments, higher revenues and operating profits are expected in the second half of the year compared with the first six months. This is impacted by:
• Higher leisure sales in the lead up to the northern hemisphere summer holidays, particularly in the Americas • Higher leisure sales during the Australian expo seasons, typically held in the second half; and• Lower sales in the corporate travel agency businesses over the Christmas holiday period.
This is partially offset by the seasonality of the touring businesses which earn the majority of their profits in the northern hemisphere summer holiday period, which falls in the first six months.

100 ANNUAL REPORT 2019 FLIGHT CENTRE TRAVEL GROUP
NOTES TO THE FINANCIAL STATEMENTS CONTINUED
G GROUP STRUCTUREThis section explains significant aspects of the FLT group structure and how changes have affected the group.
G1 Subsidiaries
G2 Deed of cross guarantee
G3 Parent entity financial information
G1 SUBSIDIARIES
MATERIAL SUBSIDIARIESThe group’s principal subsidiaries are set out below. They have share capital consisting solely of ordinary shares that the group holds directly and the proportion of ownership interests held equals the group’s voting rights. The country of incorporation or registration is also their place of business.
Subsidiaries that sell travel or travel related services and contribute to more than 10% of the group’s underlying net profit before tax or 10% of the group’s net assets are considered material to the group.
NAME OF ENTITYCOUNTRY OF
INCORPORATIONCLASS OF SHARES/
OWNERSHIP
EQUITY HOLDING
2019 %
2018 %
Australian OpCo Pty Ltd1 Australia Ordinary 100 100
Flight Centre (UK) Limited United Kingdom Ordinary 100 100
FC USA Inc USA Ordinary 100 100
1 This controlled entity has been granted relief from the requirement to prepare financial reports in accordance with ASIC Corporations (Wholly-owned Companies) Instrument 2016/785 issued by the Australian Securities and Investments Commission. For further information refer to note G2.
There are no significant restrictions on the entities’ ability to access or use the assets and settle the liabilities of the group.
NON-CONTROLLING INTERESTSThe group has a number of entities which contain non-controlling interests. These represent less than 5% of the group’s underlying net profit before tax or less than 5% of the groups net assets. Therefore these are not individually material to the group and as such the individual income statements, balance sheet and cashflow statements will not be separately disclosed.
G2 DEED OF CROSS GUARANTEEPursuant to ASIC Corporations (Wholly-owned Companies) Instrument 2016/785, which came into effect 17 December 2016, the wholly-owned subsidiaries listed below are relieved from the Corporations Act 2001 requirements for preparation, audit and lodgement of financial reports and directors’ report.
There is one deed in effect. The subsidiaries to the deed are Flight Centre Travel Group Limited (Holding Entity), Australian OpCo Pty Ltd, P4 Finance Pty Ltd, Travel Services Corporation Pty Ltd and Flight Centre Technology Pty Ltd.
The Instrument requires the company and each of the subsidiaries to enter into a Deed of Cross Guarantee. The deed’s effect is that the company guarantees each creditor payment in full of any debt if any of the subsidiaries are wound up under certain provisions of the Corporations Act 2001. If a winding up occurs under other provisions of the Corporations Act 2001, the company will only be liable in the event that after six months any creditor has not been paid in full. The subsidiaries have also given similar guarantees in the event that the company is wound up.
The above companies represent a Closed Group for the purposes of the Instrument and, as there are no other parties to the Deed of Cross Guarantee that are controlled by FLT, they also represent the Extended Closed Group.

ANNUAL REPORT 2019 FLIGHT CENTRE TRAVEL GROUP 101
G2 DEED OF CROSS GUARANTEE (CONTINUED)Set out below is the consolidated statement of profit or loss and statement of other comprehensive income, consolidated balance sheet and a summary of movements in consolidated retained earnings for the company and the subsidiaries listed above:
FOR THE YEAR ENDED 30 JUNE
2019 $’000
2018 $’000
RESTATED1
REVENUE 1,369,699 1,448,549
Other income 33,169 19,602
Share of profit of joint ventures and associates 2,261 3,100
EXPENSES
Employee benefits (777,767) (761,474)
Sales and marketing (112,753) (106,252)
Rental expenses relating to operating leases (89,628) (96,248)
Amortisation and depreciation (37,408) (37,461)
Finance costs (8,439) (10,981)
Other expenses (258,062) (263,694)
Profit before income tax expense 121,072 195,141
Income tax expense (26,665) (57,474)
Profit after income tax expense 94,407 137,667
STATEMENT OF COMPREHENSIVE INCOME
Changes in the fair value of financial assets at FVOCI (231) 38
Changes in the fair value of cash flow hedges (486) 1,807
Income tax income/(expense) on items of other comprehensive income 148 (464)
Total comprehensive income for the year 93,838 139,048
SUMMARY OF MOVEMENTS IN CONSOLIDATED RETAINED PROFITS
Retained profits at the beginning of the financial year 754,258 772,220
Profit from ordinary activities after income tax expense 94,407 137,667
Dividends provided for and paid (319,441) (155,629)
Retained profits at the end of the financial year 529,224 754,258
1 Refer to note I(b) for details regarding the restatements for changes in accounting policies on adoption of AASB 15.

102 ANNUAL REPORT 2019 FLIGHT CENTRE TRAVEL GROUP
NOTES TO THE FINANCIAL STATEMENTS CONTINUED
G2 DEED OF CROSS GUARANTEE (CONTINUED)
ASSETSCurrent assets
FOR THE YEAR ENDED 30 JUNE
2019 $’000
2018 $’000
RESTATED1
Cash and cash equivalents 437,899 585,426 Financial asset investments 115,448 204,148 Trade receivables 173,959 173,419 Contract assets 274,543 240,943 Other assets 40,585 55,014 Current tax receivables 19,027 10,097 Inventories 85 5 Other financial assets 2,683 565 Derivative financial instruments 6,279 8,410 Total current assets 1,070,508 1,278,027
Non-current assets
Property, plant and equipment 96,822 111,984 Intangible assets 89,784 72,457 Other assets 3,237 3,753 Investments in joint ventures and associates 1,027,019 798,058 Deferred tax assets 47,182 51,801 Other financial assets 260,365 254,172 Total non-current assets 1,524,409 1,292,225 Total assets 2,594,917 2,570,252
LIABILITIES Current liabilities
Trade and other payables 775,500 800,976 Deferred revenue 8,946 8,898 Contingent consideration 2,635 4,676 Borrowings 66,235 6,189 Provisions 42,277 38,975 Derivative financial instruments 2,640 - Total current liabilities 898,233 859,714
Non-current assets
Trade and other payables 580,350 457,365 Deferred revenue 34,213 39,633 Contingent consideration 1,547 9,576 Borrowings 100,000 - Provisions 37,505 33,805 Total non-current liabilities 753,615 540,379 Total liabilities 1,651,848 1,400,093
Net assets 943,069 1,170,159
EQUITYContributed equity 405,626 404,023Treasury shares (11,993) (10,934)Reserves 20,212 22,812Retained profits 529,224 754,258Total equity 943,069 1,170,159
1 Refer to note I(b) for details regarding the restatements for changes in accounting policies on adoption of AASB 15.

ANNUAL REPORT 2019 FLIGHT CENTRE TRAVEL GROUP 103
G3 PARENT ENTITY FINANCIAL INFORMATION
SUMMARY FINANCIAL INFORMATIONThe financial information for the parent entity, FLT, has been prepared on the same basis as the consolidated financial statements, except for the investments which are carried at cost.
The individual financial statements for the parent entity show the following aggregate amounts:
PARENT
2019 $’000
2018 $’000
RESTATED1
Current assets 1,371,768 1,472,507
Total assets 2,933,432 2,802,517
Current liabilities 870,165 810,342
Total liabilities 2,293,419 1,943,823
Contributed equity 405,626 404,023
Treasury shares (11,993) (10,934)
Reserves
Cash-flow hedge reserve 498 838
Financial assets at FVOCI revaluation reserve 321 550
Share-based payments reserve 25,532 28,119
Acquisition Reserve (8,976) (8,976)
Retained profits 229,005 445,074
Total shareholders’ equity 640,013 858,694
Profit after tax for the year 103,372 138,655
Total comprehensive income 102,803 140,036
1 Refer to note I(b) for details regarding the restatements for changes in accounting policies on adoption of AASB 15.
GUARANTEES ENTERED INTO BY THE PARENT ENTITY
UNSECURED
PARENT
2019 $’000
2018 $’000
United Kingdom 62,542 61,677
India 31,312 30,494
China 16,006 19,156
Ireland 14,168 9,306
Hong Kong 9,636 7,842
Singapore 6,587 6,201
New Zealand 5,018 4,816
United Arab Emirates 3,146 1,579
Sweden 2,778 2,778
Canada 87 2,661
Other 2,140 3,891
Total 153,420 150,401
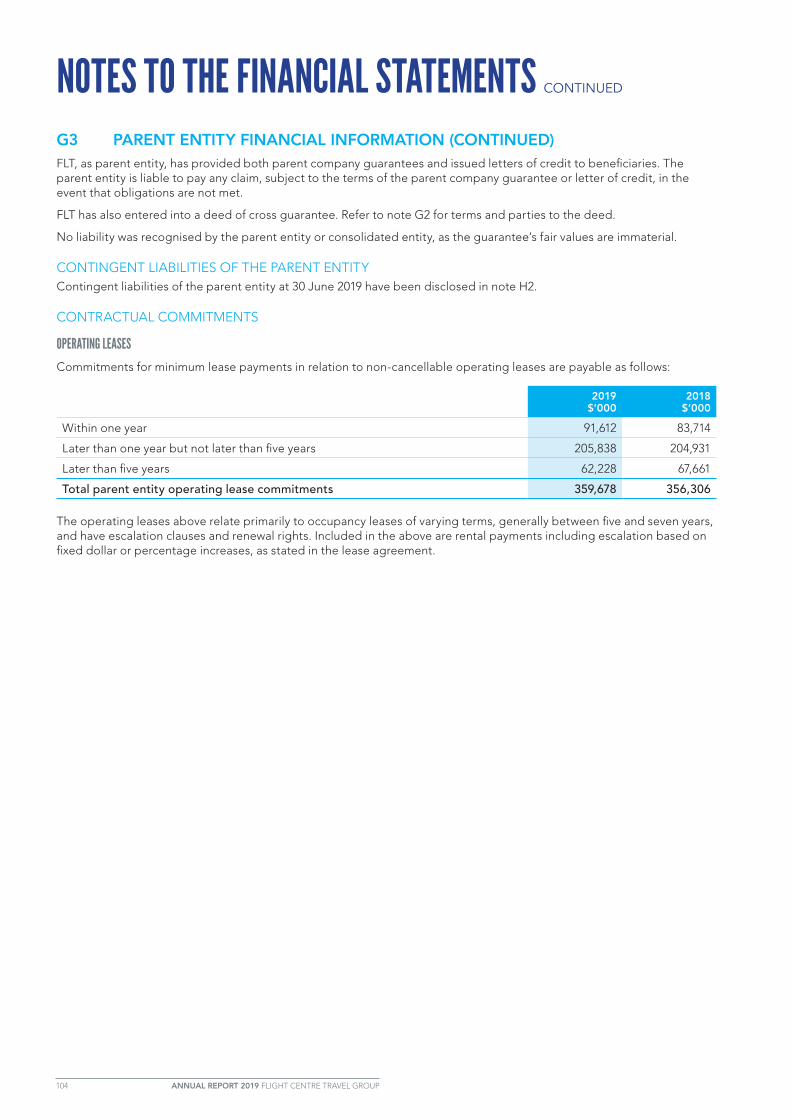
104 ANNUAL REPORT 2019 FLIGHT CENTRE TRAVEL GROUP
NOTES TO THE FINANCIAL STATEMENTS CONTINUED
G3 PARENT ENTITY FINANCIAL INFORMATION (CONTINUED)FLT, as parent entity, has provided both parent company guarantees and issued letters of credit to beneficiaries. The parent entity is liable to pay any claim, subject to the terms of the parent company guarantee or letter of credit, in the event that obligations are not met.
FLT has also entered into a deed of cross guarantee. Refer to note G2 for terms and parties to the deed.
No liability was recognised by the parent entity or consolidated entity, as the guarantee’s fair values are immaterial.
CONTINGENT LIABILITIES OF THE PARENT ENTITYContingent liabilities of the parent entity at 30 June 2019 have been disclosed in note H2.
CONTRACTUAL COMMITMENTS
OPERATING LEASES
Commitments for minimum lease payments in relation to non-cancellable operating leases are payable as follows:
2019 $’000
2018 $’000
Within one year 91,612 83,714
Later than one year but not later than five years 205,838 204,931
Later than five years 62,228 67,661
Total parent entity operating lease commitments 359,678 356,306
The operating leases above relate primarily to occupancy leases of varying terms, generally between five and seven years, and have escalation clauses and renewal rights. Included in the above are rental payments including escalation based on fixed dollar or percentage increases, as stated in the lease agreement.

ANNUAL REPORT 2019 FLIGHT CENTRE TRAVEL GROUP 105
H UNRECOGNISED ITEMSThis section provides information about items that are not recognised in the financial statements but could potentially have a significant impact on the group’s financial position and performance.
H1 Commitments
H2 Contingencies
H3 Events occurring after the end of the reporting period
H1 COMMITMENTSFLT has commitments in relation to operating leases (refer to note F1).
IGNITEThe Ignite share sale agreement is currently being renegotiated. Refer to note E1 for further details.
3MUNDIAs part of the initial investment in 3mundi a put and call agreement was entered into, this has now been exercised as part of the acquisition of the remaining 75%. Refer to note E1 for further details.
AIRTREEFLT have an agreement with AirTree Ventures 2 Partnership LP to invest $5,000,000 into the venture capital fund. To date FLT has received capital calls to the value of $3,111,000 which have been recognised as equity instruments - fair value through profit or loss (refer note B2) leaving $1,889,000 to be called in the future. The amount to be called has not been recognised as a liability at period end as FLT does not have a present obligation. The obligation only arises upon receipt of the capital call notices.
FLT has no control or managerial involvement in the running of the venture capital fund and the total contribution of $5,000,000 is less than 4% of the total capital in the fund.
H2 CONTINGENCIES
GENERAL CONTINGENCIESFLT is a global business and from time to time in the ordinary course of business it receives enquiries from various regulators and government bodies. FLT cooperates fully with all enquiries and these enquiries do not require disclosure in their initial state, however should the company become aware that an enquiry is developing further or if any regulatory or government action is taken against the group, appropriate disclosure is made in accordance with the relevant accounting standards.
As a global business, from time to time FLT is also subject to various claims and litigation from third parties during the ordinary course of its business. The directors of FLT have given consideration to such matters which are or may be subject to claims or litigation at year end and, unless specific provisions have been made, are of the opinion that no material contingent liability for such claims of litigation exists.
The group had no other material contingent assets or liabilities.
H3 EVENTS OCCURRING AFTER THE END OF THE REPORTING PERIOD
ACQUISITIONS SUBSEQUENT TO YEAR END On 1 August 2019, FLT acquired the remaining 25% of Les Voyages Laurier du Vallon (LDV) under the terms of a rolling put/call option that was agreed when FLT initially invested in the Quebec-based business. This brings FLT’s shareholding to 100%. An initial payment of $6,159,000 has been made, with the final payment subject to finalisation of the LDV financial statements. Refer to note A7 for further details.
DIVIDENDSOn 22 August 2019, FLT’s directors declared a final dividend for the year ended 30 June 2019. Refer to note B6 for details.
No other matters have arisen since 30 June 2019.

106 ANNUAL REPORT 2019 FLIGHT CENTRE TRAVEL GROUP
NOTES TO THE FINANCIAL STATEMENTS CONTINUED
I SUMMARY OF ACCOUNTING POLICIESThis section details FLT's accounting policies. Significant accounting policies are contained with the financial statement notes to which they relate and are not detailed in this section.
I SUMMARY OF ACCOUNTING POLICIESThe principal accounting policies adopted in the consolidated financial report’s preparation are set out below. These policies have been consistently applied to all the years presented, unless otherwise stated. The financial report is for the consolidated entity consisting of FLT and its subsidiaries.
(A) BASIS OF PREPARATIONThis general purpose financial report has been prepared in accordance with Australian Accounting Standards and interpretations issued by the Australian Accounting Standard Board and the Corporations Act 2001. FLT is a for-profit entity for the purpose of preparing the financial statements.
COMPLIANCE WITH IFRS
The group’s consolidated financial statements also comply with International Financial Reporting Standards (IFRS), as issued by the International Accounting Standards Board (IASB).
EARLY ADOPTIONS OF STANDARDS
The group has not elected to apply any pronouncements before their operative date in the annual reporting period beginning 1 July 2018.
In 2016 FLT elected to early adopt AASB 9 Financial Instruments (AASB 9) which addresses classification, measurement and derecognition of financial assets and financial liabilities, sets out new rules for hedge accounting, and introduces a new expected-loss impairment model.
HISTORICAL COST CONVENTION
These financial statements have been prepared under the historical cost convention, as modified by the revaluation of FVOCI financial assets, revaluation of FVTPL financial assets, derivative financial instruments and contingent consideration.
ROUNDING OF AMOUNTS
Amounts in the financial statements have been rounded off to the nearest thousand dollars or, in certain cases, the nearest dollar, in accordance with the Australian Securities and Investments Commission’s Instrument 2016/191.
RECLASSIFICATION
As outlined above in note A2 Revenue and A5 Intangibles, certain prior period amounts have been reclassified to conform to the current period’s presentation.
(B) CHANGES IN ACCOUNTING POLICY
AASB 15 REVENUE FROM CONTRACTS WITH CUSTOMERS
AASB 15 was issued by the AASB in December 2014 and replaces virtually all revenue recognition requirements, including those as set out in AASB 118 Revenue. The new standard establishes a five-step model to account for revenue arising from contracts with customers. Under AASB 15, revenue is recognised at an amount that reflects the consideration to which the entity expects to be entitled in exchange for transferring goods or services to a customer.
The Group adopted AASB 15 using the full retrospective method of adoption with comparatives restated for the financial year ended 30 June 2018. The effect of the transition on the current period has not been disclosed as the standard provides an optional practical expedient. FLT did not apply any of the other available optional practical expedients.
Whilst the effect on the current period has not been disclosed in full, market guidance provided at the Annual General Meeting on 22 October 2018 excluded the impact of AASB 15. Therefore, for the purposes of comparability to this guidance, the impact of AASB 15 adoption is excluded from profit before tax as an underlying adjustment.
The following tables show the adjustments recognised for each individual line item. Line items that were not affected by the changes have not been included. As a result, the sub-totals and totals disclosed cannot be recalculated from the numbers provided. The adjustments are explained in more detail below.
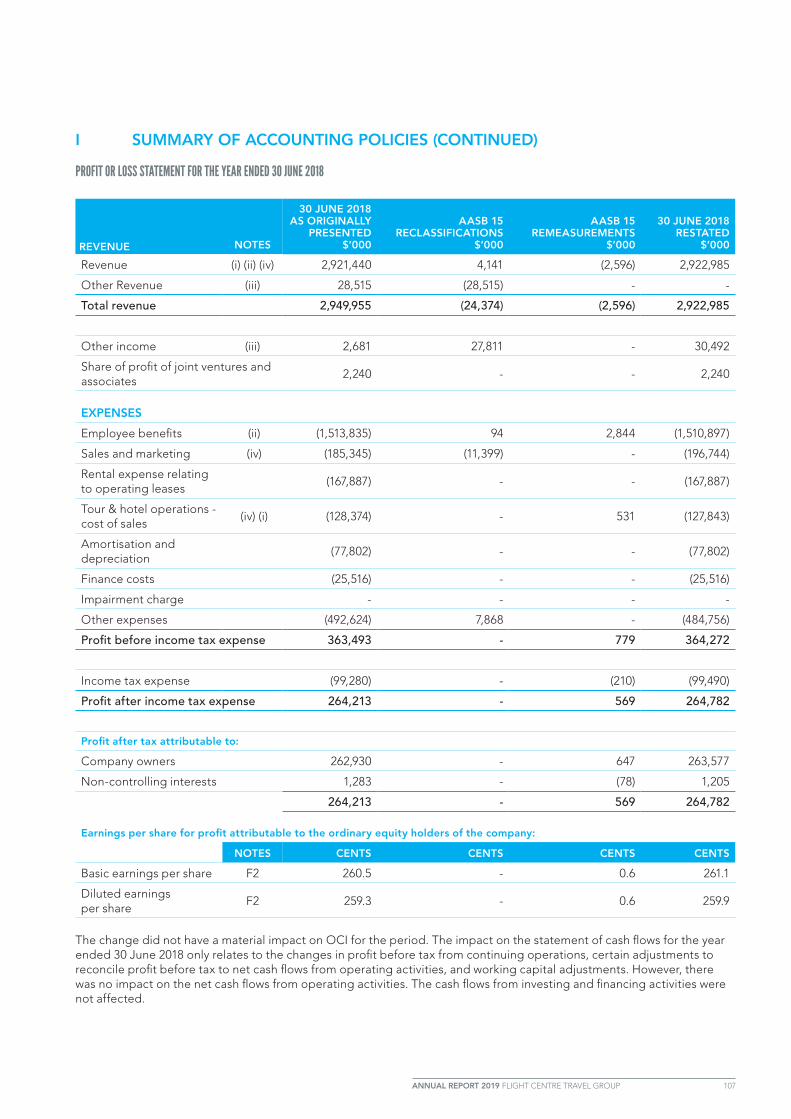
ANNUAL REPORT 2019 FLIGHT CENTRE TRAVEL GROUP 107
I SUMMARY OF ACCOUNTING POLICIES (CONTINUED)
PROFIT OR LOSS STATEMENT FOR THE YEAR ENDED 30 JUNE 2018
REVENUE
NOTES
30 JUNE 2018 AS ORIGINALLY
PRESENTED $’000
AASB 15 RECLASSIFICATIONS
$’000
AASB 15 REMEASUREMENTS
$’000
30 JUNE 2018 RESTATED
$’000
Revenue (i) (ii) (iv) 2,921,440 4,141 (2,596) 2,922,985
Other Revenue (iii) 28,515 (28,515) - -
Total revenue 2,949,955 (24,374) (2,596) 2,922,985
Other income (iii) 2,681 27,811 - 30,492
Share of profit of joint ventures and associates
2,240 - - 2,240
EXPENSES
Employee benefits (ii) (1,513,835) 94 2,844 (1,510,897)
Sales and marketing (iv) (185,345) (11,399) - (196,744)
Rental expense relating to operating leases
(167,887) - - (167,887)
Tour & hotel operations - cost of sales
(iv) (i) (128,374) - 531 (127,843)
Amortisation and depreciation
(77,802) - - (77,802)
Finance costs (25,516) - - (25,516)
Impairment charge - - - -
Other expenses (492,624) 7,868 - (484,756)
Profit before income tax expense 363,493 - 779 364,272
Income tax expense (99,280) - (210) (99,490)
Profit after income tax expense 264,213 - 569 264,782
Profit after tax attributable to:
Company owners 262,930 - 647 263,577
Non-controlling interests 1,283 - (78) 1,205
264,213 - 569 264,782
Earnings per share for profit attributable to the ordinary equity holders of the company:
NOTES CENTS CENTS CENTS CENTS
Basic earnings per share F2 260.5 - 0.6 261.1
Diluted earnings per share
F2 259.3 - 0.6 259.9
The change did not have a material impact on OCI for the period. The impact on the statement of cash flows for the year ended 30 June 2018 only relates to the changes in profit before tax from continuing operations, certain adjustments to reconcile profit before tax to net cash flows from operating activities, and working capital adjustments. However, there was no impact on the net cash flows from operating activities. The cash flows from investing and financing activities were not affected.

108 ANNUAL REPORT 2019 FLIGHT CENTRE TRAVEL GROUP
NOTES TO THE FINANCIAL STATEMENTS CONTINUED
I SUMMARY OF ACCOUNTING POLICIES (CONTINUED)
BALANCE SHEET FOR THE YEAR ENDED 30 JUNE 2018
ASSETS Current assets NOTES
AS AT 30 JUNE 2018
AS ORIGINALLY PRESENTED
$’000
AASB 15 RECLASSIFICATIONS
$’000
AASB 15 REMEASUREMENTS
$’000
AS AT 30 JUNE 2018
RESTATED $’000
Trade and other receivables 845,098 (320,051) - 525,047
Contract assets - 322,689 - 322,689
Other assets1 65,112 1,428 6,357 72,897
Total current assets (i) (ii) (v) 2,435,145 4,066 6,357 2,445,568
Non-current assets
Other assets (ii) - - 3,753 3,753
Deferred tax assets 63,952 - 5,640 69,592
Total non-current assets2 944,038 - 9,393 953,431
Total assets2 3,379,183 4,066 15,750 3,398,999
LIABILITIES Current liabilities
Trade and other payables 1,565,288 (59,715) - 1,505,573
Deferred revenue (i) (ii) - 63,781 10,967 74,748
Total current liabilities 1,683,788 4,066 10,967 1,698,821
Non-current liabilities
Trade and other payables 97,514 (37,087) - 60,427
Deferred revenue (ii) - 37,087 18,634 55,721
Total non-current liabilities 166,989 - 18,634 185,623
Total liabilities 1,850,777 4,066 29,601 1,884,444
Net assets2 1,528,406 - (13,851) 1,514,555
EQUITY
Retained profits 1,122,334 - (13,708) 1,108,626
Equity attributable to the Company owners2 1,523,547 - (13,708) 1,509,839
Non-controlling interests 4,859 - (143) 4,716
Total equity2 1,528,406 - (13,851) 1,514,555
1 During the prior period, current security deposits and accrued interest were shown with ‘other assets’ which have been reclassified to 'other financial assets' for presentation purposes. 2 Refer to note A5 Intangibles for details of restatement of prior period exchange differences arising on the translation of the Goodwill of subsidiaries with functional currencies other than the Australia dollar.

ANNUAL REPORT 2019 FLIGHT CENTRE TRAVEL GROUP 109
I SUMMARY OF ACCOUNTING POLICIES (CONTINUED)The impact on the group’s retained earnings as at 1 July 2017 and 1 July 2018 is as follows:
2018 $’000
2017 $’000
Opening retained profits 1 July as originally presented 1,122,334 1,015,033
Recognition of:
Fulfilment asset 10,110 6,541
Deferred revenue (29,601) (26,811)
Deferred tax asset 5,640 5,850
(13,851) (14,420)
Less: Impact of change in accounting policy attributable to NCI 143 65
Opening retained profits 1 July - restated 1,108,626 1,000,678
In summary, the impact of AASB 15 adoption is a net decrease in retained earnings at 1 July 2017 of $14,420,000, a decrease of FY18 revenue of $2,596,000 and an increase of FY18 PBT of $779,000.
The nature of the adjustments that impact PBT are described below:
(i) Revenue from tour operations
Under AASB 15 revenue is recognised as services are provided. Practically this means revenue from tour operations is now recognised over the duration of the tour. This represents a deferral of revenue compared to the previous policy, whereby revenue was generally recognised at tour departure.
The net impact on transition is an opening retained earnings decrease of $1,736,000, with the recognition of deferred revenue of $7,265,000, a fulfilment asset of $5,115,000, and deferred tax asset of $414,000.
The net impact on FY18 is a revenue decrease of $512,000 and a PBT increase of $20,000.
(ii) Revenue from provision of travel as agent – lump sum consideration
From time-to-time, lump sum amounts are received from suppliers, who under AASB 15 are deemed to be FLT’s customer. Depending on the specific terms of the contract, some amounts which were previously recognised upfront will now be spread over the duration of the contract term and associated contract costs, previously expensed as incurred, will be capitalised as fulfilment assets and amortised over the same term.
The net impact on transition is a decrease in opening retained earnings of $12,684,000 due to the capitalisation of expenses as a fulfilment asset of $1,426,000, the deferral of revenue of $19,546,000, and deferred tax asset of $5,436,000.
The net impact on FY18 is a revenue decrease of $2,084,000 and a PBT increase of $759,000.
The decrease in revenue was due to lump sum consideration received during the period being reversed and deferred, offset by the release of previously deferred revenue.
This transition adjustment will increase PBT in future years as the fulfilment asset is unwound and the deferred revenue is released.
The nature of the adjustments that impact classification are described in (iii) to (v) below:
(iii) Other Income
Historically FLT disclosed certain items as ‘Other Revenue’, such as rent and interest. Upon transition these income streams have been reclassified to ‘Other Income’.
(iv) Principal vs Agent presentation
Under AASB 15 there is more detailed guidance on identifying performance obligations. From time-to-time FLT develop and offer products in its retail and corporate agency business’ or other businesses which are principal in nature.
The principal vs agent assessment has resulted in some minor reclassification adjustments as follows:
• the gross presentation of a small number of advertising revenue streams separately to their directly associated costs, which were previously shown net in revenue.
• the presentation of a small number of merchant service fees incurred in providing travel agency services being shown net against revenue, which was previously shown gross in other expenses.

110 ANNUAL REPORT 2019 FLIGHT CENTRE TRAVEL GROUP
NOTES TO THE FINANCIAL STATEMENTS CONTINUED
I SUMMARY OF ACCOUNTING POLICIES (CONTINUED)(v) Presentation of assets and liabilities related to contracts with customers
FLT has also voluntarily changed the presentation of certain amounts in the balance sheet to reflect the terminology of AASB 15:
• Contract assets recognised in relation to volume incentives receivables and accrued revenue were previously presented as part of trade and other receivables and other assets as override receivables and other receivables. The associated expected credit losses were reclassified from trade and other receivables to contract assets (loss allowance).
• Contract liabilities in relation to deferred revenue were previously included in trade and other payables as unearned income.
• A new classification has been made for contract fulfilment assets and is presented within other assets.
(vi) Other adjustments
In addition to the adjustments described above, upon the adoption of AASB 15, other items of the primary financial statements such as income tax expense, foreign currency translation reserve, non-controlling interests and retained earnings, were adjusted as necessary.
No other new standards or amendments became effective in the current reporting period that have a material impact on FLT.
(C) PRINCIPLES OF CONSOLIDATION
I. SUBSIDIARIES
The consolidated financial statements incorporate the assets and liabilities of all FLT subsidiaries at 30 June 2019 and the subsidiaries’ results for the year then ended. FLT and its subsidiaries together are referred to in this financial report as the group or the consolidated entity.
Subsidiaries are all entities (including structured entities) over which the group has control. FLT controls an entity when it is exposed to, or has rights to, variable returns from its involvement with the entity and has the ability to affect those returns through its power to direct the entity’s activities. Subsidiaries are fully consolidated from the date on which control is transferred to the group. They are deconsolidated from the date control ceases.
The acquisition method of accounting is used to account for business combinations by the group (refer to note I(h) Business Combinations).
Intercompany transactions, balances and unrealised gains on transactions between group companies are eliminated. Unrealised losses are also eliminated unless the transaction provides evidence of the transferred asset’s impairment. Subsidiaries’ accounting policies have been changed, where necessary, to ensure consistency with the group’s policies.
Investments in subsidiaries are accounted for at cost in FLT’s individual financial statements.
II. JOINT ARRANGEMENTS & ASSOCIATES
Investments in joint arrangements are classified as either joint operations or joint ventures (JVs). The classification depends on each investor’s contractual rights and obligations, rather than the legal structure of the joint arrangement. FLT only has JVs, which are accounted for in the consolidated financial statements using the equity method. Under the equity method, they are initially recognised at cost by the parent entity and subsequently the share of the JV entity’s profit or loss is recognised in the statement of profit or loss and other comprehensive income. The share of post-acquisition movements in reserves is recognised in other comprehensive income. JV details are set out in note E1.
FLT reassesses its interests in joint arrangements and associates for changes in control at least annually or where there has been changes in circumstances including but not limited to changes to shareholdings and shareholder agreements.
Upon gaining control, FLT remeasures its existing investment to fair value with any difference between the carrying amount and its fair value recognised in the profit or loss. The transaction is then accounted for in accordance with the acquisition method of accounting, refer note I(h) Business Combinations.
Upon loss of joint control, FLT measures and recognises its remaining investment at its fair value. The difference between the investment’s carrying amount upon loss of joint control and the remaining investment’s fair value and proceeds from disposal is recognised in profit or loss.
When the remaining investment constitutes significant influence, it is accounted for as an investment in associate. Significant influence is the power to participate in the financial and operating policy decisions of the investee, but is not control or joint control over those policies. Investments in Associates are also accounted for using the equity method.

ANNUAL REPORT 2019 FLIGHT CENTRE TRAVEL GROUP 111
I SUMMARY OF ACCOUNTING POLICIES (CONTINUED)
III. CHANGES IN OWNERSHIP INTERESTS
The Group recognises any non-controlling interest, in the acquired entity on an acquisition-by-acquisition basis either at fair value or at the non-controlling interests’ proportionate share of the acquired entity’s net identifiable assets. Non-controlling interests in the results and equity of subsidiaries are shown separately in the Consolidated Statement of Profit or Loss, Consolidated Statement of Comprehensive Income, Consolidated Statement of Financial Position and Consolidated Statement of Changes in Equity.
IV. CHANGES IN OWNERSHIP INTERESTS
The group treats transactions with non-controlling interests that do not result in a loss of control as transactions with group equity owners. An ownership change will result in an adjustment between the carrying amounts of the controlling and non-controlling interests to reflect their relative interests in the subsidiary. Any difference between the amount of the adjustment to non-controlling interests and any consideration paid or received is recognised in a separate reserve within equity attributable to FLT owners.
When the group ceases to have control, joint control or significant influence, any retained interest in the entity is remeasured to its fair value, with the change in carrying amount recognised in profit or loss. The fair value is the initial carrying amount for the purposes of subsequently accounting for the retained interest as an associate, jointly controlled entity or financial asset. In addition, any amounts previously recognised in other comprehensive income in respect of that entity are accounted for as if the group has directly disposed of the related assets or liabilities. This may mean that amounts previously recognised in other comprehensive income are reclassified to profit or loss.
If the ownership interest in a JV or an associate is reduced but joint control or significant influence is retained, only a proportionate share of the amounts previously recognised in other comprehensive income are reclassified to profit or loss where appropriate.
V. SHARE TRUSTS
FLT has set up a share trust to administer the various employee share plans it initiates to incentivise and reward employees. The trust holds shares which have been purchased by employees or are fully vested, and treasury shares. The trust is consolidated.
(D) FOREIGN CURRENCY TRANSLATION
I. FUNCTIONAL AND PRESENTATION CURRENCY
Items included in each of the group entities’ financial statements are measured using the currency of the primary economic environment in which the entity operates (the functional currency). The consolidated financial statements are presented in Australian dollars, which is FLT’s functional and presentation currency.
II. TRANSACTIONS AND BALANCES
Foreign currency transactions are translated into the functional currency at the prevailing exchange rates at the transaction dates. Foreign exchange gains and losses resulting from the settlement of such transactions and from the translation at year end exchange rates of monetary assets and liabilities denominated in foreign currencies are recognised in profit or loss. Exceptions arise if the gains and losses are deferred in equity as qualifying cash flow hedges and qualifying net investment hedges or are attributable to part of the net investment in a foreign operation.
Foreign exchange gains and losses that relate to borrowings are presented in the statement of profit or loss and other comprehensive income within finance costs. All other foreign exchange gains and losses are presented in the statement of profit or loss and other comprehensive income on a net basis within other income or other expenses.
Non-monetary items that are measured at fair value in a foreign currency are translated at the exchange rates when the fair value is determined. Translation differences on assets and liabilities carried at fair value are reported as part of the fair value gain or loss.
112 ANNUAL REPORT 2019 FLIGHT CENTRE TRAVEL GROUP
NOTES TO THE FINANCIAL STATEMENTS CONTINUED
I SUMMARY OF ACCOUNTING POLICIES (CONTINUED)
III. GROUP COMPANIES
For foreign operations with different functional currencies to the presentation currency, results and financial position are translated into the presentation currency as follows:
• Assets and liabilities for each balance sheet presented are translated at the closing rate of that balance sheet’s date• Income and expenses for each statement of profit or loss and other comprehensive income are translated at average
exchange rates; and• All resulting exchange differences are recognised in other comprehensive income
On consolidation, exchange differences arising from the translation of any net investment in foreign entities and of borrowings and other financial instruments designated as hedges of such investments are recognised in other comprehensive income. When a foreign operation is sold or any borrowings forming part of the net investment are repaid, a proportionate share of such exchange difference is reclassified to profit or loss, as part of the gain or loss on sale where applicable.
Goodwill and fair value adjustments arising on foreign operations’ acquisitions are treated as the foreign operations’ assets and liabilities and are translated at the closing rate.
(E) REVENUEFor accounting policies on revenue, refer to note A2.
(F) OTHER INCOMESpecific accounting policies for other income are set out below:
I. LEASE INCOME
Lease income from operating leases is recognised as income on a straightline basis over the lease term.
II. INTEREST INCOME
Interest income is recognised on a time proportion basis using the effective interest method. When a receivable is impaired, the group reduces the carrying amount to its recoverable amount, being the estimated future cash flow discounted at the instrument’s original effective interest rate, and continues unwinding the discount as interest income. Interest income on impaired loans is recognised using the original effective interest rate.
III. DIVIDENDS
Dividends are recognised when the right to receive payment is established. This applies even if they are paid out of pre-acquisition profits. However, the investment may need to be tested for impairment as a consequence.
IV. ROYALTIES
Royalty revenue is recognised on an accrual basis in accordance with the substance of the relevant agreement.
(G) IMPAIRMENT OF ASSETSGoodwill and intangible assets that have an indefinite useful life are not subject to amortisation but are impairment tested annually or more frequently if events or changes in circumstances indicate they might be impaired. An impairment loss is recognised for the amount by which the asset’s carrying amount exceeds its recoverable amount. The recoverable amount is the higher of an asset’s fair value less costs to sell, or value-in-use. To assess impairment, assets are grouped at the lowest levels for which there are separately identifiable cash inflows which are independent of the cash inflows from other assets or asset groups (cash-generating units).
Impaired non-financial assets, other than goodwill, are reviewed for the impairment’s possible reversal at each reporting date.
Financial assets are reviewed for impairment whenever events or changes in circumstances indicate that the carrying amount may not be recoverable. For financial assets, a significant or prolonged decline in the security’s fair value below its cost is considered an indicator that the assets are impaired. Impairment is recorded and losses are incurred only if there is objective evidence of impairment as a result of one or more events that occurred after the asset’s initial recognition (a loss event) and that loss event (or events) has an impact on the estimated future cash flows of the financial asset or group of financial assets that can be reliably estimated.

ANNUAL REPORT 2019 FLIGHT CENTRE TRAVEL GROUP 113
I SUMMARY OF ACCOUNTING POLICIES (CONTINUED)
(H) BUSINESS COMBINATIONSThe acquisition method of accounting is used to account for all business combinations, regardless of whether equity instruments or other assets are acquired. The consideration transferred for a subsidiary’s acquisition comprises the transferred assets’ fair values, the liabilities incurred and the equity interest issued by the group. The consideration transferred also includes any contingent consideration arrangement’s fair value and the fair value of any pre-existing equity interest in the subsidiary. Acquisition-related costs are expensed as incurred. Identifiable assets acquired and liabilities and contingent liabilities assumed in a business combination are, with limited exceptions, measured initially at their fair values at acquisition date. Where equity instruments are issued in an acquisition, the instruments’ fair values are their published market prices at the exchange date. Transaction costs arising on equity instruments’ issue are recognised directly in equity.
The excess of the consideration transferred over the fair value of the net identifiable assets acquired is recorded as goodwill. If those amounts are less than the fair value of the acquired subsidiary’s net identifiable assets and the measurement of all amounts has been reviewed, the difference is recognised directly in profit or loss as a bargain purchase.
Where settlement of any part of cash consideration is deferred, future amounts payable are discounted to their present value at the exchange date. The discount rate used is the entity’s incremental borrowing rate, being the rate at which a similar borrowing could be obtained from an independent financier under comparable terms and conditions.
Where there are NCI's, these are measured at either the acquisition date fair value or the proportionate share of the net identifiable assets acquired.
For some acquisitions, Put and Call options over NCI’s are entered into simultaneously when business combinations are initially recorded. For these acquisitions, it has been determined that the option does not provide the parent with a present ownership interest in the shares subject to the Put. The NCI is treated as having been acquired when the Put option is granted (ie it is de-recognised) and a financial liability at fair value is recorded for the NCI Put. The difference between the liability recorded at fair value and the NCI de-recognised is recorded in the acquisition reserve in equity in accordance with AASB 10. After the initial recognition of the acquisition reserve it is not subsequently re-measured. The financial liability relating to the Put and Call options over NCI is subsequently accounted for under AASB 9 with all changes in the carrying amount recognised in profit or loss until exercise.
(I) INTANGIBLE ASSETS
I. GOODWILL
Goodwill represents the excess of the acquisition’s cost over the fair value of the group’s interest in the fair value of the acquired subsidiary or associate’s net identifiable assets at the acquisition date.
Goodwill on subsidiaries’ acquisitions is included in intangible assets. Goodwill is not amortised but is impairment tested annually or more frequently if events or changes in circumstances indicate that it might be impaired, and is carried at cost less accumulated impairment losses. Gains and losses on the entity’s disposal include the sold entity’s carrying amount of goodwill.
Goodwill is allocated to CGUs for impairment testing. The allocation is made to those CGUs or groups of CGUs that are expected to benefit from the business combination in which the goodwill arose.
II. BRAND NAMES, LICENCES AND CUSTOMER RELATIONSHIPS
Other intangible assets, such as brand names, licences and customer relationships, are acquired as part of business combinations and are recognised initially at fair value. Where they have an indefinite useful life, such as brand names, they are not subject to amortisation but are tested annually for impairment or more frequently if events or changes in circumstances indicate they may be impaired. Key factors taken into account in assessing the useful life of brands are:
• The brands are well established and protected by trademarks across the globe. The trademarks are generally subject to an indefinite number of renewals upon appropriate application; and
• There are currently no legal, technical or commercial obsolescence factors applying to the brands which indicate that the life should be considered limited
III. OTHER INTANGIBLE ASSETS - SOFTWARE
Research costs associated with software development are expensed as incurred. Development expenditure incurred on an individual project is capitalised if the project is technically and commercially feasible and adequate resources are available to complete development. The expenditure capitalised includes all directly attributable costs, including costs of materials, services, direct labour and an appropriate proportion of overheads.

114 ANNUAL REPORT 2019 FLIGHT CENTRE TRAVEL GROUP
NOTES TO THE FINANCIAL STATEMENTS CONTINUED
I SUMMARY OF ACCOUNTING POLICIES (CONTINUED)
(J) CASH AND CASH EQUIVALENTSFor statement of cash flows presentation purposes, cash and cash equivalents include cash on hand, deposits held at call with financial institutions, other short-term, highly liquid investments that are readily convertible to known amounts of cash and are subject to an insignificant risk of changes in value, and bank overdrafts. Bank overdrafts are shown within borrowings in current liabilities on the balance sheet.
(K) FINANCIAL ASSETSThe group applies the requirements of AASB 9 Financial Instruments (AASB 9) to its financial assets since its early adoption of AASB 9 on 1 January 2016.
I. CLASSIFICATION
Financial assets are classified in the following categories: financial assets at amortised cost, FVTPL and FVOCI. The classification depends on the purpose for which the assets were acquired.
• Amortised cost - Applies to instruments which are held within a business model whose objective is to hold assets in order to collect contractual cash flows and the contractual terms of the financial asset represent contractual cash flows that are solely payments of principal and interest
• Fair value through profit and loss (FVTPL) - Applies to instruments which are within a business model where the objective is neither to hold to collect contractual cash flows nor hold to sell.
• Fair value through other comprehensive income (FVOCI) - Applies to instruments which satisfy the requirements of the business model test and contractual cashflow test.
Management classifies its investments at initial recognition and re-evaluates this classification each reporting date.
II. RECOGNITION AND DERECOGNITION
Regular purchases and sales of financial assets are recognised on trade-date (the date on which the group commits to purchase or sell the asset). Investments are initially recognised at fair value plus transaction costs for all financial assets not carried at FVTPL. Financial assets carried at FVTPL are initially recognised at fair value and transaction costs are expensed in the statement of profit or loss and other comprehensive income. Financial assets are derecognised when the rights to receive cash flows from them have expired or have been transferred and the group has transferred substantially all the risks and rewards of ownership.
III. SUBSEQUENT MEASUREMENT
Financial assets at amortised cost are carried at amortised cost using the effective interest method.
Financial assets at FVTPL are subsequently carried at fair value. Gains or losses arising from changes in the fair value are presented in the statement of profit or loss and other comprehensive income within other income or other expenses in the period in which they arise. Income such as interest and dividends from financial assets at FVTPL is recognised separately to gains or losses in the statement of profit or loss and other comprehensive income as part of other income when the group’s right to receive payments is established.
Financial assets classified as FVOCI are subsequently carried at fair value. Gains or losses arising from changes in the fair value are presented in other comprehensive income with the exception of impairment which is recognised in the statement of profit or loss immediately. When securities classified as FVOCI are sold, the accumulated fair value adjustments recognised in other comprehensive income are reclassified in the statement of profit or loss and other comprehensive income as gains and losses from investment securities.
IV. IMPAIRMENT – EXPECTED CREDIT LOSSES
FLT applies both the general and simplified approach to the measurement of expected credit losses (ECLs).
Under the general approach FLT applies a three stage model for measuring ECLs based on changes in credit quality since initial recognition including
• Stage 1: 12 month ECL - Recognised on “good” exposures where there has not been a significant increase in credit risk since initial recognition, the loss represents the probability of default from events that are possible over the next 12 months and not the cash flows FLT expects to lose over that period.
• Stage 2: Lifetime ECL - Where there has been a significant increase in credit risk since initial recognition however default has not yet occurred, the loss represents the credit losses expected over the remaining life of the asset.
• Stage 3: Lifetime ECL (credit impaired) - Financial asset becomes credit impaired as a result of an event which has had a detrimental impact on future cash flows.

ANNUAL REPORT 2019 FLIGHT CENTRE TRAVEL GROUP 115
I SUMMARY OF ACCOUNTING POLICIES (CONTINUED) FLT assesses the credit risk and probability of default of financial assets by reference to external rating agencies where available on an asset by asset basis. FLT has determined a financial asset has low credit risk when it is equivalent to an investment grade quality. Where forward looking information is not available, FLT applies the rebuttable presumption that credit risk has increased significantly when contractual payments are more than 30 days past due (entry into stage 2: Lifetime ECL) and, when contractual payments are greater than 90 days past due, the asset is credit impaired (entry into stage 3: Lifetime ECL).
For trade receivables, contract assets and lease receivables which do not contain a significant financing component, AASB 9 offers a policy choice between the application of the general model, as detailed above, or a simplified approach. Under the simplified approach, the tracking of changes in credit risk is not required, but instead requires the recognition of lifetime ECLs at all times and allows the use of a provision matrix, incorporating the probability of default, as a practical expedient. FLT has elected the simplified approach for trade and override receivables.
(L) FAIR VALUE MEASUREMENTFLT measures certain financial instruments at fair value at each reporting date.
Fair value is the price that would be received to sell an asset or paid to transfer a liability in an orderly transaction between market participants at the measurement date. The fair value measurement is based on the presumption that the transaction to sell the asset or transfer the liability takes place either:
• In the principal market for the asset or liability; or• In the absence of a principal market, in the most advantageous market for the asset or liability• The principal or the most advantageous market must be accessible by the group.
An asset or liability’s fair value is measured using the assumptions that market participants use when pricing the asset or liability, assuming that market participants act in their economic best interest.
The group uses valuation techniques that are appropriate in the circumstances and for which sufficient data is available to measure fair value, maximising the use of relevant observable inputs and minimising the use of unobservable inputs.
All assets and liabilities for which fair value is measured or disclosed in the financial statements are categorised within the fair value hierarchy, as described in notes A7, B2 and C2.
(M) TRADE AND OTHER RECEIVABLESTrade receivables are recognised initially at fair value and subsequently measured at amortised cost using the effective interest method, less provision for impairment in accordance with the simplified approach see note I (k)(iv) above.
The impairment allowance is the difference between the asset’s carrying amount and the present value of estimated future cash flows, discounted at the effective interest rate. Cash flows relating to short-term receivables are not discounted if the effect of discounting is immaterial. The impairment amount is recognised in the statement of profit or loss and other comprehensive income in other expenses. When a trade receivable for which an impairment allowance has been recognised becomes uncollectible in a subsequent period, it is written off against the allowance account. Subsequent recoveries of amounts previously written off are credited against other expenses in the statement of profit or loss and other comprehensive income.
(N) PROPERTY, PLANT AND EQUIPMENTBuildings and other property, plant and equipment are stated at historical cost less depreciation. Land is held at historical cost. Historical cost includes expenditure directly attributable to the item’s acquisition.
Subsequent costs are included in the asset’s carrying amount or recognised as a separate asset, as appropriate, when it is probable that future economic benefits associated with the item will flow to the group and the item’s cost can be measured reliably. All other repairs and maintenance are charged to the income statement during the financial period in which they are incurred.
An asset’s carrying amount is impaired immediately to its recoverable amount if the asset’s carrying amount is greater than its estimated recoverable amount (note I(g)). A previously recognised impairment loss is reversed only if there has been a change in the assumptions used to determine the asset’s recoverable amount since the last impairment loss was recognised.
The reversal is limited so that the asset’s carrying amount does not exceed its recoverable amount, nor exceed the carrying amount that would have been determined, net of depreciation, had no impairment loss been recognised for the asset in prior years.

116 ANNUAL REPORT 2019 FLIGHT CENTRE TRAVEL GROUP
NOTES TO THE FINANCIAL STATEMENTS CONTINUED
I SUMMARY OF ACCOUNTING POLICIES (CONTINUED)
(O) INVENTORIESInventories are valued at the lower of cost and net realisable value. Cost primarily represents average costs.
(P) TRADE AND OTHER PAYABLESThese amounts are liabilities for goods and services provided to the group prior to the financial year’s end, but not yet paid. The amounts are unsecured and are usually paid within 30 days of recognition. Trade and other payables are presented as current liabilities unless payment is not due within 12 months of the reporting date. They are recognised initially at fair value and subsequently measured at amortised cost using the effective interest method.
(Q) PROVISIONSProvisions for legal claims and make good obligations are recognised when the group has a present legal or constructive obligation as a result of past events and it is more likely than not that an outflow of resources will be required to settle the obligation and the amount has been reliably estimated. Provisions are not recognised for future operating losses.
Where there are a number of similar obligations, the likelihood that an outflow will be required in settlement is determined by considering the class of obligations as a whole. A provision is recognised even if the likelihood of an outflow relating to any item included in the same class of obligations is small.
To measure provisions at present value at the reporting period’s end, management estimates the expenditure required to settle the present obligation. The discount rate used to determine the present value reflects current market assessments of the time value of money and the risks specific to the liability. Provision increases brought about by the passage of time are recognised as interest expenses.
I. MAKE GOOD PROVISION
The group is required to restore leased premises to their original condition at the end of the respective lease terms.
A provision has been recognised for the present value of the estimated expenditure required to remove any leasehold improvements and restore the leased premises. These costs have been capitalised as part of the cost of leasehold improvements and are amortised over the shorter of the lease term or the asset’s useful life.
(R) EMPLOYEE BENEFITS
I. WAGES AND SALARIES, ANNUAL LEAVE AND SICK LEAVE
Liabilities for employees’ wages and salaries, including non monetary benefits and annual leave expected to be settled within 12 months of the reporting period’s end, are recognised in trade and other payables up to the reporting period’s end and represent the amounts expected to be paid when the liabilities are settled. Sick leave is recognised as an expense when the leave is taken and measured at the rates paid or payable. All other short-term employee benefit obligations are presented as trade and other payables.
II. PROFIT-SHARING AND BONUS PLANS
A liability for employee benefits in the form of profit-sharing and bonus plans is recognised as payable when there is a contractual obligation or valid expectation that payment will be made. Employee profit-sharing and bonus payments are recognised and paid monthly.
III. LONG SERVICE LEAVE
The liability for long service leave which is not expected to be settled within 12 months after the end of the period in which the employees render the related service is recognised in provisions. The liability represents the present value of expected future payments to be made for the services employees provided up to the reporting period’s end. The company considers expected future wage and salary levels, experience of employee departures and periods of service. Expected future payments at the reporting period’s end are discounted using market yields on national corporate bonds with terms to maturity and currency that match, as closely as possible, the estimated future cash outflows.
IV. RETIREMENT BENEFIT OBLIGATIONS
The group provides retirement benefits to employees through a defined contribution superannuation fund. Contributions are recognised as expenses as they become payable.

ANNUAL REPORT 2019 FLIGHT CENTRE TRAVEL GROUP 117
I SUMMARY OF ACCOUNTING POLICIES (CONTINUED)
V. TERMINATION BENEFITS
Termination benefits may be payable when employment is terminated before the normal retirement date or when an employee accepts voluntary redundancy in exchange for these benefits. The group recognises termination benefits when it commits to either terminating a current employee’s employment according to a detailed formal plan without the possibility of withdrawal or providing termination benefits following an offer made to encourage voluntary redundancy.
(S) BORROWINGSBorrowings are initially recognised at fair value, net of transaction costs incurred, and are subsequently measured at amortised cost. Any difference between the proceeds (net of transaction costs) and the redemption amount is recognised in profit or loss over the period of the borrowings using the effective interest method. Fees paid on loan facilities’ establishment are recognised as loan transaction costs to the extent that it is probable that some or all of the facility will be drawn down. In this case, the fee is deferred until the draw down occurs. If there is no evidence that it is probable that some or all of the facility will be drawn down, the fee is capitalised as a prepayment for liquidity services and amortised over the period of the facility to which it relates.
Borrowing costs are recognised as expenses in the period in which they are incurred and include:
• Interest on bank overdrafts and short and long-term borrowings; and• Unwinding of discount on deferred payables
Borrowings are classified as current liabilities unless the group has an unconditional right to defer the liability’s settlement for at least 12 months after the reporting period’s end.
Borrowings are removed from the balance sheet when the obligation specified in the contract is discharged, cancelled or expired. The difference between the carrying amount of a financial liability that has been extinguished or transferred to another party and the consideration paid, including any non-cash assets transferred or liabilities assumed, is recognised in other income or other expenses.
(T) TAX
I. INCOME TAX
The income tax expense or benefit for the period is the tax payable or receivable on the current period’s taxable income based on each jurisdiction’s applicable income tax rate. Adjustments are made for changes in deferred tax assets and liabilities attributable to temporary differences and for unused tax losses.
The current income tax charge is based on tax laws enacted or substantively enacted at the end of the reporting period in the countries where the company’s subsidiaries and associates operate and generate taxable income. Management periodically evaluates positions taken in tax returns in respect of situations in which applicable tax regulations are subject to interpretation and establishes provisions where appropriate.
Deferred income tax is provided in full, using the liability method, on temporary differences arising between the assets’ and liabilities’ tax bases and their carrying amounts in the consolidated financial statements. However, the deferred income tax is not accounted for if it arises from an asset or liability’s initial recognition in a transaction other than a business combination that at the time of the transaction does not affect accounting or taxable profit or loss. Deferred income tax is determined using rates (and laws) that have been enacted or substantively enacted by the end of the reporting period and are expected to apply when the related deferred income tax asset is realised or the deferred income tax liability is settled.
Deferred tax assets are recognised for deductible temporary differences and unused tax losses only to the extent that it is probable that future taxable amounts will be available to utilise those temporary differences and losses.
Deferred tax liabilities and assets are not recognised for temporary differences between the carrying amount and tax bases of investments in controlled entities where the parent entity controls the timing of the temporary differences’ reversals and it is probable that the differences will not reverse in the foreseeable future.
Deferred tax assets and liabilities are offset when there is a legally enforceable right to offset current tax assets and liabilities and when the deferred tax balances relate to the same tax authority. Current tax assets and tax liabilities are offset when the entity has a legally enforceable right to offset and intends to either settle on a net basis or to realise the asset and settle the liability simultaneously.
Current and deferred tax is recognised in profit or loss, except when it relates to items recognised in other comprehensive income or directly in equity. In these cases, the tax is also recognised in other comprehensive income or directly in equity.
Companies within the group may be entitled to claim tax incentives (eg. the Research and Development Tax Incentive regime in Australia). The effect of this is a reduction to the income tax payable and current tax expense.

118 ANNUAL REPORT 2019 FLIGHT CENTRE TRAVEL GROUP
NOTES TO THE FINANCIAL STATEMENTS CONTINUED
I SUMMARY OF ACCOUNTING POLICIES (CONTINUED)
II. TAX CONSOLIDATION LEGISLATION
FLT and its wholly-owned Australian controlled entities implemented the tax consolidation legislation as of 1 July 2003.
The head entity, FLT, and the tax consolidated group’s controlled entities continue to account for their current and deferred tax amounts. These tax amounts are measured as if each entity continues to be a standalone taxpayer.
In addition to its current and deferred tax amounts, FLT also recognises the current tax liabilities (or assets) and the deferred tax assets arising from unused tax losses and unused tax credits assumed from the tax consolidated group’s controlled entities.
III. NATURE OF THE TAX SHARING ARRANGEMENT
Members of the tax consolidated group have entered into a tax sharing agreement that provides for the allocation of income tax liabilities between the entities should the head entity default on its tax payment obligations. No amounts have been recognised in the financial statements in respect of this agreement on the basis that the possibility of default is remote.
IV. NATURE OF THE TAX FUNDING AGREEMENT
Members of the tax consolidated group have entered into a tax funding agreement. Under the tax funding agreement, the wholly-owned entities fully compensate FLT for any current tax payable assumed and are compensated by FLT for any current tax receivable and deferred tax assets relating to unused tax losses or unused tax credits that are transferred to FLT under the tax consolidation legislation.
The funding amounts are the amounts recognised in the wholly-owned entities’ financial statements. Amounts receivable or payable under the tax funding agreement are due when the head entity’s funding advice is received. This advice is issued as soon as practicable after each financial year’s end. The head entity may also require payment of interim funding amounts to pay tax instalments. The funding amounts are recognised as current intercompany receivables or payables. Any differences between the amounts assumed and amounts receivable or payable under the tax funding agreements are recognised as a contribution to (or distribution from) wholly-owned tax consolidated entities.
(U) EARNINGS PER SHARE
I. BASIC EARNINGS PER SHARE
Basic earnings per share is calculated by dividing the profit attributable to the company’s equity holders, excluding any costs of servicing equity other than ordinary shares, by the weighted average number of ordinary shares outstanding during the financial year, adjusted for bonus elements in ordinary shares issued during the year.
II. DILUTED EARNINGS PER SHARE
Diluted earnings per share adjusts basic earnings per share to take into account the after income tax effect of interest and other financing costs associated with dilutive potential ordinary shares and the weighted average number of shares assumed to have been issued for no consideration in relation to dilutive potential ordinary shares.
(V) CONTRIBUTED EQUITYOrdinary shares are classified as equity (note D4) and entitle the holder to participate in dividends and the proceeds of the company’s wind up in proportion to the number of and amount paid on the shares held.
On a show of hands, every holder of an ordinary share present at a meeting, either in person or by proxy, is entitled to one vote. Upon a poll, each share is entitled to one vote.
Ordinary shares have no par value and there are no partly paid shares currently on issue.
Incremental costs directly attributable to new share or option issues are shown in equity as a deduction, net of tax, from the proceeds. Incremental costs directly attributable to shares or options issued for a business acquisition are not included in the acquisition’s cost as part of the purchase consideration.
If the entity reacquires its own equity instruments, as the result of a share buyback for example, those instruments are deducted from equity and the associated shares are cancelled. No gain or loss is recognised in the profit or loss and the consideration paid, including any directly attributable incremental costs (net of income taxes), is recognised directly in equity.

ANNUAL REPORT 2019 FLIGHT CENTRE TRAVEL GROUP 119
I SUMMARY OF ACCOUNTING POLICIES (CONTINUED)
(W) DIVIDENDSProvision is made by the parent entity for any dividend declared, being appropriately authorised and no longer at the entity’s discretion on or before the end of the financial year but not distributed at balance date.
(X) GST / CONSUMPTION TAXRevenues, expenses, assets and liabilities are recognised net of the amount of associated consumption tax, unless the consumption tax incurred is not recoverable from the taxation authority. In this case, it is recognised as part of the asset acquisition’s cost or as part of the expense.
Receivables and payables include consumption taxes receivable or payable. The net amount of consumption tax recoverable from, or payable to, the taxation authority is included with other receivables or payables in the balance sheet.
Cash flows are presented on a gross basis. The consumption tax components of cash flows arising from investing or financing activities which are recoverable from, or payable to, the taxation authority are presented as operating cash flows.
(Y) NEW ACCOUNTING STANDARDS AND INTERPRETATIONS ISSUED BUT NOT YET EFFECTIVECertain new accounting standards and interpretations have been published that are not mandatory for the 30 June 2019 reporting period. FLT is in the process of determining the impact of these new standards and interpretations.
AASB 16 LEASES
AASB 16 Leases will replace existing accounting requirements for leases, including those as set out in AASB 117 Leases for FLT’s financial year commencing 1 July 2019.
Under AASB 16 Leases, FLT’s accounting for operating leases as a lessee will result in the recognition of a right of use (ROU) asset and an associated lease liability on the Balance Sheet. The lease liability is equal to the net present value of future lease payments, with the exception of variable lease payments, short term and low value leases. Interest expense will be recognised from the accretion of lease liabilities over the lease term and a depreciation charge will be recognised on the ROU assets. There are additional disclosure requirements under the new standard.
FLT will implement the standard as at 1 July 2019. For contracts in place at this date, FLT will continue to apply its existing assessment of leases under current accounting standards (“grandfathering”), instead of reassessing whether existing contracts are or contain a lease at the date of application of the new standard. Contracts signed after 1 July 2019 will be assessed against the lease identification criteria under AASB 16.
FLT lease portfolio largely consists of land and buildings for its offices and retail stores. Lease contracts contain a wide variety of terms and conditions and are negotiated individually. The leases identified as at 30 June 2019 have a non-cancellable period of 3-18 years and may include options to extend.
FLT’s undiscounted non-cancellable operating lease commitments of $680,178,000 at 30 June 2019 under AASB 117 Leases are shown in note F1.
On transition, FLT will apply the full retrospective approach as permitted by AASB 16. The full retrospective approach on transition requires AASB 16 to be applied to FLT’s lease portfolio as if it had always been in place, including restatement of the comparative information.
The impact of applying AASB 16 on the consolidated financial statements in the period of initial application will depend on future economic conditions, including FLT’s incremental borrowing rate post 1 July 2019, the composition of FLT’s lease portfolio and the new accounting policies, which are subject to change until FLT presents the consolidated financial statements as at 30 June 2020.

NOTES TO THE FINANCIAL STATEMENTS
120 ANNUAL REPORT 2019 FLIGHT CENTRE TRAVEL GROUP
I SUMMARY OF ACCOUNTING POLICIES (CONTINUED)
AASB INTERPRETATION 23 UNCERTAINTY OVER INCOME TAX TREATMENT
The Interpretation addresses the accounting for income taxes when tax treatments involve uncertainty that affects the application of AASB 112 and does not apply to taxes or levies outside the scope of AASB 112, nor does it specifically include requirements relating to interest and penalties associated with uncertain tax treatments. The Interpretation specifically addresses the following:
• Whether an entity considers uncertain tax treatments separately• The assumptions an entity makes about the examination of tax treatments by taxation authorities• How an entity determines taxable profit (tax loss), tax bases, unused tax losses, unused tax credits and tax rates• How an entity considers changes in facts and circumstances
An entity must determine whether to consider each uncertain tax treatment separately or together with one or more other uncertain tax treatments. The approach that better predicts the resolution of the uncertainty should be followed. The interpretation is effective for annual reporting periods beginning on or after 1 January 2019, but certain transition reliefs are available. FLT will apply interpretation from its effective date of 1 July 2019. Since FLT operates in a complex multinational tax environment, applying the Interpretation may affect its consolidated financial statements and the required disclosures. In addition, FLT may need to establish processes and procedures to obtain information that is necessary to apply the Interpretation on a timely basis.
There are no other standards that have been issued but are not yet effective and that are expected to have a material financial impact on the entity in the current or future reporting periods and on foreseeable future transactions.
ANNUAL REPORT 2019 FLIGHT CENTRE TRAVEL GROUP 121
DIRECTORS’ DECLARATIONIn accordance with a resolution of the directors of Flight Centre Travel Group Limited, I state that:
1. In the opinion of the directors:(a) the financial statements and notes of Flight Centre Travel Group Limited for the financial year ended 30 June
2019 are in accordance with the Corporations Act 2001, including:
ii. giving a true and fair view of the consolidated entity’s financial position as at 30 June 2019 and of its performance for the year ended on that date; and
iii. complying with Accounting Standards and the Corporations Regulations 2001;
(b) the financial statements and notes also comply with International Financial Reporting Standards as disclosed in Note I(a); and
(c) there are reasonable grounds to believe that the company will be able to pay its debts as and when they become due and payable
2. At the date of this declaration, there are reasonable grounds to believe that the members of the extended closed group identified in note G2 will be able to meet any obligations or liabilities to which they are, or may become, subject to by virtue of the deed of cross guarantee described in note G2.
3. This declaration has been made after receiving the declarations required to be made to the directors by the chief executive officer and the chief financial officer in accordance with section 295A of the Corporations Act 2001 for the financial year ended 30 June 2019.
On behalf of the board
G.F. Turner Director BRISBANE
22 August 2019

122 ANNUAL REPORT 2019 FLIGHT CENTRE TRAVEL GROUP
A member firm of Ernst & Young Global Limited Liability limited by a scheme approved under Professional Standards Legislation
A member firm of Ernst & Young Global Limited Liability limited by a scheme approved under Professional Standards Legislation
Ernst & Young 111 Eagle Street Brisbane QLD 4000 Australia GPO Box 7878 Brisbane QLD 4001
Tel: +61 7 3011 3333 Fax: +61 7 3011 3100 ey.com/au
Independent Auditor's Report to the Members of Flight Centre Travel Group Limited
Report on the Audit of the Financial Report
Opinion
We have audited the financial report of Flight Centre Travel Group Limited (the Company) and its subsidiaries (collectively the Group), which comprises the balance sheet as at 30 June 2019, the statement of profit or loss, statement of other comprehensive income, statement of cash flows and statement of changes in equity for the year then ended, notes to the financial statements, including a summary of significant accounting policies, and the directors' declaration.
In our opinion, the accompanying financial report of the Group is in accordance with the Corporations Act 2001, including:
a) giving a true and fair view of the consolidated financial position of the Group as at 30 June 2019 and of its consolidated financial performance for the year ended on that date; and
b) complying with Australian Accounting Standards and the Corporations Regulations 2001.
Basis for Opinion
We conducted our audit in accordance with Australian Auditing Standards. Our responsibilities under those standards are further described in the Auditor’s Responsibilities for the Audit of the Financial Report section of our report. We are independent of the Group in accordance with the auditor independence requirements of the Corporations Act 2001 and the ethical requirements of the Accounting Professional and Ethical Standards Board’s APES 110 Code of Ethics for Professional Accountants (the Code) that are relevant to our audit of the financial report in Australia. We have also fulfilled our other ethical responsibilities in accordance with the Code.
We believe that the audit evidence we have obtained is sufficient and appropriate to provide a basis for our opinion.
Key Audit Matters
Key audit matters are those matters that, in our professional judgment, were of most significance in our audit of the financial report of the current year. These matters were addressed in the context of our audit of the financial report as a whole, and in forming our opinion thereon, but we do not provide a separate opinion on these matters. For each matter below, our description of how our audit addressed the matter is provided in that context.
We have fulfilled the responsibilities described in the Auditor’s Responsibilities for the Audit of the Financial Report section of our report, including in relation to these matters. Accordingly, our audit included the performance of procedures designed to respond to our assessment of the risks of material misstatement of the financial report. The results of our audit procedures, including the procedures performed to address the matters below, provide the basis for our audit opinion on the accompanying financial report.
ANNUAL REPORT 2019 FLIGHT CENTRE TRAVEL GROUP 123
A member firm of Ernst & Young Global Limited Liability limited by a scheme approved under Professional Standards Legislation
A member firm of Ernst & Young Global Limited Liability limited by a scheme approved under Professional Standards Legislation
1. Impairment Testing of Goodwill and Other Intangible Assets
Why Significant How our audit addressed the key audit matter
Note A5 discloses the goodwill and other intangible assets allocated to each of the Group’s individually significant cash generating units (CGUs). It also discloses the impairment recorded in relation to Olympus Tours CGU during the year. The annual impairment assessment of intangible assets performed by the Group was a key audit matter due to the value of intangible assets relative to total assets and the degree of estimation and assumptions involved in the assessment, specifically concerning future discounted cash flows.
Our audit considered the requirements of Australian Accounting Standard AASB136 Impairment of Assets. We considered indicators of impairment for each of the Group’s individually significant CGUs. The assumptions used in the cash flow forecasts prepared by the Group are summarised in Note A5 to the financial statements. We evaluated these cash flow forecasts as follows:
► Assessed the mathematical accuracy of the cash flow model.
► Considered the historical reliability of the Group’s cash
flow forecasts. ► Assessed whether the forecasts were consistent with
our knowledge of the business including Board approved budgets, corroborating our work with external information where possible.
► Assessed the sensitivities of the impairment model to reasonably possible changes in assumptions relating to cash flow forecasts, terminal growth rates and discount rates applied.
► Considered the related financial report disclosures including the adequacy of those related to the impairment.
As impairment testing relies upon business valuation principles, we used our valuation specialists to evaluate the growth rates and discount rates used by the Group. We assessed the impairment recorded and disclosure in Note A5 to the financial statements.
2. Business acquisitions
Why Significant How our audit addressed the key audit matter
Business acquisitions was a key audit matter due to the number of acquisitions which resulted in business combinations and investments in associates during the year. Notes A6 and E1 to the financial statements provides a summary of the acquisitions and the Group’s accounting policies relating to the acquisitions.
Our audit procedures for each of the acquisitions included the following: ► Assessed whether the transaction was accounted for in
accordance with the applicable Australian Accounting Standard.
► Assessed the Group’s determination of the purchase price accounting including identification and fair value attributable to intangible assets acquired.
► Assessed the Group’s determination of fair value of any contingent consideration.
► Evaluated the adequacy of the Group’s disclosures in Notes A6 and E1 to the financial statements. A member firm of Ernst & Young Global Limited
Liability limited by a scheme approved under Professional Standards Legislation
1. Impairment Testing of Goodwill and Other Intangible Assets
Why Significant How our audit addressed the key audit matter
Note A5 discloses the goodwill and other intangible assets allocated to each of the Group’s individually significant cash generating units (CGUs). It also discloses the impairment recorded in relation to Olympus Tours CGU during the year. The annual impairment assessment of intangible assets performed by the Group was a key audit matter due to the value of intangible assets relative to total assets and the degree of estimation and assumptions involved in the assessment, specifically concerning future discounted cash flows.
Our audit considered the requirements of Australian Accounting Standard AASB136 Impairment of Assets. We considered indicators of impairment for each of the Group’s individually significant CGUs. The assumptions used in the cash flow forecasts prepared by the Group are summarised in Note A5 to the financial statements. We evaluated these cash flow forecasts as follows:
► Assessed the mathematical accuracy of the cash flow model.
► Considered the historical reliability of the Group’s cash
flow forecasts. ► Assessed whether the forecasts were consistent with
our knowledge of the business including Board approved budgets, corroborating our work with external information where possible.
► Assessed the sensitivities of the impairment model to reasonably possible changes in assumptions relating to cash flow forecasts, terminal growth rates and discount rates applied.
► Considered the related financial report disclosures including the adequacy of those related to the impairment.
As impairment testing relies upon business valuation principles, we used our valuation specialists to evaluate the growth rates and discount rates used by the Group. We assessed the impairment recorded and disclosure in Note A5 to the financial statements.
2. Business acquisitions
Why Significant How our audit addressed the key audit matter
Business acquisitions was a key audit matter due to the number of acquisitions which resulted in business combinations and investments in associates during the year. Notes A6 and E1 to the financial statements provides a summary of the acquisitions and the Group’s accounting policies relating to the acquisitions.
Our audit procedures for each of the acquisitions included the following: ► Assessed whether the transaction was accounted for in
accordance with the applicable Australian Accounting Standard.
► Assessed the Group’s determination of the purchase price accounting including identification and fair value attributable to intangible assets acquired.
► Assessed the Group’s determination of fair value of any contingent consideration.
► Evaluated the adequacy of the Group’s disclosures in Notes A6 and E1 to the financial statements.

124 ANNUAL REPORT 2019 FLIGHT CENTRE TRAVEL GROUP
A member firm of Ernst & Young Global Limited Liability limited by a scheme approved under Professional Standards Legislation
3: Recoverability of volume incentive receivables Why Significant How our audit addressed the key audit matter
The recoverability of the volume incentive receivables was a key audit matter due to the judgmental nature of this contract asset and external factors outside the control of the Group affecting its recoverability which could have a material impact on the financial statements.
The details of this are disclosed in Note F4 in the financial report.
Our audit procedures included the following:
► Evaluated the Group’s accounting for volume incentiveswas in accordance with the new accounting standard,AASB15 Revenues from Contracts with Customers.
► Verified the receipt of a sample of volume incentivereceivables recorded at 30 June 2019 subsequent toyear end.
► Examined a sample of the volume incentive contractsheld for verification of contract terms includingguaranteed payments and volume incentives.
► Evaluated renegotiations are supported by adequatedocumentation.
► Assessed the methodology used to derive the volumeincentive contract asset at 30 June 2019, includingchanges made to the assumptions during the financialyear, and testing the historical volumes obtained.
Information Other than the Financial Report and Auditor’s Report Thereon
The directors are responsible for the other information. The other information comprises the information included in the Company’s 2019 Annual Report, but does not include the financial report and our auditor’s report thereon.
Our opinion on the financial report does not cover the other information and accordingly we do not express any form of assurance conclusion thereon, with the exception of the Remuneration Report and our related assurance opinion.
In connection with our audit of the financial report, our responsibility is to read the other information and, in doing so, consider whether the other information is materially inconsistent with the financial report or our knowledge obtained in the audit or otherwise appears to be materially misstated.
If, based on the work we have performed, we conclude that there is a material misstatement of this other information, we are required to report that fact. We have nothing to report in this regard.
Responsibilities of the Directors for the Financial Report
The directors of the Company are responsible for the preparation of the financial report that gives a true and fair view in accordance with Australian Accounting Standards and the Corporations Act 2001 and for such internal control as the directors determine is necessary to enable the preparation of the financial report that gives a true and fair view and is free from material misstatement, whether due to fraud or error.
In preparing the financial report, the directors are responsible for assessing the Group’s ability to continue as a going concern, disclosing, as applicable, matters relating to going concern and using the going concern basis of accounting unless the directors either intend to liquidate the Group or to cease operations, or have no realistic alternative but to do so.
A member firm of Ernst & Young Global LimitedLiability limited by a scheme approved under Professional Standards Legislation

ANNUAL REPORT 2019 FLIGHT CENTRE TRAVEL GROUP 125
A member firm of Ernst & Young Global Limited Liability limited by a scheme approved under Professional Standards LegislationA member firm of Ernst & Young Global Limited
Liability limited by a scheme approved under Professional Standards Legislation
Auditor's Responsibilities for the Audit of the Financial Report
Our objectives are to obtain reasonable assurance about whether the financial report as a whole is free from material misstatement, whether due to fraud or error, and to issue an auditor’s report that includes our opinion. Reasonable assurance is a high level of assurance, but is not a guarantee that an audit conducted in accordance with the Australian Auditing Standards will always detect a material misstatement when it exists. Misstatements can arise from fraud or error and are considered material if, individually or in the aggregate, they could reasonably be expected to influence the economic decisions of users taken on the basis of this financial report.
As part of an audit in accordance with the Australian Auditing Standards, we exercise professional judgment and maintain professional scepticism throughout the audit. We also: • Identify and assess the risks of material misstatement of the financial report, whether due to
fraud or error, design and perform audit procedures responsive to those risks, and obtain audit evidence that is sufficient and appropriate to provide a basis for our opinion. The risk of not detecting a material misstatement resulting from fraud is higher than for one resulting from error, as fraud may involve collusion, forgery, intentional omissions, misrepresentations, or the override of internal control.
• Obtain an understanding of internal control relevant to the audit in order to design audit
procedures that are appropriate in the circumstances, but not for the purpose of expressing an opinion on the effectiveness of the Group’s internal control.
• Evaluate the appropriateness of accounting policies used and the reasonableness of accounting
estimates and related disclosures made by the directors. • Conclude on the appropriateness of the directors’ use of the going concern basis of accounting
and, based on the audit evidence obtained, whether a material uncertainty exists related to events or conditions that may cast significant doubt on the Group’s ability to continue as a going concern. If we conclude that a material uncertainty exists, we are required to draw attention in our auditor’s report to the related disclosures in the financial report or, if such disclosures are inadequate, to modify our opinion. Our conclusions are based on the audit evidence obtained up to the date of our auditor’s report. However, future events or conditions may cause the Group to cease to continue as a going concern.
• Evaluate the overall presentation, structure and content of the financial report, including the
disclosures, and whether the financial report represents the underlying transactions and events in a manner that achieves fair presentation.
• Obtain sufficient appropriate audit evidence regarding the financial information of the entities
or business activities within the Group to express an opinion on the financial report. We are responsible for the direction, supervision and performance of the Group audit. We remain solely responsible for our audit opinion.
We communicate with the directors regarding, among other matters, the planned scope and timing of the audit and significant audit findings, including any significant deficiencies in internal control that we identify during our audit.
We also provide the directors with a statement that we have complied with relevant ethical requirements regarding independence, and to communicate with them all relationships and other matters that may reasonably be thought to bear on our independence, and where applicable, related safeguards.

126 ANNUAL REPORT 2019 FLIGHT CENTRE TRAVEL GROUP
A member firm of Ernst & Young Global Limited Liability limited by a scheme approved under Professional Standards Legislation
A member firm of Ernst & Young Global Limited Liability limited by a scheme approved under Professional Standards Legislation
From the matters communicated to the directors, we determine those matters that were of most significance in the audit of the financial report of the current year and are therefore the key audit matters. We describe these matters in our auditor’s report unless law or regulation precludes public disclosure about the matter or when, in extremely rare circumstances, we determine that a matter should not be communicated in our report because the adverse consequences of doing so would reasonably be expected to outweigh the public interest benefits of such communication.
Report on the Audit of the Remuneration Report
Opinion on the Remuneration Report
We have audited the Remuneration Report included in the directors' report for the year ended 30 June 2019.
In our opinion, the Remuneration Report of Flight Centre Travel Group Limited for the year ended 30 June 2019, complies with section 300A of the Corporations Act 2001.
Responsibilities
The directors of the Company are responsible for the preparation and presentation of the Remuneration Report in accordance with section 300A of the Corporations Act 2001. Our responsibility is to express an opinion on the Remuneration Report, based on our audit conducted in accordance with Australian Auditing Standards.
Ernst & Young
Ric Roach Partner Brisbane 22 August 2019

ANNUAL REPORT 2019 FLIGHT CENTRE TRAVEL GROUP 127
SHAREHOLDER INFORMATIONThe shareholder information set out below was applicable at 18 July 2019.
(A) DISTRIBUTION OF EQUITY SECURITIES
NUMBER OF SHARESNUMBER OF
SHAREHOLDERS
1-1,000 19,057
1,001-5,000 2,619
5,001-10,000 197
10,001-100,000 87
100,001 and over 27
There were 463 holders of less than a marketable parcel of ordinary shares.
(B) EQUITY SECURITY HOLDERS
TWENTY LARGEST QUOTED EQUITY SECURITY HOLDERS
NAME NUMBER HELDPERCENTAGE OF ISSUED SHARES
Gainsdale Pty Ltd ¹ 15,200,000 15.0%
Gehar Pty Ltd ¹ 14,270,851 14.1%
James Management Services Pty Ltd ¹ 12,989,750 12.9%
Airlie Funds Mgt 3,681,239 3.6%
Ellerston Capital 3,674,831 3.6%
Pendal Group 2,023,885 2.0%
Selector Funds Mgt 1,873,018 1.9%
BlackRock Investment Mgt - Index (San Francisco) 1,853,400 1.8%
State Street Global Advisors 1,781,680 1.8%
Vanguard Group 1,620,452 1.6%
Vanguard Investments Australia 1,318,877 1.3%
Friday Investments Pty Limited 1,238,769 1.2%
Norges Bank Investment Mgt 1,230,666 1.2%
Firetrail Investments 1,219,440 1.2%
Lazard Asset Mgt Pacific Co 1,008,167 1.0%
Dimensional Fund Advisors 989,992 1.0%
IFM Investors 954,720 0.9%
AQR Capital Mgt 910,823 0.9%
Martin Currie Australia 839,701 0.8%
BlackRock Investment Mgt - Index (London) 694,793 0.7%
69,375,054 68.6%
1 Substantial holder (including associate holdings) in the company
Gainsdale Pty Ltd, Gehar Pty Ltd and James Management Services Pty Ltd are party to a “deed of pre-emption” initially issued 5 October 1995 and amended 19 June 2018, which binds each of the parties to give first right of refusal on the purchase of shares in the company. The deed automatically terminates if the parties collectively hold less than 35% of the total issued share capital of FLT at any time.
ORDINARY SHARES VOTING RIGHTSOn a show of hands, every member present at a meeting in person or by proxy shall have one vote. Upon a poll, each share shall have one vote. Options and performance rights have no voting rights.
ON-MARKET BUY-BACKSFLT does not currently have an on-market buy-back scheme in operation.

128 ANNUAL REPORT 2019 FLIGHT CENTRE TRAVEL GROUP
TAX TRANSPARENCY REPORT (UNAUDITED)
As one of the world’s largest travel agency groups FLT is committed to being a responsible corporate taxpayer. The Board has therefore chosen to provide additional disclosure of tax information as recommended by the Board of Taxation’s Voluntary Tax Transparency Code. FLT is classified as a ‘large business’ for the purposes of the Tax Transparency Code and has therefore chosen to disclose the following information in this annual report:
• Tax policy, strategy and governance summary• Reconciliation of accounting profit to tax expense• Reconciliation of income tax expense and income tax payable• Identification of material temporary and non-temporary differences• Accounting effective company tax rates for Australian and global operations• Tax contribution summary for corporate taxes paid• Information about international related party dealings
TAX POLICY, STRATEGY AND GOVERNANCE STATEMENT
APPROACH TO RISK MANAGEMENT AND GOVERNANCE ARRANGEMENTSFLT operates under a Tax Risk Management and Governance Policy, which is approved by the Board Audit committee and sets out FLT’s commitment to managing its global tax obligations. It is consistent with the Australian Taxation Office (ATO) and the Organisation for Economic Co-operation and Development (OECD)’s recommendations for tax risk management and governance, as well as being consistent with FLT’s overarching Risk Management Policy.
FLT’s Tax Risk Management and Governance Policy includes formal tax policies and procedures that are reviewed and updated at least annually. FLT has appropriate systems, processes and controls in place to identify, evaluate, mitigate, monitor and report on tax risks.
ATTITUDE TOWARDS TAX PLANNING AND ACCEPTED LEVEL OF RISK IN RELATION TO TAXATIONFLT takes a conservative approach to tax risk, and the management of tax risk will be balanced with FLT’s objective to create and safeguard shareholder value. Where there is a choice between an aggressive tax position and a more conservative position, FLT will take the more conservative approach. That is, FLT aims for certainty on tax positions it adopts but where tax law is unclear or subject to interpretation, written advice or confirmation will be sought as appropriate.
As a global travel business, FLT has entities in many jurisdictions around the world, including some considered low, or no tax according to the OECD. These businesses are purely established to support the ordinary business operations of FLT in those countries.
APPROACH TO ENGAGEMENT WITH THE ATO AND OTHER REVENUE AUTHORITIESFLT’s tax philosophy is based on an open, co-operative and transparent relationship with the Revenue Authorities. FLT maintains good relationships with the ATO and other revenue authorities. Openness, honesty and transparency is paramount in all dealings with the tax authorities and other relevant bodies, with the aim of minimising the risk of challenge, dispute or damage to FLT’s credibility.
FLT is aware of and, where appropriate, effectively uses the services and compliance products offered by the revenue authorities to reduce its tax risks and compliance costs (e.g. private ruling process, electronic lodgement, tax portal etc).
The ATO recently completed a Streamlined Assurance Review of FLT, to obtain confidence that the right amount of tax is being paid by FLT. The ATO’s final report was recently issued, confirming that following an open and wholesome review process, no material risks were identified and no further actions will be taken by the ATO. Further, the ATO commended FLT on its voluntary registration as a signatory to the Board of Taxation’s voluntary Tax Transparency Code.
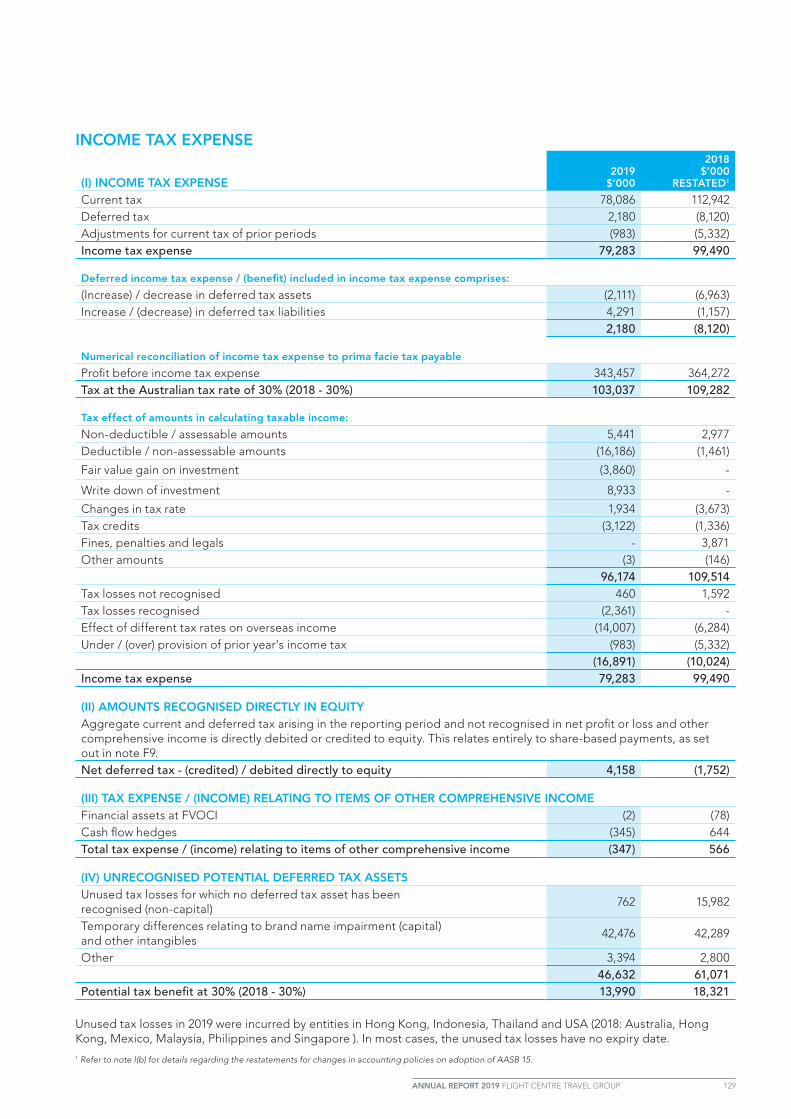
ANNUAL REPORT 2019 FLIGHT CENTRE TRAVEL GROUP 129
INCOME TAX EXPENSE
(I) INCOME TAX EXPENSE2019
$’000
2018 $’000
RESTATED1
Current tax 78,086 112,942Deferred tax 2,180 (8,120)Adjustments for current tax of prior periods (983) (5,332)Income tax expense 79,283 99,490
Deferred income tax expense / (benefit) included in income tax expense comprises:
(Increase) / decrease in deferred tax assets (2,111) (6,963)Increase / (decrease) in deferred tax liabilities 4,291 (1,157)
2,180 (8,120)
Numerical reconciliation of income tax expense to prima facie tax payable
Profit before income tax expense 343,457 364,272Tax at the Australian tax rate of 30% (2018 - 30%) 103,037 109,282
Tax effect of amounts in calculating taxable income:
Non-deductible / assessable amounts 5,441 2,977Deductible / non-assessable amounts (16,186) (1,461)
Fair value gain on investment (3,860) -
Write down of investment 8,933 -
Changes in tax rate 1,934 (3,673)Tax credits (3,122) (1,336)Fines, penalties and legals - 3,871Other amounts (3) (146)
96,174 109,514Tax losses not recognised 460 1,592Tax losses recognised (2,361) -Effect of different tax rates on overseas income (14,007) (6,284)Under / (over) provision of prior year’s income tax (983) (5,332)
(16,891) (10,024)Income tax expense 79,283 99,490
(II) AMOUNTS RECOGNISED DIRECTLY IN EQUITYAggregate current and deferred tax arising in the reporting period and not recognised in net profit or loss and other comprehensive income is directly debited or credited to equity. This relates entirely to share-based payments, as set out in note F9. Net deferred tax - (credited) / debited directly to equity 4,158 (1,752)
(III) TAX EXPENSE / (INCOME) RELATING TO ITEMS OF OTHER COMPREHENSIVE INCOMEFinancial assets at FVOCI (2) (78)Cash flow hedges (345) 644Total tax expense / (income) relating to items of other comprehensive income (347) 566
(IV) UNRECOGNISED POTENTIAL DEFERRED TAX ASSETSUnused tax losses for which no deferred tax asset has been recognised (non-capital)
762 15,982
Temporary differences relating to brand name impairment (capital) and other intangibles
42,476 42,289
Other 3,394 2,80046,632 61,071
Potential tax benefit at 30% (2018 - 30%) 13,990 18,321
Unused tax losses in 2019 were incurred by entities in Hong Kong, Indonesia, Thailand and USA (2018: Australia, Hong Kong, Mexico, Malaysia, Philippines and Singapore ). In most cases, the unused tax losses have no expiry date. 1 Refer to note I(b) for details regarding the restatements for changes in accounting policies on adoption of AASB 15.

130 ANNUAL REPORT 2019 FLIGHT CENTRE TRAVEL GROUP
TAX TRANSPARENCY REPORT (UNAUDITED) CONTINUED
INCOME TAX PAID AND INCOME TAX PAYABLE
(i) Calculation of current tax expenses NOTES2019
$’0002018
$’000
Current income tax expense of current period F10 78,086 112,942
Adjustments for current tax of prior periods F10 (983) (5,332)
Current income tax expense 77,103 107,610
(ii) Reconciliation of income tax expense to income tax paid and payable
Net current tax liability/(receivable) at the beginning of the period 11,890 (8,071)
Less income tax paid (90,676) (87,649)
Current income tax expense (i) 77,103 107,610
Net current tax liability/(receivable) at the end of the period (1,683) 11,890
EFFECTIVE COMPANY TAX RATES
Effective company tax rate2019
%
2018 %
RESTATED1
Effective tax rate - Australia 23.36% 29.52%
Effective tax rate - Global 23.08% 27.31%
The difference between the Australian corporate tax rate of 30% and FLT’s effective tax rate of 23.08% is the adjustments disclosed in the numerical reconciliation of income tax expense to prima facie tax payable note above including the effect of different tax rates on income derived in foreign jurisdictions (primarily the UK), tax credits claimed and Hong Kong losses recognised.
TAX CONTRIBUTION SUMMARY
2019 2018 - RESTATED2
AUSTRALIA $‘000
OTHER COUNTRIES
$‘000TOTAL $‘000
AUSTRALIA $‘000
OTHER COUNTRIES
$‘000TOTAL $‘000
Taxes paid by/on behalf of FLT
Corporate income tax 33,694 53,754 87,448 56,672 27,900 84,572
Employment taxes (payroll tax, FBT) 42,284 30,359 72,643 35,237 43,973 79,210
Withholding taxes 1,482 1,746 3,228 2,168 909 3,077
Taxes collected on behalf of others
GST/VAT (collected and remitted) 41,997 81,664 123,661 37,214 67,516 104,730
GST/VAT (paid but reclaimed) (49,611) (74,973) (124,584) (39,303) (72,292) (111,595)
PAYG/PAYE/salary withholding 166,178 165,505 331,683 146,851 153,459 300,310
Total Tax Contribution 236,024 258,055 494,079 238,839 221,465 460,304
1 Refer to note I(b) for details regarding the restatements for changes in accounting policies on adoption of AASB 15.2 Amounts have been reclassified in the prior year between Employment taxes and PAYG

ANNUAL REPORT 2019 FLIGHT CENTRE TRAVEL GROUP 131
TAX CONTRIBUTION SUMMARY (CONTINUED)
TOTAL TAX CONTRIBUTION BY COUNTRY
Corporate income tax
18%
Corporate income tax
19%
Employment taxes
(payroll tax, FBT)17%
Employment taxes
(payroll tax, FBT)14%
Withholding taxes1%
Withholding taxes1%
PAYG/PAYE salary
withholding64%
PAYG/PAYE salary
withholding66%
20182019
20182019
Australia52%
Australia47%
Canada 7%Canada 9%
India 2%India 3%
New Zealand5% New Zealand
5%
South Africa3%
South Africa3%
United Kingdom12% United Kingdom
12%
United States17%
United States18%
Other 2%Other 3%
Corporate income tax
18%
Corporate income tax
19%
Employment taxes
(payroll tax, FBT)17%
Employment taxes
(payroll tax, FBT)14%
Withholding taxes1%
Withholding taxes1%
PAYG/PAYE salary
withholding64%
PAYG/PAYE salary
withholding66%
20182019
20182019
Australia52%
Australia47%
Canada 7%Canada 9%
India 2%India 3%
New Zealand5% New Zealand
5%
South Africa3%
South Africa3%
United Kingdom12% United Kingdom
12%
United States17%
United States18%
Other 2%Other 3%
TOTAL TAX CONTRIBUTION BY TAX TYPE
Corporate income tax
18%
Corporate income tax
19%
Employment taxes
(payroll tax, FBT)17%
Employment taxes
(payroll tax, FBT)14%
Withholding taxes1%
Withholding taxes1%
PAYG/PAYE salary
withholding64%
PAYG/PAYE salary
withholding66%
20182019
20182019
Australia52%
Australia47%
Canada 7%Canada 9%
India 2%India 3%
New Zealand5% New Zealand
5%
South Africa3%
South Africa3%
United Kingdom12% United Kingdom
12%
United States17%
United States18%
Other 2%Other 3%
Corporate income tax
18%
Corporate income tax
19%
Employment taxes
(payroll tax, FBT)17%
Employment taxes
(payroll tax, FBT)14%
Withholding taxes1%
Withholding taxes1%
PAYG/PAYE salary
withholding64%
PAYG/PAYE salary
withholding66%
20182019
20182019
Australia52%
Australia47%
Canada 7%Canada 9%
India 2%India 3%
New Zealand5% New Zealand
5%
South Africa3%
South Africa3%
United Kingdom12% United Kingdom
12%
United States17%
United States18%
Other 2%Other 3%

132 ANNUAL REPORT 2019 FLIGHT CENTRE TRAVEL GROUP
TAX TRANSPARENCY REPORT (UNAUDITED) CONTINUED
RELATED PARTY TRANSACTIONSFLT has international related party dealings with its subsidiaries when it is in the best interests of FLT to do so, these dealings are conducted following the arm’s length principle as required by Australian taxation law and international taxation norms. FLT maintains contemporaneous transfer pricing documentation supporting the pricing of related party dealings in accordance with Australian tax legislation and the OECD Transfer Pricing Guidelines.
The key international related party dealings which have a material impact on FLT’s Australian taxable income are listed below.
KEY INTERNATIONAL RELATED PARTY DEALINGS DESCRIPTION
RoyaltiesFLT licences its brand names, trademarks and other intellectual property to its overseas subsidiaries. FLT subsidiaries may own other brandnames, trademarks and intellectual property.
Services
FLT’s head office is located in Brisbane, Australia as the company was founded in Australia and its largest operations are in Australia. Accordingly, there are a number of specialist teams located at the FLT headquarters which provide services to the overseas subsidiaries. In addition overseas subsidiaries also provide services to FLT.
Loans FLT has loans to and from its overseas subsidiaries.
Dividends FLT receives dividends from overseas subsidiaries.
Group Cost and Income Allocations
FLT and its overseas subsidiaries may enter into global contracts with suppliers and / or customers for which income and / or expenses may be allocated amongst the group.