Embed Size (px)
Citation preview

County Influenza Activity
State influenza and influenza-like illness (ILI) activity:
• Flu season is well underway with steady and sharp increases in activity over the past several weeks. In the first week of January (week 1):
• Flu activity levels remained high statewide and increases were observed in the northern regions of the state (see page 9). Statewide activity remains above peak levels observed during the previous two flu seasons.
• One influenza-associated pediatric death was reported in an unvaccinated child with underlying health conditions. Two influenza-associated pediatric deaths have been reported so far this season in Florida. Children, especially those with underlying health conditions, are at high risk for severe complications from influenza infection.
• Visits to emergency departments among adults aged ≥65 years continued to increase and remained well above peak activity observed during the previous two flu seasons. Adults in this age group are also at high risk for severe complications from influenza infection.
• Nine outbreaks were reported: eight influenza and one ILI; 73 outbreaks of influenza and ILI have been reported since the start of the 2017-18 season. More outbreaks have been reported so far this season than in previous seasons at this time, which may be an indication of a more severe influenza season.
National influenza activity:
• Influenza activity continued to increase sharply and was well above the national baseline. The majority of states are experiencing high levels of ILI activity. Several national indicators are similar to those observed during the peak of the 2014-15 season, which was the most severe season in recent years.
• As in Florida, influenza A (H3) has been the most common influenza subtype reported to the Centers for Disease Control and Prevention (CDC).
Immunizations and prevention:
• The Florida Department of Health recommends that sick people stay home until fever-free for at least 24 hours (without the use of fever-reducing medication) and that all people exercise good handwashing practices.
• Get your flu shot now. Flu vaccines can vary in effectiveness from season to season but they continue to be the best way to prevent influenza infection and serious influenza complications. To locate a flu shot near you, contact your physician, your local county health department, or use the Florida Department of Health’s flu shot locator: www.floridahealth.gov/findaflushot.
Treatment:
• CDC recommends the use of antiviral treatment as soon as possible for all persons with suspected influenza for all hospitalized, severely ill, and people who are at higher risk for complications: children <2 years, adults ≥65 years old, and pregnant women, and those with underlying medical conditions; treatment should be administered within 48 hours of illness onset (but treatment administered after this period can still be beneficial), although, unfortunately, there is often a delay in administering antiviral treatment. A recent CDC health advisory stresses the importance of rapid and early antiviral treatment this season. For more information, visit: https://emergency.cdc.gov/han/han00409.asp.
• Clinicians should not wait for laboratory confirmation to administer antivirals for suspect influenza.
Florida 2017-18
Season FLU REVIEW Week 1: December 31, 2017-January 6, 2018 Summary
Posted January 10, 2018 on the Bureau of Epidemiology (BOE) website: www.floridahealth.gov/floridaflu Produced by the BOE, Florida Department of Health Contributors: Heather Rubino, PhD; Julia Munroe, MS; Mwedu Mtenga, MPH; Katie Kendrick, MPH; Amy Bogucki, MPH; Lea Heberlein-Larson, MPH; Valerie Mock, BS; Marshall Cone, MS; Pam Colarusso, MSH; Janet Hamilton, MPH, Leah Eisenstein, MPH.
Influenza and ILI Outbreaks Reported as of 1/6/2018
Widespread
Weekly State Influenza Activity
Table of Contents
on the next page
A (H3)
Predominately Circulating Strain
For more information see
page 7
For more information see
page 2
For more information see page 4
For more information see page 5

Page 2 In This Issue Page 2
Statewide ILI Visits
2017-18 2016-17 2015-16 2014-15
Figure 1 shows the percent of visits for ILI from ED and UCC chief complaint data for ESSENCE-FL participating facilities (n=309), week 40, 2014 to week 1, 2018.
In week 1, the percent of visits to EDs and UCCs decreased slightly but remained well above peak levels observed during the previous two seasons at this time.
Some regions continued to see increases in the percent of visits to EDs and UCCs for ILI during week 1 (see page 9).
ED and UCC Visits for ILI by Flu Season ED = emergency department, UCC = urgent care center, ILI = influenza-like illness
2017-18
2016-17
2015-16
2014-15
2013-14
17 20
Week40 43 46 49 52 2 5 8 11 14
Seas
on
Influenza surveillance goals:
• Influenza surveillance is conducted to detect changes in the influenza virus. These data are used to help determine the annual national vaccine composition and to prepare for potential epidemics or pandemics.
• Surveillance is also conducted to identify unusually severe presentations of influenza infection, detect outbreaks, and determine seasonal influenza trends in order to guide influenza prevention, particularly in high-risk populations like children, adults ≥65 years old, and pregnant women. These activities are particularly important at the start of flu season in order to identify potential changes in circulating influenza strains.
Note: Surveillance case definitions for influenza-like illness vary across surveillance systems. For more information on influenza surveillance systems and associated case definitions used in Florida, see page 15
In This Issue .................................................................. 2
Statewide ILI Visits ....................................................... 2
Statewide ILI Outpatient Visits and P&I Deaths ........... 3
County influenza and ILI Activity Maps ........................ 4
Influenza-Associated Pediatric Deaths ......................... 4
ILI Activity and Outbreaks by Setting ........................... 5
Influenza Laboratory Surveillance ................................ 8
Regional ILI Visits ......................................................... 9
Age Groups: ILI Visits and P&I Deaths ........................ 10
At-Risk Populations: ILI Visits ..................................... 11
ILI Activity by Population and Setting Type ................ 12
Respiratory Syncytial Virus Surveillance .................... 13
Other Respiratory Virus Surveillance ........................ 14
Florida ILI Surveillance System Summary .................. 15
Weekly State Influenza Activity Reporting Table of Contents
Influenza activity in Florida can vary widely from season to season. This unpredictability underscores the importance of influenza surveillance in Florida.
0
1
2
3
4
5
6
40 42 44 46 48 50 52 1 3 5 7 9 11 13 15 17 19 21 23 25 27 29 31 33 35 37 39
Pe
rce
nt
of V
isit
s
Week
Figure 1
Below is the state influenza activity level reported to the Centers for Disease Control and Prevention each week since the 2013-14 influenza season. Florida reported widespread influenza activity for week 1.
No data Sporadic Local Regional Widespread
The ESSENCE-FL ILI syndrome is composed of chief complaints that include the words “influenza” or “flu,” or chief complaints that include the words “fever” and “cough,” or
“fever” and “sore throat.” For more information on ESSENCE-FL , see page 11.
2017-18
2016-17
2015-16
2014-15
2013-14
8 11 14
Seas
on
17 20
Week40 43 46 49 52 2 5

Page 3 Statewide ILI Outpatient Visits and P&I Deaths Page 3
0
100
200
300
400
40 46 52 5 11 17 23 29 35 41 47 1 7 13 19 25 31 37 43 49 3 9 15 21 27 33 39 45 51
Nu
mb
er
of P
&I D
eath
s
Week
Expected Data
Upper Bounds
P&I Death Count
Figure 4 shows the number of preliminary estimated P&I deaths* for all Florida counties, the number of deaths predicted using a multi-year regression model, and the upper bound of the 95% confidence interval for this prediction.
P&I Deaths* Multi-Year Regression Model P&I = pneumonia and influenza
Figure 3 shows P&I deaths* for all Florida counties from the Bureau of Vital Statistics, as reported into ESSENCE-FL, week 40, 2014 to week 52, 2017.
In week 52 (ending December 30, 2017), 216 P&I deaths were reported.
The preliminary number of P&I deaths decreased and was slightly below levels observed in previous season at this time.
P&I Deaths* from Vital Statistics by Flu Season P&I = pneumonia and influenza
Figure 2 shows the percent of visits for ILI reported by ILINet outpatient providers statewide (n=44), week 40, 2014 to week 1, 2018. For ILINet, ILI is defined as a fever ≥100°F AND sore throat and/or cough in the absence of another known cause.
In week 1, the percent of visits for ILI reported by ILINet outpatient providers decreased slightly but remained above levels observed during the previous two seasons at this time.
Visits for ILI to Outpatient Providers by Flu Season ILI = influenza-like illness
* Current season P&I death counts are preliminary estimates and may change as more data are received. The most recent data available are displayed here. Vital statistics death records received in ESSENCE-FL are considered to be complete through week 52, 2017.
Figure 4
0
1
2
3
4
5
40 42 44 46 48 50 52 1 3 5 7 9 11 13 15 17 19 21 23 25 27 29 31 33 35 37 39
Pe
rce
nt
of V
isit
s
Week
Figure 2
0
50
100
150
200
250
300
350
400
40 42 44 46 48 50 52 1 3 5 7 9 11 13 15 17 19 21 23 25 27 29 31 33 35 37 39
Nu
mb
er
of P
&I D
eath
s
Week
Figure 3
2014-15 2015-16 2016-17 2017-18
2017-18 2016-17 2015-16 2014-15
For week 52 (ending December 30, 2017), 216 preliminary estimated P&I deaths were reported.
The upper bound of the 95% confidence interval for prediction is 257 deaths, with no excess deaths.
Increases in P&I deaths have historically lagged increases in influenza activity. Due to the steep increases in influenza activity in recent weeks, subsequent increases in P&I deaths are expected in the coming weeks.

Page 4
Figures 5-7 show the number of pediatric deaths associated with influenza infection, week 40, 2013 to week 1, 2018.
In week 1, one influenza-associated pediatric death was reported in an unvaccinated child with underlying health conditions. Two influenza-associated pediatric deaths in unvaccinated children have been reported so far this season.
While rare, Florida receives reports of influenza-associated pediatric deaths each season. Most deaths occur in unvaccinated children with underlying health conditions. Children, especially those with underlying health conditions, are at higher risk of severe outcomes from influenza infection.
Annual vaccination remains the best way to protect children against influenza. Now is the perfect time to get vaccinated. CDC recommends vaccination as long as influenza viruses are circulating. To learn more, please visit: www.cdc.gov/flu/protect/whoshouldvax.htm#annual-vaccination.
County Influenza and ILI Activity Maps
As of 9:30 a.m. January 10, 2018, a total of 67 (100%) counties reported their weekly level of influenza activity. Please note that data reported after the deadline (Tuesday at 5 p.m.) are recorded but may not be included in the activity maps for this week.
County influenza activity data are reported by county health departments through EpiGateway on a weekly basis. Information is used to determine county activity and includes laboratory results, outbreak reports, and ILI activity. The figures below reflect a county health department's assessment of influenza activity within their county. For week 1, 46 counties reported increasing activity, 14 counties reported activity at a plateau, and seven counties reported decreasing activity.
County Influenza Activity
County Influenza Activity Level for Week 1 Reported by 9:30 a.m. January 10, 2018
Map 1 County Influenza Activity Trend for Week 1 Reported by 9:30 a.m. January 10, 2018
Map 2
Figures 5-7
Influenza-Associated Pediatric Deaths
0
5
10
15
2013-14 2014-15 2015-16 2016-17 2017-18
Co
un
t
Influenza Season
Figure 5: Influenza-Associated Pediatric Deaths by Vaccination Status
Unvaccinated
Vaccinated
Vaccination statusunknown
Influenza-Associated Pediatric Deaths
0
5
10
15
2013-14 2014-15 2015-16 2016-17 2017-18
Co
un
t
Influenza Season
Figure 7: Influenza-Associated Pediatric Deaths by Strain Type
Influenza A (H3)
Influenza A 2009 (H1N1)
Influenza A unsubtyped
Influenza B
Influenza subtyping not performed
0
5
10
15
2013-14 2014-15 2015-16 2016-17 2017-18
Co
un
t
Influenza Season
Figure 6: Influenza-Associated Pediatric Deaths by Medical History
No known underlyingconditions
Underlying healthconditions

Page 5
Note: Colleges and universities, private businesses, local and state government offices, retirement homes, and other settings have not reported any out-breaks during this season.
The setting categorized as “Other” includes hotels, home schools, mental health facilities, residential treatment facilities, and rehabilitation facilities.
Table 1: Summary of Florida Influenza and ILI Outbreaks by Setting, Week 40, 2017 through Week 1, 2018*
Setting Total A (H3) A 2009 (H1N1)
A Unsubtyped
A & B Unsubtyped
B Yamagata
B Unsubtyped
Other respiratory viruses
Currently unknown pathogen
B Victoria
Influenza Unspecified
Schools 12 1 - 3 1 - 1 1 RSV 5 - -
Daycares 8 - - - - - - 7 RSV 1 - -
Jails & prisons 3 1 - 2 - - - - - - -
Mental health facilities - - - - - - - - - - -
Nursing homes & long-term care facilities
48 8 - 18 - - 3 1 RSV/rhinovirus
1 rhinovirus 14 - 3
Health care facilities 1 - - - - - - 1 RSV - - -
Other 1 1 - - - - - - - - -
Total 73 11 0 23 1 0 4 11 20 0 3
Map 3 shows influenza and ILI outbreaks by county for week 40, 2017 through week 1, 2018, as reported into Merlin.
In week 1, nine outbreaks were reported: eight influenza and one ILI. As of week 1, 73 outbreaks of influenza and ILI have been reported since the start of the 2017-18 influenza season. More outbreaks have been reported than at this time in previous seasons.
Nearly all of the outbreaks (93.2%) reported so far this season have been in facilities serving people at higher risk for complications due to influenza infection (children and adults aged ≥65 years). Based on the data available for the outbreaks that have been reported thus far, this flu season may be more severe; this trend will be monitored closely.
For more detailed information on influenza and ILI outbreaks reported in week 1, see page 6. Data presented on outbreaks are preliminary and subject to change as outbreak investigations progress.
Influenza and ILI Outbreaks by County Week 40, 2017 through Week 1, 2018
Map 3
Reported Influenza and ILI Outbreaks ILI = influenza-like illness
ILI Activity and Outbreaks by Setting
Reported Influenza and ILI Outbreaks by Facility Type ILI = influenza-like illness
Figure 8 shows the distribution of outbreaks by facility type and season.
In week 1, nine outbreaks were reported. Nearly all of the outbreaks reported so far this season (93.2%) have occurred in facilities serving at-risk subpopulations (adults aged ≥65 years and children).
0
20
40
60
80
100
120
140
160
2013-14 2014-15 2015-16 2016-17 2017-18
Nu
mb
er o
f O
utb
rea
ks
Influenza Season
Schools
Daycares
Jails and prisons
Group homes
Nursing homes and long-term carefacilitiesHealthcare settings
Other
Figure 8
*Outbreak etiology is updated for two weeks after initial report.

Page 6
Note: Colleges and universities, private businesses, local and state government offices, retirement homes, and other settings have not reported any out-breaks during this season.
The setting categorized as “Other” includes hotels, home schools, mental health facilities, residential treatment facilities, and rehabilitation facilities.
Reported Influenza and ILI Outbreaks ILI = influenza-like illness
ILI Activity and Outbreaks by Setting
In week 1, nine outbreaks were reported in Merlin: eight outbreaks of influenza and one outbreak of ILI.
Escambia County
• A long-term care facility reported six individuals with ILI. At least one individual tested positive for influenza A by rapid antigen testing at local health care providers. No specimens have been available for testing at the Bureau of Public Health Laboratories (BPHL) thus far. Influenza vaccination status for the 2017-18 for residents and staff is not yet known. Infection control measures were reviewed with facility leadership. This investigation is ongoing.
• A long-term care facility reported two residents and two staff members with ILI. Two specimens were collected for testing at BPHL. One specimen tested positive for influenza A by PCR thus far. The facility estimated 150 residents and 100 staff members were vaccinated for the 2017-18 influenza season. Infection control measures were reviewed with facility leadership. This investigation is ongoing.
• A long-term care facility reported four residents with ILI. Four specimens tested positive for influenza A by PCR at local health care providers and, of those, two viruses were typed as influenza A (H3). No specimens have been available for testing at BPHL thus far. Influenza vaccination status for residents and staff is not yet known. Infection control measures were reviewed with facility leadership. This investigation is ongoing.
Santa Rosa County:
• A correctional facility reported seven inmates with ILI. One inmate was hospitalized as a result of their illness. Three specimens were collected for testing at BPHL. One specimen tested positive for influenza A by PCR thus far. Influenza vaccination status for the 2017-18 season for inmates and staff is not yet known. Infection control measures were reviewed with facility leadership. This investigation is ongoing.
Seminole County:
• A nursing facility reported five residents with ILI. At least one resident tested positive for influenza A by rapid antigen testing at local health care providers. No specimens have been available for testing at BPHL thus far. The facility estimated 46 residents and 66 staff members were vaccinated for the 2017-18 influenza season. Infection control measures were reviewed with facility leadership. This investigation is ongoing.
Holmes County:
• An assisted living facility reported 17 residents and 13 staff members with ILI. Two individuals sought treatment at local emergency departments and one individual was hospitalized as a result of their illness. Ten individuals tested positive for influenza A by rapid antigen testing at local health care providers. Three specimens were collected for testing at BPHL. Those results are pending. Influenza vaccination status for the 2017-18 season for residents and staff is not yet known. Infection control measures were reviewed with facility leadership. This investigation is ongoing.
Leon County:
• A skilled nursing facility reported seven residents with ILI. Three individuals were hospitalized as a result of their illness. Two individuals tested positive for influenza A at local health care providers. At least one specimen was collected for testing at BPHL. Those results are pending. Influenza vaccination status for the 2017-18 season for residents and staff is not yet known. Infection control measures were reviewed with facility leadership. This investigation is ongoing.
Pinellas County:
• A skilled nursing facility reported six individuals with ILI. No specimens have been available for testing at BPHL thus far. The etiology of this outbreak is not yet known. Influenza vaccination status for the 2017-18 season for residents and staff is not yet known. Infection control measures were reviewed with facility leadership. This investigation is ongoing.
Brevard County
• A long-term care facility reported 12 residents with ILI. One individual sought treatment at a local emergency department and was hospitalized as a result of their illness. At least one individual tested positive for influenza A by rapid antigen testing. No specimens have been available for testing at BPHL thus far. The facility reported 80 residents and 110 staff members were vaccinated for the 2017-18 influenza season. Infection control measures were reviewed with facility leadership. This investigation is ongoing.
Continued on page 7.

Page 7
Reported Influenza and ILI Outbreaks ILI = influenza-like illness
Continued from page 6.
In week 52 (ending December 30, 2017), six outbreaks were reported into Merlin. Updates were made to two of these outbreaks during week 1.
Pinellas County:
• A long-term care facility reported six residents with ILI. No specimens have been available for testing at BPHL thus far. The etiology of this outbreak is not yet known. Influenza vaccination status for the 2017-18 season for residents and staff is not yet known. Infection control measures were reviewed with facility leadership. This investigation is ongoing. Update: an additional three residents and two staff members with ILI were reported. One individual was hospitalized as a result of their illness. The etiology of this outbreak remains unknown. This investigation is still ongoing.
Volusia County:
• An assisted living facility reported 16 individuals with ILI. No specimens have been available for testing at BPHL thus far. The etiology of this outbreak is not yet known. Influenza vaccination status for the 2017-18 season for residents and staff is not yet known. Infection control measures were reviewed with facility leadership. This investigation is ongoing. Update: an additional two individuals with ILI were reported, bringing the total to 13 residents and five staff members with ILI. Three individuals sought treatment at local emergency departments and three individuals were hospitalized as a result of their illness. No specimens were available for testing at BPHL. The etiology of this outbreak remains unknown. This investigation is closed.

Page 8 Laboratory Surveillance
Figures 9 and 10 use BPHL viral surveillance data.
Figure 9 shows the number of influenza-positive specimens tested by subtype and lab event date.*
The most common influenza subtype detected at BPHL statewide for the 2017-18 influenza season has been influenza A (H3). The Centers for Disease Control and Prevention (CDC) has continued to report extensive genetic diversity in the HA genes of influenza A (H3) viruses submitted to CDC for phylogenetic analysis. No significant antigenic drift has been reported. Seasons in which A (H3) viruses predominate are associated with more severe illness in young children and adults ≥65 years old. While statewide data indicate influenza A (H3) is the predominantly circulating strain, these data also indicate a substantial amount of influenza B viruses present and co-circulating.
Figure 10 shows the number of specimens tested by BPHL and the percent that were positive for influenza by lab event date.*
In week 1, the percent of specimens testing positive for influenza increased slightly and remained above levels observed during the previous two influenza seasons at this time.
*“Lab event date” is defined as the earliest of the following dates associated with influenza testing at the laboratory: date specimen collected, date received by the laboratory, date reported, or date inserted.
For county health departments seeking county-specific laboratory data, please refer to the Flu Lab Report in Merlin. For instructions on how to use the Flu Lab Report, please see the Guide to Flu Lab Report on the Bureau of Epidemiology website: www.floridahealth.gov/diseases-and-conditions/influenza/_documents/flulabreportguide.pdf
BPHL Viral Influenza Specimen Testing BPHL = Bureau of Public Health Laboratories
0%
25%
50%
75%
100%
0
50
100
150
200
40 48 4 12 20 28 36 44 52 8 16 24 32 40 48
Pe
rce
nt
Posi
tive
Tota
l Nu
mb
er o
f Te
sts
Week
Total number tested
Percent positive
Figure 10
0
20
40
60
80
100
40 48 4 12 20 28 36 44 52 8 16 24 32 40 48
Tota
l Nu
mb
er o
f Po
siti
ve T
est
s
Week
A (H3)A 2009 (H1N1)A (not yet subtyped)B VictoriaB YamagataB (not yet subtyped)
2015-16 2016-17 2017-18
Table 2: Bureau of Public Health Laboratories (BPHL) Viral Surveillance by Lab Event Date*
Reported by 10:00 a.m. January 10, 2018
Influenza Type Current Week 1 Previous Week 52 Current 2017-18 Season
Total Specimens Tested 45 42 735
Influenza positive specimens (% of total specimen tested) 30 (63.3%) 28 (65.1%) 366 (49.8%)
Influenza A 2009 (H1N1) (% of influenza positives) - - 31 (8.5%)
Influenza A (H3) (% of influenza positives) 19 (63.3%) 26 (92.9%) 256 (69.9%)
Influenza A not yet subtyped (% of influenza positives) 8 (26.7%) - 22 (6.0%)
Influenza B Yamagata (% of influenza positives) 3 2 (7.1%) 50 (13.7%) (10.0%)
Influenza B Victoria (% of influenza positives) - - 5 (1.4%)
Influenza B not yet subtyped (% of influenza positives) - 2 (0.5%) -
Figure 9
2015-16 2016-17 2017-18

Page 9
*There is no week 53 for the 2015-16, 2016-17, and 2017-18 seasons; the week 53 data point for those seasons is an average of weeks 52 and 1.
Regional ILI Visits Figures 11-17 show the percent of visits for ILI from ED and UCC chief complaints for ESSENCE-FL participating facilities (n=309), by ESSENCE-FL Regional Domestic Security Task Force regions (see map 4) from week 40, 2014 to week 1, 2018.* In week 1, the percent of ED and UCC visits
for ILI continued to increase in regions 1, 2, and 3 and decreased in all other regions. In most regions, activity levels remained above peak levels observed during the past two flu seasons. Activity levels remained highest in regions 1, where several outbreaks were also reported (see page 6).
ED and UCC Visits for ILI by Region ED = emergency department, UCC = urgent care center, ILI = influenza-like illness
0
1
2
3
4
5
6
7
8
40 44 48 52 3 7 11 15 19 23 27 31 35 39
Per
cen
t o
f V
isit
s
Week
Figure 11: Region 1 (19 facilities)
0
1
2
3
4
5
6
7
8
40 44 48 52 3 7 11 15 19 23 27 31 35 39
Per
cen
t o
f V
isit
s
Week
Figure 12: Region 2 (10 facilities)
0
1
2
3
4
5
6
7
8
40 44 48 52 3 7 11 15 19 23 27 31 35 39
Per
cen
t o
f V
isit
s
Week
Figure 13: Region 3 (35 facilities)
0
1
2
3
4
5
6
7
8
40 44 48 52 3 7 11 15 19 23 27 31 35 39
Percent of Visits
Week
0
1
2
3
4
5
6
7
8
40 44 48 52 3 7 11 15 19 23 27 31 35 39
Per
cen
t o
f V
isit
s
Week
Figure 14: Region 4 (53 facilities)
0
1
2
3
4
5
6
7
8
40 44 48 52 3 7 11 15 19 23 27 31 35 39
Per
cen
t o
f V
isit
s
Week
Figure 15: Region 5 (74 facilities)
0
1
2
3
4
5
6
7
8
40 44 48 52 3 7 11 15 19 23 27 31 35 39
Per
cen
t o
f V
isit
s
Week
Figure 16: Region 6 (32 facilities)
0
1
2
3
4
5
6
7
8
40 44 48 52 3 7 11 15 19 23 27 31 35 39
Per
cen
t o
f V
isit
s
Week
Figure 17: Region 7 (85 facilities)
2017-18 2016-17 2015-16 2014-15
Map 4
Emergency Departments (EDs) and
Urgent Care Centers (UCCs) Reporting
Data to ESSENCE-FL by Regional
Domestic Security Task Force Region,
January 10, 2018 (n=309)
Page 10
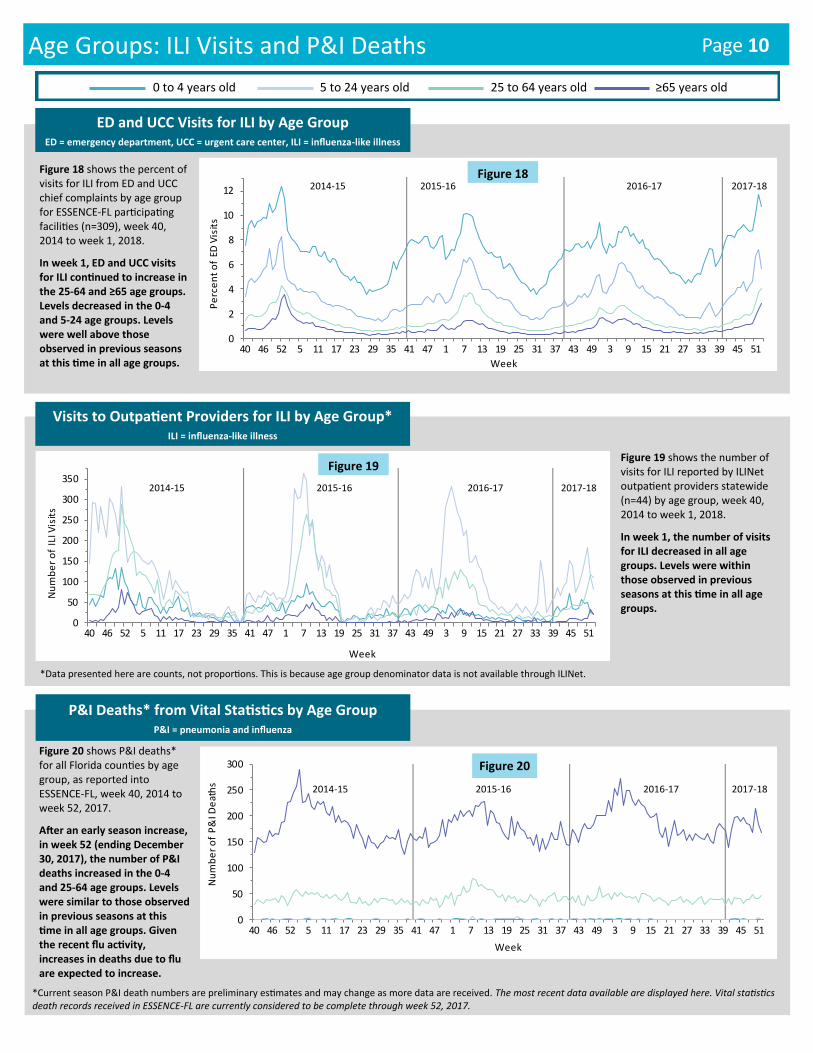
Figure 19 shows the number of visits for ILI reported by ILINet outpatient providers statewide (n=44) by age group, week 40, 2014 to week 1, 2018.
In week 1, the number of visits for ILI decreased in all age groups. Levels were within those observed in previous seasons at this time in all age groups.
Figure 18 shows the percent of visits for ILI from ED and UCC chief complaints by age group for ESSENCE-FL participating facilities (n=309), week 40, 2014 to week 1, 2018.
In week 1, ED and UCC visits for ILI continued to increase in the 25-64 and ≥65 age groups. Levels decreased in the 0-4 and 5-24 age groups. Levels were well above those observed in previous seasons at this time in all age groups.
0
50
100
150
200
250
300
350
40 46 52 5 11 17 23 29 35 41 47 1 7 13 19 25 31 37 43 49 3 9 15 21 27 33 39 45 51
Nu
mb
er
of
ILI V
isit
s
Week
Figure 19
Visits to Outpatient Providers for ILI by Age Group* ILI = influenza-like illness
*Data presented here are counts, not proportions. This is because age group denominator data is not available through ILINet.
0
2
4
6
8
10
12
40 46 52 5 11 17 23 29 35 41 47 1 7 13 19 25 31 37 43 49 3 9 15 21 27 33 39 45 51
Pe
rce
nt
of
ED V
isit
s
Week
ED and UCC Visits for ILI by Age Group ED = emergency department, UCC = urgent care center, ILI = influenza-like illness
Figure 18
0
50
100
150
200
250
300
40 46 52 5 11 17 23 29 35 41 47 1 7 13 19 25 31 37 43 49 3 9 15 21 27 33 39 45 51
Nu
mb
er
of
P&
I De
ath
s
Week
P&I Deaths* from Vital Statistics by Age Group P&I = pneumonia and influenza
Figure 20
*Current season P&I death numbers are preliminary estimates and may change as more data are received. The most recent data available are displayed here. Vital statistics death records received in ESSENCE-FL are currently considered to be complete through week 52, 2017.
Figure 20 shows P&I deaths* for all Florida counties by age group, as reported into ESSENCE-FL, week 40, 2014 to week 52, 2017.
After an early season increase, in week 52 (ending December 30, 2017), the number of P&I deaths increased in the 0-4 and 25-64 age groups. Levels were similar to those observed in previous seasons at this time in all age groups. Given the recent flu activity, increases in deaths due to flu are expected to increase.
0 to 4 years old 5 to 24 years old 25 to 64 years old ≥65 years old
Age Groups: ILI Visits and P&I Deaths
2014-15 2015-16 2016-17 2017-18
2014-15 2015-16 2016-17 2017-18
2014-15 2015-16 2016-17 2017-18

Page 11 At-Risk Populations: ILI Visits ESSENCE-FL collects data daily from 309 EDs and UCCs. Data are processed into 11 different syndrome categories based on the patient's chief complaint. One of the categories is ILI, which is composed of chief complaints that include the words "influenza" or "flu," or complaints that contain “fever” and “cough,” or “fever” and “sore throat.” The Florida Department of Health uses ED and UCC chief complaint data to monitor influenza and ILI activity in a timely manner in groups at higher risk of severe health outcomes (such as hospitalization and death) from influenza infection. These at-risk groups include pregnant women, children ≤18 years old, and adults ≥65 years old.
Figure 22 shows the percent of ILI visits among all ED and UCC visits for children ≤18 years old, as reported into ESSSENCE-FL, week 40, 2014 to week 1, 2018.
In week 1, the percent of ILI visits among all ED and UCC visits for children ≤18 years old decreased, but remained well above activity levels observed during previous seasons at this time.
Children are at higher risk for complications from influenza. Children who have not been vaccinated yet should get vaccinated as soon as possible. Influenza spreads easily among children. Sick children should be kept home.
Figure 23 shows the percent of ILI visits among all ED and UCC visits for adults ≥65 years old, as reported into ESSSENCE-FL, week 40, 2014 to week 1, 2018.
In week 1, the percent of ILI visits among all ED and UCC visits for adults ≥65 years continued to increase and remained well above peak activity levels observed during the previous two seasons.
Adults aged ≥65 years are at high-risk for complications due to influenza infection. People in this age group who have not yet been vaccinated for the 2017-18 season should get vaccinated as soon as possible.
ED and UCC Visits for ILI by Adults ≥65 Years Old ED = emergency department, UCC = urgent care center, ILI = influenza-like illness
ED and UCC Visits for ILI by Children ≤18 Years Old ED = emergency department, UCC = urgent care center, ILI = influenza-like illness
Pregnant women and their babies are at higher risk for severe complications due to influenza infection.
Figure 21 shows the number of visits* to EDs and UCCs with chief complaints of influenza infection and pregnancy, as reported into ESSSENCE-FL, week 40, 2014 to week 1, 2018.
In week 1, the number of visits to EDs and UCCs by pregnant women with mention of influenza was well above levels observed during the previous two seasons at this time. Pregnant women should get vaccinated as soon as possible.
ED and UCC Visits for ILI by Pregnant Women ED = emergency department, UCC = urgent care center, ILI = influenza-like illness
0
5
10
15
20
25
30
35
40
45
50
40 42 44 46 48 50 52 1 3 5 7 9 11 13 15 17 19 21 23 25 27 29 31 33 35 37 39
Nu
mb
er
of v
isit
s
Week
0
5
10
15
20
25
30
35
40
45
50
40 42 44 46 48 50 52 1 3 5 7 9 11 13 15 17 19 21 23 25 27 29 31 33 35 37 39
Nu
mb
er
of V
isit
s
Week
Figure 21
0
2
4
6
8
10
12
14
40 42 44 46 48 50 52 1 3 5 7 9 11 13 15 17 19 21 23 25 27 29 31 33 35 37 39
Pe
rce
nt
of v
isit
s
Week
0
2
4
6
8
10
12
14
40 42 44 46 48 50 52 1 3 5 7 9 11 13 15 17 19 21 23 25 27 29 31 33 35 37 39
Pe
rce
nt
of V
isit
s
Week
Figure 22
0
1
2
3
4
40 42 44 46 48 50 52 1 3 5 7 9 11 13 15 17 19 21 23 25 27 29 31 33 35 37 39
Pe
rce
nt
of V
isit
s
Week
Figure 23
2017-18 2016-17 2015-16 2014-15
*This count under-represents the true number of pregnant women presenting for care to EDs and UCCs with influenza. The overall trend has been validated through review of hospital discharge data collected by the Agency for Health Care Administration.

Page 12
County health departments are asked to evaluate influenza activity in certain settings within their county. The assessment scale for activity ranges from no or minimal activity to very high activity.
Figure 24 shows the results of the influenza activity assessment for week 1, 2018.
Counties that reported “not applicable” for the listed settings are excluded from the denominator in the calculations below.
ILI Activity Levels:
• No or very minimal activity
• Moderate activity
• High activity
• Very high activity
Settings for Children <18 Years Old Settings for Adults >65 Years Old
Settings for Adults 18 to 65 Years Old Other Unique Settings
In elementary schools, 47 counties (82.5%) reported no or minimal
influenza or ILI activity. One county (1.8%) reported moderate influenza
or ILI activity.
In daycare settings, 46 counties (80.7%) reported no or minimal
influenza or ILI activity. Two counties (3.5%) reported moderate
influenza or ILI activity.
In nursing homes, 40 counties (66.7%) reported no or minimal
influenza or ILI activity. Seven counties (11.7%) reported moderate
influenza or ILI activity. Two counties (3.3%) reported high influenza or
ILI activity. One county (1.7%) reported very high influenza or ILI
activity.
In retirement homes, 37 counties (72.5%) reported no or minimal
influenza or ILI activity. Four counties (7.8%) reported moderate
influenza or ILI activity.
In colleges, 31 of 41 counties (756%) reported no or minimal influenza
or ILI activity.
In businesses, 37 counties (74.0%) reported no or minimal influenza or
ILI activity. One county (2.0%) reported high influenza or ILI activity.
In government offices, 39 counties (75.0%) reported no or minimal
influenza or ILI activity. One county (1.9%) reported high influenza or ILI
activity.
In jails and prisons, 47 counties (78.3%) reported no or minimal
influenza or ILI activity. Three counties (5.0%) reported moderate
influenza or ILI activity.
In health care settings, 32 counties (50.0%) reported no or minimal
influenza or ILI activity. Fifteen counties (23.4%) reported moderate
influenza or ILI activity. Five counties (7.8%) reported high influenza or
ILI activity.
ILI Activity by Population and Setting Type
0 10 20 30 40 50 60
Health Care Settings
Jails and Prisons
Government
Businesses
Colleges
Retirement Homes
Nursing Homes
Daycares
Elementary Schools
Florida Counties (67 total)
Se
ttin
g T
ype
Very high
High
Moderate
None or minimal
Not applicable
No answer
Figure 24
ILI Activity by Setting Type ILI = influenza-like illness
Page 13 Respiratory Syncytial Virus Surveillance
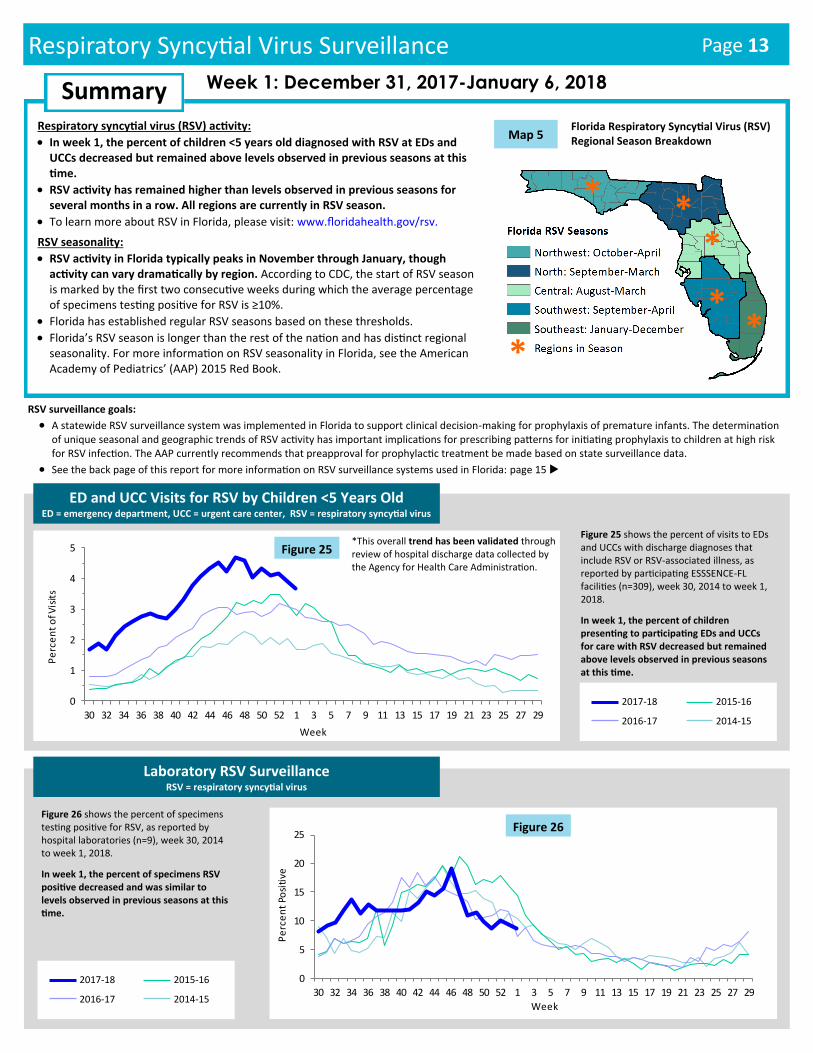
Respiratory syncytial virus (RSV) activity:
• In week 1, the percent of children <5 years old diagnosed with RSV at EDs and UCCs decreased but remained above levels observed in previous seasons at this time.
• RSV activity has remained higher than levels observed in previous seasons for several months in a row. All regions are currently in RSV season.
• To learn more about RSV in Florida, please visit: www.floridahealth.gov/rsv.
RSV seasonality:
• RSV activity in Florida typically peaks in November through January, though activity can vary dramatically by region. According to CDC, the start of RSV season is marked by the first two consecutive weeks during which the average percentage of specimens testing positive for RSV is ≥10%.
• Florida has established regular RSV seasons based on these thresholds.
• Florida’s RSV season is longer than the rest of the nation and has distinct regional seasonality. For more information on RSV seasonality in Florida, see the American Academy of Pediatrics’ (AAP) 2015 Red Book.
0
1
2
3
4
5
30 32 34 36 38 40 42 44 46 48 50 52 1 3 5 7 9 11 13 15 17 19 21 23 25 27 29
Pe
rce
nt
of V
isit
s
Week
ED and UCC Visits for RSV by Children <5 Years Old ED = emergency department, UCC = urgent care center, RSV = respiratory syncytial virus
Figure 25 shows the percent of visits to EDs and UCCs with discharge diagnoses that include RSV or RSV-associated illness, as reported by participating ESSSENCE-FL facilities (n=309), week 30, 2014 to week 1, 2018.
In week 1, the percent of children presenting to participating EDs and UCCs for care with RSV decreased but remained above levels observed in previous seasons at this time.
2017-18
2016-17
2015-16
2014-15
Figure 25
Florida Respiratory Syncytial Virus (RSV) Regional Season Breakdown Map 5
RSV surveillance goals:
• A statewide RSV surveillance system was implemented in Florida to support clinical decision-making for prophylaxis of premature infants. The determination of unique seasonal and geographic trends of RSV activity has important implications for prescribing patterns for initiating prophylaxis to children at high risk for RSV infection. The AAP currently recommends that preapproval for prophylactic treatment be made based on state surveillance data.
• See the back page of this report for more information on RSV surveillance systems used in Florida: page 15
Laboratory RSV Surveillance RSV = respiratory syncytial virus
2017-18
2016-17
2015-16
2014-15
0
5
10
15
20
25
30 32 34 36 38 40 42 44 46 48 50 52 1 3 5 7 9 11 13 15 17 19 21 23 25 27 29
Pe
rce
nt
Posi
tive
Week
Figure 26 Figure 26 shows the percent of specimens testing positive for RSV, as reported by hospital laboratories (n=9), week 30, 2014 to week 1, 2018.
In week 1, the percent of specimens RSV positive decreased and was similar to levels observed in previous seasons at this time.
*This overall trend has been validated through review of hospital discharge data collected by the Agency for Health Care Administration.
*
* *
* *
*
Summary Week 1: December 31, 2017-January 6, 2018

Page 14 Other Respiratory Virus Surveillance
RSV
Parainfluenza 1-3
Adenovirus
MPV
Rhinovirus
Influenza
Figure 27 shows the percent of laboratory results testing positive for eight common respiratory viruses, as reported by hospital laboratories (n=9), week 40, 2014 to week 1, 2018.
In recent weeks, the percent of specimens testing positive for influenza was higher than other respiratory viruses under surveillance.
0
5
10
15
20
25
30
35
40
45
50
40 45 50 2 7 12 17 22 27 32 37 42 47 52 5 10 15 20 25 30 35 40 45 50 3 8 13 18 23 28 33 38 43 48 1
Pe
rce
nt
Po
siti
ve
Week
Figure 27
Non-Influenza ARIES Laboratory Outpatient Surveillance* ARIES = Acute Respiratory Infection Epidemiology and Surveillance Program
BPHL = Bureau of Public Health Laboratories
2014-15 2015-16 2016-17 2017-18
0
5
10
15
20
25
40 44 48 1 5 9 13 17 21 25 29 33 37 41 45 49
Nu
mb
er
Po
siti
ve
Week
Figure 28
Figure 28 shows the number of specimens testing positive for 12 common respiratory viruses, as reported by BPHL and ARIES outpatient providers statewide (n=7), week 40, 2016 to week 52, 2017.
In week 52 (ending December 30, 2017), one specimen submitted by an ARIES provider tested PCR-positive for RSV. No other viruses were detected.
*Data presented here are counts, not proportions. The most recent data available are displayed here. ARIES laboratory data are currently considered to be complete through week 52, 2017. Laboratory results for specimens that have not yet been tested in full will be included in future reports.
Laboratory Viral Respiratory Surveillance
Other Respiratory Virus Surveillance
Statewide activity:
• The percent of specimens testing positive for influenza decreased but remained higher than other respiratory viruses under surveillance.
Enterovirus D68 (EV-D68) activity:
• In week 1, no new people tested positive for EV-D68 in Florida.
• No people have tested positive for EV-D68 by PCR so far in 2018. In 2017, three people tested positive for EV-D68 by PCR in Florida. One person was identified in August 2017 during the investigation of an ILI outbreak. Two people were identified in October 2017 as part of routine outpatient surveillance as a result of Florida participating in the Acute Respiratory Infection Epidemiology and Surveillance (ARIES) Program.
• To learn more about EV-D68, please visit: http://www.floridahealth.gov/diseases-and-conditions/d68.
Outbreaks:
• In week 1, no outbreaks of respiratory syncytial virus (RSV) parainfluenza 1-3, adenovirus, human metapneumovirus (MPV), rhinovirus, enterovirus, or coronavirus were reported.
RSV Coronavirus 229E
Parainfluenza 1 Coronavirus NL63
Parainfluenza 2 Coronavirus OC43
Parainfluenza 3 Coronavirus HKU1
Adenovirus Enterovirus
MPV EV-D68
Rhinovirus

Page 15 Florida ILI Surveillance System Summary Florida ILINet Data source for figures 2 and 19 • ILINet is a nationwide surveillance system composed of sentinel providers, predominately outpatient health care providers.
Florida has 88 sentinel providers enrolled in ILINet who submit weekly influenza-like illness (ILI) and total visit counts, as well as submit ILI specimens to the Bureau of Public Health Laboratories (BPHL) for confirmatory testing.
ESSENCE-FL Syndromic Surveillance and Vital Statistics Portal Data source for figures 1, 3-7, 11-18, 20-23, 25; map 4 • Electronic Surveillance System for the Early Notification of Community-based Epidemics (ESSENCE-FL) measures trends in ILI
visits from emergency departments (ED) and urgent care clinics (UCC) and influenza mortality by using death certificates from the Bureau of Vital Statistics. Participating EDs and UCCs (n=309) electronically transmit visit data into ESSENCE-FL daily or hourly.
• For statewide and regional data on ILI, visits are counted as ED or UCC visits to participating facilities that include the words “influenza” or “flu” in patient chief complaints. Chief complaints with the words “fever” and “cough,” or “fever” and “sore throat” are also counted as ILI.
• For pneumonia and influenza (P&I) surveillance, death record literals are queried using a free-text query that searches for references to P&I on death certificates. Any mention of P&I in the death certificate literals, with certain exceptions, is counted as a P&I death.
• For respiratory syncytial virus (RSV) surveillance, visits are counted as ED or UCC visits to participating facilities for which RSV or RSV-associated illness is included in the discharge diagnosis. Death record literals are also queried using a free-text query that searches for references to RSV on death certificates for children <18 years old. Any mention of RSV in the death certificate literals, with certain exceptions, is counted as an RSV-associated pediatric death.
County Influenza Activity in EpiGateway Data source for figures 19, 24, and maps 1 and 2 • County health department (CHD) epidemiologists report their county’s influenza and ILI surveillance data weekly into the
EpiGateway website. Influenza activity is classified as: no activity, mild, moderate, or elevated. Setting-specific influenza activity and influenza trend information is also reported. EpiGateway data provided by CHDs creates a county-by-county breakdown of influenza and ILI activity around the state.
Outbreak Reporting in Merlin Data source for figure 8, map 3, and table 1 • Merlin tracks influenza and ILI outbreak investigations by CHDs. Reports by CHDs include the type of respiratory disease
causing the outbreak and settings where outbreaks are occurring. CHD epidemiologists report outbreaks of influenza or ILI into Merlin, Florida’s reportable disease surveillance system.
• Outbreaks are defined as two or more cases of influenza or ILI in a specific setting.
Bureau of Public Health Laboratories (BPHL) Data source for figures 9, 10 and table 2 • BPHL performs confirmatory testing and subtyping on surveillance specimens from sentinel providers, outbreak
investigations, patients with severe or unusual influenza presentations, and medical examiners. • For county-specific laboratory data, please refer to the Flu Lab Report in Merlin. For instructions on how to use the Flu Lab
Report, please see the Guide to Flu Lab Report on the Bureau of Epidemiology website at www.floridahealth.gov/diseases-and-conditions/influenza/_documents/flulabreportguide.pdf.
Laboratory Viral Respiratory Surveillance Data sources for figures 26-27 • The National Respiratory and Enteric Virus Surveillance System (NREVSS) and Electronic Laboratory Reporting (ELR) collect
data from laboratories in Florida on a weekly basis and monitor temporal and geographic patterns of eight commonly circulating respiratory viruses. NREVSS data is collected by the Centers for Disease Control and Prevention (CDC) and ELR data is collected by the Florida Department of Health (DOH).
Acute Respiratory Infection Epidemiology and Surveillance (ARIES) Program Data source for figure 28 • Acute Respiratory Infection Epidemiology and Surveillance Program (ARIES) is a nationwide surveillance system composed of
nine participating jurisdictions. Florida has seven sentinel providers enrolled in ARIES who submit weekly ILI counts, as well as submit ILI specimens to BPHL for testing.
Case-Based Influenza Surveillance • Death in a child whose laboratory-confirmed influenza infection has been identified as a contributing to the child’s death is
reportable in Florida. Influenza-associated pediatric deaths are documented by CHDs in Merlin. • In addition, an individual of any age infected with novel or pandemic influenza strain(s) is reportable in Florida. Pandemic
strain influenza cases are documented by CHDs in Merlin. • For more information about reportable diseases, please visit www.Floridahealth.gov/diseasereporting.