Embed Size (px)
Citation preview
ISIJ International, Vol. 57 (2017), No. 10
© 2017 ISIJ 1742
ISIJ International, Vol. 57 (2017), No. 10, pp. 1742–1750
* Corresponding author: E-mail: miyata.8 [email protected]: http://dx.doi.org/10.2355/isijinternational.ISIJINT-2017-107
1. Introduction
In the hot metal dephosphorization process, the use of fluorspar as flux is restricted, and the dissolution delay of lumpy lime as a dephosphorizer is becoming evident.1) The dissolution delay of lime results in a delay or destabiliza-tion of the dephosphorization reactions and impairs the efficiency of the steelmaking process.
Concerning this dissolution delay, we studied the method of adding ladle slag with reference to the research by Banya et al.2) into the dephosphorization of hot metal with a CaO-Al2O3-FexOy flux.3) Since the ladle slag contained a large amount of alumina in order to lower the melting point of the slag, its addition proved effective in improving the dephosphorization efficiency to a certain degree but failed to completely eliminate the dissolution delay of the lime. Thus, new methods were desired.
We then studied the method of replacing lumpy lime with powdered lime having a larger specific surface area in order to promote early dissolution. When powdered lime is simply top charged into a reaction vessel, it is sucked into the exhaust system by the upward gas flow. Given this problem, we focused on the method of blowing powdered lime together with an oxygen jet onto the hot metal sur-face from a top blowing lance. Most of the lime powder blown together with the oxygen jet landed near the high-temperature fire point where it formed a CaO–FeO melt
Fluid Dynamics Analysis of Gas Jet with Particles
Masaki MIYATA1)* and Yoshihiko HIGUCHI2)
1) Steelmaking R & D Div. Process Research Laboratories, Nippon Steel & Sumitomo Metal Corporation, 16-1 Sunayama, Kamisu, Ibaraki, 314-0255 Japan. 2) Department of Mechanical Engineering, College of Industrial Technology, 1-27-1 Nishi-koya, Amagasaki, Hyogo, 661-0047 Japan.
(Received on March 2, 2017; accepted on July 18, 2017)
We conducted a three-dimensional fluid dynamics analysis of the solid-gas mixed-phase flow from a top blowing lance by considering the application of powder top blowing to hot metal dephosphorization in the steelmaking process. When a mixed-phase flow of gas and powder passed through a single-nozzle lance, the powder particles passed unevenly near the central axis of the nozzle and the gas flowed around the powder particles in a circular pattern. Thus, the maximum gas velocity shifted in the radial direction from the central axis of the nozzle. After the outlet of the single-nozzle lance, the gas velocity on the central axis increased and the maximum gas velocity shifted to the central axis. The velocity of the powder imme-diately after being discharged from the nozzle outlet was lower than the gas velocity but then gradually increased, while the gas velocity decreased. The position where the velocity of the powder, which has a greater inertial force, started to decrease was farther from the nozzle outlet than that for the gas velocity. When a multiple-nozzle lance with an angle of inclination is used, the powder particles may impinge on the nozzle inner wall. Thus, it is necessary to consider the wear of the nozzle inner wall and the dispersion region of the powder particles.
KEY WORDS: hot metal dephosphorization; powder fluid; top blowing lance; fluid dynamics analysis.
and reacted with the phosphorus in the hot metal to form a CaO–FeO–P2O5 complex oxide. This is the effect we can expect from the mechanisms4,5) found in bottom-blown converters. The complex oxide that is formed is believed to move outside of the fire point after a certain length of time and form a highly alkaline slag with the permanent slag, as well as restrict the rephosphorization reactions and help produce low-phosphorus molten iron.
Methods of top blowing powdered lime together with a gas jet into the reaction vessel at atmospheric pressure have been studied in the past, and the LD-AC process,6,7) STB-P process,8,9) and LD-KG process10) with powder top blowing have been reported. These reports, however, mainly aimed at evaluating the effects of lime powder blowing in terms of the metallurgical reactions. Only a few studies investigated the fluid dynamics behaviors involved, such as how the powder moves with the gas jet in the furnace atmosphere. One such example is the study by Kimura11) that evaluated the penetration depth of the powder into the furnace bath by model experiments.
Concerning the condition of the mixed-phase flow until it reaches the hot metal surface after leaving the top blow-ing lance nozzle in the powder top blowing process, it is necessary to consider the interaction between the powder particle motion and gas flow. In the mechanical engineer-ing field, solid-gas two-phase flows are kinetically studied by considering this interaction. Many of the studies targeted powder transport, and only a few focused on the powder-gas mixed-phase jet behavior.12–18) Furthermore, the interaction behavior of multiple powder-gas mixtures discharged from
ISIJ International, Vol. 57 (2017), No. 10
© 2017 ISIJ1743
a multiple-nozzle lance has rarely been studied.As discussed above, the powder top blowing process is
industrially important. It is considered possible to optimize the refining performance by grasping the powder behavior. Given the peculiarity of the operating conditions and the difficulty in measuring them, few findings are available on the fundamental fluid dynamics behavior. This report is designed to clarify through fluid dynamics analysis the behavior of the powder supplied together with the oxygen jet into the reaction vessel and to provide guidelines for improving the powder top blowing process conditions.
2. Analytical Methods
2.1. Fluid and Powder Motion Equations and Energy Conservation Equations
The mass conservation equation, momentum conservation equation and energy conservation equation for compressible fluids are given below as Eqs. (1) to (3), respectively. The fourth term on the right side of Eq. (2) is an external force term that indicates the drag exerted by the powder. The third term on the right side of Eq. (3) is the Reynolds stress term that indicates the effect of turbulence. A realizable k-ε model was used as the turbulence model, and the gas used was handled as ideal gas. The balance of forces acting on the powder is given by Eq. (6). The last term on the right side of Eq. (6) corresponds to the external force in Eq. (2). These equations are simultaneously calculated to reflect the effect of the interaction between the gas and powder. Colli-sions between solid particles is not considered in this report. Solid-gas mixed-phase jets are generally classified accord-ing to the three conditions: dilute particle concentration, low particle concentration and high particle concentration. These concentrations correspond to less than 0.2, 0.2 to 5.0, and over 5.0, respectively, when organized by the solid-gas ratio. In the dilute particle concentration region, the flow characteristics of the gas almost agree with the behavior of gas single-phase flows, and the solid particles have little or no effect on the gas flow. In the low particle concentration region, the solid particles affect the gas flow, but the effect of colliding solid particles on the gas flow can be ignored. In the high particle concentration region, the effect of col-lisions between the solid particles cannot be ignored. The solid-gas ratio studied in this report ranged from 0.28 to 4.7 as described later and corresponded to the low particle concentration region. We thus assume that it is possible to safely ignore the effect of collisions between the solid par-ticles, and we only considered the interaction between the solid particles and the gas. The calculations were performed using the motion equations for the fluid and powder. The trajectories of the powder particles were calculated using the commercial CFD software ANSYS Fluent Version 14.0.0.
∂∂+∂ ⋅∂
=ρ ρt
U
Xi
i
( )0 ............................ (1)
∂ ⋅
∂+∂ ⋅ ⋅
∂=∂∂
+∂∂
+ ⋅ +( ) ( )ρ ρ τ
ρU
t
U U
X
P
X Xg Fi i i
i i
ij
ji i ..... (2)
τ µµ
δ ρiji
j
j
i
k
kij i j
U
X
U
X
U
XU U=
∂∂
+∂∂
−
∂∂
− ⋅ ′⋅ ′2
3 ..... (3)
∂ ⋅∂
+∂ ⋅ +[ ]
∂
= −∂ ′+
⋅
∂∂
+
( ) ( )
( )
ρ ρ
µ τ
E
t
U E P
X
kC T
XU
i
i
P t
t ij ij e
Prfff
iX
∂
............. (4)
( )τ µ
µδij eff eff
i
j
j
i
eff i
iij
U
X
U
X
U
X=
∂∂
+∂∂
−
∂∂
2
3 ........ (5)
du
dt d
Cu u g
FiP
P P
Di i
Pi
P
P
ietc
P
=⋅
⋅− +
−+
18
242
µρ
ρ ρρ ρ
Re( )
( ) ... (6)
2.2. Boundary Conditions and Analytical ConditionsA predetermined gas mass flow rate was given to the
lance entry boundary as the gas-side boundary condition. The wall function was applied to the lance wall, and the calculation domain including the jets was set to free outflow conditions. The pressure at the calculation domain bound-ary was assumed to be constant atmospheric pressure. As the powder-side boundary condition, a predetermined mass flow rate was given by assuming the lance inlet to be the powder inflow position, and the lance wall was assumed to completely repulse the particles. The number of particles was set to 924 for single-nozzle lances and 2 265 for three-nozzle lances. The analytical conditions were set as shown in Table 1 to match the experimental conditions of a 2.5-ton test converter and cold test. In Case 1, CaO powder was fed together with oxygen gas from a single-nozzle straight lance. In Case 2, Al2O3 powder was fed together with air from a three-nozzle straight lance with a 20 deg angle of inclination. The powder feed rate was set at the three levels of 1.0, 2.5 and 5.0 kg/min, assuming powder top blowing in hot metal dephosphorization. The solid-gas ratio was 0.28, 0.7 and 1.4 in Case 1 and 0.93, 2.34 and 4.7 in Case 2. The powder particle diameter was set at the three levels of 10, 50 and 100 μm.
2.3. Mesh ConfigurationsPowder top blowing from the single-nozzle and three-
Table 1. Conditions for calculation.
Case1 Case2
Nozzle I.D. 10.8 mm×1 straight
I.D. 5.5 mm× 3 straight (20 deg)
Gas species Oxygen Air
Gas flow rate ~2.5 Nm3/min 0.9 Nm3/min
Powder species Lime: CaO Alumina: Al2O3
Density of powder 2.5×10³ kg/m3 3.9×10³ kg/m3
Powder feeding rate 0, 1.0, 2.5, 5.0 kg/min 0, 1.0, 2.5, 5.0 kg/min
Diameter of powder 10, 50, 100 μm 10, 50, 100 μm
ISIJ International, Vol. 57 (2017), No. 10
© 2017 ISIJ 1744
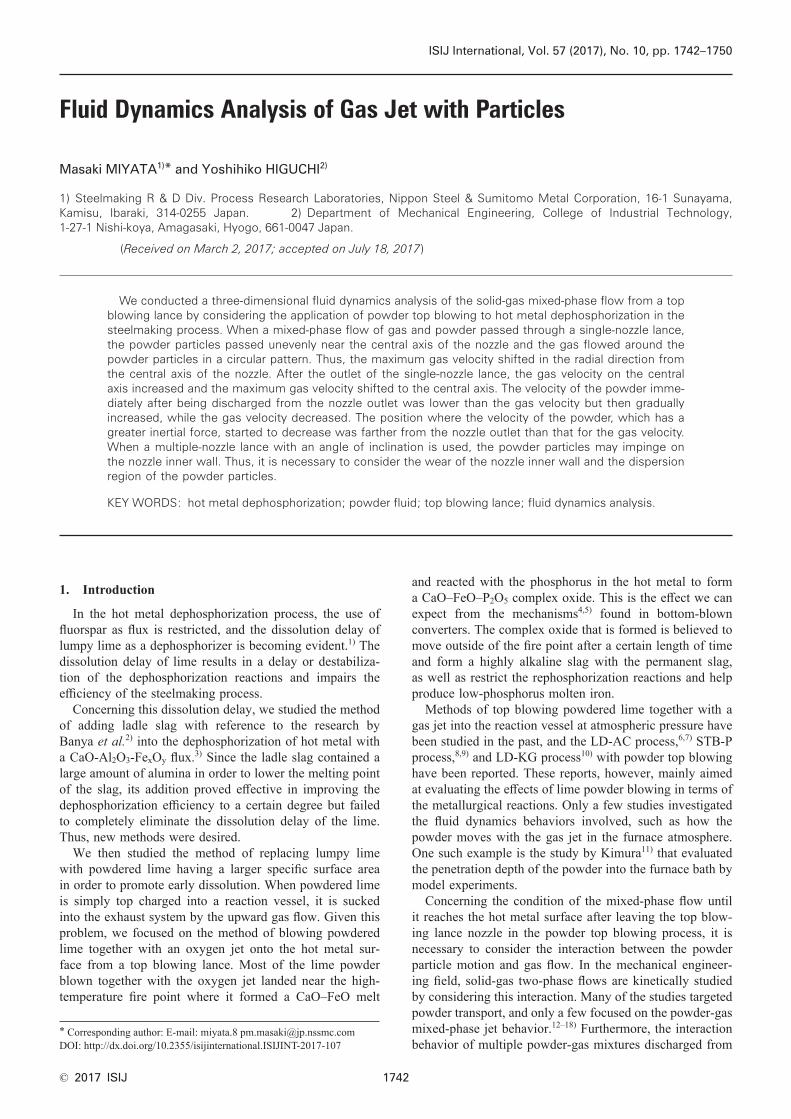
nozzle lances was the computational target of this report and was analyzed using three-dimensional models. A one-fourth domain and a one-third domain alone were calculated in Cases 1 and 2, respectively, with consideration for sym-metry. Typical mesh configuration examples of the three-dimensional models are shown in Figs. 1 and 2.
3. Analytical Results and Discussion
3.1. Single-nozzle LanceIn Fig. 3, the calculated nozzle inlet pressures under the
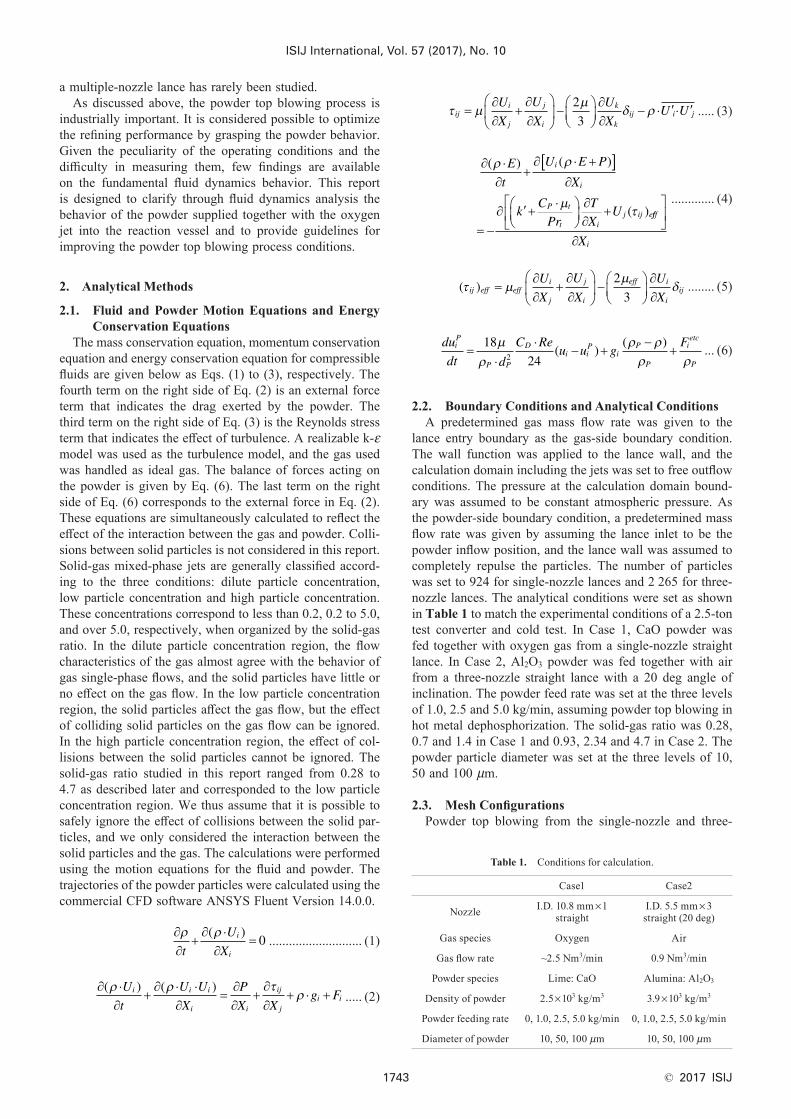
conditions of Case 1 using a single-nozzle lance are com-pared with the observed nozzle inlet pressures obtained by using a 2.5-ton test converter. Since the calculated nozzle inlet pressures did not greatly vary when the powder particle diameter was changed in the range of 10 to 100 μm, the powder particle diameter of 10 μm was used as the repre-sentative value. The plotted values with powder blowing in Fig. 3 apply to the powder feed rates of 1.0 and 5.0 kg/min, respectively. As can be seen, it was almost possible to reproduce the tendency for the nozzle inlet pressure to increase with powder blowing.
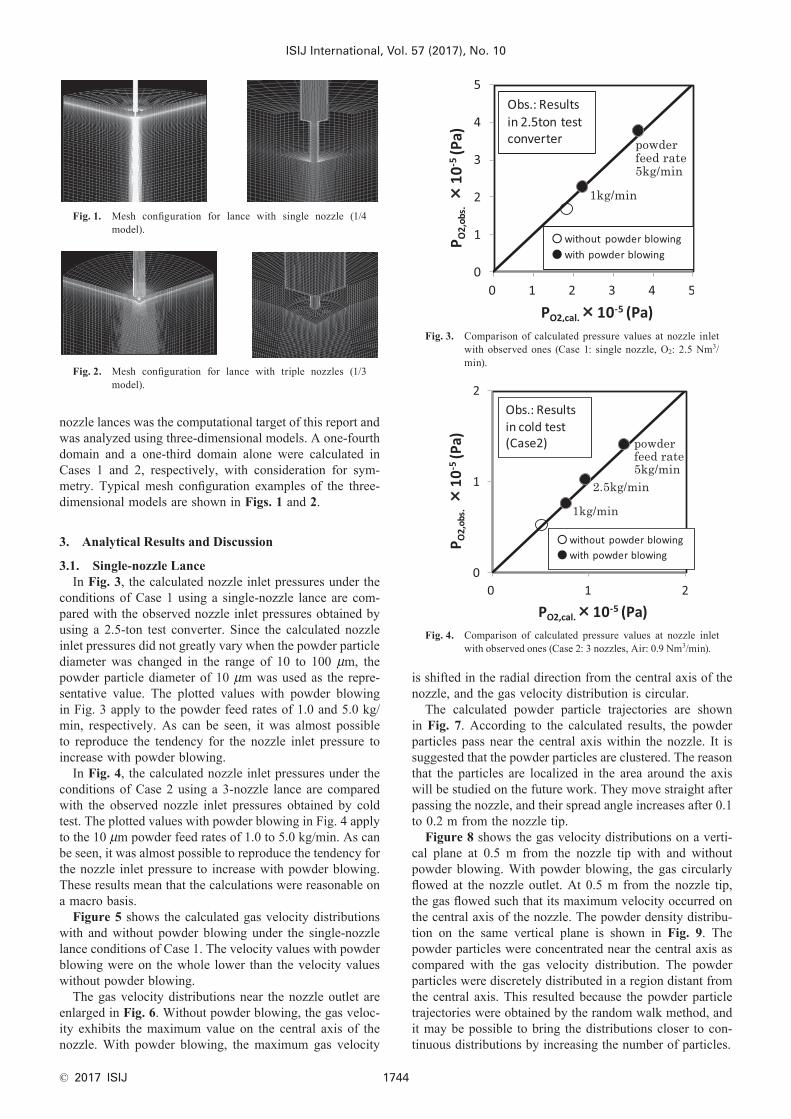
In Fig. 4, the calculated nozzle inlet pressures under the conditions of Case 2 using a 3-nozzle lance are compared with the observed nozzle inlet pressures obtained by cold test. The plotted values with powder blowing in Fig. 4 apply to the 10 μm powder feed rates of 1.0 to 5.0 kg/min. As can be seen, it was almost possible to reproduce the tendency for the nozzle inlet pressure to increase with powder blowing. These results mean that the calculations were reasonable on a macro basis.
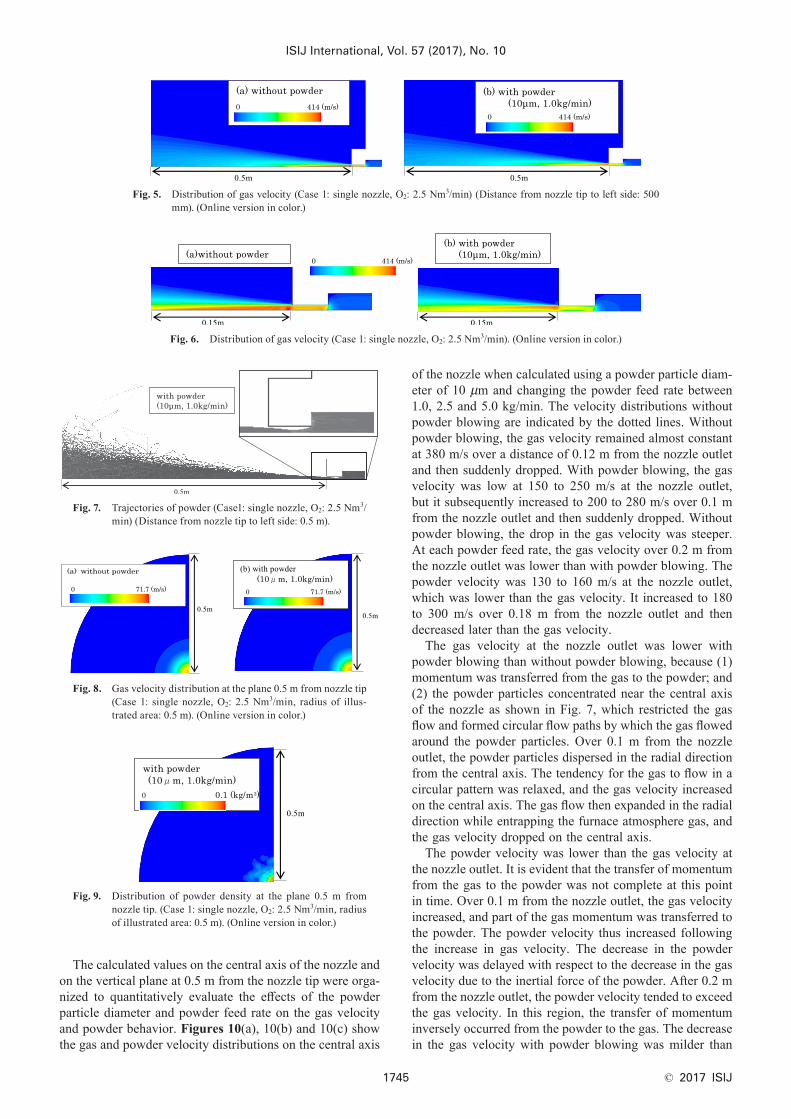
Figure 5 shows the calculated gas velocity distributions with and without powder blowing under the single-nozzle lance conditions of Case 1. The velocity values with powder blowing were on the whole lower than the velocity values without powder blowing.
The gas velocity distributions near the nozzle outlet are enlarged in Fig. 6. Without powder blowing, the gas veloc-ity exhibits the maximum value on the central axis of the nozzle. With powder blowing, the maximum gas velocity
is shifted in the radial direction from the central axis of the nozzle, and the gas velocity distribution is circular.
The calculated powder particle trajectories are shown in Fig. 7. According to the calculated results, the powder particles pass near the central axis within the nozzle. It is suggested that the powder particles are clustered. The reason that the particles are localized in the area around the axis will be studied on the future work. They move straight after passing the nozzle, and their spread angle increases after 0.1 to 0.2 m from the nozzle tip.
Figure 8 shows the gas velocity distributions on a verti-cal plane at 0.5 m from the nozzle tip with and without powder blowing. With powder blowing, the gas circularly flowed at the nozzle outlet. At 0.5 m from the nozzle tip, the gas flowed such that its maximum velocity occurred on the central axis of the nozzle. The powder density distribu-tion on the same vertical plane is shown in Fig. 9. The powder particles were concentrated near the central axis as compared with the gas velocity distribution. The powder particles were discretely distributed in a region distant from the central axis. This resulted because the powder particle trajectories were obtained by the random walk method, and it may be possible to bring the distributions closer to con-tinuous distributions by increasing the number of particles.
Fig. 1. Mesh configuration for lance with single nozzle (1/4 model).
Fig. 2. Mesh configuration for lance with triple nozzles (1/3 model).
Fig. 3. Comparison of calculated pressure values at nozzle inlet with observed ones (Case 1: single nozzle, O2: 2.5 Nm3/min).
Fig. 4. Comparison of calculated pressure values at nozzle inlet with observed ones (Case 2: 3 nozzles, Air: 0.9 Nm3/min).
ISIJ International, Vol. 57 (2017), No. 10
© 2017 ISIJ1745
Fig. 5. Distribution of gas velocity (Case 1: single nozzle, O2: 2.5 Nm3/min) (Distance from nozzle tip to left side: 500 mm). (Online version in color.)
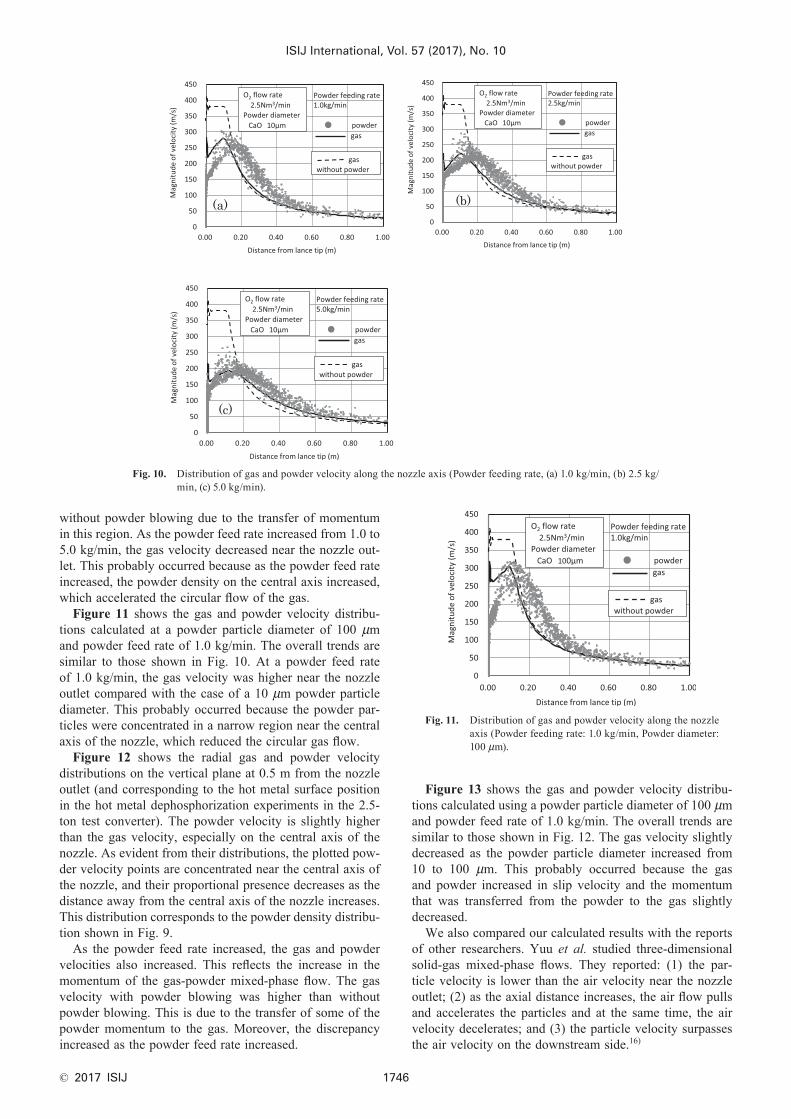
The calculated values on the central axis of the nozzle and on the vertical plane at 0.5 m from the nozzle tip were orga-nized to quantitatively evaluate the effects of the powder particle diameter and powder feed rate on the gas velocity and powder behavior. Figures 10(a), 10(b) and 10(c) show the gas and powder velocity distributions on the central axis
of the nozzle when calculated using a powder particle diam-eter of 10 μm and changing the powder feed rate between 1.0, 2.5 and 5.0 kg/min. The velocity distributions without powder blowing are indicated by the dotted lines. Without powder blowing, the gas velocity remained almost constant at 380 m/s over a distance of 0.12 m from the nozzle outlet and then suddenly dropped. With powder blowing, the gas velocity was low at 150 to 250 m/s at the nozzle outlet, but it subsequently increased to 200 to 280 m/s over 0.1 m from the nozzle outlet and then suddenly dropped. Without powder blowing, the drop in the gas velocity was steeper. At each powder feed rate, the gas velocity over 0.2 m from the nozzle outlet was lower than with powder blowing. The powder velocity was 130 to 160 m/s at the nozzle outlet, which was lower than the gas velocity. It increased to 180 to 300 m/s over 0.18 m from the nozzle outlet and then decreased later than the gas velocity.
The gas velocity at the nozzle outlet was lower with powder blowing than without powder blowing, because (1) momentum was transferred from the gas to the powder; and (2) the powder particles concentrated near the central axis of the nozzle as shown in Fig. 7, which restricted the gas flow and formed circular flow paths by which the gas flowed around the powder particles. Over 0.1 m from the nozzle outlet, the powder particles dispersed in the radial direction from the central axis. The tendency for the gas to flow in a circular pattern was relaxed, and the gas velocity increased on the central axis. The gas flow then expanded in the radial direction while entrapping the furnace atmosphere gas, and the gas velocity dropped on the central axis.
The powder velocity was lower than the gas velocity at the nozzle outlet. It is evident that the transfer of momentum from the gas to the powder was not complete at this point in time. Over 0.1 m from the nozzle outlet, the gas velocity increased, and part of the gas momentum was transferred to the powder. The powder velocity thus increased following the increase in gas velocity. The decrease in the powder velocity was delayed with respect to the decrease in the gas velocity due to the inertial force of the powder. After 0.2 m from the nozzle outlet, the powder velocity tended to exceed the gas velocity. In this region, the transfer of momentum inversely occurred from the powder to the gas. The decrease in the gas velocity with powder blowing was milder than
Fig. 7. Trajectories of powder (Case1: single nozzle, O2: 2.5 Nm3/min) (Distance from nozzle tip to left side: 0.5 m).
Fig. 8. Gas velocity distribution at the plane 0.5 m from nozzle tip (Case 1: single nozzle, O2: 2.5 Nm3/min, radius of illus-trated area: 0.5 m). (Online version in color.)
Fig. 9. Distribution of powder density at the plane 0.5 m from nozzle tip. (Case 1: single nozzle, O2: 2.5 Nm3/min, radius of illustrated area: 0.5 m). (Online version in color.)
Fig. 6. Distribution of gas velocity (Case 1: single nozzle, O2: 2.5 Nm3/min). (Online version in color.)
ISIJ International, Vol. 57 (2017), No. 10
© 2017 ISIJ 1746
without powder blowing due to the transfer of momentum in this region. As the powder feed rate increased from 1.0 to 5.0 kg/min, the gas velocity decreased near the nozzle out-let. This probably occurred because as the powder feed rate increased, the powder density on the central axis increased, which accelerated the circular flow of the gas.
Figure 11 shows the gas and powder velocity distribu-tions calculated at a powder particle diameter of 100 μm and powder feed rate of 1.0 kg/min. The overall trends are similar to those shown in Fig. 10. At a powder feed rate of 1.0 kg/min, the gas velocity was higher near the nozzle outlet compared with the case of a 10 μm powder particle diameter. This probably occurred because the powder par-ticles were concentrated in a narrow region near the central axis of the nozzle, which reduced the circular gas flow.
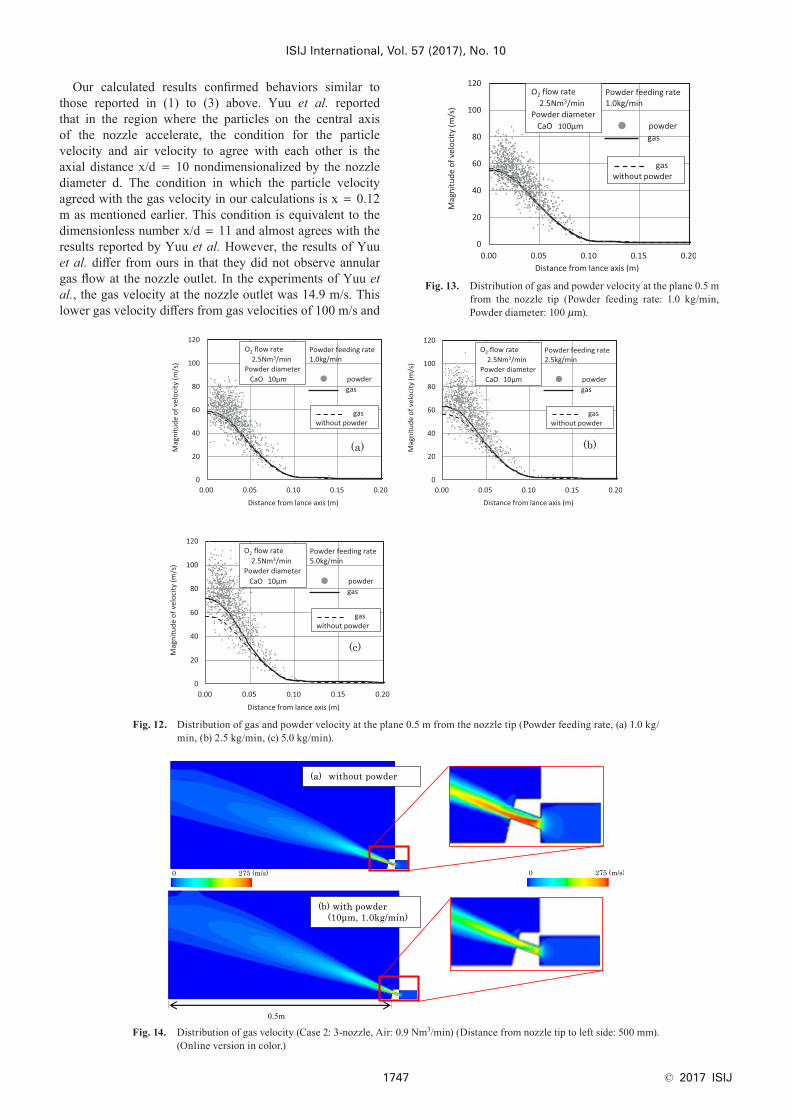
Figure 12 shows the radial gas and powder velocity distributions on the vertical plane at 0.5 m from the nozzle outlet (and corresponding to the hot metal surface position in the hot metal dephosphorization experiments in the 2.5-ton test converter). The powder velocity is slightly higher than the gas velocity, especially on the central axis of the nozzle. As evident from their distributions, the plotted pow-der velocity points are concentrated near the central axis of the nozzle, and their proportional presence decreases as the distance away from the central axis of the nozzle increases. This distribution corresponds to the powder density distribu-tion shown in Fig. 9.
As the powder feed rate increased, the gas and powder velocities also increased. This reflects the increase in the momentum of the gas-powder mixed-phase flow. The gas velocity with powder blowing was higher than without powder blowing. This is due to the transfer of some of the powder momentum to the gas. Moreover, the discrepancy increased as the powder feed rate increased.
Figure 13 shows the gas and powder velocity distribu-tions calculated using a powder particle diameter of 100 μm and powder feed rate of 1.0 kg/min. The overall trends are similar to those shown in Fig. 12. The gas velocity slightly decreased as the powder particle diameter increased from 10 to 100 μm. This probably occurred because the gas and powder increased in slip velocity and the momentum that was transferred from the powder to the gas slightly decreased.
We also compared our calculated results with the reports of other researchers. Yuu et al. studied three-dimensional solid-gas mixed-phase flows. They reported: (1) the par-ticle velocity is lower than the air velocity near the nozzle outlet; (2) as the axial distance increases, the air flow pulls and accelerates the particles and at the same time, the air velocity decelerates; and (3) the particle velocity surpasses the air velocity on the downstream side.16)
Fig. 10. Distribution of gas and powder velocity along the nozzle axis (Powder feeding rate, (a) 1.0 kg/min, (b) 2.5 kg/min, (c) 5.0 kg/min).
Fig. 11. Distribution of gas and powder velocity along the nozzle axis (Powder feeding rate: 1.0 kg/min, Powder diameter: 100 μm).
ISIJ International, Vol. 57 (2017), No. 10
© 2017 ISIJ1747
Fig. 12. Distribution of gas and powder velocity at the plane 0.5 m from the nozzle tip (Powder feeding rate, (a) 1.0 kg/min, (b) 2.5 kg/min, (c) 5.0 kg/min).
Fig. 13. Distribution of gas and powder velocity at the plane 0.5 m from the nozzle tip (Powder feeding rate: 1.0 kg/min, Powder diameter: 100 μm).
Our calculated results confirmed behaviors similar to those reported in (1) to (3) above. Yuu et al. reported that in the region where the particles on the central axis of the nozzle accelerate, the condition for the particle velocity and air velocity to agree with each other is the axial distance x/d = 10 nondimensionalized by the nozzle diameter d. The condition in which the particle velocity agreed with the gas velocity in our calculations is x = 0.12 m as mentioned earlier. This condition is equivalent to the dimensionless number x/d = 11 and almost agrees with the results reported by Yuu et al. However, the results of Yuu et al. differ from ours in that they did not observe annular gas flow at the nozzle outlet. In the experiments of Yuu et al., the gas velocity at the nozzle outlet was 14.9 m/s. This lower gas velocity differs from gas velocities of 100 m/s and
Fig. 14. Distribution of gas velocity (Case 2: 3-nozzle, Air: 0.9 Nm3/min) (Distance from nozzle tip to left side: 500 mm). (Online version in color.)
ISIJ International, Vol. 57 (2017), No. 10
© 2017 ISIJ 1748
higher in our report. This lower nozzle outlet gas velocity is considered to be the reason why the phenomenon of the gas bypassing the powder particles was not observed in the experiments of Yuu et al.
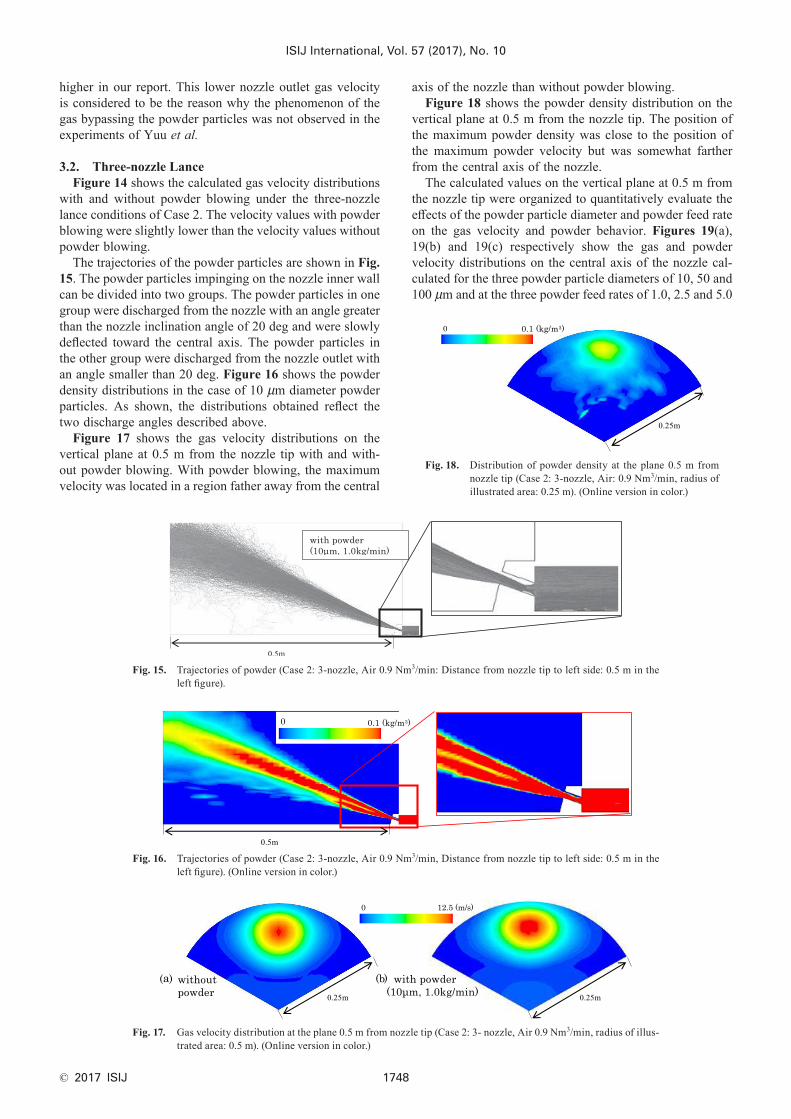
3.2. Three-nozzle LanceFigure 14 shows the calculated gas velocity distributions
with and without powder blowing under the three-nozzle lance conditions of Case 2. The velocity values with powder blowing were slightly lower than the velocity values without powder blowing.
The trajectories of the powder particles are shown in Fig. 15. The powder particles impinging on the nozzle inner wall can be divided into two groups. The powder particles in one group were discharged from the nozzle with an angle greater than the nozzle inclination angle of 20 deg and were slowly deflected toward the central axis. The powder particles in the other group were discharged from the nozzle outlet with an angle smaller than 20 deg. Figure 16 shows the powder density distributions in the case of 10 μm diameter powder particles. As shown, the distributions obtained reflect the two discharge angles described above.
Figure 17 shows the gas velocity distributions on the vertical plane at 0.5 m from the nozzle tip with and with-out powder blowing. With powder blowing, the maximum velocity was located in a region father away from the central
axis of the nozzle than without powder blowing.Figure 18 shows the powder density distribution on the
vertical plane at 0.5 m from the nozzle tip. The position of the maximum powder density was close to the position of the maximum powder velocity but was somewhat farther from the central axis of the nozzle.
The calculated values on the vertical plane at 0.5 m from the nozzle tip were organized to quantitatively evaluate the effects of the powder particle diameter and powder feed rate on the gas velocity and powder behavior. Figures 19(a), 19(b) and 19(c) respectively show the gas and powder velocity distributions on the central axis of the nozzle cal-culated for the three powder particle diameters of 10, 50 and 100 μm and at the three powder feed rates of 1.0, 2.5 and 5.0
Fig. 15. Trajectories of powder (Case 2: 3-nozzle, Air 0.9 Nm3/min: Distance from nozzle tip to left side: 0.5 m in the left figure).
Fig. 16. Trajectories of powder (Case 2: 3-nozzle, Air 0.9 Nm3/min, Distance from nozzle tip to left side: 0.5 m in the left figure). (Online version in color.)
Fig. 17. Gas velocity distribution at the plane 0.5 m from nozzle tip (Case 2: 3- nozzle, Air 0.9 Nm3/min, radius of illus-trated area: 0.5 m). (Online version in color.)
Fig. 18. Distribution of powder density at the plane 0.5 m from nozzle tip (Case 2: 3-nozzle, Air: 0.9 Nm3/min, radius of illustrated area: 0.25 m). (Online version in color.)
ISIJ International, Vol. 57 (2017), No. 10
© 2017 ISIJ1749
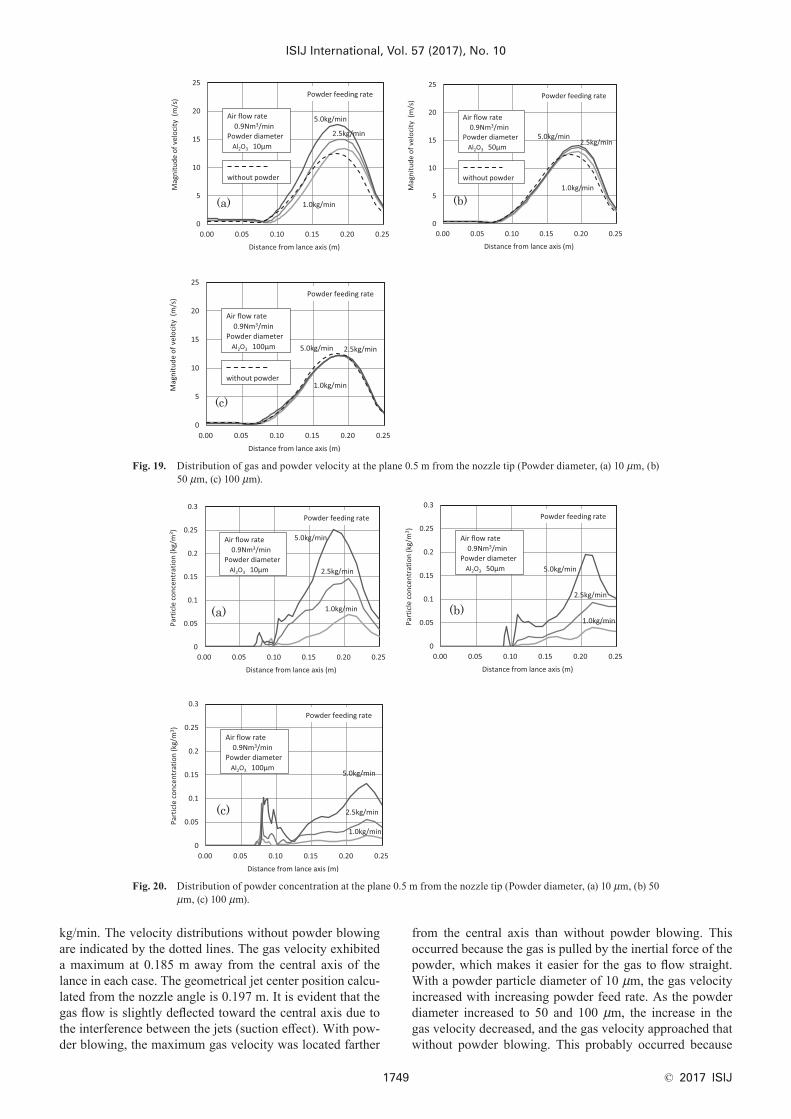
Fig. 19. Distribution of gas and powder velocity at the plane 0.5 m from the nozzle tip (Powder diameter, (a) 10 μm, (b) 50 μm, (c) 100 μm).
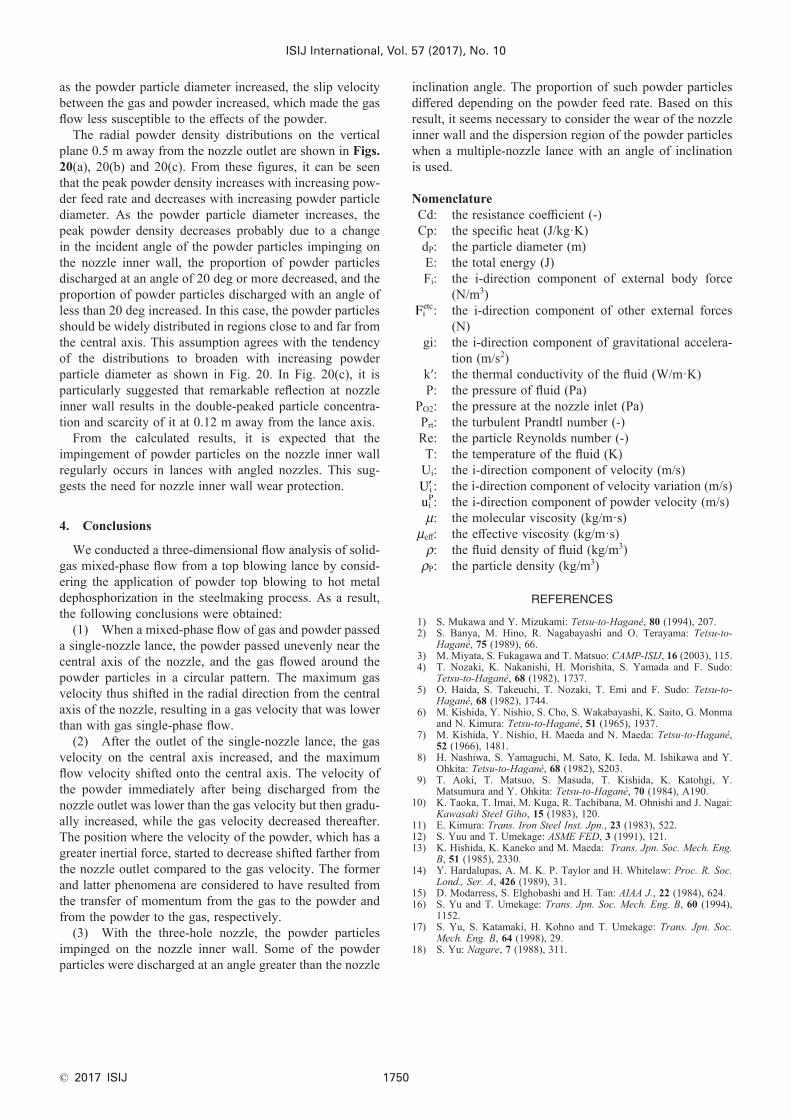
Fig. 20. Distribution of powder concentration at the plane 0.5 m from the nozzle tip (Powder diameter, (a) 10 μm, (b) 50 μm, (c) 100 μm).
kg/min. The velocity distributions without powder blowing are indicated by the dotted lines. The gas velocity exhibited a maximum at 0.185 m away from the central axis of the lance in each case. The geometrical jet center position calcu-lated from the nozzle angle is 0.197 m. It is evident that the gas flow is slightly deflected toward the central axis due to the interference between the jets (suction effect). With pow-der blowing, the maximum gas velocity was located farther
from the central axis than without powder blowing. This occurred because the gas is pulled by the inertial force of the powder, which makes it easier for the gas to flow straight. With a powder particle diameter of 10 μm, the gas velocity increased with increasing powder feed rate. As the powder diameter increased to 50 and 100 μm, the increase in the gas velocity decreased, and the gas velocity approached that without powder blowing. This probably occurred because
ISIJ International, Vol. 57 (2017), No. 10
© 2017 ISIJ 1750
as the powder particle diameter increased, the slip velocity between the gas and powder increased, which made the gas flow less susceptible to the effects of the powder.
The radial powder density distributions on the vertical plane 0.5 m away from the nozzle outlet are shown in Figs. 20(a), 20(b) and 20(c). From these figures, it can be seen that the peak powder density increases with increasing pow-der feed rate and decreases with increasing powder particle diameter. As the powder particle diameter increases, the peak powder density decreases probably due to a change in the incident angle of the powder particles impinging on the nozzle inner wall, the proportion of powder particles discharged at an angle of 20 deg or more decreased, and the proportion of powder particles discharged with an angle of less than 20 deg increased. In this case, the powder particles should be widely distributed in regions close to and far from the central axis. This assumption agrees with the tendency of the distributions to broaden with increasing powder particle diameter as shown in Fig. 20. In Fig. 20(c), it is particularly suggested that remarkable reflection at nozzle inner wall results in the double-peaked particle concentra-tion and scarcity of it at 0.12 m away from the lance axis.
From the calculated results, it is expected that the impingement of powder particles on the nozzle inner wall regularly occurs in lances with angled nozzles. This sug-gests the need for nozzle inner wall wear protection.
4. Conclusions
We conducted a three-dimensional flow analysis of solid-gas mixed-phase flow from a top blowing lance by consid-ering the application of powder top blowing to hot metal dephosphorization in the steelmaking process. As a result, the following conclusions were obtained:
(1) When a mixed-phase flow of gas and powder passed a single-nozzle lance, the powder passed unevenly near the central axis of the nozzle, and the gas flowed around the powder particles in a circular pattern. The maximum gas velocity thus shifted in the radial direction from the central axis of the nozzle, resulting in a gas velocity that was lower than with gas single-phase flow.
(2) After the outlet of the single-nozzle lance, the gas velocity on the central axis increased, and the maximum flow velocity shifted onto the central axis. The velocity of the powder immediately after being discharged from the nozzle outlet was lower than the gas velocity but then gradu-ally increased, while the gas velocity decreased thereafter. The position where the velocity of the powder, which has a greater inertial force, started to decrease shifted farther from the nozzle outlet compared to the gas velocity. The former and latter phenomena are considered to have resulted from the transfer of momentum from the gas to the powder and from the powder to the gas, respectively.
(3) With the three-hole nozzle, the powder particles impinged on the nozzle inner wall. Some of the powder particles were discharged at an angle greater than the nozzle
inclination angle. The proportion of such powder particles differed depending on the powder feed rate. Based on this result, it seems necessary to consider the wear of the nozzle inner wall and the dispersion region of the powder particles when a multiple-nozzle lance with an angle of inclination is used.
Nomenclature Cd: the resistance coefficient (-) Cp: the specific heat (J/kg·K) dP: the particle diameter (m) E: the total energy (J) Fi: the i-direction component of external body force
(N/m3) Fi
etc: the i-direction component of other external forces (N)
gi: the i-direction component of gravitational accelera-tion (m/s2)
k′: the thermal conductivity of the fluid (W/m·K) P: the pressure of fluid (Pa) PO2: the pressure at the nozzle inlet (Pa) Prt: the turbulent Prandtl number (-) Re: the particle Reynolds number (-) T: the temperature of the fluid (K) Ui: the i-direction component of velocity (m/s) ′Ui : the i-direction component of velocity variation (m/s) ui
P: the i-direction component of powder velocity (m/s) μ: the molecular viscosity (kg/m·s) μeff: the effective viscosity (kg/m·s) ρ: the fluid density of fluid (kg/m3) ρP: the particle density (kg/m3)
REFERENCES
1) S. Mukawa and Y. Mizukami: Tetsu-to-Hagané, 80 (1994), 207.2) S. Banya, M. Hino, R. Nagabayashi and O. Terayama: Tetsu-to-
Hagané, 75 (1989), 66.3) M. Miyata, S. Fukagawa and T. Matsuo: CAMP-ISIJ, 16 (2003), 115.4) T. Nozaki, K. Nakanishi, H. Morishita, S. Yamada and F. Sudo:
Tetsu-to-Hagané, 68 (1982), 1737.5) O. Haida, S. Takeuchi, T. Nozaki, T. Emi and F. Sudo: Tetsu-to-
Hagané, 68 (1982), 1744.6) M. Kishida, Y. Nishio, S. Cho, S. Wakabayashi, K. Saito, G. Monma
and N. Kimura: Tetsu-to-Hagané, 51 (1965), 1937.7) M. Kishida, Y. Nishio, H. Maeda and N. Maeda: Tetsu-to-Hagané,
52 (1966), 1481.8) H. Nashiwa, S. Yamaguchi, M. Sato, K. Ieda, M. Ishikawa and Y.
Ohkita: Tetsu-to-Hagané, 68 (1982), S203.9) T. Aoki, T. Matsuo, S. Masuda, T. Kishida, K. Katohgi, Y.
Matsumura and Y. Ohkita: Tetsu-to-Hagané, 70 (1984), A190.10) K. Taoka, T. Imai, M. Kuga, R. Tachibana, M. Ohnishi and J. Nagai:
Kawasaki Steel Giho, 15 (1983), 120.11) E. Kimura: Trans. Iron Steel Inst. Jpn., 23 (1983), 522.12) S. Yuu and T. Umekage: ASME FED, 3 (1991), 121.13) K. Hishida, K. Kaneko and M. Maeda: Trans. Jpn. Soc. Mech. Eng.
B, 51 (1985), 2330.14) Y. Hardalupas, A. M. K. P. Taylor and H. Whitelaw: Proc. R. Soc.
Lond., Ser. A, 426 (1989), 31.15) D. Modarress, S. Elghobashi and H. Tan: AIAA J., 22 (1984), 624.16) S. Yu and T. Umekage: Trans. Jpn. Soc. Mech. Eng. B, 60 (1994),
1152.17) S. Yu, S. Katamaki, H. Kohno and T. Umekage: Trans. Jpn. Soc.
Mech. Eng. B, 64 (1998), 29.18) S. Yu: Nagare, 7 (1988), 311.