Embed Size (px)
DESCRIPTION
The study of mesenchymal stem cell (MSC) migration under flow conditionswith investigation of the underlying molecular mechanism could lead to abetter understanding and outcome in stem-cell-based cell therapy and regenerative medicine. We used peer-reviewed open source software to developmethods for efficiently and accurately tracking, measuring and processingcell migration as well as morphology. Using these tools, we investigatedMSC migration under flow-induced shear and tested the molecular mechanism with stable knockdown of focal adhesion kinase (FAK) and RhoAkinase (ROCK). Under steady flow, MSCs migrated following the flow direction in a shear stress magnitude-dependent manner, as assessed by root meansquare displacement and mean square displacement, motility coefficient andconfinement ratio
Citation preview

on March 3, 2015http://rsif.royalsocietypublishing.org/Downloaded from
rsif.royalsocietypublishing.org
ResearchCite this article: Riehl BD, Lee JS, Ha L, Lim
JY. 2015 Fluid-flow-induced mesenchymal
stem cell migration: role of focal adhesion
kinase and RhoA kinase sensors. J. R. Soc.
Interface 12: 20141351.
http://dx.doi.org/10.1098/rsif.2014.1351
Received: 10 December 2014
Accepted: 16 December 2014
Subject Areas:bioengineering
Keywords:stem cell migration, fluid shear, focal adhesion
kinase, RhoA kinase, time lapse
Author for correspondence:Jung Yul Lim
e-mail: [email protected]
& 2015 The Author(s) Published by the Royal Society. All rights reserved.
Fluid-flow-induced mesenchymal stemcell migration: role of focal adhesionkinase and RhoA kinase sensors
Brandon D. Riehl1, Jeong Soon Lee1, Ligyeom Ha1 and Jung Yul Lim1,2
1Department of Mechanical and Materials Engineering, University of Nebraska-Lincoln, Lincoln, NE 68588, USA2The Graduate School of Dentistry, Kyung Hee University, Seoul, Korea
The study of mesenchymal stem cell (MSC) migration under flow conditions
with investigation of the underlying molecular mechanism could lead to a
better understanding and outcome in stem-cell-based cell therapy and regen-
erative medicine. We used peer-reviewed open source software to develop
methods for efficiently and accurately tracking, measuring and processing
cell migration as well as morphology. Using these tools, we investigated
MSC migration under flow-induced shear and tested the molecular mechan-
ism with stable knockdown of focal adhesion kinase (FAK) and RhoA
kinase (ROCK). Under steady flow, MSCs migrated following the flow direc-
tion in a shear stress magnitude-dependent manner, as assessed by root mean
square displacement and mean square displacement, motility coefficient and
confinement ratio. Silencing FAK in MSCs suppressed morphology adaptation
capability and reduced cellular motility for both static and flow conditions.
Interestingly, ROCK silencing significantly increased migration tendency
especially under flow. Blocking ROCK, which is known to reduce cytoskeletal
tension, may lower the resistance to skeletal remodelling during the flow-
induced migration. Our data thus propose a potentially differential role of
focal adhesion and cytoskeletal tension signalling elements in MSC migration
under flow shear.
1. IntroductionMesenchymal stem cells (MSCs) play a key role in tissue homeostasis and repair.
MSCs migrate from niches in the body to the tissues that are damaged or to
be remodelled, and after arrival they undergo tissue-specific commitment and
differentiation and release growth factors to facilitate regeneration [1,2]. Migrat-
ing MSCs are exposed to fluid-flow-induced shear in the vasculature. The
shear stresses cells experience in the vasculature vary with location, heart
rate and many other factors. Arteries typically have wall stresses in the range of
10–70 dyne cm22, and veins have lower stresses of 1–6 dyne cm22 [3]. While it
has been recognized that flow shear stress stimulation influences various MSC
functions [4,5], very little is known regarding the role of flow shear in affecting
MSC migration. Understanding how MSCs migrate under fluid flow, for both
the in vitro expanded culture and the in vivo situation, could significantly improve
MSC-based cell therapy and regenerative medicine outcomes [6].
In this study, we developed methods for accurately tracking and measuring
cell migration and morphology for both static and flow conditions. Our methods
used peer-reviewed open source cell tracking software and added the ability to
measure cell morphology changes, process tracking data and manage multiple
datasets. Our method is able to remove the microscope stage drift via using FIJI
(biological image analysis tool [7]) and to perform the pre-processing, segmenta-
tion, and automated tracking using an open source peer-reviewed time lapse
analyser (TLA [8]). We wrote a custom Matlab program to measure cell mor-
phology, analyse the tracking data from TLA and perform other calculations
relevant to the experiment (the codes will be available upon request). Our pro-
gram allows the user to select which cells are used in measurement and

rsif.royalsocietypublishing.orgJ.R.Soc.Interface
12:20141351
2
on March 3, 2015http://rsif.royalsocietypublishing.org/Downloaded from
calculation. It also manages datasets for multiple conditions
and experimental runs and is able to plot, animate and perform
statistical tests of the obtained data. Although we chose to use
TLA for cell tracking, our program can also open output files
from MTrack2 and other similar formats.
Most cell migration studies have assessed cell movement
under static culture conditions and have primarily tested the
effects of biochemical cell-migration-driving factors such as
chemokines [9]. However, it is increasingly recognized that
other cues than chemokine concentration gradient, such as
static and dynamic mechanical cues or electric fields, also
play a critical role in cell migration [10]. We investigated
MSC migration under fluid flow mechanical conditions with
the rationale described above. Cells under flow-induced shear
may react through various molecular sensors [11]. Integrin-
mediated focal adhesion and cytoskeletal structures anchored
to it are likely to be the primary sites that resist fluid shear,
and may provide a mechanism through which migration trac-
tion force is exerted. Focal adhesion kinase (FAK) is a key
focal adhesion signalling molecule and it is involved in the
regulation of mechanical homeostasis and other processes
such as growth and differentiation [12]. Specific to migration,
FAK may play an important role because it controls cellular
adhesion and spreading [13]. The control of cell migration by
FAK has been specifically explored in cancer cell metastasis
based on significant FAK overexpression observed in primary
and metastatic tumours [14]. RhoA kinase (ROCK), the first
downstream effector of Rho GTPases, is involved in actin
filament formation, cytoskeletal tension-mediated cell mor-
phology change and the resultant cell fate decision [15]. In
migration, ROCK is thought to aid in the cell contraction pro-
cess and may regulate transmigration through other cell
layers [16]. ROCK has also been proposed to be a therapeutic
target for disorders of the central nervous system, because inhi-
biting ROCK enhanced neural cell elongation, protrusion and
migration [17]. While the role of FAK and ROCK, molecular
elements each representing key focal adhesion and cytoskele-
tal tension signalling cascades, in cell migration has been
suggested, there is limited information regarding their control
of cell migration under flow shear, especially for MSCs.
Using the developed methods forcell tracking, measurement
and processing, we examined the effects of flow-induced shear
stress on C3H10T1/2 murine MSC migration and morphology.
Cells were subjected to physiologically relevant shear stresses
at 2, 15 and 25 dyne cm22 (labelled FF2, FF15 and FF25, res-
pectively), and time lapse microscopy data were collected,
analysed and compared with those of unflowed static control.
To test the molecular mechanism of MSC migration under
flow, MSCs with stable FAK and ROCK-I silencing were estab-
lished using the small hairpin RNA (shRNA) technique and
cell responses under flow were compared with those of vector
control cells.
2. Material and methods2.1. Small hairpin RNAEstablishing MSCs with stable FAK or ROCK knockdown has
been previously reported [18,19]. Briefly, murine C3H10T1/2
MSCs (ATCC, CCL-226) were transfected for 24 h with shRNA–
FAK (sc-35353-SH) or shRNA–ROCK-I (sc-36432-SH), both from
Santa Cruz Biotechnology, using lipofectamine 2000 (Invitrogen)
transfection reagent. The cells were then exposed to the selection
media containing 2 mg ml21 puromycin. The puromycin-resistant
cells were selected for further passaging to establish stable knock-
down cells. Vector control was produced by repeating the
procedure but with green fluorescent protein (GFP) control plas-
mid (Santa Cruz Biotechnology, sc-108083). Silencing of FAK
and ROCK was confirmed by RT-PCR and immunoblotting
[18,19]. Examples of Western blotting data for silenced FAK and
ROCK are shown in the electronic supplementary material,
figure S14. In contrast to small interference RNA exerting only a
transient silencing, shRNA adopted, in this study, allows high
potency and sustainable interference and less off-target silencing
via endogenous machinery [20]. The sustainable interference was
checked with immunoblotting after subcultures.
2.2. Cell cultureCells were cultured in growth media composed of Dulbecco’s
modified Eagle medium supplemented with 10% fetal bovine
serum (FBS), 1% penicillin–streptomycin and 2 mg ml21 puromy-
cin. Glass slides (75 � 25 mm2, thickness of 1 mm), which fit to the
flow chamber, were sterilized by exposure to UV light for 2 h. Cells
were seeded at 1 � 105 cells in 1 ml of media per slide. After
allowing adhesion for 1 h, the media were changed to the serum-
reduced media (with 5% FBS), in which cells were kept overnight
before starting the time lapse flow experiments the next day. The
cell attachment number was retro-calculated by counting the unat-
tached floating cells after 1 h of adhesion. A total of five slides for
each cells (vector control, FAK–shRNA, ROCK–shRNA) were
tested for adhesion.
2.3. Fluid flow set-upThe fluid flow system (Flexcell International) consists of a media
reservoir, a Masterflex L/S peristaltic pump, an Osci-Flow control-
ler, two pulse dampeners and a FlexFlow shear stress chamber
(figure 1). The components were connected with Masterflex L/S
16 tubing. The media reservoir was placed in a 378C water bath.
The STREAMSOFT v. 4.1 software (Flexcell International) controlled
the pump and flow controller. It determines the required flow
rate for a given shear stress by taking into account the device
dimensions, the tubing size and the media viscosity (electronic
supplementary material, table S7). The shear stress experienced
by the cells is assumed to be the wall shear stress.
The FlexFlow chamber, which enables in situ observation of
the cells under fluid flow, was assembled as directed by the man-
ufacturer. The flow system was sterilized by 10 min of flow with
70% ethanol through the tube and then flushed with deionized
water twice. The water was drained, and then 400 ml of flow
media (the same serum-reduced media with 5% FBS) was
added to the reservoir. The media were circulated until all air
bubbles were removed from the system. For flow experiments,
a slide seeded with cells was placed in the FlexFlow device,
and the vacuum was applied to hold the slide. The vacuum
seal was checked for leaks before placing the FlexFlow on the
inverted microscope. The device was held by the microscope
stage and secured with laboratory tape. To avoid air entrapment
in the system owing to each slide assembling, the media were
primed after every slide change for 30 s. This could prevent
bubbles from shearing off the cells. The fluid flow stimulation
of cells was performed for 2 h at three different shear stresses
(2, 15 and 25 dyne cm22) under steady flow conditions. The
static unflowed control was observed using the same FlexFlow
chamber but without fluid shear. At least four different flow
experiments were performed for each condition.
2.4. Time lapse imagingA section of the cell-cultured slide away from the edges and con-
taining at least 10 free cells was selected for imaging. Cells

flow
microscope
pulse dampenersflow controller pump
shear
flow chamber
slide with cells
media in water bath
Figure 1. Schematic of the fluid flow set-up. The cell-seeded glass slide was assembled with the FlexFlow chamber and placed on the inverted microscope for timelapse imaging. Steady flows at 2, 15 and 25 dyne cm22 shear stress were applied, and cell migration and morphology were measured using our program.
rsif.royalsocietypublishing.orgJ.R.Soc.Interface
12:20141351
3
on March 3, 2015http://rsif.royalsocietypublishing.org/Downloaded from
clumped or interconnected were excluded in the processing. The
time lapse recording of phase contrast images was conducted
once per minute up to 2 h with a Leica inverted microscope at
10�magnification using the Leica application suite software.
2.5. Image processingThe first step in the image processing was to remove motion owing
to microscope stage drift and slide movement. This was adopted
from FIJI, which used the template matching plugin [7]. A template
was selected for each phase contrast image stack from a region of
the background that contained distinguished features. All sub-
sequent images in the stack were aligned to this template. The
transform coordinates from the phase contrast stacks were used
in a Matlab script to align the image stacks. The contrast was
adjusted using the automatic window/level feature in FIJI.
The stabilized image stacks were processed to detect cell out-
lines in TLA. Two separate binary masks were created and
added. One mask was created by applying the Otsu threshold to
the image entropy. The second mask was created using Sobel
edge detection. These two masks combined (electronic supplemen-
tary material, figure S1) could consistently detect the cell outlines.
The binary mask images were then used for automated cell tracking
and for cell morphology measurements. See the electronic sup-
plementary material, tables S9–S11 for the full mask creation
details. Video examples of time-series cell migration tracks can be
found in the electronic supplementary material, information
section, and examples of captured time-series images of the cells
are shown in the electronic supplementary material, figure S2.
2.6. Data processingAutomated cell tracking was performed in the TLA and the mor-
phology measurement, data processing and statistics were
performed in our custom Matlab script. See the electronic sup-
plementary material, information section for the cell tracking
details and measurement descriptions.
2.7. StatisticsStatistical significance was tested using one-way analysis of var-
iance (ANOVA) with a Tukey–Kramer post hoc test in Matlab.
The data were checked to ensure the ANOVA assumptions were
met (electronic supplementary martial, information). Skewed
data were detected by plotting the residuals of ANOVA against a
standard normal curve. A log10 transform was applied to the
skewed data before applying statistical tests, which were then
back-transformed. The back-transformed mean becomes the geo-
metrical mean, and the confidence intervals become asymmetric.
The data are presented as mean+ standard error of measurement
(SEM). The symbols in the figures that mark statistical significance
compared with static control, FF2, FF15, FAK–shRNA static
and ROCK–shRNA static are *, #, C, ‡ and þ, respectively. The
p-values less than 0.05, 0.01 and 0.001 are indicated by single,
double and triple symbols, respectively.
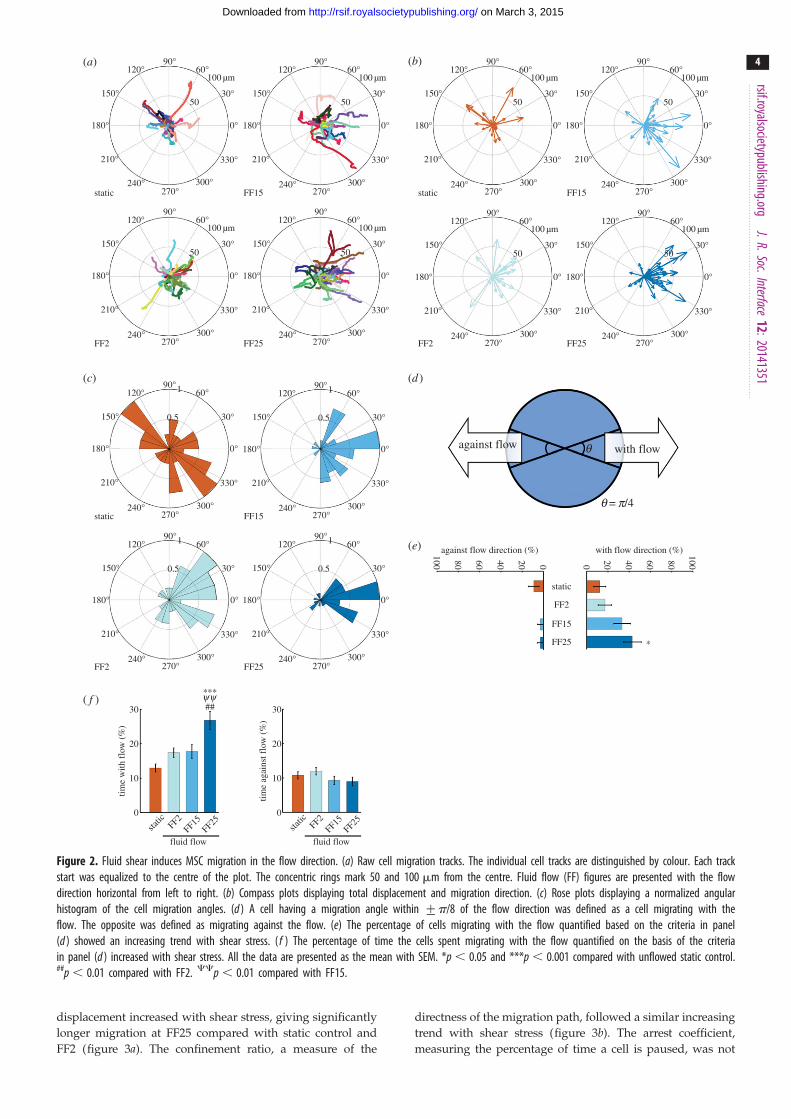
3. Results3.1. Fluid shear directs mesenchymal stem cell
migration in a shear stress-dependent mannerThe cell outline was detected (electronic supplementary
material, figure S1) using the developed masks, from which
the cell centroid position at each time frame was determined.
Cell migration raw track data under static and flow conditions
could be obtained by connecting the centroids (figure 2a; each
coloured line represents each cell movement for 2 h adjusted to
begin from the centre of the plot; for fluid flow samples, flow
was applied horizontally from left to right; also see videos in
the electronic supplementary material, information). The com-
pass plot (figure 2b) and rose plot (figure 2c) could be obtained
from the raw tracks to show total displacement and angular
histograms, respectively. It could be seen from these plots that
sheared MSCs travelled following the flow direction (from left
to right). In quantification based on the migration angle criteria
(figure 2d), the percentage of cells migrating with the flow
showed an increasing trend with the shear stress magnitude
applied (figure 2e). The percentage of time that cells migrated
with the flow direction was significantly increased in the FF25
condition compared with unflowed static control and FF2 and
FF15 (figure 2f ). The time spent migrating against the flow
direction appeared to have a decreasing trend at higher shear
stresses, but did not reach statistical significance.
Analyses using our program could further provide multi-
aspect information on cell migration. The average total
0 020 2040 4060 6080 80
100
100
static
FF2
FF15
FF25
against flow direction (%) with flow direction (%)
*
against flow with flow
static
static FF15
FF2 FF25
FF15 FF15static
FF2 FF25 FF25FF2
150°
120°
180° 0°
210°
240°270°
300°
330°
30°
60°
50
100 µm
90°
150°
120°
180° 0°
210°
240°270°
300°
330°
30°
60°
50
100 µm
90°
150°
120°
180° 0°
210°
240°270°
300°
330°
30°
60°
0.5
190°
150°
120°
180° 0°
210°
240°270°
300°
330°
30°
60°
0.5
190°
150°
120°
180° 0°
210°
240°270°
300°
330°
30°
60°
0.5
190°
150°
120°
180° 0°
210°
240°270°
300°
330°
30°
60°
0.5
190°
150°
120°
180° 0°
210°
240°270°
300°
330°
30°
60°
50
100 µm
90°
150°
120°
180° 0°
210°
240°270°
300°
330°
30°
60°
50
100 µm
90°
150°
120°
180° 0°
210°
240°270°
300°
330°
30°
60°
50
100 µm
90°
150°
120°
180° 0°
210°
240°270°
300°
330°
30°
60°
50
100 µm
90°
150°
120°
180° 0°
210°
240°270°
300°
330°
30°
60°
50
100 µm
90°
150°
120°
180° 0°
210°
240°270°
300°
330°
30°
60°
50
100 µm
90°
q
q = p/4
(b)(a)
(c) (d )
(e)
30
20
10
0
***
##
fluid flow fluid flow
time
agai
nst f
low
(%
)
30
20
10
0
time
with
flo
w (
%)
static FF2
FF15FF25
static FF2
FF15FF25
yy( f )
Figure 2. Fluid shear induces MSC migration in the flow direction. (a) Raw cell migration tracks. The individual cell tracks are distinguished by colour. Each trackstart was equalized to the centre of the plot. The concentric rings mark 50 and 100 mm from the centre. Fluid flow (FF) figures are presented with the flowdirection horizontal from left to right. (b) Compass plots displaying total displacement and migration direction. (c) Rose plots displaying a normalized angularhistogram of the cell migration angles. (d ) A cell having a migration angle within +p/8 of the flow direction was defined as a cell migrating with theflow. The opposite was defined as migrating against the flow. (e) The percentage of cells migrating with the flow quantified based on the criteria in panel(d ) showed an increasing trend with shear stress. ( f ) The percentage of time the cells spent migrating with the flow quantified on the basis of the criteriain panel (d ) increased with shear stress. All the data are presented as the mean with SEM. *p , 0.05 and ***p , 0.001 compared with unflowed static control.##p , 0.01 compared with FF2. CCp , 0.01 compared with FF15.
rsif.royalsocietypublishing.orgJ.R.Soc.Interface
12:20141351
4
on March 3, 2015http://rsif.royalsocietypublishing.org/Downloaded from
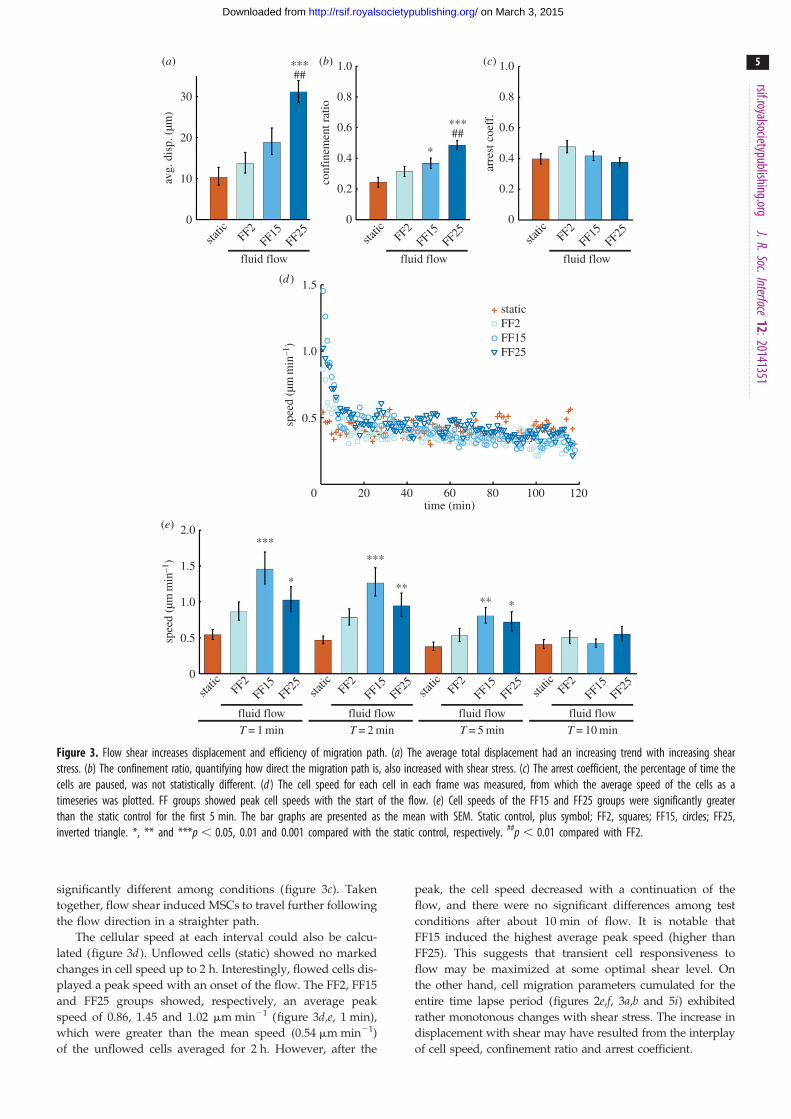
displacement increased with shear stress, giving significantly
longer migration at FF25 compared with static control and
FF2 (figure 3a). The confinement ratio, a measure of the
directness of the migration path, followed a similar increasing
trend with shear stress (figure 3b). The arrest coefficient,
measuring the percentage of time a cell is paused, was not
1.0
0.8
0.6
0.4
0.2
0
1.0
0.8
0.6
0.4
0.2
0
30
20
10
0
static FF2
FF15FF25
static FF2
FF15FF25
static FF2
FF15FF25
avg.
dis
p. (
µm)
conf
inem
ent r
atio
arre
st c
oeff
.
***##
***
*
##
fluid flow fluid flow fluid flow
1.5
1.0
0.5
0 20 40 60 80 100 120
staticFF2FF15FF25
time (min)
spee
d (µ
mm
in–1
)
2.0
1.5
1.0
0.5
0
static
static
static
staticFF2
FF2FF2
FF2FF15
FF15FF15
FF25FF25
FF25FF15
FF25
***
***
**** *
*
T = 1 min T = 2 min T = 5 min T = 10 min
fluid flow fluid flow fluid flow fluid flow
spee
d (µ
mm
in–1
)
(b)(a) (c)
(d )
(e)
Figure 3. Flow shear increases displacement and efficiency of migration path. (a) The average total displacement had an increasing trend with increasing shearstress. (b) The confinement ratio, quantifying how direct the migration path is, also increased with shear stress. (c) The arrest coefficient, the percentage of time thecells are paused, was not statistically different. (d ) The cell speed for each cell in each frame was measured, from which the average speed of the cells as atimeseries was plotted. FF groups showed peak cell speeds with the start of the flow. (e) Cell speeds of the FF15 and FF25 groups were significantly greaterthan the static control for the first 5 min. The bar graphs are presented as the mean with SEM. Static control, plus symbol; FF2, squares; FF15, circles; FF25,inverted triangle. *, ** and ***p , 0.05, 0.01 and 0.001 compared with the static control, respectively. ##p , 0.01 compared with FF2.
rsif.royalsocietypublishing.orgJ.R.Soc.Interface
12:20141351
5
on March 3, 2015http://rsif.royalsocietypublishing.org/Downloaded from
significantly different among conditions (figure 3c). Taken
together, flow shear induced MSCs to travel further following
the flow direction in a straighter path.
The cellular speed at each interval could also be calcu-
lated (figure 3d ). Unflowed cells (static) showed no marked
changes in cell speed up to 2 h. Interestingly, flowed cells dis-
played a peak speed with an onset of the flow. The FF2, FF15
and FF25 groups showed, respectively, an average peak
speed of 0.86, 1.45 and 1.02 mm min21 (figure 3d,e, 1 min),
which were greater than the mean speed (0.54 mm min21)
of the unflowed cells averaged for 2 h. However, after the
peak, the cell speed decreased with a continuation of the
flow, and there were no significant differences among test
conditions after about 10 min of flow. It is notable that
FF15 induced the highest average peak speed (higher than
FF25). This suggests that transient cell responsiveness to
flow may be maximized at some optimal shear level. On
the other hand, cell migration parameters cumulated for the
entire time lapse period (figures 2e,f, 3a,b and 5i) exhibited
rather monotonous changes with shear stress. The increase in
displacement with shear may have resulted from the interplay
of cell speed, confinement ratio and arrest coefficient.

3500 0.70
0.65
0.60
0.55
0.50
3000
2500
2000ve
ctor
FAK–s
h
ROCK–sh
vecto
r
FAK–s
h
ROCK–sh
vecto
r
FAK–s
h
ROCK–sh
100 3500 0.70
0.65
0.60
0.55
0.50
3000
2500
2000
80
60
40
20
0 vectorFAK–shROCK–sh
circ
ular
ity
circ
ular
ity
perc
ent a
ttach
ed
area
(µm
2 )
area
(µm
2 )
time (min) time (min)
+
T = 0 min T = 0 min 0 20 40 60 80 100 120 0 20 40 60 80 100 120
FAK–sh static
150°
120°
180° 0°
210°
240°270°
300°
330°
30°
60°
50
100 µm
90°
150°
120°
180° 0°
210°
240°270°
300°
330°
30°
60°
50
100 µm
90°
150°
120°
180° 0°
210°
240°270°
300°
330°
30°
60°
50
100 µm
90°
150°
120°
180° 0°
210°
240°270°
300°
330°
30°
60°
50
100 µm
90°
150°
120°
180° 0°
210°
240°270°
300°
330°
30°
60°
50
100 µm
90°
150°
120°
180° 0°
210°
240°270°
300°
330°
30°
60°
50
100 µm
90°
150°
120°
180° 0°
210°
240°270°
300°
330°
30°
60°
50
100 µm
90°
150°
120°
180° 0°
210°
240°270°FAK–sh FF15 FAK–sh FF15FAK–sh static
ROCK–sh static ROCK–sh FF15 ROCK–sh FF15ROCK–sh static
300°
330°
30°
60°
50
100 µm
90°
(b)(a) (c)
(d ) (e)
Figure 4. Silencing FAK suppresses migration and morphology adaptation, whereas ROCK interference facilitates migration. (a) Cell seeding efficiency was notsignificantly different among the cells. (b) Initial cell area was not statistically different but slightly less for silenced cells. Initial cellular circularity was significantlygreater for FAK – shRNA than for ROCK – shRNA. (c) The timeseries of the area and circularity under static condition. Vector control and ROCK-silenced cells showedinitial adaptation and recovery responses unlike FAK-silenced cells. (d ) Raw migration tracks for silenced cells without and with flow at 15 dyne cm22. Fluid flowwas applied horizontally from left to right. FAK – shRNA reduced cell migration while ROCK – shRNA stimulated. (e) Corresponding compass plots. The bar graphs arepresented as the mean with SEM. Vector control static, plus; FAK – shRNA static, diamond; ROCK – shRNA static, left inverted triangle. ‡p , 0.05 compared withFAK – shRNA. þp , 0.05 compared with ROCK – shRNA.
rsif.royalsocietypublishing.orgJ.R.Soc.Interface
12:20141351
6
on March 3, 2015http://rsif.royalsocietypublishing.org/Downloaded from
3.2. Focal adhesion kinase and RhoA kinase silencingaffects mesenchymal stem cell shape and motilityunder static condition
We previously reported the establishment and characteriz-
ation of MSCs with stable interference of FAK [18] and
ROCK [19] accomplished via shRNA. Note that all of the
non-silenced cells used in this study are GFP-loaded vector
control cells, including the cells used for assessing shear
stress effects (figures 2 and 3). Comparisons of vector control
and shRNA are shown in figures 4 and 5. As basal data, there
was no significant difference in cell seeding efficiency among
the cell lines (figure 4a). Adhered cell area was slightly less
for silenced cells, whereas the circularity was significantly
greater for FAK-silenced MSCs when compared with MSCs
with ROCK–shRNA (figure 4b).
Cells displayed shape changes during the time lapse
period even under static conditions. This may possibly be a
response to the brief circulation of media in the chamber to
remove air bubbles before the experiment. Vector control
cells and ROCK-silenced MSCs had an initial area contraction
followed by a gradual return towards the original area under
no flow conditions (figure 4c). However, MSCs with FAK–
shRNA did not exhibit notable area changes for the 2 h
period, indicating that FAK knockdown may have disabled
morphological adaptation capability. Similar results were
obtained for circularity under static conditions (figure 4c),
i.e. an initial increase then decrease for vector control and
ROCK–shRNA, but no notable change for FAK–shRNA.
FAK and ROCK silencing also affected MSC motility
under static conditions. MSCs with FAK–shRNA were less
mobile giving a decreased displacement, whereas ROCK-
silenced MSCs showed increased mobility (static cases in
figures 4d,e and 5a). MSCs with FAK–shRNA also migrated
with relatively less direct paths (static cases in figure 5b).
Both the comparisons of the total displacement and confine-
ment ratio between FAK–shRNA and ROCK–shRNA under
static conditions reached statistical significance (figure 5a,b).
The rose plot corresponding to figure 4d is shown in the
electronic supplementary material, figure S5.
3.3. Flow-induced mesenchymal stem cell migrationis differentially affected by focal adhesion kinaseand RhoA kinase
As in figures 2 and 3, the FF25 group had, in general, more
migration stimulatory effects among shear stresses tested. We

40
30
20
10
0
020406080 806040200
100
10030
30
20
10
0
30 2.0
1.5
1.0
0.5
0
20
10
0
***
******
*
***
******
***
1.0
0.8
0.6
0.4
0.2
0
1.0
0.8
0.6
0.4
0.2
0
20
10
0
FF25ROCK–sh FF15
FAK–sh FF15
FAK–sh static
ROCK–sh static
vector FF15
vector static
FF125
FF2
static2.542.002.873.551.002.241.883.63
control
FAK–s
ROCK–s
RMS displacement versus t1/2 RMS displacement versus t1/2
RM
S di
spla
cem
ent (
µm)
40
30
20
10
0
RM
S di
spla
cem
ent (
µm)
t1/2 (min1/2) t1/2 (min1/2)
0 2 4 6 8 10 0 2 4 6 8 10
20 (static)
0 (static)
0 (static)
15
15
15
25
celltype
motilitycoefficient
shear level(dyne cm–2)
T = 1 min T = 2 min T = 5 min T = 10 min
against flow direction (%)
avg.
dis
p. (
µm)
time
with
flo
w (
%)
time
agai
nst f
low
(%
)
spee
d (µ
mm
in–1
)
conf
inem
ent r
atio
arre
st c
oeff
.
with flow direction (%)
vector static
vector FF15
FAK–sh static
FAK–sh FF15
ROCK–sh FF15
ROCK–sh static
static
vecto
r
FAK–s
h
ROCK–sh
FF15sta
ticFF15
static
FF15
static
vecto
r
FAK–s
h
ROCK–sh
FF15sta
ticFF15
static
FF15sta
tic
vecto
r
FAK–s
h
ROCK–sh
FF15sta
ticFF15
static
FF15sta
tic
vecto
r
FAK–s
h
ROCK–sh
FF15sta
ticFF15
static
FF15sta
tic
vecto
r
FAK–s
h
ROCK–sh
FF15sta
ticFF15
static
FF15sta
tic
vecto
r
FAK–s
h
ROCK–sh
FF15sta
ticFF15
static
FF15sta
tic
vecto
r
FAK–s
h
ROCK–sh
FF15sta
ticFF15
static
FF15
static
vecto
r
FAK–s
h
ROCK–sh
FF15sta
ticFF15
static
FF15sta
tic
vecto
r
FAK–s
h
ROCK–sh
FF15sta
ticFF15
static
FF15
++
+++++
+++
++
+++
(b)(a)
(i)
(c) (d )
(e)
(g) (h)
( f )
Figure 5. FAK silencing decreases RMS displacement and motility coefficient, whereas ROCK silencing increases them especially under flow conditions. (a) MSCs withROCK – shRNA had an increased total cell displacement. (b) The confinement ratio showed a similar increase for ROCK – shRNA. (c) No significant changes weredetected for the arrest coefficient other than a lower value for ROCK – shRNA than for FAK – shRNA. (d ) Silenced cells still showed preferred migration alongthe flow direction. (e) ROCK-silenced cells under flow spent significantly more time migrating with the flow direction. ( f ) Silenced cells also showed a peakspeed after the flow onset. (g) RMS displacement plotted against square root of time showed shear stress-dependent increases. (h) In the same type of plot,FAK – shRNA decreased RMS displacement for both static and flow conditions. ROCK interference increased RMS displacement especially under flow conditions.(i) Calculated motility coefficient increased with increasing shear stress. It had lower values for FAK – shRNA for both static and shear conditions relative tovector control counterparts. MSCs with ROCK – shRNA at FF15 exhibited the greatest motility coefficient among test conditions. The bar graphs are presentedas the mean with SEM. Static control, plus; FF2, square: FF15, circle; FF25, inverted triangle; FAK – shRNA static, diamond; FAK – shRNA FF15, multiplicationsymbol; ROCK – shRNA static, left inverted triangle; ROCK – shRNA FF15, delta symbol. *, ** and ***: p , 0.05, 0.01, and 0.001 compared with vector controlstatic. ‡, ‡‡ and ‡‡‡: p , 0.05, 0.01 and 0.001 compared with FAK – shRNA static. þþ and þþþ: p , 0.01 and 0.001 compared with ROCK – shRNA static.
rsif.royalsocietypublishing.orgJ.R.Soc.Interface
12:20141351
7
on March 3, 2015http://rsif.royalsocietypublishing.org/Downloaded from
observed, however, that more cells were washed away by the
flow in the FF25 group. In testing the role of FAK and ROCK
in flow-induced MSC migration, we thus chose a shear of
15 dyne cm22. Even in the presence of FAK knockdown,
FF15 could still induce cell migration (comparison between
static and FF15 for FAK–shRNA samples, figure 5a,b,d,e).
Interestingly, silencing ROCK stimulated MSC mobility
under shear stress conditions. MSCs with ROCK–shRNA
under FF15 showed the greatest total displacement, confine-
ment ratio and time migrating with the flow and had the
smallest arrest coefficient (figure 5a–c,e), indicating that
ROCK-silenced MSCs under flow tended to move further in
straighter paths complying with the flow, potentially with
fewer stops. Silenced cells also showed a peak speed after the
flow onset (figure 5f ). MSCs with FAK–shRNA had a lower
peak speed under FF15 relative to the sheared vector control at
FF15. For ROCK-silenced cells, although most of the migration
parameters were increased as described above, the peak speed
was relatively lower. Again, after about 10 min, there were no
notable differences in cell speed among conditions.
To assess cell migration in a more collective manner, the
root mean square (RMS) displacement, a measure of group
dispersion, was quantified (equation 1, electronic supplemen-
tary material, information). The RMS displacement is a more
holistic measure of migration that contains elements of displa-
cement, speed, confinement and arrest of participating cells.
Further, from the plot of RMS displacement versus square
root of time (figure 5g,h), the motility coefficient can be deter-
mined as the average slope. The motility coefficient implies the
strength of migration in the same context with the diffusion
coefficient of the first-order diffusion kinetics [21]. Our data
showed that with increasing stress cells displayed increasing
trends in RMS displacement (figure 5g) and motility coefficient
(figure 5i). MSCs with FAK–shRNA under static conditions

rsif.royalsocietypublishing.orgJ.R.Soc.Interface
12:20141351
8
on March 3, 2015http://rsif.royalsocietypublishing.org/Downloaded from
had a very low RMS displacement (figure 5h) and motility
coefficient. Importantly, while shear could still induce
migration for FAK-silenced cells, the RMS displacement and
motility coefficient for FAK–shRNA at FF15 were decreased
relative to the vector control under FF15 (figure 5h,i). This indi-
cates that FAK silencing suppressed MSC responsiveness in
migration to shear. On the other hand, silencing ROCK
resulted in a remarkable increase in MSC motility especially
under flow. MSCs with ROCK–shRNA at FF15 had the great-
est RMS displacement and motility coefficient among all of
the conditions tested (figure 5h,i), including the comparison
with vector control at FF15 (and also FF25). Note that we
analysed the RMS displacement as a representative measure
of cell migration tendency, from which a clear correlation
between flow shear and cell migration and the role of FAK
and ROCK could be illustrated (figure 5g– i). We further per-
formed an alternative migration calculation, i.e. mean square
displacement (MSD) measurement. The RMS calculation uses
ensemble averaging, whereas the MSD calculation uses the
ensemble and time averaging (equation 2, the electronic
supplementary material, information). The MSD calculation
provided similar results on the flow shear control of MSC
migration and its mediation by FAK and ROCK (plots of
MSD are shown in the electronic supplementary material,
information section and figure S8).
The time-series changes of various morphology parameters
(area, circularity, orientation, major and minor axis lengths, etc.)
under shear and silencing were obtained using our program
(electronic supplementary material, information). Vector
control and cells with ROCK–shRNA had initial adaptation
responses owing to flow followed by gradual returning
changes. However, MSCs with FAK–shRNA had impaired
responses in cell morphology adaptations under flow, as was
similarly seen for the static case (figure 4c). It is notable the mor-
phology recovering tendency after initial adaptation appeared
to be less pronounced at higher shear stresses of FF15 and
FF25 (e.g. area, circularity and major axis length in electronic
supplementary material, figures S9, S10, S12). The orientation
angle (electronic supplementary material, figure S11), an
angle between the cell major axis and the flow direction, was
smaller for sheared cells relative to the static counterpart for
all conditions tested.
4. DiscussionThe study of MSC migration under fluid flow may have signifi-
cant implications in cell therapy and regenerative medicine.
The homing ability of MSCs to damaged tissues, tumours,
myocardial infarction and sites of inflammation associated
with autoimmune disorders makes MSCs a natural vehicle
for cell-based therapy [2]. While the systemic or local delivery
of MSCs has been attempted to treat these diseases, the process
of MSC translocation and the role of flow shear in particular are
not well understood. Improvements to cell injection therapy
could be made if the cell migration to damaged sites is better
understood. MSC homing depends on migration through a
vessel under flow, adhesion to the vessel wall and intrusion
through endothelial layer. The success of these processes may
be affected by the shear stress and cell mechanotransduction
determined by molecular sensors, such as FAK and ROCK,
in addition to traditional chemoattractants and related bio-
chemical signalling. This study could also improve tissue
engineering scaffold and perfusion bioreactor design. Tissue
engineering suffers from low cell invasion into the scaffold.
Knowing the effect of bioreactor flow on cell invasion could
greatly improve engineered tissue outcomes. Studies have
attempted to modulate MSC migration capability. For example,
MSCs manipulated to express CXCR4 receptor could be forced
to home to the myocardial infarction for heart repair [22]. MSC
homing to damaged bone tissue increased with increasing integ-
rina4 expression [23]. However, the role of flow shear mechanical
milieus in MSC migration has seldom been investigated.
We developed methods that significantly extend the capa-
bility and power of other open source cell tracking software
such as the plugins included in FIJI [7] and TLA [8]. Our pro-
gram for processing the tracks and morphologies of the cells
greatly reduces the amount of time and work required to
extract data from the multiple experimental conditions and
replicates. Some software (TLA, MTrack2, and TrackMate in
FIJI) has adequate segmentation or tracking capabilities but
limited post-processing tools. Our scripts allow easy visual-
ization of the entire dataset and enable any migration and
morphology parameters to be plotted, compared with par-
ameters from other experimental groups and statistically
tested with ANOVA at any time points. Most of the plots
shown in this paper were taken directly from the output of
our scripts. Our methods were developed to be adaptable
and expandable to allow the addition of tracking and
morphology measurements not currently implemented. The
current scripts process the output files from TLA and process
the morphology data from audio video interleave files. The
scripts can also process the output files from the MTrack2
plugin and other similar formats, and can easily be extended
to accept data in other formats.
We observed that MSCs actively participated in directed
crawling migration under flow shear. Our study focused on
the crawling motion and did not attempt to quantify migration
by other modes such as tethering or rolling [24]. We noted that
very few cells under flow sometimes detached with long tethers,
at times remaining connected for a couple of minutes. It is poss-
ible that these tethering cells re-attempted to participate in the
migration. However, the chance of re-attachment may have
been minimized as the glass slides used for flow assays were
not functionalized with cell-adhesive molecules such as Arg–
Gly–Asp ligands. All of the tracking and calculations were set
only for the crawling cells.
The cells migrated following the flow direction and the trend
became stronger with increasing shear stress magnitude
(figures 2 and 3). It is remarkable that these results on MSCs
are in contrast with the migration behaviour of other auton-
omous cells such as leucocytes which tend to be arrested more
when rolling under high flow shear [25] and some cancer cells
which are inclined to migrate against the interstitial flow [26].
Although not clear at this stage, potential differences in the
migration mode, flow regimen and cell type may bring about
such differences. It may also be notable that the cells in the
FF2 group had relatively greater arrest coefficient (figure 3c)
and no net migration against the flow (figure 2e), although
both of these results were not statistically significant. This may
at least suggest that at some lower shear stress range MSCs
may stop longer and do not move either following or against
the flow. Further investigation of MSC migration at varying
shear stresses may reveal shear levels leading to MSC arrest.
Another thing to note is the lack of long-term differences in
cell speed with respect to shear stress level (figure 3d,e, after

shear stress
actin
FAK
FAK
shearMSC
migration
MSCmigration
MSCmigration
migration
cytoskeleton
ROCK
ROCKnucleus
integrinsa b a b
Figure 6. MSC migration under flow changes in a shear stress magnitude-dependent manner and is differentially affected by FAK and ROCK silencing. With increas-ing shear stress, MSC migrated further with straighter paths. FAK silencing decreased RMS displacement and motility coefficient, whereas ROCK silencing stimulatedcell migration under flow shear. This may suggest different roles for focal adhesion signalling via FAK and cytoskeletal tension signalling via ROCK in the flow shearinduction of MSC migration.
rsif.royalsocietypublishing.orgJ.R.Soc.Interface
12:20141351
9
on March 3, 2015http://rsif.royalsocietypublishing.org/Downloaded from
about 10 min), regardless of marked differences in cumulative
migration data. As commented earlier, various cell reactions
to flow shear, as outlined through our methods with multi-
aspect migration parameters (displacement, confinement ratio,
arrest coefficient, speed, time migrating with or against the
flow or more collectively as RMS displacement and motility
coefficient or MSD), contribute together to form the observed
cell migration behaviour.
Silencing the key focal adhesion mechanosensor, FAK,
suppressed MSC migration for both static and flow conditions
(figures 4 and 5), indicating that FAK is necessary for MSC
migration. The decreased migration by FAK–shRNA may be
due to the difficulty in focal adhesion turnover. It was reported
for endothelial cells under flow shear that FAK was recruited to
form new focal adhesions at the leading edge of the migration
and the stress fibres connected to these new focal adhesions
were more stable relative to those at other sites [27]. The focal
adhesion turnover would be limited in MSCs with FAK–
shRNA, reducing the capability to create new attachment
sites required for migration. In addition, FAK silencing
reduced morphology adaptation responses, as assessed by lim-
ited changes in area and circularity during the time lapse
period for both static (figure 4c) and flow conditions (electronic
supplementary material, information). The lack of morphology
adaptation by FAK knockdown is consistent with the reported
role of FAK as a general cell adhesion mechanosensor [28].
The other key mechanosensing component, cytoskeleton,
may contribute differently to MSC migration. Silencing of
ROCK, which regulates cytoskeleton formation and cell ten-
sion, actually caused increased migration tendencies in both
static and sheared conditions (figures 4 and 5). Our results
are in line with other studies that showed enhanced migration
under ROCK inhibition, for example increased trans-endo-
thelial migration of MSCs [16], promoted migration in neural
cells [17] and restored motility in g-actin-knockdown cells
[29]. However, all of these studies only dealt with static culture.
Our study is the first study, to the best of our knowledge, to
show that ROCK–shRNA facilitates MSC migration under
mechanical milieus such as fluid shear. It has been proposed
for static culture that blocking ROCK diminishes cytoskele-
tal tension which may lower the resistance to remodelling
during migration [16,17]. A similar mechanism may be applied
for the flow shear situation. On the other hand, some
study proposed that ROCK may be less important for
cell migration (but under static culture). For leucocytes, cell
migration via lamellipodia formation at the leading edge of
the cell is driven by actin polymerization via Rac, whereas
the contraction via RhoA–ROCK may act primarily at the trail-
ing edge [30]. While this report is for static culture, of particular
interest for further study under flow will be the Rac pathway.
Rac is part of the Rho family of small GTPases that regulate
the mode of cell migration by controlling cytoskeletal pro-
trusion and contraction. Rac is involved in many cellular
functions, including polarization, cell adhesion and migration
[31]. The Rac and Rho pathways are generally antagonistic
with complex spatio-temporal regulation, which is poorly
understood to date [32]. Because it was shown for leucocytes
under static culture that Rac plays a role associated with cyto-
skeletal protrusions at the leading edge of the cell migration
[30], evaluating the role of Rac in MSC migration under physio-
logically relevant shear stress will greatly broaden our
understanding of the underlying molecular mechanisms in
MSC migration and homing.
Combining our results, silencing FAK (focal adhesion
signalling) is inhibitory of MSC migration, whereas silencing
ROCK (cell tension signalling) is stimulatory. A possible
explanation may include that FAK inhibition could be tied
to an increase in Rho [33], an upstream effector of ROCK,
which increases cytoskeletal tension therefore decreasing the
cytoskeletal adjustment capability required for migration.
Additionally, unlike FAK–shRNA, ROCK silencing appeared
not to impair cell morphology adaptation capability. In another
group’s study using Y-27632, which inhibits both ROCK-I and
ROCK-II, MSCs showed suppressed morphology adaptation
response under fluid flow [4]. The comparison may suggest a
separate role of ROCK-I and ROCK-II in cell shaping under
flow shear (remember that our shRNA specifically knocked
down ROCK-I). Cell areas for FAK–shRNA and ROCK–
shRNA were, in general, smaller than that of the vector control
(figure 4b,c; especially after sufficient adaptation–recovery
period or after about an hour). A small cell area with ROCK–
shRNAwas also observed in our recent study of MSC alignment
on nanofibre substrates [19].
Future studies would benefit from investigating the com-
bined effects of fluid flow regimens (shear stress magnitude,
steady versus pulsatile versus oscillatory, frequency, duration,

rsif.royalsocietypublishing.orgJ.R.Soc.Interface
12:2014135
10
on March 3, 2015http://rsif.royalsocietypublishing.org/Downloaded from
rest period, macro flow versus microfluidic flow, two- versus
three-dimensional), the presence of chemoattractants and the
other molecular manipulations (inhibition or overexpression)
on MSC mobility. As discussed above, this will practically
improve strategies of cell injection therapy. Examining the
migration of MSCs under flow on or through biomaterials
would also advance the strategies used in tissue engineering
scaffolds and bioreactors. Definitely in-depth assessment of
intra- and intercellular signalling pathways of the migrating
MSCs owing to flow shear would provide insights into the
cellular migration processes and may reveal therapeutic targets
to manipulate for controlling MSC migration efficiency.
In conclusion, we developed methods for efficiently and
accurately tracking, measuring and processing cell migration
and morphology. The methods built on open source peer-
reviewed software and increased the ease and speed of
processing the results. Using these methods, we found that
flow shear stress level has a significant influence on MSC
migration. The total and RMS displacements, confinement
ratio, motility coefficient, number of cells migrating with
the flow and time of cell migrating with the flow had an
increasing trend with increasing shear stress. Silencing FAK
and ROCK had opposing effects on MSC migration, which
may highlight the unique role of these molecular sensors
each representing focal adhesion and cytoskeletal tension sig-
nalling. MSCs with interfered FAK had decreased motility
coefficient in both static and flow conditions, whereas
ROCK silencing stimulated MSC migration especially under
the flow shear condition. FAK-silencing reduced morphology
adaptation capability while ROCK-silencing did not. A sum-
mary diagram of our findings focusing on migration is
illustrated in figure 6. The results obtained using our tracking
and analysing methods may advance strategies of cell
therapy and tissue engineering.
Funding statement. The authors thank the funding support fromNSF CAREER (1351570), AHA Scientist Development Grant(12SDG12030109), Osteology Foundation Grant (12-006), and NebraskaResearch Initiative (all to JYL).
Competing financial interests. The authors declare no competing financialinterests.
1
References
1. Dittmar T, Entschladen F. 2013 Migratory propertiesof mesenchymal stem cells. In Mesenchymal stemcells: basics and clinical application I (eds B Weyand,M Dominici, R Hass, R Jacobs, C Kasper), pp. 117 –136. Berlin, Germany: Springer.
2. Kang SK, Shin IS, Ko MS, Jo JY, Ra JC. 2012 Journeyof mesenchymal stem cells for homing: strategies toenhance efficacy and safety of stem cell therapy.Stem Cells Int. 2012, 1 – 11. (doi:10.1155/2012/342968)
3. Malek AM, Alper SL, Izumo S. 1999 Hemodynamicshear stress and its role in atherosclerosis. JAMA282, 2035 – 2042. (doi:10.1001/jama.282.21.2035)
4. Zheng W, Xie Y, Zhang W, Wang D, Ma W, Wang Z,Jiang X. 2012 Fluid flow stress induced contractionand re-spread of mesenchymal stem cells: amicrofluidic study. Integr. Biol. 4, 1102 – 1111.(doi:10.1039/C2IB20094E)
5. Chamberlain G, Smith H, Rainger GE, Middleton J.2011 Mesenchymal stem cells exhibit firm adhesion,crawling, spreading and transmigration across aorticendothelial cells: effects of chemokines and shear.PLoS ONE 6, e25663. (doi:10.1371/journal.pone.0025663)
6. Maijenburg MW, van der Schoot CE, Voermans C.2012 Mesenchymal stromal cell migration:possibilities to improve cellular therapy. Stem CellsDev. 21, 19 – 29. (doi:10.1089/scd.2011.0270)
7. Schindelin J et al. 2012 Fiji: an open-sourceplatform for biological-image analysis. Nat. Methods9, 676 – 682. (doi:10.1038/nmeth.2019)
8. Huth J, Buchholz M, Kraus JM, Schmucker M,von Wichert G, Krndija D, Seufferlein T, Gress TM,Kestler HA. 2010 Significantly improved precision ofcell migration analysis in time-lapse videomicroscopy through use of a fully automatedtracking system. BMC Cell Biol. 11, 24. (doi:10.1186/1471-2121-11-24)
9. Jin T. 2013 Gradient sensing during chemotaxis.Curr. Opin. Cell Biol. 25, 532 – 537. (doi:10.1016/j.ceb.2013.06.007)
10. Rodriguez LL, Schneider IC. 2013 Directed cellmigration in multi-cue environments. Integr. Biol. 5,1306 – 1323. (doi:10.1039/C3IB40137E)
11. Riehl BD, Lim JY. 2012 Macro and microfluidic flowsfor skeletal regenerative medicine. Cells 1,1225 – 1245. (doi:10.3390/cells1041225)
12. Tomakidi P, Schulz S, Proksch S, Weber W, SteinbergT. 2014 Focal adhesion kinase (FAK) perspectives inmechanobiology: implications for cell behaviour. CellTissue Res. 357, 515 – 526. (doi:10.1007/s00441-014-1945-2)
13. Peng X, Guan J-L. 2011 Focal adhesion kinase: fromin vitro studies to functional analyses in vivo. Curr.Protein Pept. Sci. 12, 52 – 67. (doi:10.2174/138920311795659452)
14. Golubovskaya VM. 2010 Focal adhesion kinase as acancer therapy target. Anticancer Agents Med.Chem. 10, 735 – 741. (doi:10.2174/187152010794728648)
15. McBeath R, Pirone DM, Nelson CM, Bhadriraju K,Chen CS. 2004 Cell shape, cytoskeletal tension, andRhoA regulate stem cell lineage commitment. Dev.Cell 6, 483 – 495. (doi:10.1016/S1534-5807(04)00075-9)
16. Lin M-N, Shang D-S, Sun W, Li B, Xu X, Fang W-G,Zhao W-D, Cao L, Chen Y-H. 2013 Involvement ofPI3K and ROCK signaling pathways in migration ofbone marrow-derived mesenchymal stem cellsthrough human brain microvascular endothelial cellmonolayers. Brain Res. 1513, 1 – 8. (doi:10.1016/j.brainres.2013.03.035)
17. Leong SY, Faux CH, Turbic A, Dixon KJ, Turnley AM.2011 The Rho kinase pathway regulates mouseadult neural precursor cell migration. Stem CellsDayt. Ohio 29, 332 – 343. (doi:10.1002/stem.577)
18. Lee JS, Ha L, Kwon IK, Lim JY. 2013 The role offocal adhesion kinase in BMP4 induction ofmesenchymal stem cell adipogenesis. Biochem.Biophys. Res. Commun. 435, 696 – 701. (doi:10.1016/j.bbrc.2013.05.045)
19. Andalib MN, Lee JS, Ha L, Dzenis Y, Lim JY. 2013The role of RhoA kinase (ROCK) in cell alignment onnanofibers. Acta Biomater. 9, 7737 – 7745. (doi:10.1016/j.actbio.2013.04.013)
20. Rao DD, Vorhies JS, Senzer N, Nemunaitis J. 2009siRNA vs. shRNA: similarities and differences. Adv.Drug Deliv. Rev. 61, 746 – 759. (doi:10.1016/j.addr.2009.04.004)
21. Sumen C, Mempel TR, Mazo IB, von Andrian UH.2004 Intravital microscopy: visualizing immunity incontext. Immunity 21, 315 – 329. (doi:10.1016/j.immuni.2004.08.006)
22. Cheng Z et al. 2008 Targeted migration ofmesenchymal stem cells modified with CXCR4 geneto infarcted myocardium improves cardiacperformance. Mol. Ther. 16, 571 – 579. (doi:10.1038/sj.mt.6300374)
23. Kumar S, Ponnazhagan S. 2007 Bone homing ofmesenchymal stem cells by ectopic a4 integrinexpression. FASEB J. 21, 3917 – 3927. (doi:10.1096/fj.07-8275com)
24. Ruster B, Gottig S, Ludwig RJ, Bistrian R,Muller S, Seifried E, Gille J, Henschler R. 2006Mesenchymal stem cells display coordinatedrolling and adhesion behavior on endothelial cells.Blood 108, 3938 – 3944. (doi:10.1182/blood-2006-05-025098)
25. Sundd P, Pospieszalska MK, Cheung LS-L,Konstantopoulos K, Ley K. 2011 Biomechanics ofleukocyte rolling. Biorheology 48, 1 – 35. (doi:10.3233/BIR-2011-0579)
26. Polacheck WJ, Charest JL, Kamm RD. 2011Interstitial flow influences direction of tumor cell

rsif.royalsocietypublishing.org
11
on March 3, 2015http://rsif.royalsocietypublishing.org/Downloaded from
migration through competing mechanisms. Proc.Natl Acad. Sci. USA 108, 11 115 – 11 120. (doi:10.1073/pnas.1103581108)
27. Li S, Butler P, Wang Y, Hu Y, Han DC, Usami S,Guan J-L, Chien S. 2002 The role of thedynamics of focal adhesion kinase in themechanotaxis of endothelial cells. Proc. Natl Acad.Sci. USA 99, 3546 – 3551. (doi:10.1073/pnas.052018099)
28. Holle AW, Engler AJ. 2011 More than a feeling:discovering, understanding, and influencing
mechanosensing pathways. Curr. Opin. Biotechnol.22, 648 – 654. (doi:10.1016/j.copbio.2011.04.007)
29. Shum MSY, Pasquier E, Po’uha ST, O’Neill GM,Chaponnier C, Gunning PW, Kavallaris M. 2011g-Actin regulates cell migration and modulates theROCK signaling pathway. FASEB J. 25, 4423 – 4433.(doi:10.1096/fj.11-185447)
30. Biro M, Munoz MA, Weninger W. 2014 TargetingRho-GTPases in immune cell migration andinflammation. Br. J. Pharmacol. 171, 5491 – 5506.(doi:10.1111/bph.12658)
31. Murali A, Rajalingam K. 2014 Small Rho GTPases inthe control of cell shape and mobility. Cell. Mol. LifeSci. 71, 1703 – 1721. (doi:10.1007/s00018-013-1519-6)
32. Sadok A, Marshall CJ. 2014 Rho GTPases.Small GTPases 5, e29710. (doi:10.4161/sgtp.29710)
33. Mierke CT. 2013 The role of focal adhesion kinase inthe regulation of cellular mechanical properties.Phys. Biol. 10, 065005. (doi:10.1088/1478-3975/10/6/065005)
J.
R. Soc.Interface12:20141351

![Kinase switching in mesenchymal-like non-small cell lung cancer … · 2017-08-29 · mesenchymal-like state likely plays a role in the progression of cancer [7, 8] and has been correlated](https://img.pdfslide.net/doc/110x75/5f7bd0b51bdff37ebe662ed8/kinase-switching-in-mesenchymal-like-non-small-cell-lung-cancer-2017-08-29-mesenchymal-like.jpg)