Embed Size (px)
Citation preview

Fluids/Pressors Interactions
Dr. Maurizio Cecconi MD FRCA FICM MD(UK)
Consultant and Honorary Senior Lecturerin Anaesthesia and Intensive Care
St George’s Hospital and Medical School, London, UK

Disclosure
• Edwards Lifescience
• LiDCO
• Cheetah Medical
• Masimo
• Nexfin Bmeye
• Applied Physiology

Fluids/Pressors Interaction
• Guyton and Frank Starling
• CVP and Venous Return
• Venous Return Fluids and Pressors
• Arterial Load

Frank Starling The law of the heart
“The greater the heart muscle is stretched, greater is the force generated and the output from the ventricle.
In practice, within some limits the heart needs to pump all the venous return”

Actin
Myosin
Stroke Volume
Preload
Heart with Preload reserve
Heart with maximum fillingAnd optimal sarcomere lenght
No preload reserve,Heart failure
a
b
cd e
f

Cardiac Output
Afterload
Preload
Contractility SV
Heart Rate

Cardiac OutputVenous Return =
Pms
Resistance
RAP

Filling of Circulation
Resistance to blood
flow
Guyton Theory

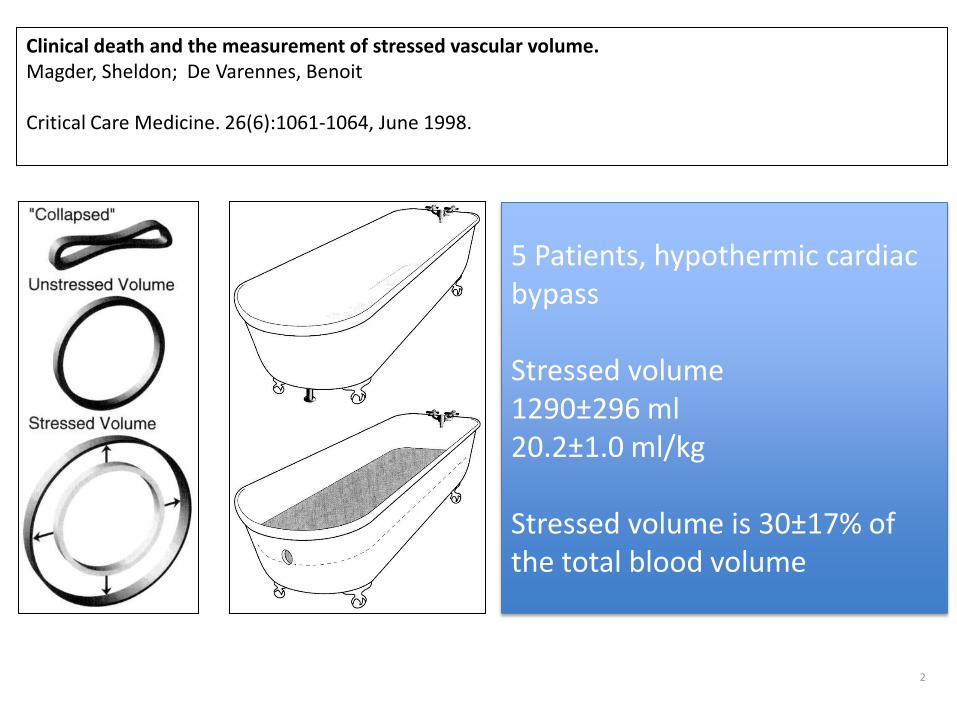
Unstressed Volume
Stressed Volume
No pressure generated
Pressure Generated Pms

UnstressedVolume
Stressed Volume
Mean circulatory filling pressure
Right Atrial Pressure

VR =Pms-RAP
RVR

Pms
The mean systemic filling pressure
(Pms) is the pressure in the whole
vascular system when the heart is
stopped and there is no fluid motion
VR
RAP 0 a b c
Pms a
Pms b
Pms c
Adapted from Guyton Guyton AC. Physiol Rev 1955;35(1):123-9.
2
Clinical death and the measurement of stressed vascular volume.Magder, Sheldon; De Varennes, Benoit
Critical Care Medicine. 26(6):1061-1064, June 1998.
5 Patients, hypothermic cardiac bypass
Stressed volume1290±296 ml20.2±1.0 ml/kg
Stressed volume is 30±17% ofthe total blood volume

Bleeding DecrasedStressed Volume
Fluid Loading
UnstressedVolume
Stressed Volume
UnstressedVolume
Stressed Volume
UnstressedVolume
Stressed Volume

Preload
Stroke Volume
Preload
CVP
CVP / CVP CHANGESPRELOAD AND PRELOAD RESPONSIVENESS


15
10
0
5
-4 0 4 8 12
Right Atrial Pressure (mmHg)
Cardiac Output and
Venous Return(l/min)
IncreasedPms
Venous ReturnCurve
Impaired Cardiac Function Curve
Normal Cardiac Function Curve
Fluid Response

Evaluation of mean systemic filling pressure from pulse contour cardiac output and central venous pressureJacinta J Maas, Bart F Geerts Jos RC Jansen
Clin Monit and Computing 2011 25:193-201
Airway Pressure
CVP (RAP)
CO

Evaluation of mean systemic filling pressure from pulse contour cardiac output and central venous pressureJacinta J Maas, Bart F Geerts Jos RC Jansen
Clin Monit and Computing 2011 25:193-201

Estimation of mean systemic filling pressurein postoperative cardiac surgery patientswith three methodsJacinta J Maas, Michael Pinsky, Bart F Geerts, Rob B Wilde Jos RC Jansen
Intensive Care Medicine 2012
Occlusion

Insufficient volume?
• Case DC9963
• Male 65 y.o.
• 1.77 m 109 Kg
• Admitted to ICU after a MVR and TV
anuloplasty
• 1 Fluid Challenge 20:09:00 10 min
• 2 Fluid Challenge 20:21:00 10 min
• CO monitor• MAP• CVP

Changes in the mean systemic filling pressureduring a fluid challenge in postsurgicalintensive care patients Maurizio Cecconi Hollmann D. Aya Martin Geisen Claudia Ebm Nick Fletcher R. Michael Grounds Andrew Rhodes
Intensive Care Medicine 2013

Pms - RAP Responders
Cecconi et al ICM 2013

Pms - RAP Non Responders
Cecconi et al ICM 2013

35 cm H20
130 mm Hg
5 cm H20
40 mm Hg
Air
way
pre
ssu
reA
rter
ial P
ress
ure
PPmax PPmin
SP max
SP min
SV max SV min
SPV = (SP max – SP min) mmHg
PPV =PPmax – PPmin
Average PPx100
SVV =SVmax – SVmin
Average SVx100

15
10
0
5
-4 0 4 8 12
Right Atrial Pressure (mmHg)
Cardiac Output and
Venous Return(l/min)
Increased Resistance
VR =Pms-RAP
RVR
Resistance

Sepsisdecreased
ToneFluid Loading
UnstressedVolume
Stressed Volume
UnstressedVolume
Stressed Volume
UnstressedVolume
Stressed Volume
Fluid Loading and Pressors

15
10
0
5
Right Atrial Pressure (mmHg)
Cardiac Output and
Venous Return(l/min)
Venous ReturnCurve
CO Increase and Pressors
Stressed Volume Effect
+ Resistance Effect

Stressed Volume Effect
+ Resistance Effect
Maas J et al Crit Care Med 2013

15
10
0
5
Right Atrial Pressure (mmHg)
Cardiac Output and
Venous Return(l/min)
Stressed Volume Effect
+ Resistance Effect
+ heart performance effect
CO Decrease and Pressors

Stressed Volume Effect
+ Resistance Effect
+ heart performance effect
Maas J et al Crit Care Med 2013

15
10
0
5
-4 0 4 8 12
Right Atrial Pressure (mmHg)
Cardiac Output and
Venous Return(l/min)
Combined effect depends on:
Filling/Stressed Volume
ResistenceCardiac Function

Pinsky Functional Hemodynamic Monitoring 2005

FLOW
PRESSURE
STATIC ASSESSMENT OF ARTERIAL LOAD
TSVR = MAP / COC = SV / PPEa = 0.9SAP / SV
CO or SV
MAP
PP
0.9SAP

FLOW
PRESSURE
DYNAMIC ASSESSMENT OF ARTERIAL LOAD
SVV
PPV
Eadyn = PPV / SVV
Monge et al ESICM Paris 2013

AUC SE a 95% CI b
Eadyn 0.94 0.03 0.86 to 0.98
EA 0.50 0.06 0.39 to 0.61
Arterial C 0.54 0.06 0.43 to 0.65
TSVR 0.52 0.06 0.41 to 0.64
Preinfusion MAP 0.59 0.06 0.48 to 0.70
SAMPLE SIZE82 FLUID CHALLENGES
MAP-RESPONDERS 36 fc (44%)
MAP-NONRESPONDERS 46 fc. (56%)
ROC CURVES COMPARISONS FOR ARTERIAL PRESSURE PREDICTIONAFTER FLUID ADMINISTRATION
Monge et al ESICM Paris 2013

Pinsky Functional Hemodynamic Monitoring 2005
Fluids First
PressorNeeded
Fluids and Pressors

Conclusion
• We use Frank Starling and Guyton principles every time we do haemodynamic interventions
• Using both gives us better understanding of changes in:
– CO
– CVP
– Fluid Challenge
– Pressors


![Septic Shock [EDocFind.com]](https://img.pdfslide.net/doc/110x75/55cf8fb1550346703b9edc7d/septic-shock-edocfindcom.jpg)