Embed Size (px)
Citation preview

Fluorogenic Green-Inside Red-Outside (GIRO) Labeling ApproachReveals Adenylyl Cyclase-Dependent Control of BKα SurfaceExpressionChristopher P. Pratt,†,§,# Jianjun He,‡,§ Yi Wang,†,§ Alison L. Barth,†,# and Marcel P. Bruchez*,†,‡,§
†Department of Biological Sciences, ‡Department of Chemistry, §Molecular Biosensor and Imaging Center, and #Center for theNeural Basis of Cognition, Carnegie Mellon University, 4400 Fifth Avenue, Pittsburgh, Pennsylvania 15213, United States
*S Supporting Information
ABSTRACT: The regulation of surface levels of protein iscritical for proper cell function and influences propertiesincluding cell adhesion, ion channel contributions to currentflux, and the sensitivity of surface receptors to ligands. Here wedemonstrate a two-color labeling system in live cells using asingle fluorogen activating peptide (FAP) based fusion tag,which enables the rapid and simultaneous quantification ofsurface and internal proteins. In the nervous system, BKchannels can regulate neural excitability and neurotransmitterrelease, and the surface trafficking of BK channels can bemodulated by signaling cascades and assembly with accessoryproteins. Using this labeling approach, we examine thedynamics of BK channel surface expression in HEK293 cells.Surface pools of the pore-forming BKα subunit were stable, exhibiting a plasma membrane half-life of >10 h. Long-termactivation of adenylyl cyclase by forskolin reduced BKα surface levels by 30%, an effect that could not be attributed to increasedbulk endocytosis of plasma membrane proteins. This labeling approach is compatible with microscopic imaging and flowcytometry, providing a solid platform for examining protein trafficking in living cells.
■ INTRODUCTIONProtein trafficking is tightly regulated in all cells and mediatesimportant functions such as receptor signaling, cell−cellcontacts, cell adhesion, nutrient uptake, and membraneexcitability. For excitable cells, channel distribution at theplasma membrane (PM) can strongly influence membranepotential and stimulus−response coupling.1 Analysis of proteinsurface expression is limited by cumbersome techniques,including biotinylation of surface proteins, immunofluorescenceusing ectofacial epitopes, and the use of pH-dependentfluorophores. Similarly, real-time dynamics of surface proteintrafficking have been difficult to visualize due to the time scalesrequired for these experiments. Biotinylation is useful tomeasure population surface protein levels, but cannot labelintracellular stores. While immunofluorescence can beemployed to quantify surface fraction of a protein, labeling inthis manner employs subsequent permeabilization and stainingsteps, requiring cell fixation. Although pH-dependent fluo-rophores such as pHluorin2 are useful for imaging surfaceproteins in live cells, whole cell quantification is obscured byfluorescence from neutral intracellular compartments such asendoplasmic reticulum (ER),3 and detection of proteincontained within acidic compartments requires alkalineunmasking steps. Surface levels of protein are influenced by anumber of cellular mechanisms including changes in geneexpression, protein synthesis, trafficking, and degradation. We
sought to create a method that enables quantitation of surfaceand internal protein levels that could be used to characterizethese dynamic processes.The large conductance, voltage- and calcium-activated
potassium (BK) channel, (KCNMA1/Maxi-K/Slo1), requiresboth depolarization and increases in intracellular Ca2+ forchannel opening.4,5 BK channels regulate membrane potentialand excitability in multiple cell types, notably in neurons andvascular smooth muscle.6−13 The diversity of BK channelproperties in different tissues is driven by extensive alternativesplicing of the pore-forming α subunit, which then exhibitsvaried degrees of surface localization and voltage gat-ing.9,12,14−17 In addition, the tetrameric BKα complex associateswith various tissue and cell-type specific β subunits that controlchannel currents and subcellular localization.6,7,9,16,18−21
Post-translational modifications to the α subunit, includingphosphorylation and palmitoylation, can exert robust and rapidchanges in channel function, effects that are isoform depend-ent.22,23 For example, phosphorylation of BKα by proteinkinase A (PKA) promotes BK channel opening for some spliceisoforms but not others.23−27 Multiple kinases, including PKA,cyclic GMP-dependent protein kinase (PKG), and protein
Received: July 22, 2015Revised: August 18, 2015Published: August 24, 2015
Article
pubs.acs.org/bc
© 2015 American Chemical Society 1963 DOI: 10.1021/acs.bioconjchem.5b00409Bioconjugate Chem. 2015, 26, 1963−1971
This is an open access article published under an ACS AuthorChoice License, which permitscopying and redistribution of the article or any adaptations for non-commercial purposes.

kinase C (PKC), can regulate BK channel currents.26,28−30
Although the biophysical effects of BK channel phosphorylationhave been extensively investigated, the regulation of BKchannel trafficking to the PM has been relatively ignored.Whole-cell BK channel currents are determined in part by thePM localization of the channel,15,31,32 a point that is especiallyrelevant to pathological alterations in BK channel function inepilepsy,6,11,33 hypertension, and bladder dysfunction.8,28 Whilemodulation of channel opening can induce a rapid andreversible change in cell excitability, alterations in BK channeltrafficking and localization could underlie long-lasting changesin cell activity, especially relevant to the development andprogression of disease states.6,11,20 Our motivation to determineif intracellular signaling modifies BKα trafficking to increase ordecrease surface expression calls for a new quantitativetechnique.Here we demonstrate a novel method for the rapid and
simultaneous detection of both surface and internal protein inliving cells using fluorogen-activating peptides (FAPs). Usingthe previously established dL5** FAP,34 we generated an N-terminal, FAP-BKα fusion construct, where the FAP is localizedon the extracellular portion of the channel. We synthesized anovel, cell-permeable, rapidly activated, and highly fluorogenicdye (4-{[Bis(4-dimethylamino-phenyl)-methylene]-amino}-bu-tyric acid ethyl ester; MHN-ester) that produces an activatedfluorescence spectra similar to GFP when bound by FAP. Incombination with a malachite green (MG)-based fluorogenemitting in the far-red spectral range,34,35 this enablessimultaneous detection of two subpopulations of FAP depend-ing on bound dye. When MHN-ester is used together with acell-impermeable MG, extra- and intracellular stores of theFAP-BKα channel can be distinguished, effectively producing asystem for green-inside red-outside (GIRO) labeling in livingcells. This labeling qualitatively recapitulates surface andinternal labeling by immunofluorescence methods, but isperformed in live cells to monitor real-time changes in proteindistribution, is highly quantitative (since each FAP binds asingle dye molecule), and takes minutes rather than hours. Weused GIRO labeling to reveal the dynamics of BKα PMresidency. We found that the rate of surface turnover of BKαexpressed in HEK293 cells is slow, and that chronic adenylylcyclase (AC) activation can preferentially reduce the surfacelevels of BKα. These results suggest a cellular mechanism bywhich intracellular signaling cascades can alter the abundance ofsurface BK channels, a route for modifying neural excitability.
■ RESULTS AND DISCUSSIONThe FAP system is uniquely suited to studying trafficking;fluorescent signals are generated based on the specificinteraction of the dye-binding peptide and fluorogendyes.34,35 Chemical modifications to the dye can limit itsaccess to the FAP, producing spatially constrained fluorescenceactivation, such as at the cell surface.36−38 Because thechromophore is formed by the fluorogen dye, generation ofalternative dyes which are bound by the same FAP enables thecontrol of fluorescent colors based on which dyes are used.39
By combining this color-selection with control of cellpermeability, we aimed to develop a method to label surfaceand internal protein pools with simultaneous detection using apair of fluorogen dyes, one designed to be cell-impermeable,thus only labeling cell-surface FAP, and a second, spectrallydistinct, cell-permeable dye that would be bound at theremaining intracellular sites (Figure 1A).
We have previously characterized a cell-excluded MG-derivative (2-({4-[(2,5-dioxopyrrolidin-1-yl)oxy]-4-oxobutanoyl}amino)ethanesulfonate; MG-BTau) to label sur-face-exposed FAP.38 For a spectrally distinct counterpart, wedeveloped the novel cell-permeable dye, MHN-Ester (Figure1B,C). Both dyes are nonfluorescent in solution, but producespectrally distinct absorption and emission when bound to theFAP (Table 1 and Figure S.1A), allowing for simultaneousdetection of different protein populations. In all cases, the FAPused was dL5**, a tandem dimer of L5 originally developed asa tight binder and activator of MG;34,35 this results in acomplete high-affinity (Kd = 18 pM) dye-binding moduleexpressed as a single fusion peptide. MHN-Ester was designedto exploit the binding properties of dL5** identified from theL5+MG crystal structure.34 MHN-Ester is prepared from afour-step synthesis (Figure 1C). Purified FAP tightly bindsMHN-Ester in solution, with a measured dissociation constantof 42.5 ± 5.7 pM (Table 1 and Figure S.1B). The quantumyield for the activated fluorogen complex was determined to be0.30 (Table 1 and Figure S.1C). Cell-permeable ester dyesshowed proper intracellular accessibility at concentrationsbelow 1 μM, while sulfonated analogs were cell-excluded(Figure S.2).
Design and Validation of FAP-BKα. FAP was fused to theextracellular N-terminus of the ZERO isoform of BKα, allowingFAP access to the extracellular environment (Figure 2A). An
Figure 1. Design of green-inside red-outside (GIRO) labeling (A)schematized paradigm for dye additions. MG-BTau is added first tolabel surface-exposed FAP; MHN-Ester is then added to label allremaining sites to produce a surface-red internal-green fluorescentsignal pattern. (B) Schematic of dL5** FAP, cell excluded MG-BTau,and cell permeable MHN-Ester. Structure shown is dimer of L5**FAP,33 dL5** is formed by addition of a G4S peptide linker. (C)Condensed schematic of MHN-Ester synthesis (see SupportingInformation for detailed synthesis).
Bioconjugate Chemistry Article
DOI: 10.1021/acs.bioconjchem.5b00409Bioconjugate Chem. 2015, 26, 1963−1971
1964

HA tag was included at the very N-terminus of the FAP forimmunohistochemical verification, since there are no antibodiesagainst either the FAP or extracellular BKα epitopes. HEK293cells stably expressing FAP-BKα were established. Sequentialdye addition provided optimal quantitative labeling of surfaceand internal proteins. MG-BTau (300 nM) was added first inorder to saturate surface-exposed FAP. After a 5 minincubation, MHN-Ester (300 nM) was added to occupy all
unbound sites. With its low Kd and slow off-rate,38 MG-BTaulabeling is effectively irreversible over these short experimentaltime scales. We identified no measurable displacement ofcomplexed MG-BTau by MHN-Ester either microscopically orin suspension measured by flow cytometry (Figure S.3), evenafter washing. These features of the fluorogen+FAP complexesenabled the design of a surface and internal dual-sensor.A clear advantage of the FAP system is that unbound dye
remains nonfluorescent in solution, allowing for the simpleaddition of dyes to the cellular media without any need forfixation or washout, and enabling live-cell imaging.35 This canbe compared to the traditional method of using immuno-fluorescence against an ectofacial epitope in nonpermeabilizedcells. Immunofluorescence using an anti-BKα antibody showedsimilar localization for FAP-BKα and untagged BKα transfectedinto HEK-293 cells (Figure S.4), suggesting that the addition ofthe FAP tag does not measurably disrupt BKα trafficking. Instably transfected FAP-BKα cells, HA-immunofluorescencewithout permeabilization resulted in a strong PM signal witha distinct restriction to the cell surface (Figure 2B). Subsequentstaining following permeabilization revealed clear internallocalization. This labeling process took approximately 8 h toperform. In contrast, sequential labeling with MG-BTau andMHN-Ester can be complete in as little as 7 min and similarlyshowed visible segregation of surface and internal signals(Figure 2C). Profile plots were drawn from the center of thenucleus to the outside edge of the PM along the longest axis.Because cells are not uniform in size or shape, and fixed cellstend to be wider due to the mounting process, distance wasnormalized (Figure 2D,E). We found that surface and internallabeling by immunofluorescence or GIRO yielded similardistributions for surface and internal channels. Interestingly,GIRO labeling exhibited lower intracellular backgroundcompared to immunostaining as shown by the magnitude ofsignal to the left of the peaks; this is potentially a result offlattening of the cells and a limited degree of membranepermeability conferred by fixation and coverslip mounting.Thus, MG-BTau successfully labels the cell-surface FAP whileMHN-Ester labels internal protein; both channels can bequantified simultaneously with clear spectral discrimination.GIRO labeling recapitulates established antibody methods withthe distinct advantages of being more rapid with lowerbackground and applicable to live cells.
Dye Properties and Activation in Flow Cytometry. TheGIRO labeling system functions as a “smart-probe” distinguish-ing and reporting protein localization simply based on color inlive cells. In this way, we can quantify levels of surface protein,internal protein, and use the ratio of surface to internal signal togenerate a measure of relative surface expression (RSE). Flowcytometry presents an advantageous application of this system,as it is significantly higher throughput and more unbiased thanregion-of-interest selection or cell segmentation in microscopy.We confirmed specific binding using whole-cell fluorescence by
Table 1. Properties of dL5** FAP Fluorogen Activationa
λmax λex λem εmax Φ εB/εFb ΦB/ΦF ARc KD
MHN-Ester 422 (422) (488) 5.9 × 10⁴ 4.2 × 10⁻⁴ 12 710 8520 42.5MHN-Ester/dL5** 456 456 532 6.4 × 10⁴ 0.3MG-BTau 606 (606) (636) 9.1 × 10⁴ 9.5 × 10⁻⁵ 3.5 2010 7035 18MG-BTau/dL5** 633 633 668 1.1 × 10⁵ 0.19
aUnits: λ, nm; ε, M−1 cm−1; KD, pM. bεB and εF: Extinction coefficients of free and bound dye at microscopy excitation wavelength (488 and 640 nmfor MHN-ester and MG-BTau respectively). cActivation Ratio: (εB/εF) × (ΦB/ΦF).
Figure 2. GIRO labeling recapitulates immunofluorescence methods.(A) Schematic of FAP-BKα construct showing protein topology andDNA configuration. An HA tag is included at the very N-terminus ofFAP-BKα. (B) Immunofluorescence against HA without (red) andwith (green) permeabilization to label surface and internal protein,respectively. (C) Live cells labeled with MG-BTau (red) and MHN-Ester (green) to label surface and internal protein in FAP-BKαexpressing live cells. (D) Normalized profile plot for fixed cellsquantified from nucleus to cell periphery (distance 0.0 corresponds tonuclear center; 1.0 is just beyond PM). Peak intensities are at 0.42 forinternal and 0.81 for surface labeling. (E) Cumulative profile plots fordye-labeled live cells. Peak intensities are at 0.44 for internal and 0.82for surface labeling. Profile plot distance bins are average pixel values. n= 25 cells from 3 experiments for each condition. Scale bars = 40 μm.
Bioconjugate Chemistry Article
DOI: 10.1021/acs.bioconjchem.5b00409Bioconjugate Chem. 2015, 26, 1963−1971
1965

flow cytometry. By measuring MHN-Ester fluorescenceintensity in cells through a range of concentrations from 5pM to 600 nM, we found a labeling Keff of 7.62 (±0.82) nM(Figure S.5A), with saturating levels below 300 nM. We optedto use 300 nM MHN-Ester in experiments since this saturatessignal without unnecessary contribution to nonspecific back-ground (Figure S.5B). Next, in order to optimize our labelingparadigm for flow cytometry, we characterized the rates of dyeactivation and saturation using flow-cytometric timecoursemeasurements. MHN-Ester binding saturates rapidly, reachinga plateau in less than 2 min (Figure 3A). Application of MG-
BTau prior to MHN-Ester addition causes a roughly 6%decrease in maximum MHN-ester intensity (Figure 3B)demonstrating that the MG-BTau labeled population reducesavailable sites for MHN-ester binding and that the majority ofFAP-BKα is internal. The tetrameric BKα subunit contains 4FAP molecules each of which can independently bind only onemolecule of dye. This consistent labeling stoichiometry enablesreliable quantitation not possible with standard immunofluor-escence, which can vary in the number of bound antibodies andfluorophores per antibody.Disruption of Global Trafficking Pathways Alters
Relative Surface Expression. To validate the response ofthe two-color labeling system, cellular trafficking pathways werepharmacologically suppressed to observe changes in surface andinternal labeling in FAP-BKα expressing cells. This approachvalidates the sensitivity of this labeling approach to subtlechanges in protein distribution, and establishes the lifetime of
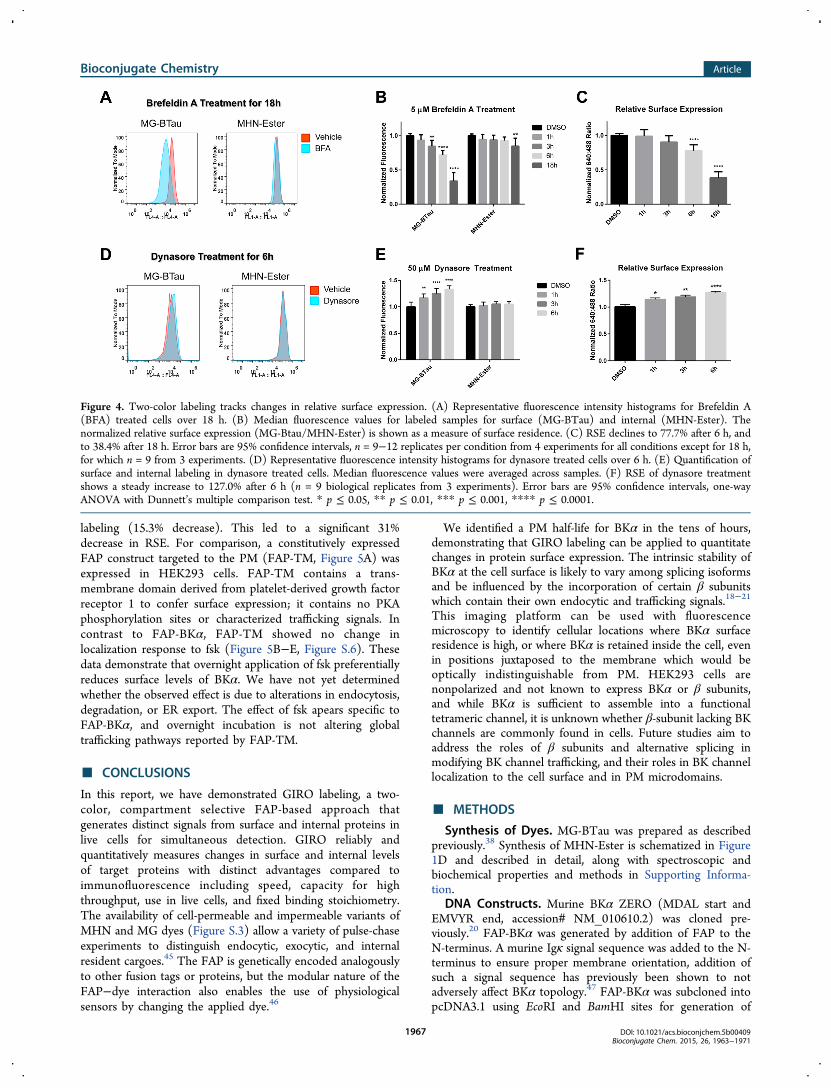
BKα at the cell surface, which has not previously beencharacterized. These experiments were carried out in stablytransfected HEK293 cells, due to their lack of endogenous BKαor β subunits, which can alter trafficking.14,15,18−20,40 Toconfirm that changes in trafficking can be monitored usingGIRO labeling, forward trafficking was blocked with the ER-export inhibitor brefeldin A (BFA; 5 μM), allowing measure-ment of the removal of channels from the PM over time.Representative flow cytometry histograms from BFA-treated,FAP-BKα-expressing cells show a large fluorescence reductionfrom surface MG-BTau emission, with a comparatively meagerreduction in the MHN-Ester signal after 18 h BFA treatment(Figure 4A). Quantification of median surface MG-BTau signalshows a continuous decrease over time from 1 to 18 h (Figure4B), with significant effects appearing at 3 h. In the same cells,internal signal from MHN-Ester labeling showed a minimalchange. A statistically significant reduction in internal labeling isobservable after 18 h, possibly due to diversion of BKα todegradation pathways with this extended blockade of ERexport. By taking the relative ratio of median surface andinternal signal, a significant 22.3% reduction in RSE wasobserved after 6 h. At 18 h, RSE was reduced by 71.6%compared to vehicle-treated control cells (Figure 4C). Weconclude that FAP-BKα turnover in HEK293 cells is slow, witha PM residency half-time in the tens of hours.We next analyzed delivery to the PM by blocking endocytosis
(and hence removal from the PM) with the dynamin 1/2inhibitor dynasore. Dynasore (50 μM) was applied for 1, 3, and6 h. Representative histograms of fluorescence intensity (Figure4D) at 6 h show an increase in surface MG-BTau fluorescencebut not in MHN-ester fluorescence (Figure 4E). We observed asteady and significant increase in RSE over time; with asignificant 27.0% increase after 6 h (Figure 4F). This increase insurface levels induced by dynasore appears to be in equilibriumwith the measured decrease in BFA treated cells. Takentogether, BKα delivery and removal from the cell surface inthese stable cells appears to be in equilibrium, and GIROlabeling has sufficient precision to detect these changes.
Forskolin (Fsk) Reduces BKα Surface Expression. In thebrain, AC acts as a signaling nexus for neuromodulators, criticalin effecting synaptic plasticity by activation of downstreamsignaling targets. One such target, PKA, is well-characterized inregulating the biophysical properties of BK chan-nels.23,25−27,29,30,41 Phosphorylation-dependent modificationof channel opening properties provides short- to medium-term regulation of BK currents, readily reversed byphosphatases. Longer-term regulation of cellular BK channelcurrents could involve reduction or enhancement of channeldensity at the PM, and changes in overall expression level of thechannel. Given PKA’s established interactions with the BKα C-terminal domain and its known involvement in trafficking ofreceptors and other ion channels,42−44 we decided to examinethe effect of AC activation on surface expression of FAP-BKαby overnight treatment with 25 μM fsk.Examination of FAP-BKα expressing cells qualitatively by
microscopy (Figure 5A) and quantitatively by flow cytometry(Figure 5B) showed a substantial and significant decrease in cellsurface labeling accompanied by a meager reduction in internallabeling after fsk treatment. Indeed, quantification of medianfluorescence in flow cytometry (Figure 5C−E) showed a 38%decrease in surface labeling compared to vehicle-treated controlsamples. Internal labeling of FAP-BKα was also significantlydecreased, but this decrease was to a lesser extent than surface
Figure 3. MHN-Ester addition to FAP-BKα expressing cells showsrapid fluorescence activation. (A) MHN-Ester activation rate wasmeasured by flow cytometry. Representative smoothed curves showrapid activation and signal saturation within 2 min of dye addition. Asmall decrease in MHN-Ester signal as a result of MG-BTauprecomplexing is evident. (B) Quantification of end point MHN-Ester signal with and without precomplexing of MG-BTau, showing asmall but statistically significant decrease in saturation level signal (3experiments for each condition, ** p ≤ 0.01, Student’s t test withWelch’s correction).
Bioconjugate Chemistry Article
DOI: 10.1021/acs.bioconjchem.5b00409Bioconjugate Chem. 2015, 26, 1963−1971
1966
labeling (15.3% decrease). This led to a significant 31%decrease in RSE. For comparison, a constitutively expressedFAP construct targeted to the PM (FAP-TM, Figure 5A) wasexpressed in HEK293 cells. FAP-TM contains a trans-membrane domain derived from platelet-derived growth factorreceptor 1 to confer surface expression; it contains no PKAphosphorylation sites or characterized trafficking signals. Incontrast to FAP-BKα, FAP-TM showed no change inlocalization response to fsk (Figure 5B−E, Figure S.6). Thesedata demonstrate that overnight application of fsk preferentiallyreduces surface levels of BKα. We have not yet determinedwhether the observed effect is due to alterations in endocytosis,degradation, or ER export. The effect of fsk apears specific toFAP-BKα, and overnight incubation is not altering globaltrafficking pathways reported by FAP-TM.
■ CONCLUSIONS
In this report, we have demonstrated GIRO labeling, a two-color, compartment selective FAP-based approach thatgenerates distinct signals from surface and internal proteins inlive cells for simultaneous detection. GIRO reliably andquantitatively measures changes in surface and internal levelsof target proteins with distinct advantages compared toimmunofluorescence including speed, capacity for highthroughput, use in live cells, and fixed binding stoichiometry.The availability of cell-permeable and impermeable variants ofMHN and MG dyes (Figure S.3) allow a variety of pulse-chaseexperiments to distinguish endocytic, exocytic, and internalresident cargoes.45 The FAP is genetically encoded analogouslyto other fusion tags or proteins, but the modular nature of theFAP−dye interaction also enables the use of physiologicalsensors by changing the applied dye.46
We identified a PM half-life for BKα in the tens of hours,demonstrating that GIRO labeling can be applied to quantitatechanges in protein surface expression. The intrinsic stability ofBKα at the cell surface is likely to vary among splicing isoformsand be influenced by the incorporation of certain β subunitswhich contain their own endocytic and trafficking signals.18−21
This imaging platform can be used with fluorescencemicroscopy to identify cellular locations where BKα surfaceresidence is high, or where BKα is retained inside the cell, evenin positions juxtaposed to the membrane which would beoptically indistinguishable from PM. HEK293 cells arenonpolarized and not known to express BKα or β subunits,and while BKα is sufficient to assemble into a functionaltetrameric channel, it is unknown whether β-subunit lacking BKchannels are commonly found in cells. Future studies aim toaddress the roles of β subunits and alternative splicing inmodifying BK channel trafficking, and their roles in BK channellocalization to the cell surface and in PM microdomains.
■ METHODS
Synthesis of Dyes. MG-BTau was prepared as describedpreviously.38 Synthesis of MHN-Ester is schematized in Figure1D and described in detail, along with spectroscopic andbiochemical properties and methods in Supporting Informa-tion.
DNA Constructs. Murine BKα ZERO (MDAL start andEMVYR end, accession# NM_010610.2) was cloned pre-viously.20 FAP-BKα was generated by addition of FAP to theN-terminus. A murine Igκ signal sequence was added to the N-terminus to ensure proper membrane orientation, addition ofsuch a signal sequence has previously been shown to notadversely affect BKα topology.47 FAP-BKα was subcloned intopcDNA3.1 using EcoRI and BamHI sites for generation of
Figure 4. Two-color labeling tracks changes in relative surface expression. (A) Representative fluorescence intensity histograms for Brefeldin A(BFA) treated cells over 18 h. (B) Median fluorescence values for labeled samples for surface (MG-BTau) and internal (MHN-Ester). Thenormalized relative surface expression (MG-Btau/MHN-Ester) is shown as a measure of surface residence. (C) RSE declines to 77.7% after 6 h, andto 38.4% after 18 h. Error bars are 95% confidence intervals, n = 9−12 replicates per condition from 4 experiments for all conditions except for 18 h,for which n = 9 from 3 experiments. (D) Representative fluorescence intensity histograms for dynasore treated cells over 6 h. (E) Quantification ofsurface and internal labeling in dynasore treated cells. Median fluorescence values were averaged across samples. (F) RSE of dynasore treatmentshows a steady increase to 127.0% after 6 h (n = 9 biological replicates from 3 experiments). Error bars are 95% confidence intervals, one-wayANOVA with Dunnett’s multiple comparison test. * p ≤ 0.05, ** p ≤ 0.01, *** p ≤ 0.001, **** p ≤ 0.0001.
Bioconjugate Chemistry Article
DOI: 10.1021/acs.bioconjchem.5b00409Bioconjugate Chem. 2015, 26, 1963−1971
1967

stable cells (see Supporting Information). FAP-TM wasgenerated by the addition of a PDGFR1 transmembranedomain to dL5** in a pBabe backbone.Cell Lines and Culture. HEK293 cells were maintained in
Dulbecco’s modified eagle medium (DMEM) supplementedwith 10% fetal bovine serum. Stable HEK293 cells expressingFAP-BKα were generated by transfection of PacI linearizedpcDNA3.1 encoding FAP-BKα. Cells were selected for 1 weekwith 1 μg/mL G418. Selected cells were subjected to tworounds of fluorescence-activated cell sorting (FACS) afterlabeling with cell-permeant MG-Ester. Single cells were sortedinto wells of a 96-well plate to generate clonal lines. Cloneswere identified by MG-ester fluorescence, and two clones withdifferent expression levels were selected for use in experiments;these clones had distinct baseline GIRO profiles (Figure S.7A).Polyclonal cells stably expressing FAP-TM were generated bytransfection of FAP-TM and selection with 2 μg/mLpuromycin. The dynamin 1/2 inhibitor dynasore, the ER-Golgi trafficking inhibitor brefeldin A, and adenylyl cyclaseactivator forskolin were acquired from Cayman Chemical Corp(Ann Arbor, Michigan). Dynasore was prepared as a 50 mMstock in DMSO and aliquotted. Brefeldin A was prepared as a 5
mM stock in DMSO, Forskolin was prepared as 50 mM stockin DMSO. Cells were deprived of serum for 2 h beforedynasore treatment. Cells were treated with inhibitors for theindicated times (1−18 h), with equivalent volumes of DMSOas vehicle control.
Immunofluorescence. Antibodies against the HA epitopewere acquired from Abcam (clone HA.C5, www.abcam.com,Cambridge, MA), Anti-BKα (clone L6/60) monoclonalantibodies were acquired from NeuroMab (http://neuromab.ucdavis.edu/). Anti-HA was used for surface/total labeling ofFAP-BKα due to the ectofacial HA epitope. Cells were seededon 25 mm coverslips (Corning). Cells were fixed in 4%paraformaldehyde (Electron Microscopy Sciences, www.emsdiasum.com) for 10 min and washed twice in PBS. Cellswere permeabilized as needed with 0.5% Triton-X for 5 min;blocking was done by adding PBS containing 10% fetal bovineserum for 20 min. Anti-HA antibody was applied at a dilutionof 1:1000 for 1 h at room temperature. Anti-BKα antibody wasapplied at a dilution of 1:250−1:500 for 4 h at roomtemperature. After primary antibody incubation, coverslipswere washed three times with PBS. Alexa 568 or Alexa 488conjugated anti-mouse secondary antibody was applied at a
Figure 5. Overnight forskolin application reduces surface level of FAP-BKα. (A) Representative microscope images of FAP-BKα stable cells treatedwith 25 μM forskolin or 0.1% DMSO overnight. FAP-TM expression is shown below; note the high surface expression without substantial internallabeling. Scale bars are 40 μm. (B) Representative flow cytometry histograms of FAP-BKα and FAP-TM surface and internal labeling with overnightfsk treatment. Nonexpressing cells run with dyes were used as a background control. Note the relative lack of MHN-Ester labeling in FAP-TM cellscompared to FAP-BKα. (C) Quantification of median surface fluorescence for FAP-BKα and FAP-TM with fsk treatment (FAP-BKα = 62.9% ofcontrol, FAP-TM = 96.6% of control). (D) Median internal fluorescence for FAP-BKα and FAP-TM with fsk treatment (FAP-BKα = 89.2% ofcontrol, FAP-TM = 98.2% of control). (E) RSE for FAP-BKα and FAP-TM (FAP-BKα = 70.4% of control, FAP-TM = 97.9% of control). Sampleswere normalized to DMSO intensity for each experiment. n = 19 biological replicates from 7 experiments for FAP-BKα. n = 9 biological replicatesfrom 3 experiments for FAP-TM. RSE was determined by (median MG-BTau)/(median MHN-Ester) for each sample. Error bars are ±95%confidence intervals. Significance was determined by Student’s t test with Welch’s correction. Significant p-values are shown.
Bioconjugate Chemistry Article
DOI: 10.1021/acs.bioconjchem.5b00409Bioconjugate Chem. 2015, 26, 1963−1971
1968
1:500 dilution for 1 h at room temperature. For surface andtotal labeling against HA, this process was done once withpermeabilization omitted, then repeated with permeabilizationand a different color secondary. Coverslips were mounted ontoslides using a homemade poly(vinyl alcohol)-based mountingmedia. HA slides were imaged on a Nikon spinning diskconfocal microscope (Andor Technologies) using a 40× NikonPlan Fluor objective (NA 1.30) with oil immersion, BKαimmunostained slides were imaged on a Zeiss LSM 510 using aZeiss Plan-Neofluar 40× objective (NA 1.30).Live Cell Imaging. Live cells were seeded in 35 mm glass-
bottom dishes (MatTek corporation). Prior to imaging, mediawas switched to Fluorobrite DMEM (Life Technologies).Images were acquired prior to dye addition to assess cellularautofluorescence. MG-BTau was added directly to cell media toa final concentration of 300 nM. After 5 min, MHN-Ester wasadded to the cellular media to a final concentration of 300 nM.Cells were imaged using a Nikon spinning disk confocalmicroscope (Andor Technology) using a Zeiss Plan Fluorobjective (NA 1.30) with oil immersion.Quantification of Localization. Profile plots were drawn
from the center of the nucleus to the PM of fixed and live cellsalong the longest axis in order to include perinuclear andendoplasmic reticulum staining (n = 25 cells from 3experiments for each condition). Nuclear center was identifiedin fixed cells by Hoechst staining and in live cells by BKαnuclear exclusion. Pixel values were measured using ImageJ(NIH). Profile plots were processed using a custom Pythonscript in which distance was normalized by aggregating meanpixel values into 40 distance bins.Flow Cytometry and RSE Measurement. Cells were
grown and treated with drugs in 12-well plates (Greiner).Adherent cells were labeled at room temperature for 5 min byaddition of MG-BTau directly to cell media to a concentrationof 300 nM. After the 5 min incubation, all media was aspiratedand cells were moved to ice and detached using cold PBScontaining 4 mM EDTA. Single-cell suspensions weregenerated by vigorous pipetting and cells were moved toround-bottom 96-well plates (Greiner) for flow cytometry.MHN-Ester was added to all wells to a final concentration of300 nM 5 min prior to flow cytometry initiation. Live cells wereanalyzed using an Accuri C6 cell analyzer with Intellicyte platesampler attachment. Populations for analysis were selected byforward and side scatter; MG-BTau fluorescence (FL4-Achannel, 640 nm excitation, 675/30 nm emission filter) andMHN-Ester fluorescence (FL1-A channel, 488 nm excitation,525/15 nm emission filter) values were collected and analyzedusing FlowJo (FlowJo LLC). RSE was determined by (MedianMG-BTau)/(Median MHN-Ester). Due to potential variabilityin instrument sensitivity from day to day as well as differencesexpression between clones, all experiments were normalized tocontemporaneous vehicle controls. Data from clones were thusnormalized and pooled, as both clones responded similarly todrug treatments (Figure S7.B). This particular protocol waschosen for ease of labeling surface proteins without removingdrug treatments; however, similar results were obtained if cellswere detached and suspended, followed by sequential additionof dyes prior to analysis without any washing steps. This maynot hold true for more rapidly recycling proteins.Measurement of Dye Activation Rate in Cells. Dye
activation was measured using flow cytometry. Cells wereprepared by detachment with cold PBS containing 8 mMEDTA and moved to 1.5 mL microcentrifuge tubes. Flow
cytometry was initiated at a flow rate of 40 μL/min. After 1 minof run, a 10× concentrate of the requisite dye was added duringcontinuous sampling to produce the 300 μM final concen-tration. Events were discretized into 0.1-s time bins, each bincontaining 100−200 cells. Mean fluorescence intensities pertime bin were quantified using Python 3.2. Nearest neighborsmoothing was performed using GraphPad Prism (20neighbors on each side to obtain a 4 s moving average,second-order polynomial fit) to generate plots of mean cellfluorescence vs time.
■ ASSOCIATED CONTENT
*S Supporting InformationThe Supporting Information is available free of charge on theACS Publications website at DOI: 10.1021/acs.bioconj-chem.5b00409.
Detailed experimental procedures, MHN dye synthesisand photophysical properties, BKα construct details andlocalization, and dye dissociation data (PDF)
■ AUTHOR INFORMATION
Corresponding Author*E-mail: [email protected].
NotesThe authors declare the following competing financialinterest(s): MPB is a founder of Sharp Edge Labs, a companythat is utilizing the fluorogen activating peptide commercially.
■ ACKNOWLEDGMENTS
We thank Christopher Szent-Gyorgyi for help in illustrating theFAP-Fluorogen complex. This work was supported in part bythe National Institutes of Health (R21MH100612: M.P.B.,C.P.P., A.L.B.; P30DK072506: J.H.) and the Shurl and KayCurci Foundation (Y.W., J.H., M.P.B.).
■ REFERENCES(1) Shah, M. M., Hammond, R. S., and Hoffman, D. A. (2010)Dendritic ion channel trafficking and plasticity. Trends Neurosci. 33,307−316.(2) Miesenbock, G., de Angelis, D., and Rothman, J. E. (1998)Visualizing secretion and synaptic transmission with pH-sensitivegreen fluorescent proteins. Nature 394, 192.(3) Paroutis, P. (2004) The pH of the Secretory Pathway:Measurement, Determinants, and Regulation. News Physiol. Sci. 19,207−215.(4) Toro, L., Wallner, M., Meera, P., and Tanaka, Y. (1998) Maxi-KCa, a Unique Member of the Voltage-Gated K Channel Superfamily.Physiology 13, 112−117.(5) Vergara, C., Latorre, R., Marrion, N. V., and Adelman, J. P.(1998) Calcium-activated potassium channels. Curr. Opin. Neurobiol. 8,321−329.(6) Brenner, R., Chen, Q. H., Vilaythong, A., Toney, G. M., Noebels,J. L., and Aldrich, R. W. (2005) BK channel beta4 subunit reducesdentate gyrus excitability and protects against temporal lobe seizures.Nat. Neurosci. 8, 1752−1759.(7) Jaffe, D. B., Wang, B., and Brenner, R. (2011) Shaping of actionpotentials by type I and type II large-conductance Ca2+-activated K+channels. Neuroscience 192, 205−218.(8) Joseph, B. K., Thakali, K. M., Moore, C. L., and Rhee, S. W.(2013) Ion channel remodeling in vascular smooth muscle duringhypertension: Implications for novel therapeutic approaches. Pharma-col. Res. 70, 126−138.
Bioconjugate Chemistry Article
DOI: 10.1021/acs.bioconjchem.5b00409Bioconjugate Chem. 2015, 26, 1963−1971
1969

(9) Orio, P., Rojas, P., Ferreira, G., and Latorre, R. (2002) Newdisguises for an old channel: MaxiK channel beta-subunits. Physiology17, 156−161.(10) Sachse, G., Faulhaber, J., Seniuk, A., Ehmke, H., and Pongs, O.(2014) Smooth muscle BK channel activity influences blood pressureindependent of vascular tone in mice. J. Physiol. 592, 2563−74.(11) Shruti, S., Clem, R. L., and Barth, A. L. (2008) A seizure-induced gain-of-function in BK channels is associated with elevatedfiring activity in neocortical pyramidal neurons. Neurobiol. Dis. 30,323−330.(12) Tseng-Crank, J., Foster, C. D., Krause, J. D., Mertz, R., Godinot,N., DiChiara, T. J., and Reinhart, P. H. (1994) Cloning, expression,and distribution of functionally distinct Ca(2+)-activated K+ channelisoforms from human brain. Neuron 13, 1315−1330.(13) Wang, B., Rothberg, B. S., and Brenner, R. (2009) Mechanismof increased BK channel activation from a channel mutation thatcauses epilepsy. J. Gen. Physiol. 133, 283−294.(14) Chiu, Y.-H., Alvarez-Baron, C., Kim, E., and Dryer, S. (2010)Dominant-negative regulation of cell surface expression by apentapeptide motif at the extreme COOH terminus of an Slo1calcium-activated potassium channel splice variant. Mol. Pharmacol. 77,497−507.(15) Kim, E. Y., Ridgway, L. D., Zou, S., Chiu, Y.-H., and Dryer, S. E.(2007) Alternatively spliced C-terminal domains regulate the surfaceexpression of large conductance calcium-activated potassium channels.Neuroscience 146, 1652−1661.(16) Poulsen, A. N., Wulf, H., Hay-Schmidt, A., Jansen-Olesen, I.,Olesen, J., and Klaerke, D. A. (2009) Differential expression of BKchannel isoforms and beta-subunits in rat neuro-vascular tissues.Biochim. Biophys. Acta, Biomembr. 1788, 380−389.(17) Fodor, A. A., and Aldrich, R. W. (2009) Convergent Evolutionof Alternative Splices at Domain Boundaries of the BK Channel. Annu.Rev. Physiol. 71, 19−36.(18) Toro, B., Cox, N., Wilson, R. J., Garrido-Sanabria, E., Stefani, E.,Toro, L., and Zarei, M. M. (2006) KCNMB1 regulates surfaceexpression of a voltage and Ca2+-activated K+ channel via endocytictrafficking signals. Neuroscience 142, 661−669.(19) Zarei, M. M., Song, M., Wilson, R. J., Cox, N., Colom, L. V.,Knaus, H. G., Stefani, E., and Toro, L. (2007) Endocytic traffickingsignals in KCNMB2 regulate surface expression of a large conductancevoltage and Ca2+-activated K+ channel. Neuroscience 147, 80−89.(20) Shruti, S., Urban-Ciecko, J., Fitzpatrick, J. A., Brenner, R.,Bruchez, M. P., and Barth, A. L. (2012) The Brain-Specific Beta4Subunit Downregulates BK Channel Cell Surface Expression. PLoSOne 7, e33429−e33429.(21) Cox, N., Toro, B., Pacheco-Otalora, L. F., Garrido-Sanabria, E.R., and Zarei, M. M. (2014) An endoplasmic reticulum traffickingsignal regulates surface expression of β4 subunit of a voltage- andCa(2+)-activated K(+) channel. Brain Res. 1553, 12−23.(22) Jeffries, O., Tian, L., McClafferty, H., and Shipston, M. J. (2012)An electrostatic switch controls palmitoylation of the largeconductance voltage- and calcium-activated potassium (BK) channel.J. Biol. Chem. 287, 1468−77.(23) Tian, L., Jeffries, O., McClafferty, H., Molyvdas, A., Rowe, I. C.,Saleem, F., Chen, L., Greaves, J., Chamberlain, L. H., Knaus, H.-G.,et al. (2008) Palmitoylation gates phosphorylation-dependentregulation of BK potassium channels. Proc. Natl. Acad. Sci. U. S. A.105, 21006−21011.(24) Reinhart, P. H., Chung, S., Martin, B. L., Brautigan, D. L., andLevitan, I. B. (1991) Modulation of calcium-activated potassiumchannels from rat brain by protein kinase A and phosphatase 2A. J.Neurosci. 11, 1627−1635.(25) Tian, L., Duncan, R. R., Hammond, M. S. L., Coghill, L. S., Wen,H., Rusinova, R., Clark, A. G., Levitan, I. B., and Shipston, M. J. (2001)Alternative Splicing Switches Potassium Channel Sensitivity to ProteinPhosphorylation. J. Biol. Chem. 276, 7717−7720.(26) Zhou, X.-B., Wulfsen, I., Utku, E., Sausbier, U., Sausbier, M.,Wieland, T., Ruth, P., and Korth, M. (2010) Dual role of protein
kinase C on BK channel regulation. Proc. Natl. Acad. Sci. U. S. A. 107,8005−10.(27) Liu, G., Shi, J., Yang, L., Cao, L., Park, S. M., Cui, J., and Marx, S.O. (2004) Assembly of a Ca2+-dependent BK channel signalingcomplex by binding to beta2 adrenergic receptor. EMBO J. 23, 2196−2205.(28) Kyle, B. D., and Braun, A. P. The regulation of BK channelactivity by pre- and post-translational modifications. Front. Physiol.2014, 5, DOI: 10.3389/fphys.2014.00316.(29) Schubert, R., and Nelson, M. T. (2001) Protein kinases: tunersof the BKCa channel in smooth muscle. Trends Pharmacol. Sci. 22,505−512.(30) Velazquez-Marrero, C., Seale, G. E., Treistman, S. N., andMartin, G. E. (2014) BK Channel β4 Subunit Influences Sensitivityand Tolerance to Alcohol by Altering its Response to Kinases. J. Biol.Chem. 289, 29261−29272.(31) Shipston, M. J. (2011) Ion channel regulation by proteinpalmitoylation. J. Biol. Chem. 286, 8709−8716.(32) Zhou, C., Cavolo, S. L., and Levitan, E. S. (2012) Delayedendosome-dependent CamKII and p38 kinase signaling in cardio-myocytes destabilizes Kv4.3 mRNA. J. Mol. Cell. Cardiol. 52, 971−977.(33) Liu, J., Ye, J., Zou, X., Xu, Z., Feng, Y., Zou, X., Chen, Z., Li, Y.,and Cang, Y. (2014) CRL4A(CRBN) E3 ubiquitin ligase restricts BKchannel activity and prevents epileptogenesis. Nat. Commun. 5, 3924.(34) Szent-Gyorgyi, C., Stanfield, R. L., Andreko, S., Dempsey, A.,Ahmed, M., Capek, S., Waggoner, A. S., Wilson, I. A., and Bruchez, M.P. (2013) Malachite Green Mediates Homodimerization of AntibodyVL Domains to Form a Fluorescent Ternary Complex with SingularSymmetric Interfaces. J. Mol. Biol. 425, 4595.(35) Szent-Gyorgyi, C., Schmidt, B. A., Creeger, Y., Fisher, G. W.,Zakel, K. L., Adler, S., Fitzpatrick, J. A. J., Woolford, C. A., Yan, Q.,Vasilev, K. V., Berget, P. B., et al. (2008) Fluorogen-activating single-chain antibodies for imaging cell surface proteins. Nat. Biotechnol. 26,235−240.(36) Fisher, G. W., Adler, S. A., Fuhrman, M. H., Waggoner, A. S.,Bruchez, M. P., and Jarvik, J. W. (2010) Detection and Quantificationof 2AR Internalization in Living Cells Using FAP-Based BiosensorTechnology. J. Biomol. Screening 15, 703−709.(37) Holleran, J., Brown, D., Fuhrman, M. H., Adler, S. A., Fisher, G.W., and Jarvik, J. W. (2010) Fluorogen-activating proteins asbiosensors of cell-surface proteins in living cells. Cytometry, Part A77A, 776−782.(38) Yan, Q., Schmidt, B. F., Perkins, L. A., Naganbabu, M., Saurabh,S., Andreko, S. K., and Bruchez, M. P. (2015) Near-instant surface-selective fluorogenic protein quantification using sulfonated triaryl-methane dyes and fluorogen activating proteins. Org. Biomol. Chem. 13,2078−2086.(39) Gallo, E., Wienbar, S., Snyder, A. C., Vasilev, K. V., Armitage, B.A., and Jarvik, J. W. (2014) A Single-Chain-Variable-FragmentFluorescence Biosensor Activates Fluorogens from DissimilarChemical Families. Protein Pept. Lett. 21, 1289−1294.(40) Zarei, M. M., Zhu, N., Alioua, A., Eghbali, M., Stefani, E., andToro, L. (2001) A novel MaxiK splice variant exhibits dominant-negative properties for surface expression. J. Biol. Chem. 276, 16232−9.(41) Nara, M., Dhulipala, P. D., Wang, Y.-X., and Kotlikoff, M. I.(1998) Reconstitution of β-Adrenergic Modulation of LargeConductance, Calcium-activated Potassium (Maxi-K) Channels inXenopus Oocytes. J. Biol. Chem. 273, 14920−14924.(42) Diering, G. H., Gustina, A. S., and Huganir, R. L. (2014) PKA-GluA1 Coupling via AKAP5 Controls AMPA Receptor Phosphor-ylation and Cell-Surface Targeting during Bidirectional HomeostaticPlasticity. Neuron 84, 790−805.(43) Martinez-Pena y Valenzuela, I., Pires-Oliveira, M., andAkaaboune, M. (2013) PKC and PKA Regulate AChR Dynamics atthe Neuromuscular Junction of Living Mice. PLoS ONE 8, e81311.(44) Vistein, R., and Puthenveedu, M. A. (2013) Reprogramming ofG protein-coupled receptor recycling and signaling by a kinase switch.Proc. Natl. Acad. Sci. U. S. A. 110, 15289−15294.
Bioconjugate Chemistry Article
DOI: 10.1021/acs.bioconjchem.5b00409Bioconjugate Chem. 2015, 26, 1963−1971
1970

(45) Fisher, G. W., Fuhrman, M. H., Adler, S. A., Szent-Gyorgyi, C.,Waggoner, A. S., and Jarvik, J. W. (2014) Self-Checking Cell-BasedAssays for GPCR Desensitization and Resensitization. J. Biomol.Screening 19, 1220.(46) Grover, A., Schmidt, B. F., Salter, R. D., Watkins, S. C.,Waggoner, A. S., and Bruchez, M. P. (2012) Genetically Encoded pHSensor for Tracking Surface Proteins through Endocytosis. Angew.Chem., Int. Ed. 51, 4838−4842.(47) Wallner, M., Meera, P., and Toro, L. (1996) Determinant forbeta-subunit regulation in high-conductance voltage-activated andCa(2+)-sensitive K+ channels: an additional transmembrane region atthe N terminus. Proc. Natl. Acad. Sci. U. S. A. 93, 14922−14927.
Bioconjugate Chemistry Article
DOI: 10.1021/acs.bioconjchem.5b00409Bioconjugate Chem. 2015, 26, 1963−1971
1971