Embed Size (px)
Citation preview

Techniques of Water-Resources Investigations of the United States Geological Survey
Chapter Al2
FLUOROMETRIC PROCEDURES FOR DYE TRACING By James F. Wilson, Jr., Ernest D. Cobb,
and Frederick A. Kilpatrick
BOOK 3
APPLICATIONS OF HYDRAULICS
Revised 1986
DEPARTMENT OF THE INTERIOR
DONALD PAUL HODE:L, Secretary
U.S. GEOLOGKAL SURVEY
Dallas L. Peck, Dlirector
UNITED STATES GOVERNMENT PRINTING OFFICE, WASHINGTON: 1986
For sale by the Books and Open-File Reports !jection, U.S. Geological Survey, Federal Center, Box 25425, Denver, CO 60225

Preface
The series of manuals on techniques describes procedures for planning and executing specialized work in water-resources investigations. The material is grouped under major subject headings called books and further subdivided into sections and chapters; Section A of Book 3 is on surface-water techniques.
The unit of publication, the chapter, is limited to a narrow field of subject matter. This format permits flexibility in revision and publication as the need arises.
Provisional drafts of chapters are distributed to field offices of the U.S. Geologi- cal Survey for their use. These drafts are subject to revision because of experience in use or because of advancement in knowledge, techniques, or equipment. After the technique described in a chapter is sufficiently developed, the chapter is pub- lished and is sold by the Superintendent of Documents, U.S. Government Printing Office, Washington, DC 20402.
This chapter is a complete update of the chapter by the same number published in 1968.
III

TECHNIQUES OF WATER-RESOURCES INVESTIGATBONS OF
THE U.S. GEOLOGICAL SURVEY THE U.S. Geological Survey publishes a series of manuals describing procedures
for planning and conducting specialized work in water-resources investigations. The manuals published to date are listed below and may be ordered by mail from the U.S. Geological Survey, Books and Open-File Reports,Federal Center, Building 41, Box 25425, Denver, Colorado 80225 (an authorized agent of the Superintendent of Documents Printing Office).
Prepayment is required. Remittance sh,ould be sent by check or money order payable to U.S. Geological Survey. Prices are not included in the listing below as they are subject to change. Current prices can be obtained by writing to the USGS Eastern Distribution Branch. Prices include cost of domestic surfaced transportation. For transmittal outside the U.S.A. (except to Cana.da and Mexico) a surcharge of 25 percent of the net bill should be included to cover surface transportation. When ordering (any of these publications, please give the title, book number, chapter number, and “U.S. Geological Survey Techniques of Water-Resources Investigations.” TWI l-Dl.
TWI l-D2.
TWI 2-Dl.
TWI 2-El.
TWI 3-Al.
TWI 3-A2.
TWI 3-A3.
TWI 3-A4.
TWI 3-A5.
TWI 3-A6.
TWI 3-A7.
TWI 3-A&
TWI 3-A9.
TWI 3-All.
TWI 3-A12.
TWI 3-A13.
TWI 3-A14.
Water temperature-influential fac:tors, field measurement, and data presentation, by H. H. Stevens, Jr.,, J. F. Ficke, and G. F. Smoot, 1975, 65 pages. Guidelines for collection and field analysis of ground-water samples for selected unstable constituents, by W. W. Wood. 1976. 24 pages. Application of surface geophysics to ground water investigations,, by A. A. R. Zohdy, G. P. Eaton, and D. R. Mabey. 1974. 116 pages. Application of borehole geophiysics to water-resources investigations, by W. S. Keys and L. M. MacCary. 19’71. 126 pages. General field and office procedures for indirect discharge measurement, by M. A. Benson and Tate Dalrymple. 1967. 30 pages. Measurement of peak discharge by the slope-area method, by Tate Dalrymple and M. A. Benson. 1967. 12 pages. Measurement of peak discharge at culverts by indirect methods, Iby G. L. Bodhaine. 1968. 60 pages. Measurement of peak discharge at width contractions by indirect methods, by H. F. Matthai. 1967. 44 pages. Measurement of peak discharge at dams by indirect methods, by Harry Hulsing. 1967. 29 pages. General procedure for gaging streams, by R. W. Carter and Jacob Davidian. 1968. 13 pages. Stage measurements at gaging stations, by T. J. Buchanan and W,. P. Somers. 1968. 28 pages. Discharge measurements at gaging stations, by T. J. Buchanan and W. P. Somers. 1969. 65 pages. Measurement of time of travel and dispersion in streams by dye tracing, by E. P. Hubbard, F. A. Kilpaltrick, L. A. Martens, and J. F. Wilson, Jr. 1982. 44 pages. Measurement of discharge by moving-boat method, by G. F. Smoot and C. C. Novak. 1969. 22 pages. Fluorometric procedures for dye tracing, Revised, by James F. Wilson, Jr., Ernest D. Cobb, and Frederick A. Kilpatrick. 1986. 41 pages. Computation of continuous records of streamflow, by Edward J. Kennedy. 1983. 53 pages. Use of flumes in measuring discharge, by F. A. Kilpatrick, and V. R. Schneider. 1983. 46 pages.

3-A15.
3-Bl.
TWI 3-B2.
TWI 3-B3.
TWI 3-Cl. TWI 3-C2.
TWI 3-C3.
TWI 4-Al. TWI 4-A2. TWI 4-Bl. TWI 4-B2.
TWI 4-B3.
TWI 4-Dl.
TWI 5-Al.
TWI 5-A2.
TWI 5-A3. 0 TWI 5-A4.
TWI 5-A5.
TWI 5-A6.
TWI 5-Cl.
TWI ?-Cl.
TWI 7-C2.
TWI i’-C3.
TWI 8-Al.
TWI 8-A2.
V Computation of water-surface profiles in open channels, by Jacob Davidian. 1984. 48 pages. Aquifer-test design, observation, and data analysis, by R. W. Stallman. 1971. 26 pages. Introduction to ground-water hydraulics, a programmed text for self- instruction, by G. D. Bennett. 1976. 172 pages. Type curves for selected problems of flow to wells in confined aquifers, by J. E. Reed. 1980. 106 p. Fluvial sediment concepts, by H. P. Guy. 1970. 55 pages. Field methods of measurement of fluvial sediment, by H. P. Guy and V. W. Norman. 1970. 59 pages. Computation of fluvial-sediment discharge, by George Porterfield. 1972. 66 pages. Some statistical tools in hydrology, by H. C. Riggs. 1968. 39 pages. Frequency curves, by H. C. Riggs, 1968. 15 pages. Low-flow investigations, by H. C. Riggs. 1972. 18 pages. Storage analyses for water supply, by H. C. Riggs and C. H. Hardison. 1973. 20 pages. Regional analyses of streamflow characteristics, by H. C. Riggs. 1973. 15 pages. Computation of rate and volume of stream depletion by wells, by C. T. Jenkins. 1970. 17 pages. Methods for determination of inorganic substances in water and fluvial sediments, by M. W. Skougstad and others, editors. 1979. 626 pages. Determination of minor elements in water by emission spectroscopy; by P. R. Barnett and E. C. Mallory, Jr. 1971. 31 pages. Methods for analysis of organic substances in water, by D. F. Goerlitz and Eugene Brown. 1972. 40 pages. Methods for collection and analysis of aquatic biological and microbiological samples, edited by P. E. Greeson, T. A. Ehlke, G. A. Irwin, B. W. Lium, and K. V. Slack. 1977. 332 pages. Methods for determination of radioactive substances in water and fluvial sediments, by L. L. Thatcher, V. J. Janzer, and K. W. Edwards. 1977. 95 pages. Quality assurance practices for the chemical and biological analyses of water and fluvial sediments, by L. C. Friedman and D. E. Erdmann. 1982. 181 pages. Laboratory theory and methods for sediment analysis, by H. P. Guy. 1969. 58 pages. Finite difference model for aquifer simulation in two dimensions with results of numerical experiments, by P. C. Trescott, G. F. Pinder, and S. P. Larson. 1976. 116 pages. Computer model of two-dimensional solute transport and dispersion in ground water, by L. F. Konikow and J. D. Bredehoeft. 1978. 90 pages. A model for simulation of flow in singular and interconnected channels, by R. W. Schaffranek, R. A. Baltzer, and D. E. Goldberg. 1981. 110 pages. Methods of measuring water levels in deep wells, by M. S. Garber and F. C. Koopman. 1968. 23 pages. Installation and service manual for U.S. Geological Survey monometers, by J. D. Craig. 1983. 57 pages. Calibration and maintenance of vertical-axis type current meters, by G. F. Smoot and C. E. Novak. 1968.15 pages.

CONTENTS
Preface _ _ _ _ _ _ _ _ _ _ _ _ _ _ _ _ _ _ _ _ _ _ _ _ _ _ _ _ _ _ Abstract _ _ _ _ _ _ _ _ _ _ _ _ _ _ _ _ _ _ _ _ _ _ _ _ _ _ _ _ _ Introduction _ _ _ _ _ _ _ _ _ _ _ _ _ _ _ _ _ _ _ _ _ _ _ _ _ _ _ General description of fluorescence _ _ _ _ _ _ _ _ _ _ _ Fluorescent dyes _ _ _ _ _ _ _ _ - - - _ _ _ _ _ _ _ _ _ _ _ _
Types recommended for tracing _ _ _ _ _ _ _ _ _ _ _ _ Properties of dyes _ _ _ _ _ _ _ _ _ _ _ _ _ _ _ _ _ _ _ _ _
Factors that affect fluorescence _ _ _ _ _ _ _ _ - _ - Sorption _ _ _ _ _ _ _ _ _ _ _ _ _ _ _ _ _ _ _ _ _ _ _ _ _ _ Biological effects _ _ _ _ _ _ _ _ _ _ _ _ _ _ _ _ _ _ _ _ _ Spectral characteristics _ _ _ _ _ _ _ _ _ _ _ _ _ _ _ _
Fluorometers _ _ _ _ _ _ _ _ _ _ _ _ _ _ _ _ _ _ _ _ _ _ _ _ _ _ General description _ _ _ _ _ _ _ _ _ _ _ _ _ _ _ _ _ _ _ _ Selection of optical components _ _ _ _ _ _ _ _ _ _ _ _
Lamps ___________________________ Filters _ _ _ _ _ _ _ _ _ _ _ _ _ _ _ _ _ _ _ _ _ _ _ _ _ _ _ Sample holders _ _ _ _ _ _ _ _ _ _ _ _ _ _ _ _ _ _ _ _ _ _ Photomultiplier _ _ _ _ _ _ _ _ _ _ _ _ _ _ _ _ _ _ _ _ _ Range control _ _ _ _ _ _ _ _ _ _ _ _ _ _ _ _ _ _ _ _ _ _ Preferred systems _ _ _ _ _ _ _ _ _ _ _ _ _ _ _ _ _ _ _
Accessory equipment _ _ _ _ _ _ _ _ _ _ _ _ _ _ _ _ _ _ _ Temperature-control apparatus - _ _ _ _ _ _ _ _ _ _ Portable power supplies _ _ _ _ _ _ _ _ - _ _ _ _ _ _ _
Page
III 1 1 2 3 3 5 5 7 7 8 8 8
11 11 12 14 15 15 15 15 15 16
Fluorometers-Continued Accessory equipment-Continued
Continuous-sampling equipment _ _ _ _ _ _ _ _ _ _ Fluorometer operation _ _ _ _ _ _ _ _ _ _ _ _ _ _ _ _ _ _ _ _
General procedure in the laboratory _ _ _ _ _ _ _ _ _ Preparations _ _ _ _ - _ _ - _ _ _ _ _ _ _ _ _ _ _ _ _ _ _ Background readings _ _ _ _ _ _ _ _ _ _ _ _ _ _ _ _ _ _ Sample testing _ _ _ _ _ _ _ _ _ _ _ _ _ _ _ _ _ _ _ _ _ _
Special procedures in the field _ _ _ _ _ _ _ _ _ _ _ _ _ Discrete sampling _ _ _ _ _ _ _ _ _ _ _ _ _ _ _ _ _ _ _ _ Flow-through sampling _ _ _ _ _ _ _ _ _ _ _ _ _ _ _ _
Troubleshooting _ _ _ _ _ _ _ _ _ _ _ _ _ _ _ _ _ _ _ _ _ _ _ Fluorometer calibration _ _ _ _ _ _ _ _ _ _ _ _ _ _ _ _ _ _ _
Concentration units _ _ _ _ _ _ _ _ - - _ _ - - - _ - _ _ _ Preparation of standard solutions _ _ _ _ _ _ _ _ _ _ _
Equipment and supplies _ _ _ _ _ _ _ - _ _ _ _ _ _ - _ Serial dilution procedure _ _ _ _ _ _ _ _ _ _ _ _ _ _ _ Testing procedure _ _ _ _ _ _ _ _ _ _ _ _ _ _ _ _ _ _ _ _
Calibration curves - - _ _ _ _ _ _ _ _ _ _ _ _ _ _ _ _ _ _ _ Calibration of the flow-through cuvette _ _ _ _ _ _ _
Determination of sample concentration _ _ _ _ _ _ _ _ _ Aerial photography as a supplement to fluorometry _ Selected references _ _ _ _ _ _ _ _ _ _ _ _ _ _ _ - _ _ _ _ _ _
Page
17 18 18 18 19 19 20 20 21 22 22 23 23 23 24 28 28 31 31 31 32
FIGURES
1. Diagram of the electromagnetic spectrum, with an enlargement of the visible spectrum _ _ _ _ _ _ _ _ _ _ _ _ _ _ 2. Temperature-correction curves for rhodamine WT, pontacyl pink, and acid yellow 7 dyes _ _ _ _ _ _ _ _ _ _ _ _ _ 3. Graphs of excitation and emission spectra of rhodamine WT, pontacyl pink, and acid yellow 7 dyes _ _ _ _ _ _ _ 4. Sketch of basic structure of most filter fluorometers _ _ _ _ _ _ _ _ - - _ - _ _ _ _ _ _ _ _ _ _ _ _ _ _ _ _ _ _ . . _ _ _ _ _
5-7. Photographs of:
Page
3 6 9
10
5. Turner model 111 fluorometer _ _ _ _ _ _ _ _ _ _ _ _ _ - _ _ _ _ _ _ _ _ _ _ _ _ _ _ _ _ _ _ _ _ _ . _ _ _ _ _ _ _ _ _ _ _ _ 6. Turner Designs model 10 fluorometer _ _ _ _ _ _ _ _ _ _ _ _ _ _ _ _ _ _ _ _ _ _ _ _ _ _ _ _ _ _ _ _ _ _ _ _ _ _ _ _ _ _ _ 7. FLM/AMINCO fluorocolorimeter _ _ _ _ _ _ _ _ _ _ _ _ _ _ _ _ _ _ _ _ _ _ _ _ _ _ _ _ _ _ _ _ _ _ _ _ _ _ _ _ _ _ _ _ _ _
8. Functional diagram of the Turner model 111 fluorometer _ _ _ _ _ _ _ _ _ _ _ _ _ _ _ _ _ _ _ _ _ _ _ _ _ _ _ _ _ _ _ _ _ _ _ 9. Graph of spectral-transmittance characteristics of preferred filters for rhodamine WT and pontacyl pink dyes _
10, 11. Sketchesof:
11 11 11 12 13
10. Example of the preparation of a set of standard solutions of rhodamine WT _ _ _ _ _ _ _ _ _ _ _ _ _ _ _ _ _ 27 11. Types of fluorometer calibration curves _ _ _ _ _ _ _ _ _ - - _ - _ _ _ _ _ _ _ _ _ _ _ _ _ _ _ . . _ _ _ _ _ _ _ _ _ _ _ _ 29
12. Graph of a typical set of calibration curves _ _ _ _ _ _ _ _ _ _ _ _ _ _ _ _ _ _ - _ _ _ _ _ _ _ _ _ _ _ _ _ _ _ _ . . . _ _ _ _ _ _ _ 30 13. Aerial photograph of dye cloud, Potomac River estuary at Washington, D.C., August 1965 _ _ _ _ _ _ _ . . . . . 33
VII

VIII CONTENTS
TABLE.S
Page
1. Characteristics of preferred tracer dyes _ _ _ _ _ _ - _ - _ . _ _ _ _ _ _ _ _ _ _ - - _ _ _ _ _ _ _ _ _ . . _ _ _ _ _ _ _ _ _ _ . . 4 2. Convenient three-step serial dilutions for preparation of working ,solution - _ _ _ _ _ _ _ _ _ _ _ _ _ _ _ _ _ _ _ _ _ _ _ 25 3. Convenient fourth-step dilutions for preparing dye standards using a lOO-microgram-per-liter working solution _ 26
SELECTED CONVERSION FACTORS
The following factors may be used to convert the International System of Units (SI) published herein to inch-pound units.
Multiply SI units
meter (m)
millimeter (mm)
BY
Length 3.281
39.37 0.03937
To obtain inch-pound units
foot (ft.) inch (in) in
cubic centimeter (cm31 liter (L)
milliliter (mL)
Volume
0.06101 0.2642 0.03531 0.06101
cubic inch (in31 gallon (gal) cubic foot (ft3) in3
gram (g) kilogram (kg)
Mass 0.002205 2.205
35.27
pound (lb) lb ounce (02)
degree Celsius W) Temperature
“F=9/5 “C-t32 “C=5/9 (“F-32)
degree Fahrenheit VF)
Other conversion relations that may be helpful to the user Iof this report are as follows:
angstrom (1 A)=lO-1° meters (ml kilometer (1 km)= 103 m
1 m= lo3 millimeters (mm) 1 mm=103 micrometers (pm) 1 pm= 103 nanometers (nm)

GLOSSARY
SYMBOLS AND UNITS
IX
Symbol
Cf
G
C”
G
oi
DT
SG
vd
VW
wd
Explanation
Final concentration Initial concentration New concentration after a dilution Concentration of stock solution Dilution factor Total dilution factor in a serial dilution Specific gravity Volume of the dye solution Volume of added diluent Weight of the dye
__ L L g
GLOSSARY
Absorption. The physical assimilation of dye molecules by organic or inorganic solids such as a bank, a bed, sus- pended material, or plantlife. Also, the assimilation and conversion to thermal energy of irradiating energy (light) by most substances, including all that are fluores- cent.
Absorption spectrum. For a given substance, the charac- teristic relationship of the intensity of absorbed energy (light) to the wavelength of the incident energy. Related to, but not the same as, excitation spectrum.
Adsorption. The physical adhesion of dye molecules to the surfaces of solids such as a bank, a bed, suspended ma- terial, or plantlife. A primary cause of loss of dye in streams and aquifers.
Background. Fluorometer readings, other than those due to fluorescence of the tracer dye, that result from scat- tered light, from fluorescence of natural materials or pollutants, or from other causes.
Calibration. The relationship of fluorometer readings to dye concentration.
Concentration quenching. Not true quenching, but rather the reduction in the rate of increase of fluorometer read- out with increasing dye concentration due to the in- creasing optical density of the dye itself. A problem only with very high concentrations. (See quenching.)
Converter (inverter). An electronic device used to change direct current from a storage battery into alternating current, as required by some fluorometers.
Cuvette (sample holder). A test tube or other device, usu- ally made of Pyrex glass, for containing the water sam- ple in the fluorometer.
Detectability. The extent to which a dye may be identified quantitatively in a water sample. Depends on the spect- ral characteristics of the dye, the potential interference by background materials, and the sensitivity of the fluorometer. (See sensitivity.)
Diluent. A diluting agent or solvent; distilled water is usu- ally the diluent used in preparing standard dye solu- tions.
Dilution factor. The ratio of the volume of tracer solution to the total resultant solution. Used in computing con- centrations of standard solutions.
Dummy cuvette. The opaque cuvette used to set the zero reading on the fluorometer dial before testing water samples.
Emission. The discharge of energy from an excited fluores- cent substance. (See fluorescence.)
Emission (fluorescence) spectrum. For a given fluorescent substance, the characteristic relationship of the inten- sity of emitted energy (light) to the wavelength of the emitted energy. Except for magnitude, the relationship is independent of the wavelength of the absorbed light.
Excitation. For fluorescent substances, the state wherein certain electrons are raised temporarily to higher orbits owing to absorption of energy from an external source.
Excitation spectrum. For a given fluorescent substance, the characteristic relationship of the intensity of emitted light to the wavelength of the absorbed light. Related to, but not the same as, absorption spectrum.
Filter fluorometer; fluorimeter; fluorescence meter. An instrument containing a lamp or other means of exciting fluorescent radiation in a sample, with filters and a de- tector to measure relative fluorescent intensities caused by variations in concentration of the substance under examination.
Fluorescence. The emission of electromagnetic waves of characteristic energy when atoms or .molecules decay from an excited state to a lower energy state. The exci- tation may be induced by subjecting the substance to radiation of slightly higher energy (shorter wavelength) than that of the characteristic emission, and ceases as soon as the external source is removed.

X GLOSSARY
Fluorescence spectrum. See emission spectrum. Fluorometer. See filter fluorometer and spectrofluorome-
ter. Loss of dye. Dye loss due to any or all of the following: ab-
sorption, photochemical decay, quenching, and chemical alteration.
Luminescence. Any emission of light not directly ascriba- ble to heat. Fluorescence and phosphorescence are two examples.
Nanometer (nm). A unit of length equal to 10 angstroms, one-thousandth of a micrometer, and one-millionth of a millimeter. Used in expressing wavelength.
Neutral-density (ND) (range extension) filter. A filter used to reduce the amount of light reaching the photo- multiplier tube in the fluorometer. Usually used in addi- tion to other filters when dye concentrations are too high to obtain a reading, the ND filter reduces the in- tensity of the light, but does not change the spectral dis- tribution of the light.
Photochemical decay (photodecomposition). Degradation of the fluorescence intensity of dye in a stream or a sam- ple container by the action of light.
Quenching. The reduction of fluorescence due to any of a number of kinds of interaction of the dye molecules with other chemicals in the water. (See concentration quenching.)
Raman scatter. A spectrum produced when light is scat- tered as it passes through certain substances such as water. Some of the energy is absorbed; the scattered light has longer wavelengths than the incident light. (See Rayleigh scatter.)
Rayleigh scatter. A spectrum produced when light is scat- tered as it passes through certain substances such as water; the scattered light has the same wavelengths as the incident light. (See Raman scatter and Tyndall scatter.)
Selectivity. The capability to isolate a narrow spectral band of exciting or emitted light by selection of appropriate fluorometer filters. (See sensitivity and specificity.)
Sensitivity. The extent to which a given fluorometer can detect low concentrations of a given dye. Depends on the characteristics and interrelationships of the fluorometer components. (See detectability, selectiv- ity, and specificity.)
Sorption. The process of taking up and holding either by
absorption or adsorption. (See absorption and adsorp- tion.)
Specificity. The capability to isolate fluorometricahy the fluorescence of a particular dye from that of all other fluorescent substances present in a. water sample. (See selectivity and sensitivity.)
Spectral-fluorescence characteristics. The excitation and emission spectra of a particular fluorescent substance, often identified by the wavelengths at which maximum excitation and maximum emission occur. (See excitation spectrum and emission spectrum.)
Spectraltransmittance characteristics. For a given filter or filter combination, the curve relating transmittance (percent transmission) to wavelength, sometimes iden- tified by the wavelength of maximum transmission. (See transmittance.)
Spectrofluorometer (fluorescence spectrometer). A spe- cial type of fluorometer that may be used, among other things, to determine the spectral-fluorescence character- istics of fluorescent substances.
Standard solution. A sample containing a known concen- tration of dye in distilled water diluent. Used to calib- rate a fluorometer.
Tracer. In hydrologic tracing, any dissolved, suspended, or floating material used to determine the path a.nd (or) rate of movement and dispersion of similar materials in the water. Tracers include natural materials and pollut- ants, such as sewage, as well as materials intentionally injected, such as floats, salts, radioisotopes, and fluores- cent dyes.
Transmittance. The proportion of incident light that emerges from the opposite side of a fluorometer filter. (See s:pectral-transmittance characteristics.)
Tyndall scatter. A spectrum produced when light is scat- tered by suspended material in a water sample; the scat- tered light has about the same wavelengths as the inci- dent light. (See Rayleigh scatter.)
Visible spectrum. The narrow band of the electromagnetic spectrum to which the human eye is sensitive; a.pproxi- mately the interval 380-800 nm, which includes the exci- tation and emission spectra of most of the tracer (dyes.
Xanthene dyes. The group of brilliant fluorescent dyes char- acterized by the presence of the xanthene nucleus (C1sH1sO). Rhodamine WT and pontacyl pink are xanth- ene dyes used for water tracing.

FLUOROMETRIC PROCEDURES FOR DYE TRACING
Abstract
By James F. Wilson, Jr., Ernest D. Cobb, and
Frederick A. Kilpatrick
This manual describes the current fluorometric procedures used by the U.S. Geological Survey in dye tracer studies such as time of travel, dispersion, reaeration, and dilution-type dis- charge measurements. The advantages of dye tracing are (1) low detection and measurement limits and (2) simplicity and accuracy in measuring dye tracer concentrations using fluorometric techniques.
The manual contains necessary background information about fluorescence, dyes, and fluorometers and a description of fluorometric operation and calibration procedures as a guide for laboratory and field use. The background informa- tion should be useful to anyone wishing to experiment with dyes, fluorometer components, or procedures different from those described. In addition, a brief section on aerial photo- graphy is included because of its possible use to supplement ground-level fluorometry.
Introduction
The extensive use of fluorescent dyes as water tracers began in the early to mid-1960’ s. Prior to that time, floats, chemical salts, and actual contaminants had been used as tracers. After World War II, radioisotopes such as tritium (heavy hydrogen) gained favor as trac- ers, but their use was severely limited by han- dling problems, the special training required, and a general lack of understanding by the pub- lic. A search for a suitable substitute for radioisotopes led to the rediscovery of fluores- cent dyes for tracing. Although fluorescein had been used occasionally for more than 50 years (Dole, 1906), Pritchard and Carpenter (1960) were the first to combine rhodamine B, a much better surface-water tracer than fluorescein, and greatly improved fluorometers for large- scale tracing studies.
Within the U.S. Geological Survey, feasibil- ity test of dyes and fluorometers were made in 1961- 62 and were reported by Wright and Col- lings (1964). The initial application of fluorometry-and by far the most used applica- tion to date-was for the measurement of time of travel of solutes in streams (Buchanan, 1964; Hubbard and others, 1982). The procedures also were adapted to the measurement of stream discharge by dye-dilution methods (Cobb and Bailey, 1965; Kilpatrick, 1968). Fluorometry has also been applied to studies to determine reaeration rates of streams (Rathbun and others, 1977). Others in the Geological Sur- vey who have contributed to the development of fluorometric procedures for dye tracing in- clude E.L. Meyer, J.R. Kreider, and Bernard Dunn.
In addition to time-of-travel, dispersion, rea- eration, and discharge measurements, hydro- logic applications have included studies of waste buildup and flushing in estuaries (Bailey and others, 1966; Yotsukura and Kilpatrick, 1973) circulation and stratification of water in reser- voirs; path tracing in cavernous limestone; mea- surement of ground-water time of travel (Freeze and Cherry, 1979, p. 426-430); determi- nation of well-drilling fluid circulation time; studies of the uptake of irrigation waters by plants (Robinson and Donaldson, 1967); tagging of herbicide spray with dye in a canal to facili- tate downstream sampling and testing for traces of the herbicide; and tagging of heated water discharges from power plants to facilitate downstream sampling.
The outstanding characteristics of dye trac- ing are (1) low detection and measurement
1

2 TECHNIQUES OF WATER-RESOURCES [NVESTIGATIONS
limits and (2) simplicity and accuracy in measuring dye tracer concentrations using fluorescent techniques. Nearly all applications of dye tracing include introduction of dye into a water body, subsequent collection of water samples over time and space to measure the re- sponse, and determination of the concentration of dye in the samples by means of a fluorome- ter. Dosing and sampling procedures and data analysis vary with each application; fluoromet- ric procedures are generally the same for most applications and are the subject of this manual.
This manual is a revision of an earlier manual by Wilson (196813) and is intended to be a com- panion to the manuals on individual applications such as discharge measurements (Kilpatrick and Cobb, in press), time-of-travel measure- ments (Hubbard and others, 1982), and others that may follow. This manual contains neces- sary background information about fluores- cence, dyes, and fluorometers and a description of fluorometric procedures as a general guide in both laboratory and field applications of dye tracing. The background information also should be useful to anyone wishing to experi- ment with dyes, fluorometer components, or procedures different from those described. In addition, a brief section on aerial photography is included because of the possible use of aerial photography in dye tracing to supplement ground-level fluorometry.
The procedures described are subject to mod- ification, as dyes, equipment, and techniques are continually being improved. Also, accuracy requirements for determining dye concentra- tions vary with individual applications and should be established in advance of an investi- gation in order to use the appropriate fluorometric procedures.
General Description of F I uorescence
Fluorometric analysis, or fluorometry, uses the physical phenomenon called fluorescence. Be- cause fluorescence is the outstanding property of all tracer dyes, a general understanding of the phenomenon is necessary to assure its proper use in any application of dye tracing.
Basically; fluorescence is a form of lumines- cence, a broad term for any emission of light
nlot directly ascribable to heat. Fluorescent sub- stances emit radiation (light) immediately upon irradiation from an external source; emission ceases when the source is removed. A similar kind of luminescence is phosphorescence. How- ever, phosphorescent substances store some of the irradiating energy, delaying emission, which continues after removal of the light source. For a detailed technical discussion of lumines#cence, see Bowen and Garlick (1966).
The almost instantaneous sequence of events in fluorescence is as follows: (1) absorption of energy from an outside source such as the Sun or an ultraviolet lamp, (2) excitation of some of the electrons of the fluorescent substance, re- sulting in enlarged electron orbits-the “ex- cited st,ate,” and (3) emission of energy in the form of photons (light) as the excited electrons return to normal position-the “ground state.” The emitted (fluoresced) energy nearly (always has longer wavelengths and lower frequencies than th,e absorbed energy because some energy is lost in the process (Stokes’ law). It is this property of dual spectra-a different specific combination of excitation and emission spectra for each fluorescent substance-that is used to make fluorometry an accurate and sensitive analytical tool. An excellent reference on the basic theory of fluorescence and fluorometry is Udenfriend (1962, p. 1-124).
In fluorometry, wavelengths are given in either nanometers or angstrom units. Nanomet- ers are used in this manual.
Most substances are at least mildly fluores- cent, and most fluorescence occurs in the ZOO- to 800-nanometer range of wavelengths-ul- traviolet and visible light (fig. 1). St.rongly fluorescent substances convert a high percen- tage of absorbed energy into emitted energy. Most strongly fluorescent substances fluoresce in the ultraviolet-to-green part of the spectrum. A few substances, including some of the pre- ferred tracer dyes, fluoresce in the yellow- orange range. Dyes that are useful for tracer applications are strongly fluorescent and can be dietected easily in small concentrations. The spectral properties of the tracer dyes and the corresponding fluorometer optics are discussed in subsequent sections of this manual.
Fluorescent materials likely to be found in some streams include algae and other naturally occurring organics, certain minerals, manmade
0

FLUOROMETRIC PROCEDURES FOR DYE TRACING
WAVELENGTH, IN NANOMETERS
3
380 450 500 570 590 610 760 I I I I I I
uv I
I Violet
I Blue I
Green lalat
I Red 1 IR
I I
1 p 1 E 1
I I I I I
\ /
I \ I
\ I
\ I
VISIBLE LIGHT I \ I
\ I
I \ I’
WAVELENGTH
30mA 0.03A 3A 3&m , 3~ ’ 300~ 30mm 3m 300m 30km 3000km I II I 1 I I ’ I I I I 1 1 I 1 I
L ’ Gamma rays
1 1 i 1 I I I 1 X-rays 1 Ult;y;let I I Inf,rar;d i Microwaves 1
Long Radio waves I electrical
/
I I I l I I oscillations ’
I II I I I I I I I I I I I 1
1 o** 1020 10’8 10’6 10’4 10’2 10’0 108 106 104 102
FREQUENCY, IN CYCLES PER SECOND
Figure 1 .-The electromagnetic spectrum, with an enlargement of the visible spectrum. The fluorescent tracer dyes ab- sorb and emit light at visible wavelengths.
pollutants such as paper and textile dyes, cer- tain petroleum products, and laundry-detergent brighteners. Wright and Collings (1964, p. 749- 750) and Williams and Bridges (1964, p. 372- 376, 387-393) discuss the spectral-fluorescent properties of some common organic substances.
Fluorescence intensity is affected in varying degrees by certain physical and chemical fac- tors such as solvent, concentration, tempera- ture, pH, photochemical decay, and fluores- cence quenching. Udenfriend (1962, p. 96-114) and Williams and Bridges (1964, p. 377-385) present excellent general discussions of these and other factors. Studies limited to an evalua- tion of the properties of fluorescent dyes were reported by Pritchard and Carpenter (1960), Feuerstein and Selleck (1963b), Wright and Collings (1964), and Smart and Laidlaw (1977). These properties are discussed in more detail in the next section.
Fluorescent Dyes
Types recommended for tracing
Hundreds of commercial dyes are available in a variety of colors. A great number are
strongly fluorescent, but only a few exhibit the combination of properties essential for water tracing. Two dyes, variations of the same basic organic structure (xanthene), are preferred for use as water tracers: rhodamine WT and pon- tacyl pink (also known as intracid rhodamine B, pontacyl brilliant pink B, and acid red 52). These dyes are generally good tracers because they are (1) water soluble, (2) highly detecta- ble-strongly fluorescent, (3) fluorescent in a part of the spectrum not common to materials generally found in water, thereby reducing the problem of background fluorescence, (4) harm- less in low concentrations, (5) inexpensive, and (6) reasonably stable in a normal water environ- ment.
A third dye, acid yellow 7 (also known as lis- samine FF), lends itself to water tracing in cer- tain environments. Only a small amount of field testing has been performed with this dye. Smart and Laidlaw (1977) reported on the dye’s characteristics. It appears to have many good qualities for water tracing. Brian G. Katz (hy- drologist, U.S. Geological Survey, written com- mun., 1982) reported, however, that back- ground fluorescence was observed to increase with increasing concentrations of total organic
4 TECHNIQUES OF WATER-RESOURCES INVESTIGATIONS
carbon for the optical system used with acid other characteristics that are desirable for yellow 7 dyes. This seems to be one of the prin- water tracing. The other dyes may be used to cipal drawbacks to this dye, because there advant,age under special conditions. often is a high natural background in streams, Although acid yellow 7 has not been used ex- and during unsteady flow the background may tensively in field tests, it is believed to be a vary with time. good dye for use in waters containing small or
Dennis E. Ford and Kent W. Thornton constant concentrations of organic matter. (Ford, Thornton, Norton, and Associates, writ- All of the dyes listed in table 1 are believed ten commun., 1982) found in laboratory tests 1;o have some use for ground-water tracing, al- that acid yellow 7 has a solubility of 2.5 g/100 though acid yellow 7 has not been used for that mL. Brian Katz (U.S. Geological Survey, oral purpose. There may be problems with the use commun., 1982) reported that the practical of any of these dyes in tracing ground water upper limits of solubility in his tests with the through clay and silt soils because of sorption dye were about 1 g/100 mL. on the large surface areas associated with these
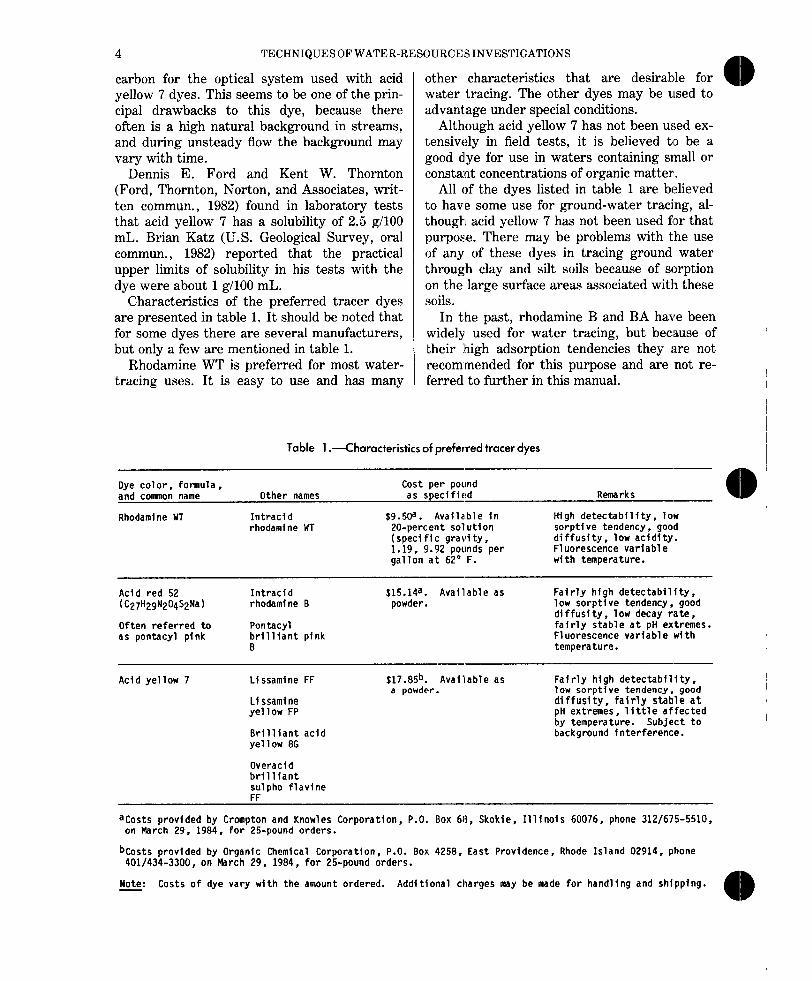
Characteristics of the preferred tracer dyes soils. are presented in table 1. It should be noted that In the past, rhodamine B and BA have been for some dyes there are several manufacturers, widely used for water tracing, but because of but only a few are mentioned in table 1. their high adsorption tendencies they are not
Rhodamine WT is preferred for most water- -recommended for this purpose and are not re- tracing uses. It is easy to use and has many ferred to further in this manual.
Dye color, formula, and comnon name
Table 1 .--Characteristics of preferred tracer dyes
Cost per pound Other names as specified Remarks
Rhodamine WT Intracid rhodamine WT
$9.5oa. Availalble in High detectability, low 20-percent solution sorptive tendency, good (specific gravity, diffusity. low acidity. 1.19, 9.92 pounds per Fluorescence variable gallon at 62' F. with temperature.
Acid red 52 Intracid s15.14a. Available as Fairly high detectability, (C27H2gN204S2Na) rhodamine B powder. low sorptive tendency, good
diffusity, low decay rate, Often referred to Pontacyl fairly stable at pH extremes. as pontacyl pink brilliant pink Fluorescence variable with
B temperature.
Acid yellow 7 Lissamine FF
Lissamine yellow FP
Brilliant acid yellow BG
S17.B5b. Available as a powder.
Fairly high detectability, low sorptive tendency, good diffusity. fairly stable at pH extremes, little affected by temperature. Subject to background interference.
Overacid brilliant sulpho flavine FF
aCosts provided by Crompton and Knowles Corporation, P.O.. Box 68, Skokie, Illinois 60076, phone 312/675-5510, on March 29. 1984, for 25-pound orders.
bCosts provided by Organic Chemical Corporation, P.O. Box 4258, East Providence, Rhode Island 02914, phone 401/434-3300, on March 29, 1984, for 25-pound orders.
Note: Costs of dye vary with the amount ordered. Additional charges may be made for handling and shipping.

FLUOROMETRIC PROCEDURES FOR DYE TRACING 5
Properties of dyes
The outstanding property of the dyes, dis- cussed previously, is their strong fluorescence. Additional properties that affect the use of the dyes as tracers are discussed below. Good re- ferences on the subject are Feuerstein and Sel- leek (1963a, 196310) and Smart and Laidlaw (1977).
Factors that affect fluorescence
Fluorescence may vary with the solvent used, but in hydrologic tracing the effect is con- stant because the solvent always is basically water; other chemicals present in the water may affect fluorescence in other ways.
In dilute solutions (solutions in which less than 5 percent of the exciting light is absorbed) and for a given fluorometer setup, fluorescence varies directly with dye concentration; this im- portant fact is discussed in the section “Fluorometer Calibration.”
Aside from concentration, the most signifi- cant factor affecting fluorescence of dilute solu- tions is sample temperature. Fluorescence ac- tivity increases (resulting in higher readings) as sample temperature decreases; lower readings are obtained as temperature increases. Tem- perature effects must be accounted for in data analysis. Temperature-correction curves for rhodamine WT, pontacyl pink, and acid yellow ‘7 are given in figure 2. It can be seen from figure 2 that acid yellow 7 is relatively insensi- tive to temperature changes.
If calibration standards and field samples are brought to a common temperature before the samples are analyzed, temperature effects can usually be ignored-unless the samples are al- lowed to warm up while being tested in the fluorometer.
The pH of the sample also may affect fluores- cence intensity. Fluorescence of rhodamine WT is stable in the pH range 5-10 and decreases outside those limits (see curves prepared by Feuerstein and Selleck, 1963a, p. 13). Fluores- cence of pontacyl pink and acid yellow 7 is stable in the pH range 4-10 and decreases out- side those limits (Smart and Laidlaw, 1977, p. 19, 20).
Decreased fluorescence due to pH variation is not usually a serious problem, except possibly in highly acidic streams, where apparent recov-
ery of dye could be very small. Feuerstein and Selleck (1963a, p. 12; 1963b, p. 24) indicated that by adjusting the pH of a solution, one can restore fluorescence to full strength. This, how- ever, would not rectify any nonreversible chem- ical effects due to reaction of dye with the acidic compound itself.
For tracing purposes, fluorescence also can be adversely affected by quenching, which re- sults from the action of other chemicals in the solution. The quenching agent may do any or all of the following (Williams and Bridges, 1964, p. 383-385): (1) absorb exciting light, (2) absorb light emitted by the dye, and (3) degrade the excited-state energy. A fourth possibility is that the quenching agent may chemically change the fluorescent compound; this change is nonreversible. Chlorine, for example, is known to quench the fluorescence of rhodamine dyes. For this reason chlorinated tapwater generally should not be used to prepare standard solu- tions. When tapwater is the only water avail- able, small concentrations of chlorine can usu- ally be removed by allowing containers of the water to sit open to the atmosphere for about 12 hours. An effect similar to true quenching, concentration quenching, occurs when relative- ly high concentrations of dye produce a screen- ing effect on both the exciting light and the emitted light. This problem can be overcome simply by diluting a measured amount of sam- ple with a measured amount of water.
In tests conducted in Baltimore storm sewers using chlorinated hydrant water, Katz (U.S. Geological Survey, written commun., 1982) found no effect of the chlorine on the fluores- cence of acid yellow 7, but he did find signifi- cant effects on the fluorescence of rhodamine WT. On the other hand, Ford and Thornton (Ford, Thornton, Norton, and Associates, Ltd., written commun., 1982) found sizable decreases in fluorescence of acid yellow 7 when solutions containing 100 and 500 pg/L (micrograms per liter) of acid yellow 7 and 1.0 and 5.25 mg/L (milligrams per liter) of residual chlorine were tested in a laboratory. It may be concluded that chlorinated water should be avoided, if possi- ble, both in field tests and in the preparation of standards.
High levels of oxygen, such as in highly aer- ated streams, appear to have the same effect as chlorine. This will not ordinarily be a problem,

6 TECHNIQUES OF WATER-RESOURCES INVESTIGATIONS
TEMPERATURE DIFFEfWNCE, IN “C
Example: ........ Rhodamine WT Dial reading ............... 51 Sample temperature ......... 62O Base temperature .......... .72O Temperature difference ...... tlOO Correction factor ........... 0.66 Corrected dial reading = 0.66X51 = 44
0.9 - _--------
0.8 -
0.7 -
0.6 ““~““~““~““~““h -30 -25 -20 -15 -10 -5 0 f5 f10 f15 +20 t25 t30
TEMPERATURE DIFFERENCE (BASE TEMPERATURE MINUS SAMPLE TEMPERATURE), IN OF
Figure 2.-Temperature-correction curves for rhodamine WT, pontacyl pink, and acid yellow 7 dyes. Curve f’or acid yellow 7 modified frbm Smart and Laidlaw (1977, fig. 2).
unless the stream being tested is virtually all “white water.” Under these infrequent condi- tions, unusally large losses of rhodamine WT have been measured.
A permanent reduction in fluorescence can be caused by photochemical decay, or photodecom- position. Bright sunlight has this effect on the rhodamine dyes, and the effect increases gradu- ally with time. Stream depth, turbidity, and
cloudy skies tend to minimize photochemical decay, so the effect usually is significant only for applications requiring recovery of a, large percentage of the dye or where the dye is ex- posed to sunlight for several days. Smart and Laidlaw (1977, p. 24) indicate that the photo- chemical decay rate of acid yellow ‘7 appears to be an order of magnitude less than that of pon- tacyl pink.
FLUOROMETRIC PROCEDURES FOR DYE TRACING 7
Sorption
One of the most important characteristics of dyes used for water tracing is the tendency to adhere to suspended and bed materials, aquatic plants and the like (adsorption), or to be ab- sorbed by such materials. It is important that the sorption tendency of a dye used as a water tracer be as low as possible. Rhodamine WT, pontacyl pink, and acid yellow 7 are only slightly susceptible to adsorption in most situa- tions. Generally, organic sediments adsorb more dye than inorganic sediments. In labora- tory tests reported by Smart and Laidlaw (1977, p. 2529), acid yellow 7 generally seemed to be more resistant to adsorption on mineral sediments than either rhodamine WT or pon- tacyl pink. Acid yellow 7 also seems to be more resistant to adsorption by organic matter than does rhodamine WT. There is some evidence in the report by Smart and Laidlaw (1977, p. 25- 29) that pontacyl pink is superior or equal to acid yellow 7 in water containing significant amounts of organic matter.
Although sorption (adsorption and (or) ab- sorption) is not a factor that affects fluores- cence, the results are similar to those from photochemical decay or chemical quenching. Like the losses due to other causes, sorptive loss contributes to decreased recovery of dye, but it is impossible to separate quantitatively these three causes of dye loss in a stream. Dye losses have a direct bearing on the accuracy of discharge measurements but are rarely serious enough to threaten the results of time-of- travel or dispersion measurements. Sorption, of course, is a critical factor in ground-water tracer studies.
Biological effects
A number of tests have been conducted con- cerning the effects of rhodamine WT and pon- tacyl pink on aquatic life and on laboratory test animals. Parker (1973) reported on a test in which eggs and lZday-old larvae of the Pacific oyster (Crassostrea @*gas) were exposed for 48 hours in water at 24” C with rhodamine WT dye concentrations ranging from 1 to 10,0001*g/L. All of the tested eggs developed to larvae with- out abnormalities and all of the 12-day-old lar- vae survived with no abnormalities. An addi-
ti ional test was made by Parker (1973) on silver St almon and Donaldson trout. No mortalities or 0 ther problems were observed when the fish v rere exposed to water containing 10,000 kg/L 0 f rhodamine WT for 17.5 hours and then to vi later containing 375,000 kg/L of the dye for an a dditional 3.2 hours.
1
i 1 ( ( I I
; ‘
7 ‘ 1 1
j
1
,
J.S. Worttley and T.C. Atkinson (reported as personal commun., 1975, in Smart and Laidlaw, 1977) exposed a number of freshwater and orackish water invertebrates, including water lea (Daphnia magna), shrimp (Gammarus zad- Ilachl], log louse (Asellus aquaticus), may fly ICloeon dip terum) , and pea mussel (species visidium), to water containing up to 2,000,OOO u,g/L of rhodamine WT for periods of up to 1 week. No significant differences in mortality oetween the test and control animals were ob- served.
D.E. Donaldson (U.S. Geological Survey, written commun. cited by Wilson, 1968b, p. 6, 2nd by Smart and Laidlaw, 1977, p. 30) pre- pared a drinking-water solution of 10 Fg/L of rhodamine WT that was given to rats. He ob- served a slight loss of body weight and some ef- fect on certain body organ-specially the liver-when the rats were given this solution for a prolonged time, compared with rats in a control group.
Smart and Laidlaw (1977, p. 30) reported that subcutaneous injections of 50 Fg of pon- tacyl pink caused inflamed sores at the injection sites and a pronounced loss of body weight, whereas injections of rhodamine WT caused no traumatic ill effects even after 56 days of this treatment.
No known studies have been made of the ef- fects of acid yellow 7 on test animals. According to Smart and Laidlaw (1977, p. 30), the man- ufacturers have indicated that acid yellow 7 is unlikely to cause any unusual toxic hazards.
A letter by the director of the Criteria and Standards Division of the Office of Drinking Water, U.S. Environmental Protection Agency (EPA), dated April 10, 1980, states that “[EPA] would not object to [rhodamine WT’sl use as a tracer in lieu of additional information on human toxicology or a change in the position of the Food and Drug Administration.”
S. L. Abidi (1982) reported on laboratory tests showing that when rhodamine WT is mixed with streamwater containing nitrites,

8 TECHNIQUESOF WATER-RESOURCES INVESTIGATIONS
diethylnitrosamine (DENA), a carcinogen, may Spectral-fluorescence characteristics of be formed. Johnson and Steinheimer (1984) con- rhodamine WT and pontacyl pink are very simi- ducted a number of tests relative to DENA for- lar, as can be seen in figure 3. Therefore, it is mation and persistence. They found that ilmpossible to differentiate between these dyes DENA in a simulated stream environment has in a common solution. Fortunately, however, a half life of less than 3 hours. They also few other materials exhibit characteristic,s simi- analyzed water samples from four streams lar to those of the two dyes. The use of highly taken during rhodamine WI’ tracer studies and selective color filters in a fluorometer permits could not detect DENA in any of the samples. easy isolation of the fluorescence of the dyes Nitrite concentrations in the four streams var- from that of most other materials found in ied from 2 to 46 pg/L. streams.
Users of rhodamine WT should take special precautions to avoid direct contact with the dye. Rubber or plastic gloves should be worn when handling concentrated dye solutions. When the dye does come in contact with the skin, it should be washed off immediately. Pipetting of dye solutions should be done with a squeeze bulb or by using a long piece of flexi- ble tubing to prevent accidental ingestion of the dye.
The Geological Survey policy for the use of rhodamine dyes by its employees is that the maximum permissible concentration of the dye is 10 pg/L at any water intake that ultimately results in direct or indirect human consump- tion. Concentrations at water intakes should be kept well below this level; many dye studies can be designed for maximum concentrations of 1 pg/L at such critical points as water intakes.
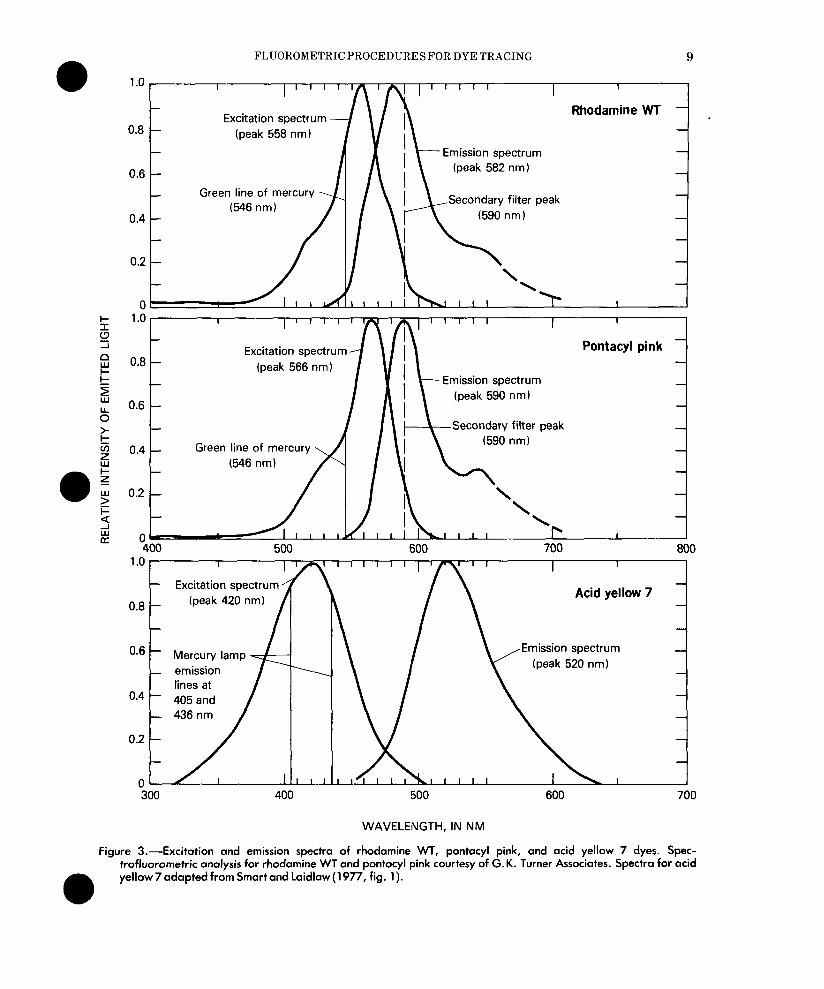
Spectral characteristics
The spectral-fluorescence characteristics of acid yellow 7 are considerably different from those of the other dyes. The excitation spec- trum peaks in the violet color range and the emission spectrum peaks in the green part of t,he spectrum. It is possible to differentiate quantitatively between acid yellow 7 and the other two dyes shown in figure 3; however, the emission characteristics of acid yellow ‘7 are somewhat similar to the emission characteris- tics of other materials that may be found in streams. This can cause interference of back- ground fluorescence with fluorescence of the dye. Therefore, before a test, samples of the water in which acid yellow 7 is to be used as a tracer should be checked on a fluorometer for magnitude and variability of the background readings. The fluorometer filters used to detect acid yellow 7 are different from those used for the other dyes. Filter selection is discussed in the next section.
It is common practice to define fluorescent substances as those that absorb light at one wavelength and emit light at a longer wavelength. Actually, each fluorescent sub- stance is characterized by a specific excitation spectrum and a specific emission spectrum. The excitation spectrum is the variation in intensity of emitted light with the wavelength of the ab- sorbed light. (The excitation spectrum is equi- valent to the absorption spectrum, which re- lates absorbed light to wavelength.) The emis- sion spectrum is the variation in intensity of emitted light with the wavelength of the emit- ted light. The characteristic spectra for several tracer dyes are shown in figure 3. Usually the wavelengths corresponding to maximum excita- tion and emission intensity are given to repre- sent the spectral-fluorescence characteristics of a substance.
F I uorometers
General description The two fundamental types of fluorometers
are (I) fluorescence spectrometers or spec- trofluorometers, used for spectral anal,yses of fluorescent substances (Udenfriend, 1962, p. 62- 86), and (2) filter fluorometers, discussed! in this section.
A filter fluorometer, or fluorimeter, is an in- strument that gives a relative measure of the intensity of light emitted by a sample contain- ing a fluorescent substance; the intensity of fluorescent light is proportional to the amount of fluorescent substance present. Howlever, a fluorometer reading by itself is a number hav- ing little meaning until it is compared with readings for samples of known concentrations
4)
FLUOROMETRIC PROCEDURES FOR DYE TRACING 9
0.8 -
0.6 -
Excitation spectrum (peak 558 nm)
t Green,z;;fmyercury d \
Rhodamine WT - .
Emission spectrum
CSecondary filter peak
I
z 1.0 I
0 i n 0.8 -
Excitation spectrum it!! (peak 566 nm) L Emission spectrum
zl 0.6 (peak 590 nm)
b t
Secondary filter peak (590 nm)
z 0.4c Green line of mercury 1 /I / \ )
I
Pontacyl pink
boo 500 600 700 800
0.8
0.6
0.4
0.2
l-l
I ’ ’ ’ ’ ’ ’ ’ ’ I I I
7 Excitation spectrum
L : , 300 400 500 600 700
WAVELENGTH, IN NM
Figure 3.-Excitation and emission spectra of rhodamine WT, pontacyl pink, and acid yellow 7 dyes. Spec- trofluorometric analysis for rhodamine WT and pontacyl pink courtesy of G.K. Turner Associates. Spectra for acid yellow 7 adapted from Smart and Loidlaw (1977, fig. 1).

10 TECHNIQUESOF WATER-RESO-URCES INVESTIGATIONS
(standards) on the same fluorometer under the same instrument and temperature conditions. Generally, a reading for a given sample on one fluorometer cannot be compared directly with a reading for the same sample on a different fluorometer. Every fluorom$er is different and must be individually calibrated.
A filter fluorometer consists of six basic com- ponents, shown in figure 4. This basic structure is found in all commercial fluorometers (Uden- friend, 1962, p. 62-78).
A number of companies market fluorometers that can be used for water tracing. Reference to a specific fluorometer and components is for the purpose of illustration and should not be re- garded as an endorsement of a particular brand of equipment. In this report, three different brands of fluorometers are discussed. There
may be other fluorometers that are as useful for dye tracing as those mentioned. The brands discussed are known to be used in the Geologi- cal Survey.
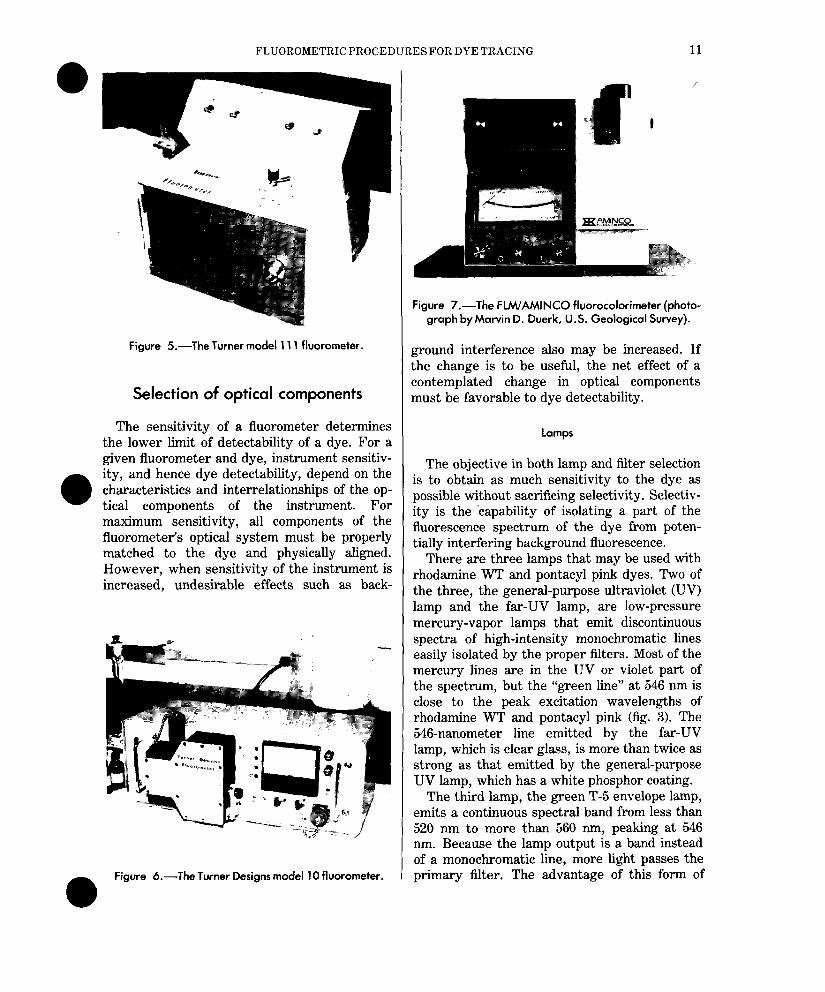
Some representative fluorometers of the types that are presently used in the Geological Survey are shown in figures 5, 6, and ‘7. The Turner model 111 fluorometer (fig. 5) has been extensively used by the Geological Surve,y. Fig- ure 8 is a functional diagram of this fluorome- ter. Other fluorometers generally are based on similar principles. One basic difference is that t’he F:LM/AMINCO fluorocolorimeter (fig. ‘7) and the Turner Designs model 10 fluorometer rely on solid-state electronic amplification of the photomultiplier signal, whereas the ‘Turner model 111 fluorometer relies on a mechanical servomotor arrangement (fig. 8).
light reaching the sensing device.
4. Secondary filter
Passes only a selected band of the dye’s emission spectrum and preferably none of the light passed by the primary filter.
EXCITATION
1. Energy source I
Passes only a selected band of the
U \ 3. Sample holder Right angle in light path minimizes amount of scattered light reaching
Figure 4.-Basic structure of most filter fluorometers.
FLUOROMETRIC PROCEDURESFOR DYE TRACING 11
Figure 5.-The Turner model 111 fluorometer.
Selection of optical components
The sensitivity of a fluorometer determines the lower limit of detectability of a dye. For a given fluorometer and dye, instrument sensitiv- ity, and hence dye detectability, depend on the characteristics and interrelationships of the op- tical components of the instrument. For maximum sensitivity, all components of the fluorometer’s optical system must be properly matched to the dye and physically aligned. However, when sensitivity of the instrument is increased, undesirable effects such as back-
l Figure &-The Turner Designs model 10 fluorometer.
Figure -/.-The FWAMINCO fluorocolorimeter (photo- graph by Marvin D. Duerk, U.S. Geological Survey).
ground interference also may be increased. If the change is to be useful, the net effect of a contemplated change in optical components must be favorable to dye detectability.
Lamps
The objective in both lamp and filter selection is to obtain as much sensitivity to the dye as possible without sacrificing selectivity. Selectiv- ity is the ‘capability of isolating a part of the fluorescence spectrum of the dye from poten- tially interfering background fluorescence.
There are three lamps that may be used with rhodamine WT and pontacyl pink dyes. Two of the three, the general-purpose ultraviolet (UV) lamp and the far-UV lamp, are low-pressure mercury-vapor lamps that emit discontinuous spectra of high-intensity monochromatic lines easily isolated by the proper filters. Most of the mercury lines are in the UV or violet part of the spectrum, but the “green line” at 546 nm is close to the peak excitation wavelengths of rhodamine WI’ and pontacyl pink (fig. 3). The 546-nanometer line emitted by the far-UV lamp, which is clear glass, is more than twice as strong as that emitted by the general-purpose UV lamp, which has a white phosphor coating.
The third lamp, the green T-5 envelope lamp, emits a continuous spectral band from less than 520 nm to more than 560 nm, peaking at 546 nm. Because the lamp output is a band instead of a monochromatic line, more light passes the primary filter. The advantage of this form of

TECHNIQUES OF WATER-RESOURCES INVESTIGATIONS
BLANK KNOB
LIGHT INTERRUPTER
MOUNTING BLOCK
FOWARD LiGHT PATH
LANGE SELECTOR Four apertures @ox, 10x, 3x, 1X)
Figure 8.-Functional diagram of the Turner model 111 flluorometer. Modified from drawing furnished by G.K. Turner Asso’ciates.
output is increased sensitivity to the rhodamine lamp is not needed with the FLM/AMINCO WT and pontacyl pink dyes, on the order of fluorocolorimeter because the range of sensitiv- tenfold, compared with the far-UV lamp. A dis- ity is adequate with the far-UV lamp. advantage is a possible increase in background The far-UV lamp or equivalent is recom- interference for two reasons: (1) a small part of mended for use with acid yellow 7 dye. This the light in the 560- to 570-nanometer range lamp has useful outputs at 254, 297, 313, 405, passes straight through the filter system to the 436, and 546 nm. The outputs at 405 and 436 photomultiplier, and (2) the fluorometer is more nm are both near the peak of the excitation sensitive to scattered light and to background spectrum of acid yellow 7 (see fig. 3). materials that are not strongly excited by the 546-nanometer line alone. The first source of in- Filters
terference is constant and presents no great problem. The second source may not be present The purpose of using color filters in a at all, or it may be great enough to preclude flluorometer is to limit, as much as possible, the use of this lamp. In general, this second source light reaching the photomultiplier to the light has not been found to be a problem. Both the fluoresced by the dye. Filter selection must be far-UV and the green T-5 lamps have been based on (1) the useful output spectrum of the used extensively with the rhodamine dyes and lamp, (2) the spectral-fluorescence characteris- are recommended for use with the Turner tics of the dye, (3) potential interference from model 111 fluorometer. The green T-5 envelope fluorescence of materials present in the stream,
FLUOROMETRIC PROCEDURES FOR DYE TRACING 13
and (4) potential interference from light scat- tered by the sample.
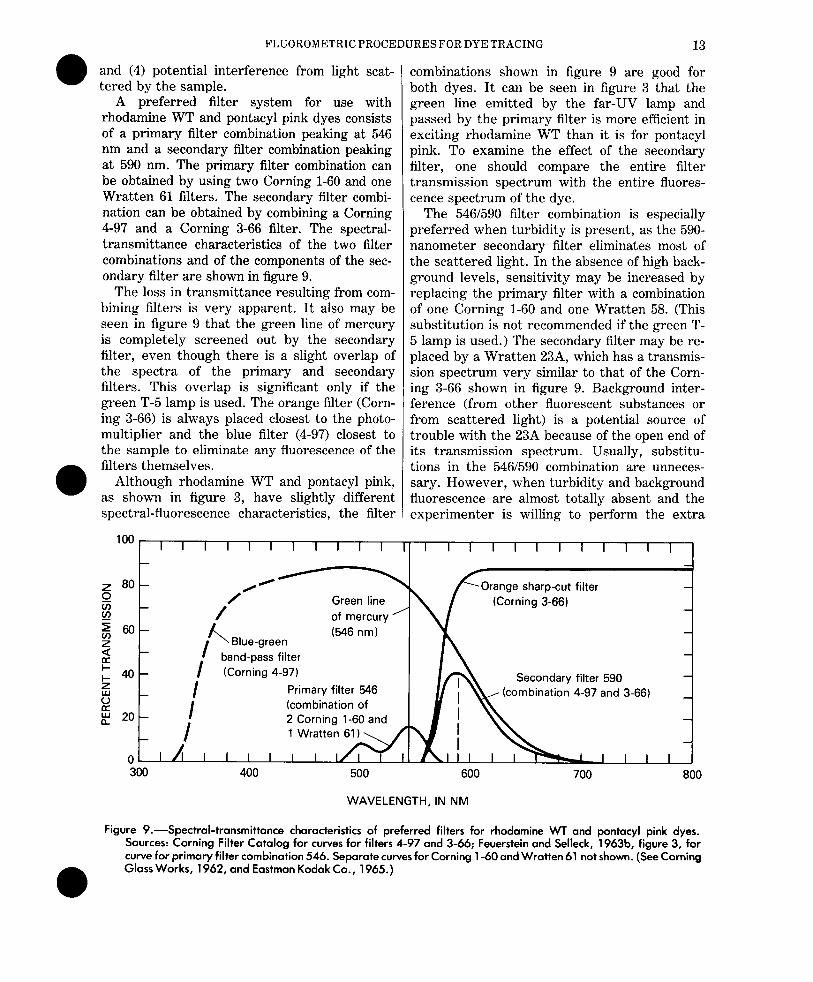
A preferred filter system for use with rhodamine WT and pontacyl pink dyes consists of a primary filter combination peaking at 546 nm and a secondary filter combination peaking at 590 nm. The primary filter combination can be obtained by using two Corning l-60 and one Wratten 61 filters. The secondary filter combi- nation can be obtained by combining a Corning 4-9’7 and a Corning 3-66 filter. The spectral- transmittance characteristics of the two filter combinations and of the components of the sec- ondary filter are shown in figure 9.
The loss in transmittance resulting from com- bining filters is very apparent. It also may be seen in figure 9 that the green line of mercury is completely screened out by the secondary filter, even though there is a slight overlap of the spectra of the primary and secondary filters. This overlap is significant only if the green T-5 lamp is used. The orange filter (Corn- ing 3-66) is always placed closest to the photo- multiplier and the blue filter (4-97) closest to the sample to eliminate any fluorescence of the filters themselves.
Although rhodamine WT and pontacyl pink, as shown in figure 3, have slightly different spectral-fluorescence characteristics, the filter
combinations shown in figure 9 are good for both dyes. It can be seen in figure 3 that the green line emitted by the far-UV lamp and passed by the primary filter is more efficient in exciting rhodamine WT than it is for pontacyl pink. To examine the effect of the secondary filter, one should compare the entire filter transmission spectrum with the entire fluores- cence spectrum of the dye.
The 5461590 filter combination is especially preferred when turbidity is present, as the 590- nanometer secondary filter eliminates most of the scattered light. In the absence of high back- ground levels, sensitivity may be increased by replacing the primary filter with a combination of one Corning l-60 and one Wratten 58. (This substitution is not recommended if the green T- 5 lamp is used.) The secondary filter may be re- placed by a Wratten 23A, which has a transmis- sion spectrum very similar to that of the Corn- ing 3-66 shown in figure 9. Background inter- ference (from other fluorescent substances or from scattered light) is a potential source of trouble with the 23A because of the open end of its transmission spectrum. Usually, substitu- tions in the 5461590 combination are unneces- sary. However, when turbidity and background fluorescence are almost totally absent and the experimenter is willing to perform the extra
100 IIIIIIl III1 I~IIIIIIIlIIII~
z 80- 0
Orange sharp-cut filter
2
s-60-
: E 5 40 -
I
Secondary filter 590
ii2
Primary filter 546 (combination 4-97 and 3-66)
I (combination of
k 20-
/
2 Corning l-60 and
600 700 800
WAVELENGTH, IN NM
Figure 9.-Spectral-transmittance characteristics of preferred filters for rhodamine WT and pontacyl pink dyes. Sources: Corning Filter Catalog for curves for filters 4-97 and 3-66; Feuerstein and Selleck, 1963b, figure 3, far curve for primary filter combination 546. Separate curves for Corning l-60 and Wratten 61 not shown. (See Corning Glass Works, 1962, and Eastman Kodak Co., 1965.)
14 TECHNIQUESOF WATER-RESOURCES INVESTIGATIONS
work needed to be assured that there is no in- terference, the substitute mentioned above may be used to advantage.
For acid yellow 7 dye, the primary filter re- commended by Sequoia Turner Corporation (written commun., 1981) is a combination filter consisting of a filter with a color specification 2A and filter 47B. The 47B filter transmits wavelengths between about 390 and 500 nm, with a peak transmittance at about 436 nm. The 2A filter is placed nearest to the lamp. A pre- ferred secondary filter for acid yellow 7 dye is filter 2A-12, which passes wavelengths greater than 510 nm.
The filters must be replaced periodically, as they become clouded with use. Occasional com- parison of fluorometer calibration curves will in- dicate their deterioration and need for replace- ment.
Occasionally, very high dye concentrations will necessitate the use of a neutral-density (ND) filter. Although ND filters are available in a wide range of transmission percentages, only one or two are necessary to have on hand. A lo-percent ND filter, which passes only 10 per- cent of the light reaching it, is recommended. In extreme cases, a l-percent ND filter may be used, but dilution of the sample can be used as a means of analyzing samples of such high con- centration in the rare instances they are ob- tained. The ND filter should be placed over the secondary color filter in the fluorometer. Be- cause the FLM/AMINCO fluorocolorimeter has such a wide range of scales, it is seldom neces- sary to use an ND filter with this instrument.
Sample holders
The standard cuvette for testing a single sample in the Turner model 111 fluorometer is glass, 3.5 cm3 in volume, 12 mm in diameter, and 75 mm long. The Turner Designs model 10 fluorometer uses a glass cuvette 13 mm in di- ameter by 100 mm long which fits inside a tem- perature-controlled holder. The FLM/AMINCO fluorocolorimeter uses a lo- by 75-millimeter cuvette.
The amount of light fluoresced by a given concentration varies directly with the size of the sample holder. Some fluorometers provide for the use of cuvettes of different sizes. For
ex,ample, the flow-through door on the Turner Model Ill fluorometer has provision for a vari- ety of cuvette sizes ranging from 1 to 20 cm3.
.A square cuvette 4.5 cm3 in volume and 10 mm square by 75 mm long can be used in the standard door of the Turner model 111 without the high-sensitivity kit (the high-sensitivity kit requires the use of a round cuvette). This quartz glass cuvette is designed to increase sensitivity to turbidity in samples but is also us,eful in producing lower and more consistent background readings when turbidity is low. In th:is instance, the green T-5 lamp may be used to acquire the desired sensitivity. The FLM/ AMINCD fluorocolorimeter does not require modification to increase sensitivity, since it has high-sensitivity capability built into it.
Two methods may be used to improve the sensitivity of the Turner model 111 fluorome- ter. Most commonly, a high-sensitivity conver- sion kit is installed in the standard door when the far-UV lamp is used. The kit uses nnrrors and a glass prism to direct fluorescent light m,ore efficiently toward the photomultiplier tube, tbus increasing the sensitivity of the single-sample cuvette about tenfold. The high- sensitivity kit is a built-in component of the co8nstant-temperature door. These doors are de- scribed in the section on “Accessory E)quip- ment.” It should be noted that slight misalign- ment of the high-sensitivity kit can cause calib- ration difficulties. Most nonlinear calibrations can be traced to this source.
A second method of improving the sensitivity of the Turner model 111 fluorometer is use of the green T-5 lamp with the standard door and w:ithout the high-sensitivity kit. The high-sen- sitivity kit and the T-5 lamp should not b’e used in combination. The use of this lamp eliminates the possibility of misalignment of the high-sen- sitivity kit, since it is not used, and thus elimi- nates this cause of nonlinear calibration. Either the more accurate square cuvette or the round cuvette can be used with this combination.
A cuvette itself may be fluorescent or may ca,use some undesirable scattering of light. The filters used in dye tracing seem to prevent most of this kind of interference. For precision work, the same cuvette or matched cuvettes should be used to avoid any small differences in read- ings that might be due to light scattered by dif- ferent cuvettes.
FLUOROMETRICPROCEDURESFORDYETRACING 15
Photomultiplier
A photomultiplier is a special vacuum tube that detects incident radiation and amplifies the resulting electronic signal. The photomultiplier tube used in most fluorometers is sensitive primarily to the blue and UV end of the spec- trum, while the rhodamine WT and pontacyl pink dyes fluoresce primarily in the orange range. However, some of the standard tubes are very sensitive to the red wavelengths, which accounts in part for a wide variation in sensitivity among instruments. Red-sensitive photomultiplier tubes are available for some fluorometers. The fluorometer manufacturer should be contacted concerning the availability and installation of such tubes if they are de- sired. The sensitivity of the red-sensitive photomultiplier tube can be as much as three to five times that of the standard tube.
Range control
Most fluorometers have a means of manually controlling available sensitivity. In the Turner model 111, this control is accomplished by a range selector between the lamp and the pri- mary filter (see fig. 8). The four positions are called 30x, 10x, 3x, and 1 x , indicating their approximate relative sensitivity. For example, the 30x scale gives a reading approximately three times as high as the reading on the 10X scale for the same fluorescent sample. How- ever, the true relationship between the scales varies among instruments. Average values for a group of four instruments were found to be 19X, ‘7.6x, 2.8x, and IX when the far-UV lamp was used. There is evidence that these ratios vary with intensity of lamp output.
Sensitivity, or range control, is electronically adjusted in the FLM/AMINCO fluorocolorime- ter by use of multiplier and fine-adjust controls. The multiplier control is used to select one of seven ranges of sensitivity available in the measuring circuit. These scales of relative in- tensity are as follows: X 100, X30, X 10, X3, x 1, x .3, and x . 1. All scales are exact multi- ples. For example, when the 0 to 0.1 (X .l) scale is selected, 0.1 is full scale. When the multiplier switch is changed to the 0 to 1.0 (X 1) scale, 0.1 is one-tenth of full scale and indicates the same relative intensity. This allows background to be suppressed on the most sensitive scale and to
*emain suppressed on all scales. This, along with the fact that scales are exact multiples, is fery useful during calibration when performing precision analysis.
Other fluorometers have similar manual con- trols for sensitivity. Some fluorometers, such as the Turner Designs model 10 fluorometer, pro- vide for optional automatic selection of sensitiv- ity scale-a useful feature for continuous sampl- ing.
Preferred systems
For general use with rhodamine WT or pon- ;acyl pink dyes, a preferred system for use lyith the Turner model 111 fluorometer consists If either the standard door, high-sensitivity kit, and far-UV lamp or the standard door without the high-sensitivity kit but with the green T-5 lamp. In either system, the 546- and 590- nanometer filters should be used. Equivalent lamps and filters should be used with other Buorometers. The Turner Designs “rhodamine accessory kit” contains the proper lamp and filters for the Turner Designs model 10 fluorometer. The FLMlAMINCO also has a “rhodamine kit” for use with its fluorocolorime- ter. Other fluorometers may not have high-sen- sitivity kits or may have other means of in- creasing sensitivities. For maximum sensitivity with the flow-through door, the green T-5 lamp is recommended, as the high-sensitivity kit is not part of this door. It is not necessary to modify the FLM/AMINCO’s fluorocolorimeter or the Turner Designs model 10 with a high- sensitivity kit as these instruments have the needed sensitivity built into them.
The high-sensitivity kit should not be used when using acid yellow 7 because the fluorome- ter is quite sensitive to this dye and the high- sensitivity kit may enhance background fluores- cence too much. For use with acid yellow 7, the far-UV lamp, the 2A and 47B filters (used as a primary filter), and the 2A-12 flter (used as a secondary filter) are preferred. \
Accessory equipment
Temperature-control apparatus
Because fluorescence depends on tempera- ture, all fluorometer readings must be either