Embed Size (px)
Citation preview

USE OF DYE TRACING TO DEFINE THE DIRECTION OF GROUND-WATER FLOW FROM A SUPERFUND WASTE-DISPOSAL SITE IN KARST TERRANE, NEAR AUBURN, KENTUCKY
By D. S. Mull
U.S. GEOLOGICAL SURVEY
Water-Resources Investigations Report 92-4195
Prepared in cooperation with theU.S. ENVIRONMENTAL PROTECTION AGENCY
Louisville, Kentucky
1993
U.S. DEPARTMENT OF THE INTERIOR
BRUCE BABBITT, Secretary
U.S. GEOLOGICAL SURVEY
Dallas L. Peck, Director
For additional information write to: Copies of this report can be purchased from:
District Chief U.S. Geological SurveyU.S. Geological Survey Books and Open-File Reports SectionDistrict Office Box 25425, Mail Stop 5172301 Bradley Avenue Federal CenterLouisville, KY 40217-1807 Denver, CO 80225-0425

CONTENTS
Abstract............................................................. 1Introduction......................................................... 1
Purpose and scope............................................... 2Previous investigations......................................... 2Acknowledgments................................................. 2
Description of study area............................................ 3Location and extent............................................. 3Physiography.................................................... 3
Sinkholes.................................................. 3Springs.................................................... 4Karst windows.............................................. 4
Geologic framework.............................................. 5Ground-water flow............................................... 6
Use of dye tracing to define the direction of ground-water flow...... 8Types of tracers................................................ 9Tracer inj ections............................................... 11Tracer sampling................................................. 12Tracer analyses................................................. 15Description of dye-tracer tests................................. 15
Dye-tracer test 1.......................................... 15Dye-tracer test 2.......................................... 17Dye-tracer test 3.......................................... 18
Results of dye-tracer tests ..................................... 19Summary and conclusions .............................................. 21References........................................................... 23Supplemental data.................................................... 25
ILLUSTRATIONS
Page
Plate 1. Dye-tracer tests, springs, and wells in the vicinity of Ina Superfund waste-disposal site, near Auburn, Kentucky., pocket
Figure 1. Diagram showing components of ground-water flow in amature karst aquifer.................................... 7
2. Sketch of anchor used to suspend dye detectors (bugs)in springs or streams................................... 13
iii

TABLES
Table 1. Wells in 1-mile radius of waste-disposal site............. 262. Springs in 1-mile radius of waste-disposal site........... 263. Wells and springs in 2-mile radius of waste-
disposal site........................................... 274. Wells and selected spring in 3- to 4-mile radius of
waste-disposal site..................................... 285. Correlation of sites used during this study with
previous dye-tracer studies............................. 106. Summary of dye-tracer tests............................... 16
iv

CONVERSION FACTORS, VERTICAL DATUM, WATER QUALITY ABBREVIATIONS, AND MISCELLANEOUS ABBREVIATIONS
Multiply
inchfootfqot per milefoot per minute (ft/min)gallon (gal)gallon per minutemileacresquare milegrampound
By
25.40.30480.18940.30483.7850.063081.6090.40472.5900.0010.454
To obtain
millimetermetermeter per kilometermeters per minuteliterliter per secondkilometerhectaresquare kilometerkilogramkilogram
Sea level: In this report, "sea level" refers to the National Geodetic Vertical Datum of 1929--a geodetic datum derived from a general adjustment of the first-order level nets of the United States and Canada, formerly called Seal Level Datum of 1929.
Abbreviated water quality units: Specific conductance of water is expressed in microsiemens per centimeter at 25 degrees Celsius (/iS/cm). This unit is equivalent to micromhos per centimeter at 25 degrees Celsius (/imho/cm), formerly used by the U.S. Geological Survey.
Miscellaneous abbreviations
ppb - parts per billion mL - milliliter

USE OF DYE TRACING TO DEFINE THE DIRECTION OF GROUND-WATERFLOW FROM A SUPERFUND WASTE-DISPOSAL SITEIN KARST TERRANE, NEAR AUBURN, KENTUCKY
By D. S. Mull
ABSTRACT
A series of dye-tracer tests were performed to determine the direction of ground-water flow and the location of natural discharge points (springs) for the karst aquifer system that drains a disposal site for leather-tannery waste. The springs that are shown to receive drainage from the waste-disposal site are appropriate sites to monitor for hazardous substances associated with the leather tannery waste that might be migrating from the disposal site. The dye-tracer test results would also determine if water from the waste site drains to a karst spring that is the source of water for the city of Auburn.
Observed variations in discharge and water turbidity indicate that ground-water flow at the waste site is primarily through enlarged subsurface conduits in carbonate rocks. Tracer tests used fluorescent dyes that were flushed into three sinkholes containing open drains (swallets) that receive surface runoff from parts of the waste site. Dye recovery was monitored at 12 springs and 2 streams. The pattern of dye recovery during three separate qualitative dye-tracer tests indicates that ground water from the waste site flows to 4 springs to the south and 2 springs northwest of the site. These springs are appropriate sites to monitor for hazardous substances associated with the leather tannery waste migrating from the waste site. Estimates of travel time during the dye-tracer tests indicate that a delay of 3 to 5 days may be needed for runoff that enters sinkholes in the vicinity of the site to arrive at the monitoring springs. Dye from tracer tests performed during this study did not drain to the Auburn water-supply spring.
INTRODUCTION
The Caldwell Lace Leather Superfund Site, located in the mature karst terrane of west-central Kentucky, was used for disposal of leather tannery waste during 1972-85. Surface drainage from parts of the waste site enters nearby sinkholes and swallets that are hydraulically connected to the karst aquifer system.
Research has shown that traditional ground-water monitoring techniques using monitoring wells only are often ineffective in detecting waste movement in ground water in karst terrane because one can not be certain that the monitoring wells tap the openings that are conveying the water. Springs that receive recharge from sinkholes and swallets draining a waste-disposal site provide additional sites for monitoring ground-water quality once those springs have been identified by tracer studies.
The U.S. Geological Survey (USGS), in cooperation with the U.S. Environmental Protection Agency (USEPA) used dye-tracer tests to determine the direction of ground-water flow and the location of natural

discharge points (springs) for the karst aquifer system that drains the waste-disposal site. The USEPA is conducting a Remedial Investigation to characterize the environmental conditions in the vicinity of the disposal site. The springs identified as receiving drainage from the disposal site are appropriate for monitoring by the USEPA to determine if hazardous constituents, associated with the leather tannery waste, may be migrating from the waste site. The results of dye-tracer tests would also indicate if ground water from the waste-disposal site drains to the spring that supplies water for the city of Auburn.
Purpose and Scope
The purpose of this report is to present the results and interpretation of dye-tracer tests to define the direction of ground-water flow from the waste-disposal site. Only qualitative dye-tracer tests were performed during this study. The report also includes the results of a field reconnaissance to locate potential dye-injection points (sinkholes with swallets) and dye-recovery sites (springs or streams) at and near the waste-disposal site. Dye-injection sites for this study were limited to swallets at or topographically downgradient of the waste-disposal site that have the potential for receiving surface runoff from the waste-disposal area. The results of a detailed inventory of wells and springs located 1, 2, and 3 miles from the waste-disposal site are also reported (pi. 1). This inventory was performed to locate potential users of ground water in the vicinity of the waste site. Data from the inventory are listed in the "Supplemental Data" section of this report (tables 1-4).
Previous Investigations
The results of previous dye-tracer tests at the waste-disposal site provided a major contribution to this study. The results of these investigations are included in unpublished consultant's reports by Quinlan (1982) and Ewers (1983). Both reports are on file with USEPA, Region IV, Atlanta, Georgia. The USGS published detailed geologic maps at the scale of 1:24,000 for the following quadrangles that include the waste-disposal site and springs that were monitored for the recovery of injected dye during tracer tests (Gildersleeve, 1966; Klemic, 1963; Rainey, 1965a, 1965b).
Acknowledgments
The author is grateful to the many individuals who granted access to their property for the purpose of inspecting and sampling water from wells, springs, streams, and sinkholes. The Auburn Volunteer Fire Department hauled water for each dye injection and the Bowling Green Fire Department provided 900 feet of fire hose that was needed to flush water into one dye-injection sinkhole. The assistance and cooperation of these individuals and agencies contributed significantly to the successful completion of this investigation.

DESCRIPTION OF STUDY AREA
Location and Extent
The Caldwell Lace Leather Superfund Site is about 2.5 miles northwest of Auburn, in Logan County, west-central Kentucky (pi. 1). The site includes about 40 acres on a ridge along Kentucky Highway 1039. Dye-injection sites were on-site or near the waste-disposal site, but springs and streams as far as 4 miles from the site were monitored for the presence of dye during all tracer tests performed during this investigation.
Phys iography
The study area is in the Mississippian Plateaus physiographic province of Kentucky (McFarlan, 1943) and includes broad gently rolling valleys and relatively narrow flat-topped ridges. The waste-disposal site is along the crest of an east-west trending ridge; the ridge top is about 170 feet above the valleys. In general, sinkholes with swallets are more common on the eastern part of the ridge.
Karst features such as sinkholes, springs, karst windows, and sinking streams are common in the broad valleys north and south of the ridge-top waste-disposal site. The karst features are developed on limestone and, for the most part, have formed as a result of the dissolution of carbonate bedrock by percolating ground water. Most karst features are hydrologically significant because of their unique relation to the ground-water system; that is, they collect and discharge water into, store and transmit, or discharge water from the ground-water system.
Sinkholes
Sinkholes are commonly the most typical evidence of karstification. As used in this report, the term sinkhole refers to a naturally occurring closed topographic depression caused from subsidence or collapse of the land surface resulting from karst processes. The principal cause of development of sinkholes in the study area is the transport of surficial material into solution-enlarged openings in bedrock. This process usually results in the formation of a funnel-shaped depression (sinkhole) in the land surface.
Mapped sinkholes in the vicinity of the waste-disposal site are circular to irregular in outline and range from less than 10 to about 500 feet in diameter. Most sinkholes are less than 20 feet deep but a few are as deep as 50 feet below the surrounding area. In general, sinkholes on the broad valleys are less deep but much larger in outline than sinkholes on the ridge near the waste-disposal site. For example, a sinkhole south of highway US 68 and about 2.5 miles southwest of the waste site is about 30 feet deep and 0.6 miles in diameter.
The drain (swallet) at the bottom of a sinkhole may be open or plugged with soil. Swallets are hydrologically significant because the openings are usually connected to subsurface conduits that lead directly to the
ground-water system. Thus, all surface runoff collected by the sinkhole is funneled directly into the ground-water system without enhancement of water quality which may occur as water drains through the sediment plug. Because of the direct hydraulic connection to the ground-water system and the fact that surface runoff from the waste-disposal site can drain into several sinkholes with open swallets, all dye-tracer tests performed during this study originated in those sinkholes with open swallets (sites A, B, and C, pi. 1).
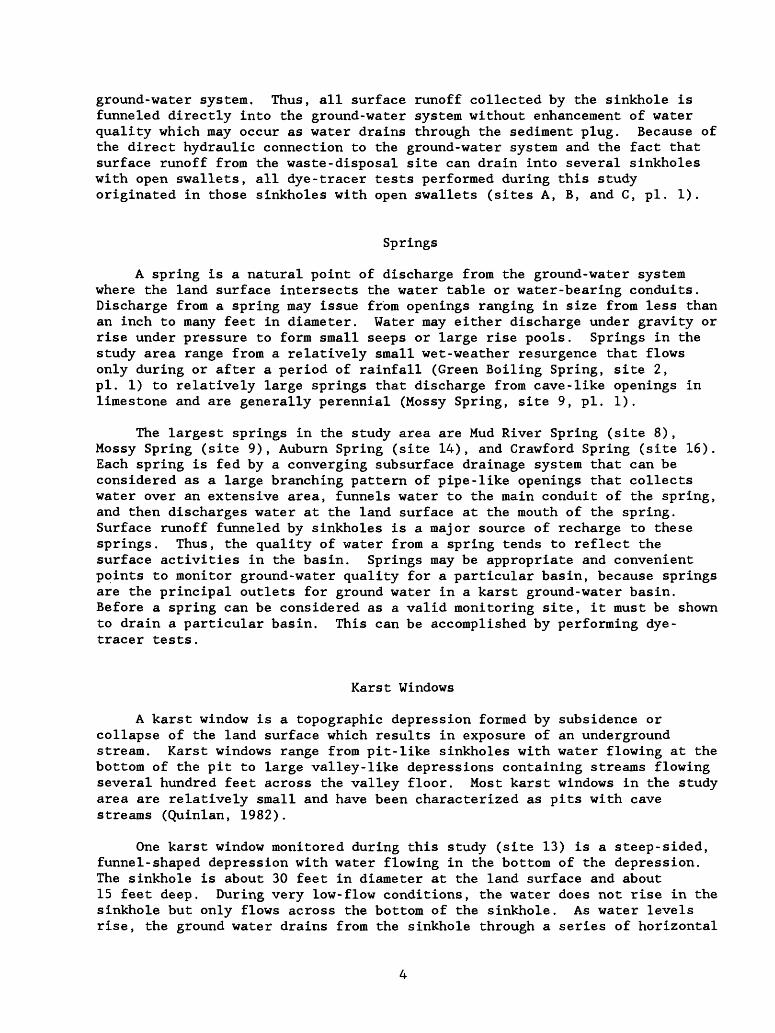
Springs
A spring is a natural point of discharge from the ground-water system where the land surface intersects the water table or water-bearing conduits. Discharge from a spring may issue from openings ranging in size from less than an inch to many feet in diameter. Water may either discharge under gravity or rise under pressure to form small seeps or large rise pools. Springs in the study area range from a relatively small wet-weather resurgence that flows only during or after a period of rainfall (Green Boiling Spring, site 2, pi. 1) to relatively large springs that discharge from cave-like openings in limestone and are generally perennial (Mossy Spring, site 9, pi. 1).
The largest springs in the study area are Mud River Spring (site 8), Mossy Spring (site 9), Auburn Spring (site 14), and Crawford Spring (site 16). Each spring is fed by a converging subsurface drainage system that can be considered as a large branching pattern of pipe-like openings that collects water over an extensive area, funnels water to the main conduit of the spring, and then discharges water at the land surface at the mouth of the spring. Surface runoff funneled by sinkholes is a major source of recharge to these springs. Thus, the quality of water from a spring tends to reflect the surface activities in the basin. Springs may be appropriate and convenient points to monitor ground-water quality for a particular basin, because springs are the principal outlets for ground water in a karst ground-water basin. Before a spring can be considered as a valid monitoring site, it must be shown to drain a particular basin. This can be accomplished by performing dye- tracer tests.
Karst Windows
A karst window is a topographic depression formed by subsidence or collapse of the land surface which results in exposure of an underground stream. Karst windows range from pit-like sinkholes with water flowing at the bottom of the pit to large valley-like depressions containing streams flowing several hundred feet across the valley floor. Most karst windows in the study area are relatively small and have been characterized as pits with cave streams (Quinlan, 1982).
One karst window monitored during this study (site 13) is a steep-sided, funnel-shaped depression with water flowing in the bottom of the depression. The sinkhole is about 30 feet in diameter at the land surface and about 15 feet deep. During very low-flow conditions, the water does not rise in the sinkhole but only flows across the bottom of the sinkhole. As water levels rise, the ground water drains from the sinkhole through a series of horizontal

openings at different levels above the bottom of the sinkhole. During high-flow conditions, water rises in the sinkhole, and during intense storms the water surface is turbulent as a result of the force of water rising in the sinkhole. During this study, water did not overflow the top of the sinkhole.
Karst windows are hydrologically significant because the exposed streams provide a direct path to the subsurface for any contaminants placed in or allowed to enter the sinkhole. Also, and perhaps of greater importance within the context of this investigation, karst windows serve as convenient and appropriate ground-water monitoring sites because the exposed stream provides access to ground water within a major subsurface conduit. The stream in one karst window (site 13) was monitored for dye during all tracer tests performed during this investigation.
Geologic Framework
Only the near-surface geology is discussed in this report, because nearly all ground water in the study area is present at relatively shallow depths. The following discussion proceeds from younger or uppermost geologic units to successively older and deeper rocks; the descriptions have been taken from USGS published 7-1/2 minute geologic quadrangle maps that are listed in the references. Each geologic quadrangle map includes a detailed stratigraphic column, lithologic descriptions, and structural features. The geology of the surrounding area is discussed in detail by McFarlan (1943).
Near the waste-disposal site, bedrock is overlain by soil and residuum that is generally thin but variable in thickness. Soil depths, as determined by drilling, range from 0 to 43 feet (Quinlan, 1982). According to the Soil Survey of Logan County (Dye and others, 1975), soil depths near the waste-disposal site range from 40 to 48 inches and include the Linker series, a well-drained sandy clay loam derived from sandstone, and the Talbot series, a moderately deep, well-drained clayey soil derived from limestone.
The waste-disposal site is underlain by limestone, shale, and sandstone of Mississippian age that includes, in descending order, the Big Clifty Sandstone member of the Golconda Formation, the Girkin Formation, and the Ste. Genevieve Limestone. Most of the site is underlain by as much as 70 feet of the Big Clifty sandstone that is gray to light-brown, fine grained, massive to thin-bedded, cliff-forming, crossbedded, and locally shaley. The Big Clifty Sandstone caps many ridges throughout the region.
The Girkin Formation underlies the Big Clifty sandstone and crops out at the surface at the eastern and western ends of the waste-disposal site and underlies the intensely karstified lowlands that surround the ridge where the waste site is located. The Girkin Formation is about 170 feet thick and is mostly limestone, medium-light gray to pale-yellow gray, aphanitic to coarsely detrital, and oolitic. The beds are thin and irregular to very thick and ledge forming. Discontinuous shale and sandstone units that range from 0 to 5 feet in thickness are present about 45 feet above the base of the formation.

The Ste. Genevieve Limestone underlies the Girkin Formation and is light gray to light brown, fine to coarsely detrital and oolitic, and thin-bedded to very-thick bedded and massive. The Ste. Genevieve Limestone is about 200 feet thick and is the basal limestone in the study area, but crops out only near Mud River Spring (site 8) and southeast of Auburn. The Ste. Genevieve Limestone underlies extensive highly-karstified areas to the south and west of the study area.
Structural contours on the geologic quadrangle maps indicate that bedrock dips north-northwest at about 40 feet per mile. No mapped faults exist in the study area; however, a fault zone is mapped about 5-miles northwest of the waste-disposal site. Several lineaments are present in the study area and seem to be subparallel to the fault zone (Ewers, 1983).
Ground-Water Flow
Ground-water flow in bedrock underlying mature karst terrane is much different from that underlying non-karst terrane, primarily because of the presence of pipe-like openings or conduits that permit relatively rapid movement of water. It is the presence of these openings that contribute to the unique nature of ground-water flow in the study area.
Ground-water flow in karst aquifers is of two main types: diffuse (slow, laminar flow) and conduit (rapid, turbulent flow). Both types of ground-water flow can exist in the same karst aquifer. Diffuse flow typically occurs where dissolutional enlargement of primary openings in bedrock has not developed sufficiently to permit turbulent flow and most often occurs near the boundaries of ground-water basins and in the weathered and fractured uppermost zone of bedrock near the contact with the overlying residuum. In areas where ground-water flow is primarily diffuse, flow is usually not concentrated in particular zones of the aquifer; typical karst landforms, such as sinkholes, may be absent or poorly developed.
Conduit flow in carbonate bedrock occurs in solution-enlarged openings that range in size from less than an inch to cave-size, such as the opening that forms the cave-like conduit at Mossy Spring (site 9). These conduits are dendritic or trellised and develop along horizontal or vertical open fractures and bedding planes. Where conduit flow predominates, karst landforms are common and well developed. As mentioned earlier, the hydrologic significance of conduit flow is the rapid introduction and movement of water through the aquifer system. The relation between diffuse and conduit flow is shown by the generalized block diagram in figure 1 (Gunn, 1986).
In a mature karst aquifer, such as occurs in the study area, conduits concentrate water that enters the subsurface at discrete points, such as sinkholes, or by slow drainage from the overlying strata. In this way, contaminants placed on the land surface or disposed of in sinkholes have the potential for rapid transport into the subsurface and impairing ground-water quality downgradient from the input point.

EX
PLA
NA
TIO
N
1.
Diff
use
flow
thro
ugh
soil,
res
iduu
m,
or u
ncon
solid
ated
sur
ficia
l mat
eria
l2.
Fl
ow th
roug
h en
larg
ed v
ertic
al c
ondu
its3.
D
iffus
e flo
w in
bed
rock
4.
Sur
face
stre
ams
drai
ning
int
o si
nkho
les
5.
Hor
izon
tal a
nd v
ertic
al fl
ow to
maj
or c
ondu
it6.
W
ater
-fille
d m
ajor
con
duit
7.
Vad
ose
cond
uit
stre
am8.
Fl
ow li
nes
of d
iffus
e ph
reat
ic fl
ow
Figu
re 1
.-C
ompo
nent
s of
gro
und-
wat
er fl
ow in
a m
atur
e ka
rst
aqui
fer.
(Mod
ified
from
Gun
n, 1
986.
)

Conduit flow in major conduits converge to the springs that serve as the natural discharge points for these conduits. Flow in major conduits is typically turbulent, with highly-variable turbidity and temperature, and has a relatively rapid response to precipitation. These are characteristics of several large springs--Mud River Spring, Mossy Spring, and the Auburn Spring--that are the discharge points of major conduits draining ground-water basins in the study area.
Ground water moves in response to hydraulic gradients from points of recharge to points of discharge. In the study area, most points of recharge are in the uplands and points of discharge are in valleys and streams. The general direction of ground-water flow can be estimated by drawing flow lines perpendicular to water-level contours of a potentiometric (water table) map. However, the local direction of ground-water flow at a specific site may differ from that of general regional flow because the water follows available routes whose orientation depends on the development of secondary openings and local structure, including dip of the rocks. For this reason, ground-water tracing is commonly the most accurate, or even the only method, of defining the direction of ground-water flow in karst terrane.
USE OF DYE TRACING TO DEFINE THE DIRECTION OF GROUND-WATER FLOW
The practice of tracing ground-water flow by adding distinctive substances to water draining underground and monitoring the down-gradient resurgence of that water has long been a useful tool in hydrologic investigations. Because of the unique hydrologic characteristics of karst terrane, dye tracing is generally the most practical and satisfactory method to provide information about the movement of water in karst aquifer systems. Perhaps the most common use of dye tracing is to identify point-to-point connections between discrete ground-water recharge points, such as sinkholes, and discharge points, such as springs or wells. In addition, analysis of dye-recovery data from dye-tracer tests can provide critical information for water managers, such as time of travel, peak concentration, and persistence of potential ground-water contaminants.
Dye tracing can generally be classified as qualitative, semiqualitative, or quantitative, depending on the method of dye recovery, extent and method of analysis of the dye-recovery data, the number of dye-tracer tests between the same dye injection and recovery points, and the hydrologic conditions during repeat dye-tracer tests. Typically, qualitative dye tracing involves the tagging of a discrete sample of water with dye and monitoring the passage of that water at various down-gradient ground-water resurgences. The arrival of dye is observed visually or by appropriate analysis of various passive detectors (dye accumulators) that have adsorbed the dye. Generally, semiquantitative and quantitative dye-tracer tests use instrumental analysis of water samples or various dye elutants to confirm the presence or precisely measure the concentration of a particular tracer. In addition, analysis of the results of repeated quantitative dye-tracer tests between the same input and recovery points during different flow conditions can be used to provide

information on time of travel, peak concentration, and persistence of a particular dye. These data can be used to estimate similar characteristics of a potential ground-water contaminant.
The primary purpose of dye-tracer tests performed during this study was to identify point-to-point connections between sinkholes near the waste-disposal site and down-gradient springs. Therefore, all dye-tracer tests were designed to be qualitative and did not include instrumental determination of dye except for definition of background concentration of a particular dye before injection during special conditions that are described later.
The following discussion briefly describes the procedures used for dye-tracer tests during this investigation. In general, the procedures were similar to those used in the Elizabethtown area of Kentucky by Mull and others (1988b) and described in detail in Mull and others (1988a). For convenience, the name and identification of various dye-injection swallets and dye-monitoring sites from previous investigations that could be correlated with similar features in this study are listed in table 5.
Types of Tracers
Several fluorescent dyes can be used for qualitative dye-tracer tests. Fluorescent dyes are generally superior to nonflucrescent dyes because they can be detected at concentrations ranging from one to three orders of magnitude less than those required for visual detection of nonfluorescent dyes. Thus, tracer tests with fluorescent dyes can usually be completed without the aesthetically unpleasant discoloration of a private or public water supply.
The fluorescent dyes used during this investigation were selected because they are generally the most convenient and practical tracers, are nontoxic, and are adsorbed on activated cocoanut charcoal or undyed cotton--materials commonly used in passive dye detectors. Because the selected dyes are adsorbed on different dye-detector materials, combinations of dyes were used because one particular dye did not interfere or impede the adsorption of a second dye during simultaneous dye tracings from different injection sites. During this investigation, tracer tests 1 and 2 were performed simultaneously, each using a different fluorescent dye injected at different swallets.
Because most dyes are available under different commercial names, the Colour Index (CI) Generic Name or Constitution Number of a dye is used in this report to avoid confusion (Society of Dyers and Colourists and American Association of Textile Chemists, 1971-82). The fluorescent dyes used during this investigation included fluorescein (CI Acid Yellow 73) and Direct Yellow 96 (DY 96).
Fluorescein is a reddish-brown powder that turns vivid yellow green in water. Fluorescein has a low sorptive tendency, is photochemically unstable, and may lose fluorescence in water with pH less than 5.0. It is one of the most widely used water tracers used in the United States for dye-tracer tests in karst terrane (Quinlan, 1986).
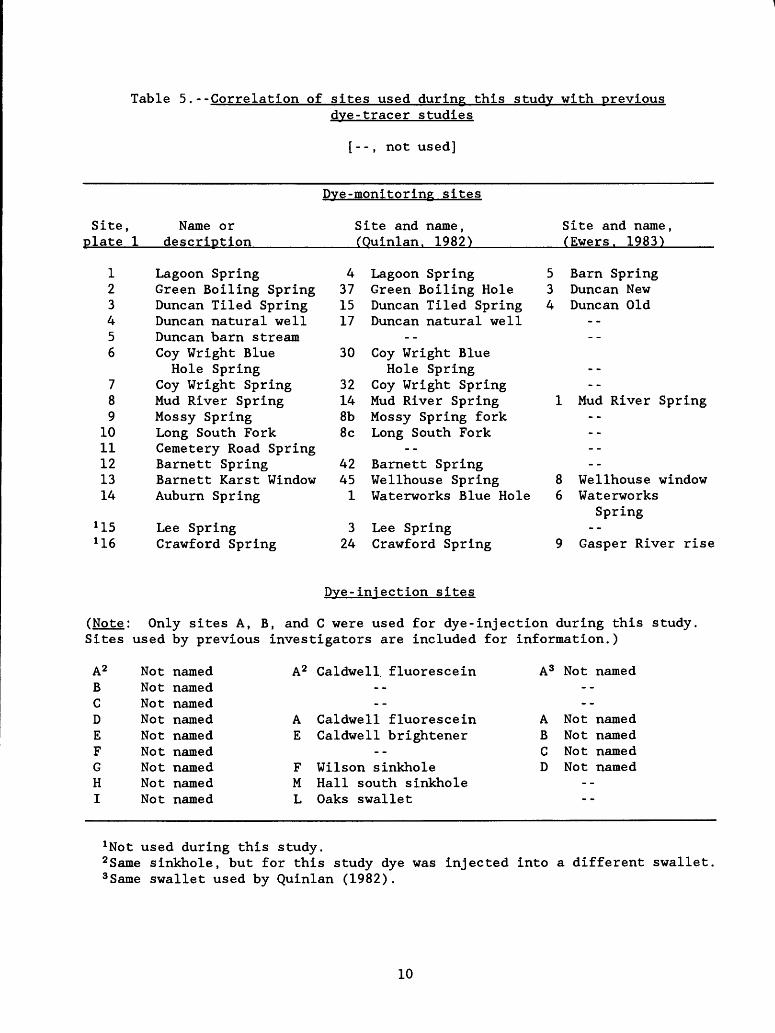
Table 5.--Correlation of sites used during this study with previousdye-tracer studies
[--, not used]
Site, plate 1
Name or description
Dye-monitoring sites
Site and name, (Quinlan. 1982)
Site and name, (Ewers. 1983)
123456
789
1011121314
Lagoon Spring Green Boiling Spring Duncan Tiled Spring Duncan natural well Duncan barn stream Coy Wright BlueHole Spring
Coy Wright Spring Mud River Spring Mossy Spring Long South Fork Cemetery Road Spring Barnett Spring Barnett Karst Window Auburn Spring
Lee Spring Crawford Spring
4 Lagoon Spring37 Green Boiling Hole15 Duncan Tiled Spring17 Duncan natural well
30 Coy Wright BlueHole Spring
32 Coy Wright Spring 14 Mud River Spring 8b Mossy Spring fork 8c Long South Fork
42 Barnett Spring45 Wellhouse Spring1 Waterworks Blue Hole
3 Lee Spring24 Crawford Spring
5 Barn Spring3 Duncan New4 Duncan Old
1 Mud River Spring
8 Wellhouse window 6 Waterworks
Spring
9 Gasper River rise
Dye-injection sites
(Note: Only sites A, B, and C were used for dye-injection during this study, Sites used by previous investigators are included for information.)
A2
BCDEFGHI
NotNotNotNotNotNotNotNotNot
namednamednamednamednamednamednamednamednamed
A2
AE
FML
Caldwell. fluorescein
Caldwell fluoresceinCaldwell brightener
--Wilson sinkholeHall south sinkholeOaks s wallet
A3
ABCD
Not--
NotNotNotNot
--
named--namednamednamednamed
--
x Not used during this study.2 Same sinkhole, but for this study dye was injected into a different swallet.3 Same swallet used by Quinlan (1982).
10
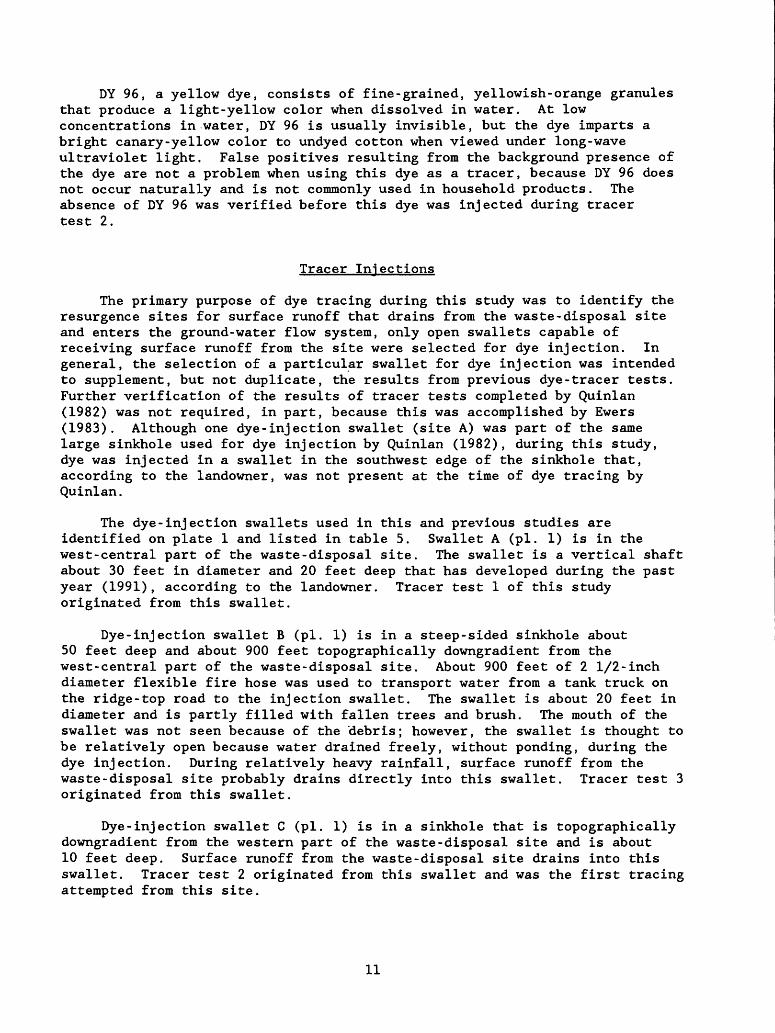
DY 96, a yellow dye, consists of fine-grained, yellowish-orange granules that produce a light-yellow color when dissolved in water. At low concentrations in water, DY 96 is usually invisible, but the dye imparts a bright canary-yellow color to undyed cotton when viewed under long-wave ultraviolet light. False positives resulting from the background presence of the dye are not a problem when using this dye as a tracer, because DY 96 does not occur naturally and is not commonly used in household products. The absence of DY 96 was verified before this dye was injected during tracer test 2.
Tracer Injections
The primary purpose of dye tracing during this study was to identify the resurgence sites for surface runoff that drains from the waste-disposal site and enters the ground-water flow system, only open swallets capable of receiving surface runoff from the site were selected for dye injection. In general, the selection of a particular swallet for dye injection was intended to supplement, but not duplicate, the results from previous dye-tracer tests. Further verification of the results of tracer tests completed by Quinlan(1982) was not required, in part, because this was accomplished by Ewers(1983). Although one dye-injection swallet (site A) was part of the same large sinkhole used for dye injection by Quinlan (1982), during this study, dye was injected in a swallet in the southwest edge of the sinkhole that, according to the landowner, was not present at the time of dye tracing by Quinlan.
The dye-injection swallets used in this and previous studies are identified on plate 1 and listed in table 5. Swallet A (pi. 1) is in the west-central part of the waste-disposal site. The swallet is a vertical shaft about 30 feet in diameter and 20 feet deep that has developed during the past year (1991), according to the landowner. Tracer test 1 of this study originated from this swallet.
Dye-injection swallet B (pi. 1) is in a steep-sided sinkhole about 50 feet deep and about 900 feet topographically downgradient from the west-central part of the waste-disposal site. About 900 feet of 2 1/2-inch diameter flexible fire hose was used to transport water from a tank truck on the ridge-top road to the injection swallet. The swallet is about 20 feet in diameter and is partly filled with fallen trees and brush. The mouth of the swallet was not seen because of the debris; however, the swallet is thought to be relatively open because water drained freely, without ponding, during the dye injection. During relatively heavy rainfall, surface runoff from the waste-disposal site probably drains directly into this swallet. Tracer test 3 originated from this swallet.
Dye-injection swallet C (pi. 1) is in a sinkhole that is topographically downgradient from the western part of the waste-disposal site and is about 10 feet deep. Surface runoff from the waste-disposal site drains into this swallet. Tracer test 2 originated from this swallet and was the first tracing attempted from this site.
11
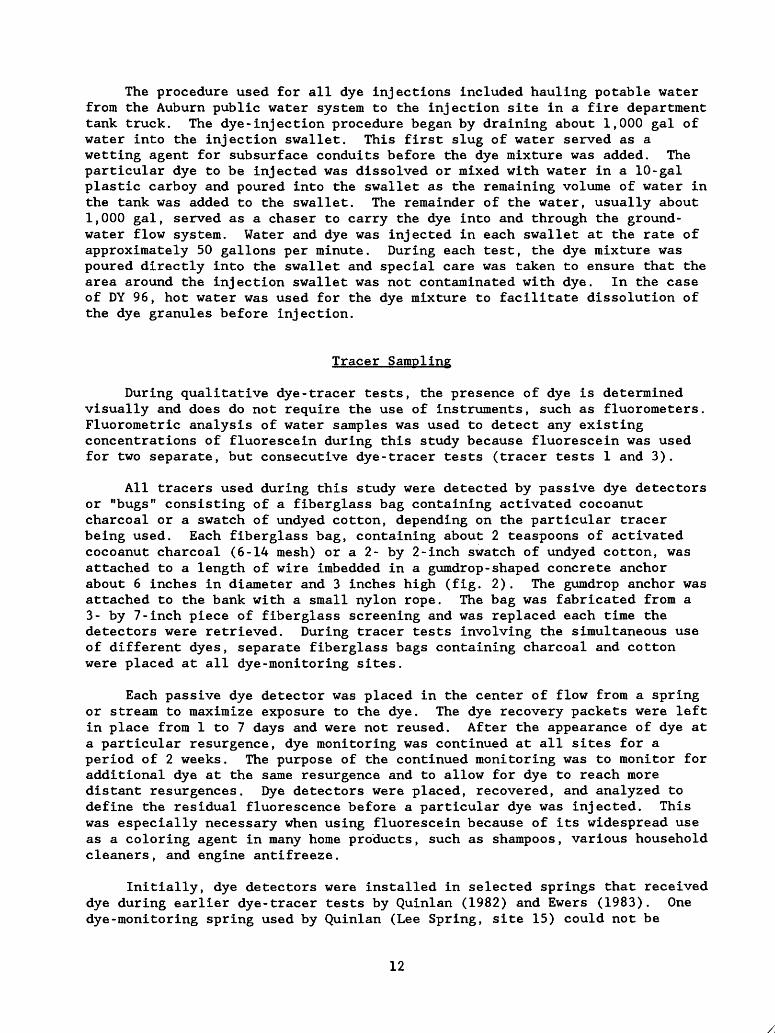
The procedure used for all dye injections included hauling potable water from the Auburn public water system to the injection site in a fire department tank truck. The dye-injection procedure began by draining about 1,000 gal of water into the injection swallet. This first slug of water served as a wetting agent for subsurface conduits before the dye mixture was added. The particular dye to be injected was dissolved or mixed with water in a 10-gal plastic carboy and poured into the swallet as the remaining volume of water in the tank was added to the swallet. The remainder of the water, usually about 1,000 gal, served as a chaser to carry the dye into and through the ground- water flow system. Water and dye was injected in each swallet at the rate of approximately 50 gallons per minute. During each test, the dye mixture was poured directly into the swallet and special care was taken to ensure that the area around the injection swallet was not contaminated with dye. In the case of DY 96, hot water was used for the dye mixture to facilitate dissolution of the dye granules before injection.
Tracer Sampling
During qualitative dye-tracer tests, the presence of dye is determined visually and does do not require the use of instruments, such as fluorometers. Fluorometric analysis of water samples was used to detect any existing concentrations of fluorescein during this study because fluorescein was used for two separate, but consecutive dye-tracer tests (tracer tests 1 and 3).
All tracers used during this study were detected by passive dye detectors or "bugs" consisting of a fiberglass bag containing activated cocoanut charcoal or a swatch of undyed cotton, depending on the particular tracer being used. Each fiberglass bag, containing about 2 teaspoons of activated cocoanut charcoal (6-14 mesh) or a 2- by 2-inch swatch of undyed cotton, was attached to a length of wire imbedded in a gumdrop-shaped concrete anchor about 6 inches in diameter and 3 inches high (fig. 2). The gumdrop anchor was attached to the bank with a small nylon rope. The bag was fabricated from a 3- by 7-inch piece of fiberglass screening and was replaced each time the detectors were retrieved. During tracer tests involving the simultaneous use of different dyes, separate fiberglass bags containing charcoal and cotton were placed at all dye-monitoring sites.
Each passive dye detector was placed in the center of flow from a spring or stream to maximize exposure to the dye. The dye recovery packets were left in place from 1 to 7 days and were not reused. After the appearance of dye at a particular resurgence, dye monitoring was continued at all sites for a period of 2 weeks. The purpose of the continued monitoring was to monitor for additional dye at the same resurgence and to allow for dye to reach more distant resurgences. Dye detectors were placed, recovered, and analyzed to define the residual fluorescence before a particular dye was injected. This was especially necessary when using fluorescein because of its widespread use as a coloring agent in many home products, such as shampoos, various household cleaners, and engine antifreeze.
Initially, dye detectors were installed in selected springs that received dye during earlier dye-tracer tests by Quinlan (1982) and Ewers (1983). One dye-monitoring spring used by Quinlan (Lee Spring, site 15) could not be
12

Nylon cord
( )\ Galvanized \ j\ wire, no. 9
Vinyl-clad copper wire, twisted to hold packet of charcoal
or cotton.
gage
Concrete base, approximately 6 inches in diameter
Figure 2.--Anchor used to suspend dye detectors (bugs) in springs or streams. (Modified from Quinlan, 1987, p. E-8.)
13

located, although the author and the landowner spent considerable effort attempting to locate the spring. Apparently, Lee Spring is a small ephemeral spring with little or no topographic expression, such as a rise pool or stream at its resurgence. During dye-tracer tests 1 and 2, a total of 12 sites were monitored for the presence of dye--11 springs and 1 stream. For the last dye-tracer test during this study (tracer test 3), 1 spring (site 11) and 1 stream (site 5) were added to the dye-monitoring network to further define the pattern of dye recovery. Thus, a total of 14 sites were monitored for dye recovery during dye-tracer test 3. The Auburn water-supply spring was monitored for the presence of dye during all dye-tracer tests performed during this study.
Various quality-control procedures were used during this investigation to prevent contamination of dye detectors from improper handling of dye, dye detectors, or water samples. All dye was transported to the injection site in lock-top plastic boxes or, in the case of premixed liquids, in plastic carboys. Dye-adsorbent activated co.coanut charcoal was stored and transported to the field in tightly-sealed glass containers, and cotton swatches were stored and transported in lock-top plastic bags. Prior to the time of dye injection, usually the day before, all dye detectors were fabricated and installed at all dye-monitoring sites before the dye containers were opened and dye was mixed or injected. Long-sleeved rubber or plastic gloves were worn during all dye-handling operations in the field.
When retrieved, each dye detector was rinsed to remove accumulated sediment and trash. Each recovered dye detector was placed in a lock-top plastic bag and marked with an identification number for return to the laboratory. The lock-top plastic bags were not reused.
All recovered dye detectors and water samples were transported to the laboratory in light-tight containers because some fluorescent dyes photodecay. If dye detectors (charcoal or cotton swatches) were not processed immediately upon arrival at the laboratory, they were stored in a freezer until processed. Fresh elutant was prepared for testing each batch of exposed dye detectors. Samples from each batch of fresh charcoal were tested to verify the absence of fluorescence that might be caused by contaminants. Such fluorescence might cause false positives.
Before being removed from the fiberglass bag in the laboratory, the charcoal was rinsed in a jet of water to remove sediment which can interfere with the analysis. The exposed charcoal from each recovered dye detector was processed in a 400-mL beaker that was covered with aluminum foil to prevent contamination from airborne contaminants. In addition, an uncovered blank of activated charcoal was processed at the same time to verify the absence of airborne contaminants in the detector-processing area in the laboratory.
Samples of injection water were tested fluorometrically to verify the absence of fluorescein. This was especially relevant during this study because of the possibility of unknown dye-tracer tests in the catchment basin of the Auburn spring or other areas. The fluorometer tests indicated that the residual concentration of fluorescein did not exceed 0.05 ppb in water from Auburn that was used for dye injection. This concentration of fluorescein is far below that sufficient to be observed in the qualitative dye-detection
14

procedure used during this study. Only glass bottles were used to collect and transport water samples to the laboratory for fluorometric determination of background concentration of fluorescein.
Tracer Analyses
The presence of fluorescein was determined by eluting the exposed charcoal in an alcohol-potassium hydroxide solution and visually checking for the characteristic yellow-green color in the elutant. Charcoal from the exposed detectors was placed in a 400-mL beaker and covered with about 20 mL of elutant. The elutant consists of 6 to 7 grams of potassium hydroxide dissolved in 100 mL of 70-percent isopropyl alcohol (rubbing alcohol). After the potassium hydroxide dissolves, the solution separates into a supersaturated solution and a saturated solution. Only the lighter saturated solution is decanted into containers with the charcoal.
In strongly positive tests, that is, the monitored resurgence is a major discharge point for the injected dye; the typical yellow-green fluorescein color develops almost immediately upon addition of the elutant. However, in cases where the dye recovery is less concentrated, the color is less obvious and the period of time the charcoal is exposed to the elutant is extended--in some cases during this investigation, as much as 24 hours before the color developed. Where the concentration of recovered fluorescein is low, the characteristic color caused by dye in the elutant may not be visible unless a beam of sunlight or artificial light (microscope lamp) is passed through the solution. The fluorescein color can be seen in the light beam.
The presence of DY 96 is indicated by the characteristic canary-yellow fluorescence when the exposed cotton swatch is viewed under long-wave length ultraviolet light. The fluorescence of DY 96 is enhanced if the exposed cotton is viewed in subdued lighting, such as a viewing box or darkened room. A positive dye recovery is indicated only if the entire cotton mass fluoresces relatively evenly. Scattered specks of fluorescence on the cotton was not interpreted as a positive dye recovery during this investigation.
Description of Dye-Tracer Tests
The qualitative dye-tracer tests completed during this study are summarized in table 6 and shown on plate 1. The dye-tracer tests are numbered sequentially 1 to 3 and are shown as straight lines on plate 1. The lines are not intended to indicate the exact path of ground-water movement, but only a subsurface connection between the various dye-injection swallets and dye-recovery sites. The results of selected dye-tracer tests from previous investigations in the study area (Quinlan, 1982 and Ewers, 1983) are also included in table 6 and shown as curved lines on plate 1.
Dye-Tracer Test 1
Dye-tracer test 1 originated from site A when 5 pounds of fluorescein was flushed into the swallet at 1530 hours on January 21, 1992. This test was
15

Table 6.--Summary of dye-tracer tests
[Note: Dye-tracer test and site identification refers to plate 1]
Dye-tracertest
Dye-injection ___sites
Dye-recovery sitesNumber Name
2QE-1
QE-2
3 E-1
QE-3
QE-4
B
23689
10
12
3689
1011
23
234
15
23
121316
8
Green Boiling SpringDuncan Tiled SpringCoy Wright Blue Hole springMud River SpringMossy SpringLong South Fork
Lagoon SpringGreen Boiling Spring
Duncan Tiled SpringCoy Wright Blue Hole SpringMud River SpringMossy SpringLong South ForkCemetery Road Spring
Lagoon Spring
Green Boiling Spring Duncan Tiled Spring
Green Boiling Spring Duncan Tiled Spring Duncan Natural Well Lee Spring
Green Boiling Spring Duncan Tiled Spring
Barnett Spring Barnett Karst Window Crawford Spring
Mud River Spring
^uinlan (1982).2Quinlan (1982) and Ewers (1983).3 Ewers (1983).
16

performed during relatively low-flow conditions. The discharge from all large springs (Mud River, site 8; Mossy Spring, site 9; and Auburn, site 14) was relatively low and nonturbid during this test, and Green Boiling Spring (site 2) was dry 1 week after the dye injection.
All dye detectors were installed on January 14, 1992 and left in place for a period of 1 week before dye injection on January 21 to detect any residual fluorescein before fluorescein was injected. All dye detectors were negative for fluorescein. One week after the dye injection, on January 28, 1992, the dye detectors from Green Boiling Spring (site 2), Duncan Tiled Spring (site 3), Coy Wright Blue Hole Spring (site 6), Long South Fork (site 10), and Mud River Spring (site 8) all tested positive for fluorescein. On the same day, water in the Coy Wright Blue Hole Spring was brilliant yellow green with fluorescein. A qualitative assessment of the color of the elutant of the dye detectors from the above-mentioned sites indicated that all were strongly positive for fluorescein except Mud River Spring and Long South Fork. Both sites are relatively distant from the dye-injection swallet and, thus, are subject to dilution from undyed water recharging the ground-water flow system and draining to the sites. This is the case at Mud River Spring (site 8) because results of tracing by Quinlan (1982) indicated that Mud River Spring receives water from the area due east of that spring. All of the above-mentioned sites were positive for dye from this injection through February 11, 1992 when dye monitoring for this test was discontinued.
Dye-tracer test 1 provided the first confirmation of multi-directional flow of ground water from the waste site. Review of the dye-recovery data of Quinlan indicates similar dye-recovery patterns during one of his dye-tracer tests (Q-l from site H, 1982). However, Quinlan did not consider the results of that test conclusive because of the possible presence of dye residue from an earlier trace from site D. In light of the results of dye-tracer test 1, it seems likely that dye from the tracer test Q-l (pi. 1) by Quinlan (1987) did follow multi-directional flow paths to drain to Mossy Spring (site 8), to Green Boiling Spring (site 2), and also to Duncan Tiled Spring (site 3).
The time of dye arrival at Mossy Spring during tracer test 1 is unknown because the fiberglass bag was shredded and the charcoal was missing on January 28, 1992, the earliest scheduled detector-recovery date. The detector did show that dye had arrived at Mossy Spring by February 4, 1992. A nearby site, Long South Fork (site 10), was positive for dye on January 28, 1992. Thus, it is likely that dye had arrived at Mossy Spring on January 28, 1992. Dye detectors in both Mossy Spring and Long South Fork were positive for fluorescein on February 4 and 11, 1992.
Dye-Tracer Test 2
Tracer test 2 began at 1630 hours on January 21, 1992, when 6 pounds of DY 96 was flushed into swallet C (pi. 1). The brilliant yellow color of the dye was seen in water from the Lagoon Spring (site 1) at 0910 hours the next day. All dye-monitoring sites south of the injection swallet were visited on January 22, 1992, but dye was seen only in water in Lagoon Spring. The visual detection of dye at Lagoon Spring was caused by a high concentration of dye draining to the spring during relatively low-flow conditions. The estimated
17

discharge from the Lagoon Spring was only 10 gallons per minute on January 22, 1992. Analysis of cotton swatches indicated that dye from this injection was present at Lagoon Spring through February 11, 1992.
The only other dye detector that tested positive for DY 96 during tracer test 2 was at Green Boiling Spring (site 2). At the time the detector was recovered, 0920 hours on January 28, 1992, the cotton swatch exhibited the bright-yellow color of the dye in natural light. This indicates that concentrated dye had drained to this site during the early part of this test when there was sufficient ground-water discharge to cause flow from the spring. However, on January 28 the spring was dry and remained so through February 11, 1992 when dye monitoring for tracer test 2 was terminated.
Dye-Tracer Test 3
Tracer test 3 began from swallet B (pi. 1) when 5 pounds of fluorescein was flushed into the subsurface at 1600 hours on April 28, 1992. Flow conditions during this test were similar to that during dye-tracer tests 1 and 2, that is, generally a period of limited rainfall and declining discharge from dye-monitoring springs. The Green Boiling Spring (site 2) was dry during the time of this test and estimated discharge at other springs was the lowest observed during this study. Dye detectors were maintained in Green Boiling Spring to provide monitoring in case precipitation might cause the spring to discharge during the test. This did not occur during the period of tracer test 3.
Because fluorescein was used for both tracer tests 3 and 1, it was necessary to verify that residual dye from test 1 was not present at the dye-monitoring sites during test 3. Fluorometric tests of water samples collected on April 14, 1992 and analysis of dye detectors collected April 20 and 28 (prior to injection) confirmed that fluorescein was not present. Background concentrations of fluorescein ranged from 0.09 to 0.52 ppb in water draining from the dye-monitoring sites. Apparently, several heavy thunderstorms and the elapsed time was sufficient to allow residual fluorescein from tracer test 1 to drain from the ground-water system.
As with tracer test 1, dye was not observed in the field during inspection of dye-monitoring sites the day after the dye injection for tracer test 3. However, the water in the Coy Wright Blue Hole Spring (site 6) was vivid yellow green with fluorescein 1 week later. This was the only site where the color of fluorescein was observed in the field during tracer test 3. Analysis of recovered dye detectors indicated that the pattern of dye dispersal during tracer test 3 was similar to tracer test 1, that is, the dye detectors from Duncan Tiled (site 3), Coy Wright Blue Hole (site 6), Mud River (site 8), and Mossy springs (site 9) were all positive for fluorescein 1 week after the dye injection in swallet B.
As with tracer test 1, the intensity of dye recovery at Mud River and Mossy springs seemed to be less than at Duncan Tiled and Coy Wright Blue Hole springs. Qualitative assessment of the dye color from the detectors recovered May 11, 1992 indicated that the dye recovery increased at Mossy Spring and also that the dye had reached the Cemetery Road Spring (site 11).
18

Detectors from all these sites tested positive for dye to the end of this test on May 19, 1992. The dye detector in Long South Fork (site 10) was not recovered on May 4, but was positive for dye on May 11, 1 week later. The detector at this site was negative for dye on May 19, 1992.
Results of Dye-Tracer Tests
The results of dye-tracer tests completed during this study, and also by previous investigators (table 6 and pi. 1), indicate that the waste-disposal site is along an east-west trending ground-water divide and that ground water flows from the vicinity of the waste-disposal site to springs south and northwest of the site. Dye was not recovered in springs northeast of the site except in earlier dye-tracer tests (Quinlan, 1982 and Ewers, 1983) when the dye was injected in swallet G near the head of a valley northeast of the site (pi. 1). A dye-tracer test was not performed from swallet G during this study. However, this is not to say that ground-water flow from the site will never flow in a northeasterly direction. It is possible that ground water from the waste site could overflow subsurface drainage divides and flow toward the northeast, especially during high-flow conditions. Additional dye-tracer tests conducted during high-flow conditions are needed to test this possibility.
Results of dye-tracer tests performed during this investigation were similar to the results reported by previous investigators and indicate that ground water flows from the vicinity of the waste-disposal site and discharges at several springs. The pattern of dye recovery in two separate dye-tracer tests (tests 1 and 3) indicates that ground water from the waste-disposal site flows in different directions to separate springs. In both dye-tracer tests 1 and 3, dye was present in water from Mossy Spring (site 9) and Long South Fork (site 10), both of which are northwest of the waste-disposal site, and also in water from Green Boiling Spring (site 2), Duncan Tiled Spring (site 3), Coy Wright Blue Hole Spring (site 7), and Mud River Spring (site 8), south of the site. Dye from tracer test 3 was also present in water from Cemetery Road Spring (site 11) which is near Mossy Spring (site 9) and northwest of the waste-disposal site. Dye from the tracer tests performed during this investigation was not detected in water from the Auburn water-supply spring.
The results of qualitative dye-tracer tests do not provide information on time of travel or velocity of ground-water flow, but because of the visual detection of dye issuing from some springs, an estimate of these characteristics is possible. For example, the dye was observed in Lagoon Spring (site 1), during tracer test 2, about 17 hours after the dye was injected in swallet C. On the basis of the elapsed time between time of injection and observation of dye and the straight line distance between the dye injection and recovery sites, the velocity of ground-water flow during this test was about 0.5 ft/min. Similarly, the visual observation of the dye in the Coy Wright Blue Hole Spring (site 6) during tracer tests 1 and 3 indicates that the time of travel was about 1 week and that the velocity of ground-water flow was about 0.7 ft/min.
For these estimates of travel time and velocity of ground-water flow, it is important to remember that the chance sighting of the dye in the field was
19

a function of the schedule for servicing dye detectors rather than an attempt to define the travel time. Because the leading edge of a dye cloud is usually invisible to the eye and arrives before the mass of dye sufficient to produce a strong color, it is likely that the actual travel time was much less and the flow velocity faster than the estimated value. Even so, the estimated velocity of ground-water flow during these dye-tracer tests is typical of conduit flow during relatively low-flow conditions and demonstrates the potential rate of travel and widespread dispersal once contaminants reach the ground-water flow system in karst terrane. The estimated ground-water velocities in the study area are similar to those reported by Mull and others (1988b, p. 71) in the Elizabethtown area of Kentucky--about 2 to 14 ft/min.
The results of dye-tracer tests completed during this study and by previous investigators have identified several springs that are hydrologically connected to the waste-disposal site. These springs are appropriate sites for monitoring the effects of the waste-disposal site on ground-water quality. To reduce the effect of mixing of water from different parts of the ground- water basin or from nearby basins, water-quality monitoring sites need to be as close to the waste-disposal site as possible. The following springs are suggested as the primary water-quality monitoring springs near the waste-disposal site: Lagoon Spring (site 1), Green Boiling Spring (site 2), Duncan Tiled Spring (site 3), and Mossy Spring (site 9). Mud River Spring (site 8) could be used during low-flow conditions when mixing of water from other ground-water basins is less likely. Because the direction of ground-water flow might change, especially during high-flow conditions, Barnett Spring (site 12), Barnett Karst Window Spring (site 13), and Auburn Spring (site 14) also need to be sampled. If flow conditions are such that Green Boiling Spring is flowing, sampling of Duncan Tiled Spring is unnecessary. If both Green Boiling Spring and Duncan Tiled Spring are dry, the Coy Wright Blue Hole Spring (site 6) should be substituted. If these springs are dry, Mud River Spring (site 2) should be sampled. Mud River Spring seems to be a major discharge point for the ground-water basin that includes the waste site. Because of the distance of the spring from the waste site, Mud River Spring is less desirable as a water-quality monitoring spring than Duncan Tiled Spring, except during relatively high-flow conditions.
Estimates of travel time for movement of tracers from the waste-disposal site to various springs indicate that sampling during, or immediately after a rainfall event, is not likely to produce water samples that are representative of drainage from the waste site. A delay of 3 to 5 days is suggested to allow sufficient time for water from the waste site to arrive at the springs. In the case of the most distant spring (Mud River Spring, site 8) more time may be required. The suggested delay period is based on qualitative assessments made during this investigation. The selection of the delay period is a function of the precipitation and hydrologic conditions at the time of the sampling. Observed increases in discharge and turbidity at a particular spring usually indicate that storm runoff has reached the spring.
In order to improve estimates of travel time between the waste-disposal site and a selected spring, especially during different flow conditions, quantitative dye-tracer tests are needed. Results of quantitative dye-tracer tests can provide estimates of travel time and the percentage of water
20

draining from the waste site to a particular spring. This is relevant because results of qualitative dye-tracer tests, completed during this study, indicate that ground water that flows from two separate swallets near the waste site drains in two different directions to two separate springs. The results of quantitative dye-tracer tests would improve the effectiveness of future sampling programs by ensuring that the particular time selected to collect water samples was appropriate for water-quality monitoring of drainage from the waste site.
Because of unique local conditions, springs may not always offer the only sites appropriate for monitoring of constituents in ground water draining from a waste-disposal site in karst terrane, especially in the study area, where the relatively long distances between the selected springs and the waste site increase the potential for the inflow of water from other ground-water basins. This water could cause dilution sufficient to prevent the detection of various hazardous constituents in water from the springs selected for monitoring.
As a supplement to the monitoring springs selected during this study, a network of shallow wells installed to bedrock and located topographically downgradient from the waste site would monitor the quality of ground water in the residuum overlying bedrock. Because of the nearness of the monitor wells to the waste site, the potential for dilution would be decreased. Dye-tracer tests would be needed to confirm the hydrologic connection between the monitor wells and the waste site.
SUMMARY AND CONCLUSIONS
The study area is in the Mississippian Plateaus region of west-central Kentucky and is underlain by as much as 70 feet of sandstone and shale overlying massive limestone units as much as 200 feet thick. The waste-disposal site is along a ridge that is about 170 feet above the surrounding valleys. Karst landforms, such as sinkholes with swallets, and springs, are common, especially in the broad valleys that generally surround the ridge.
In the study area, ground water is present and moves through primary and secondary openings in carbonate bedrock as well as through the overlying soil and residuum. Observed variations in spring discharge and the results of qualitative dye-tracer tests indicate that a major component of ground-water flow near the waste-disposal site is by way of solution enlarged openings or conduits in carbonate bedrock.
Results of qualitative dye-tracer tests indicate that the waste-disposal site is along a ground-water divide. Various fluorescent tracers that were injected in swallets, onsite or topographically downgradient from the waste-disposal site, were detected only in water from springs in valleys south and northwest of the site. None of the dye tracers used during this investigation were detected in water from springs due north of the waste site. However, several springs that drain to the north did receive dye during tracer tests performed by previous investigators, but only where the dye-injection swallet was on the northern side of the ridge where the waste-disposal site is located.
21
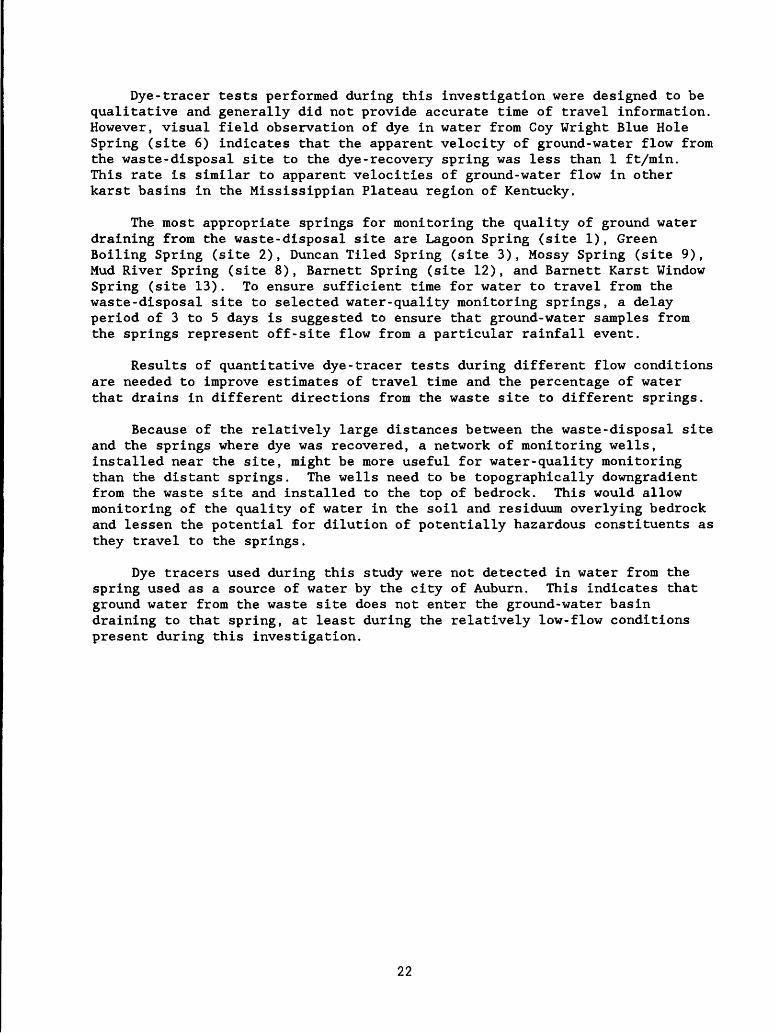
Dye-tracer tests performed during this investigation were designed to be qualitative and generally did not provide accurate time of travel information. However, visual field observation of dye in water from Coy Wright Blue Hole Spring (site 6) indicates that the apparent velocity of ground-water flow from the waste-disposal site to the dye-recovery spring was less than 1 ft/min. This rate is similar to apparent velocities of ground-water flow in other karst basins in the Mississippian Plateau region of Kentucky.
The most appropriate springs for monitoring the quality of ground water draining from the waste-disposal site are Lagoon Spring (site 1), Green Boiling Spring (site 2), Duncan Tiled Spring (site 3), Mossy Spring (site 9), Mud River Spring (site 8), Barnett Spring (site 12), and Barnett Karst Window Spring (site 13). To ensure sufficient time for water to travel from the waste-disposal site to selected water-quality monitoring springs, a delay period of 3 to 5 days is suggested to ensure that ground-water samples from the springs represent off-site flow from a particular rainfall event.
Results of quantitative dye-tracer tests during different flow conditions are needed to improve estimates of travel time and the percentage of water that drains in different directions from the waste site to different springs.
Because of the relatively large distances between the waste-disposal site and the springs where dye was recovered, a network of monitoring wells, installed near the site, might be more useful for water-quality monitoring than the distant springs. The wells need to be topographically downgradient from the waste site and installed to the top of bedrock. This would allow monitoring of the quality of water in the soil and residuum overlying bedrock and lessen the potential for dilution of potentially hazardous constituents as they travel to the springs.
Dye tracers used during this study were not detected in water from the spring used as a source of water by the city of Auburn. This indicates that ground water from the waste site does not enter the ground-water basin draining to that spring, at least during the relatively low-flow conditions present during this investigation.
22

REFERENCES
Dye, J.W., Barton, A.J., and Froedge, R.D., 1975, Soil survey of Logan County, Kentucky: U.S. Department of Agriculture, Soil Conservation Service, 78 p.
Ewers, R.O., 1983, Groundwater flow directions in the vicinity of CaldwellLace Leather Company, Inc. landspreading site: unpublished consultant's report, 9 p.
Gildersleeve, Benjamin, 1966, Geologic map of the Homer quadrangle, Kentucky: U.S. Geological Survey Geologic Quadrangle Map 549, scale 1:24,000, 1 sheet.
Gunn, John, 1986, A conceptual model for conduit flow dominated karstaquifers, in Gunay, G., and Johnson, A.I., eds., Karst Water Resources: International Association for Scientific Hydrology, publication no. 161, p. 587-596.
Klemic, Harry, 1963, Geologic map of the South Union quadrangle, Kentucky: U.S. Geological Survey Geologic Quadrangle Map 275, scale 1:24,000, 1 sheet.
McFarlan, A.C., 1943, Geology of Kentucky: Lexington, Kentucky, University of Kentucky, 531 p.
Mull, D.S., Liebermann, T.D., Smoot, J.L., and Woosley, L.H., Jr., 1988a,Application of dye-tracing techniques for determining solute-transport characteristics of ground water in karst terranes: EPA 904/6-88-001, Atlanta, Ga., U.S. Environmental Protection Agency, 103 p.
Mull, D.S., Smoot, J.L., and Liebermann, T.D., 1988b, Dye tracing techniques used to determine ground-water flow in a carbonate aquifer system near Elizabethtown, Kentucky: U.S. Geological Survey Water-Resources Investigations Report 87-4174, 95 p.
Quinlan, J.F., 1982, Interpretation of dye-tests and related studies, Caldwell Lace Leather Company waste disposal sites Logan Co., Kentucky: unpublished consultant's report, 35 p.
____ 1986, Recommended procedures for evaluating the effects of spills ofhazardous material on ground water quality in karst terranes, in Environmental Problems in Karst Terranes and Their Solutions Conference Bowling Green, Kentucky, October 28-30, 1986, Proceedings, p. 183-196.
1987, Qualitative water-tracing with dye in karst terrane, in Quinlan, J.F., ed., Practical Karst Hydrogeology, with Emphasis on Ground-water Monitoring (course manual): National Water Well Association, Dublin, Ohio, v. 6, p. E1-E24.
23
Rainey, H.C., 1965a, Geologic map of the Auburn quadrangle, Kentucky: U.S. Geological Survey Geologic Quadrangle Map GQ-415, scale 1:24,000, 1 sheet.
____ 1965b, Geologic map of the Dennis quadrangle, Kentucky: U.S. Geological Survey Geologic Quadrangle Map 450, scale 1:24,000, 1 sheet.
Society of Dyers and Colourists and American Association of Textile Chemists, 1971-1982, Colour Index, 3rd ed.: Bradford, 7 v., 6,640 p.
24

SUPPLEMENTAL DATA
25

Table 1.--Wells in 1-mile radius of waste-disposal site
[- -, no data]
Map number
111111111111
.1
.2
.3
.4
.5
.6
.7
.8
.9
.10
.11
.12
Latitude longitude
365248365242365247365252365246365253365256365222365306365151365143365157
864529864533864549864535864519864535864527864446864445864524864503864508
Owner Depth of well (feet)
Barry ReevesBobby ReevesUnknownBarry SearsW.D. ReevesBarry SearsClyde BoggsCaldwell domestic wellBuddy WilsonMrs . Dillard DuncanH.T. HulseH.T. Hulse
57818799359052
Depth to Date water measured (feet)
32546240261713
MayMayMayMayMayMayMay
7,9,7,
17,15,17,7,
1990199019901990199019901990
Remarks
JetNoNoNoNoNoJet
pumppumppumppumppumppumppump
Locked47175075
266
3535
MayMayMayMay
16,18,8,8,
1990199019901990
NoJetJetJet
pumppumppumppump
Table 2.--Springs in 1-mile radius of waste-disposal site
[gal/min, gallons per minute; specific conductance as microsiemens per centimeter at 25 degrees Celsius]
Map number
Latitude longitude
Owner Discharge (gal/min)
Specific conductance
Date Use
1.13 365311 8645301.14 365208 8645041.15 365208 8644241.16 365246 8644511.17 365250 864430
David Thomas 25H.T. Hulse 1Marvin Hudson 1Bobby Wilson 20Bobby Wilson 4
370280440430340
May 15 May 16 May 16 May 17
1990199019901990
May 17, 1990
DomesticDomesticStockStockStock
26

Table 3.--Wells and springs in 2-mile radius of waste-disposal site
[--, no data; gal/min, gallons per minute]
Map number
Latitude lonEJtude
Owner Type Remarks (Depth, discharge, use)
2.12.22.32.42.52.62.72.82.92.102.112.122.132.142.152.162.172.182.192.202.212.222.232.242.252.262.272.282.292.302.312.322.33
365307365306365218365214365149365206365202365258365256365127365142365134365128365115365116365116365312365151365326365309365321365344365352365355365357365140365342365405365217365250365129365223365249
864657864637864650864646864639864625864622864610864609864613864557864552864526864508864507864507864347864422864423864313864413864411864410864357864358864404864347864507864323864314864433864306864257
Carnell Mason DrilledAppling DrilledUnknown DrilledEarl Gipson DrilledEaton DrilledThomas DrilledFloyd Gipson DrilledMarion Pugh DrilledMarion Pugh SpringBoyce Coles SpringCoy Wright DrilledJoe Duncan DrilledH. Craigs Farm DrilledLillian Johnson DrilledWeldon Price Drilled Willard Childrees DrilledUnknown DrilledUnknown DrilledCharlie Barnett DrilledUnknown DrilledBobby Poor DrilledMae Lashley DrilledBlewett DrilledBarrett tenant DrilledBarrett Dairy SpringRoger Fielding DrilledH. Poole DrilledUnknown DrilledCarl Hodges DrilledAlbert Summers DrilledUnknown DrilledAlbert Summers SpringMrs. Stone Drilled
Domestic 51 feet
DomesticDomesticDomesticDomesticDomestic25 gal/min, stockDomesticPump inoperableDomesticPump inoperableDomesticUnused60 feet, unusedNo pumpNo contactPump inoperablePump inoperableDomesticDomesticDomestic75 feet, domestic450 gal/minNot for drinkingPump inoperableNo pumpNot for drinkingDomesticNo contactKarst-window rise poolLawn watering only
27
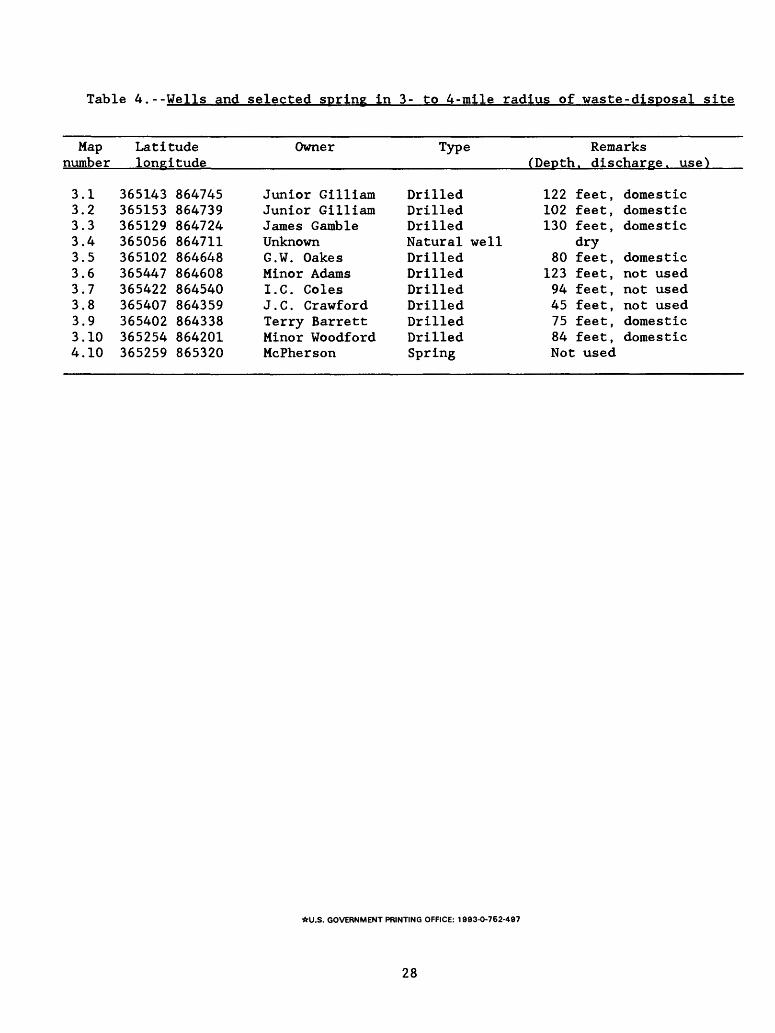
Table 4.--Wells and selected soring in 3- to 4-mile radius of waste-disposal site
Map number
3.3.3.3.3.3.3.3.3.3.4.
1234567891010
Latitude longitude
365143365153365129365056365102365447365422365407365402365254365259
864745864739864724864711864648864608864540864359864338864201865320
Owner
Junior GilliamJunior GilliamJames GambleUnknownG.W. OakesMinor AdamsI.C. ColesJ . C . Crawf ordTerry BarrettMinor WoodfordMcPherson
Type
DrilledDrilledDrilledNatural wellDrilledDrilledDrilledDrilledDrilledDrilledSpring
(DeDth
122102130
8012394457584Not
Remarks . discharge, use)
feet,feet,feet,dryfeet,feet,feet,feet,feet,feet,used
domesticdomesticdomestic
domesticnot usednot usednot useddomesticdomestic
*U.S. GOVERNMENT PRINTING OFFICE: 1883-0-762-497
28