Embed Size (px)
Citation preview
7/18/2013
Mike Contreras 1
FMS in the Occupationaland Tactical Settings:
Ideas for Group TrainingMichael Contreras, CSCS,FMS,RKC,USAW
Battalion ChiefOrange County Fire Authority
ACE Peer Fitness Trainer - March 2003Athletes Performance Firefighter Mentorship - January 2004Crossfit Level 1and 2 - January 2005Chek Level 1Crossfit Olympic LiftingAthletes Performance Mentorship 1RKCUSAW Performance CoachNSCA ConferenceCSCS
FMS - January 2006Athletes Performance Mentorship 2CK-FMSAthletes Performance Mentorship 3RKC Level 2Athletes Performance Mentorship 4TRXTRX RIP TrainerCrossfit StrongmanCrossfit MobilityTRX Sports MedicineEgoscue Certification
Fitness Doesn't = Injury Prevention
What is a Tactical Athlete?Tactical Athletes put themselves in harms way to assist and protect others in the course of their jobs, duties, or profession.
What is an Occupational Athlete?Occupational Athletes use their bodies in the course of their daily duties, job, or profession.
At what level of performance do your athletes need to operate?What do you want your training
program produce?80% of our team at 100% capacity 80% of the time?
90% of our team at 90% capacity 90% of the time?
100% of our team at 80% capacity 100% of the time
7/18/2013
Mike Contreras 2
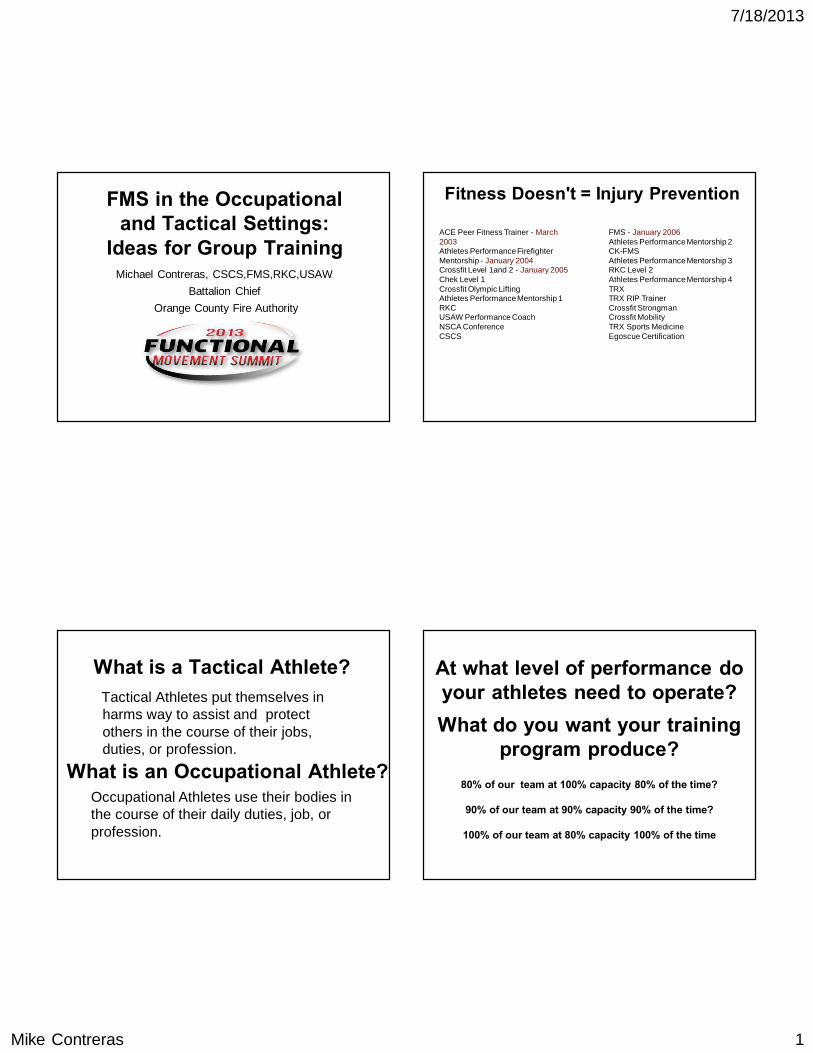
Tactical Decision MakingRisk-What are the risks associated with the various options available to you? Given the nature of the mission, are the risks acceptable and manageable? Is the risk worth the benefit? In general, the default is the lowest risk option that meets the needs of the mission. Liability risks are also part of this areaNeed-What are the needs of the mission/situation that you are in? Why are you there? Is it an arrest, public safety issue, warrant service, military exercise, prisoner snatch, drug raid, etc.? What needs to be accomplished?Time-Is time on your side or working against you? In general, the shorter the time available to you to accomplish the mission, the higher the risk factors on the available options left.Resources Available-What resources can you access during the mission/situation with the time available to you?Decision-Needs of the mission, available options, associated risks, resources available in the time constraints and is time working for you or against you?Risk vs. Need ÷ Time + Resources Available = Decision *
Working with any athlete is about
Resource Allocation and
Risk Management!
The earlier we can identify who is at risk, the better it is for everyone!
Who is at risk for injury?
Typical Performance and Conditioning
Plyometric Power
Strength Agility
Speed
The Dysfunctional Performance Pyramid
7/18/2013
Mike Contreras 3
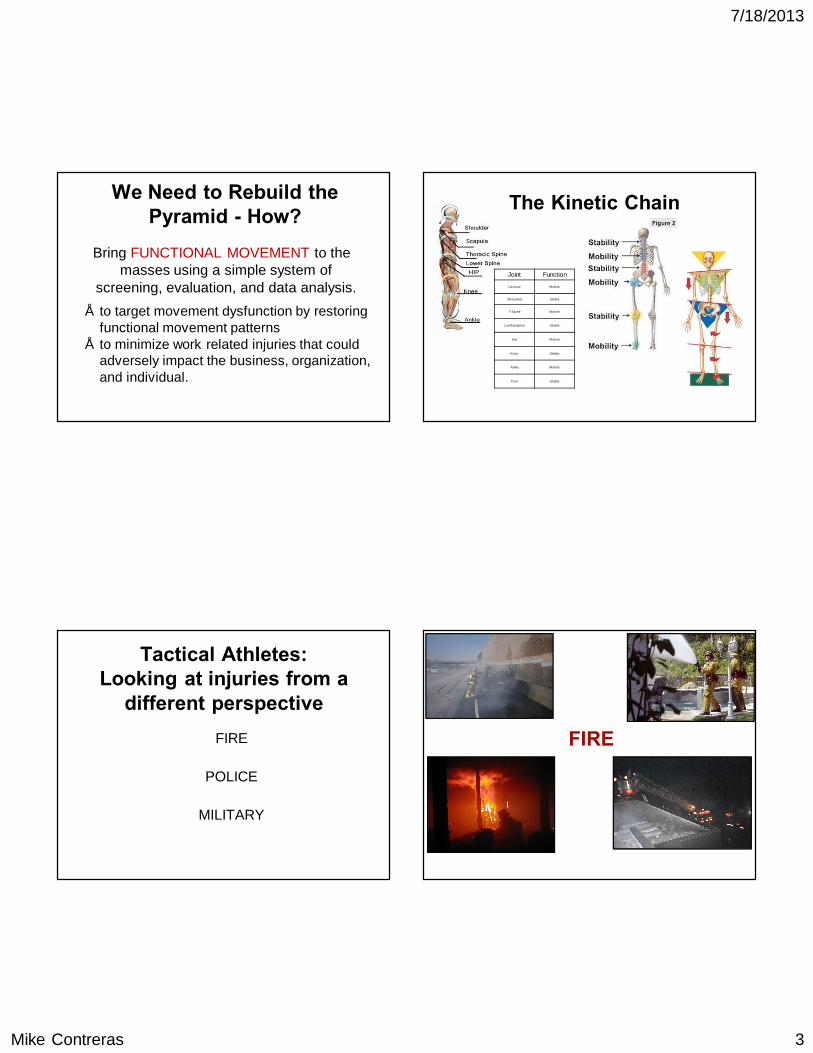
We Need to Rebuild the Pyramid - How?
Bring FUNCTIONAL MOVEMENT to the masses using a simple system of
screening, evaluation, and data analysis.• to target movement dysfunction by restoring
functional movement patterns • to minimize work related injuries that could
adversely impact the business, organization, and individual.
The Kinetic Chain
Joint Function
Cervical Mobile
Shoulders Stable
T-Spine Mobile
Lumbar Spine Stable
Hip Mobile
Knee Stable
Ankle Mobile
Foot Stable
Tactical Athletes:Looking at injuries from a
different perspectiveFIRE
POLICE
MILITARY
FIRE
7/18/2013
Mike Contreras 4
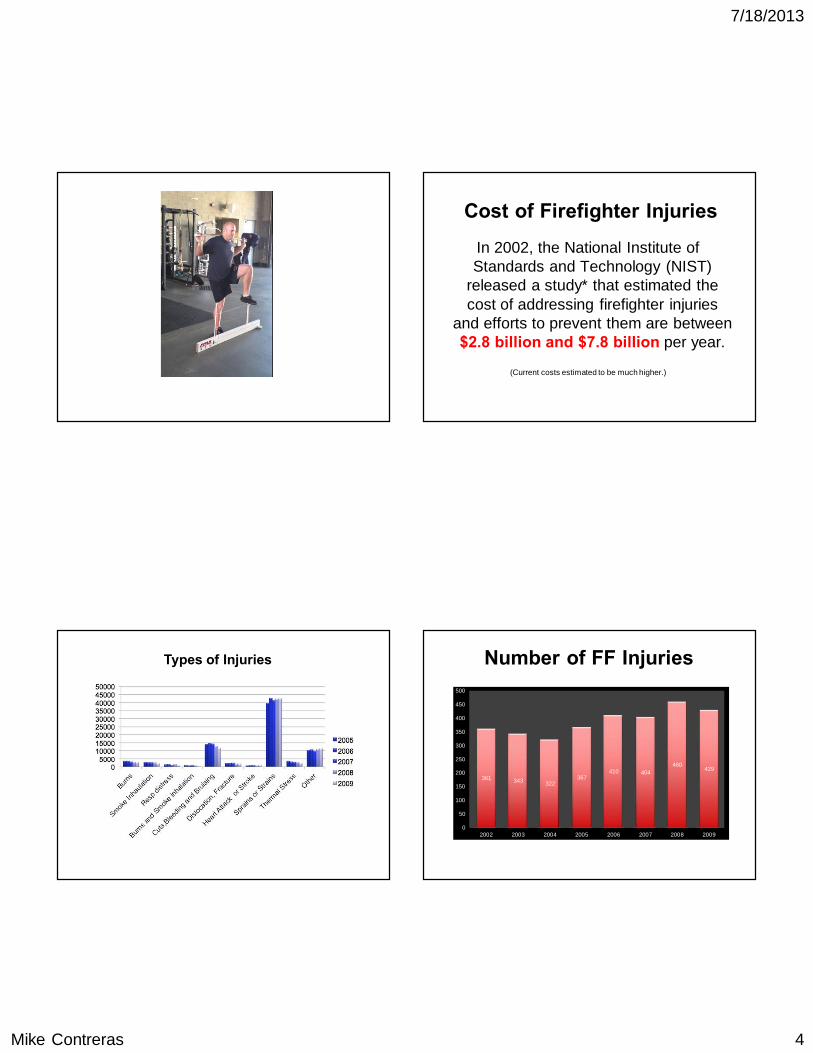
Cost of Firefighter Injuries
In 2002, the National Institute of Standards and Technology (NIST)
released a study* that estimated the cost of addressing firefighter injuries
and efforts to prevent them are between $2.8 billion and $7.8 billion per year.
(Current costs estimated to be much higher.)
Types of Injuries Number of FF Injuries
361 343 322367
410 404460
429
0
50
100
150
200
250
300
350
400
450
500
2002 2003 2004 2005 2006 2007 2008 2009
7/18/2013
Mike Contreras 5
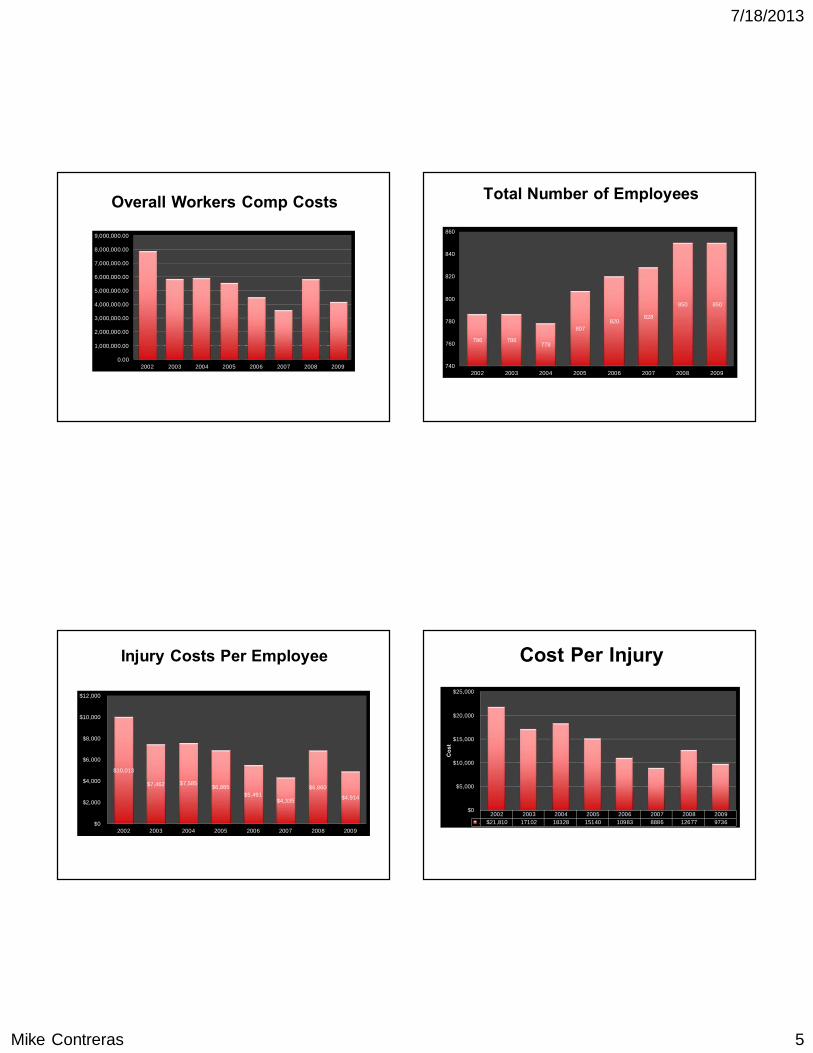
Overall Workers Comp Costs
0.00
1,000,000.00
2,000,000.00
3,000,000.00
4,000,000.00
5,000,000.00
6,000,000.00
7,000,000.00
8,000,000.00
9,000,000.00
2002 2003 2004 2005 2006 2007 2008 2009
Total Number of Employees
786 786778
807820
828
850 850
740
760
780
800
820
840
860
2002 2003 2004 2005 2006 2007 2008 2009
Injury Costs Per Employee
$10,013
$7,462 $7,585 $6,885
$5,491 $4,335
$6,860
$4,914
$0
$2,000
$4,000
$6,000
$8,000
$10,000
$12,000
2002 2003 2004 2005 2006 2007 2008 2009
Cost Per Injury
2002 2003 2004 2005 2006 2007 2008 2009. $21,810 17102 18328 15140 10983 8886 12677 9736
$0
$5,000
$10,000
$15,000
$20,000
$25,000
Cos
t
7/18/2013
Mike Contreras 6
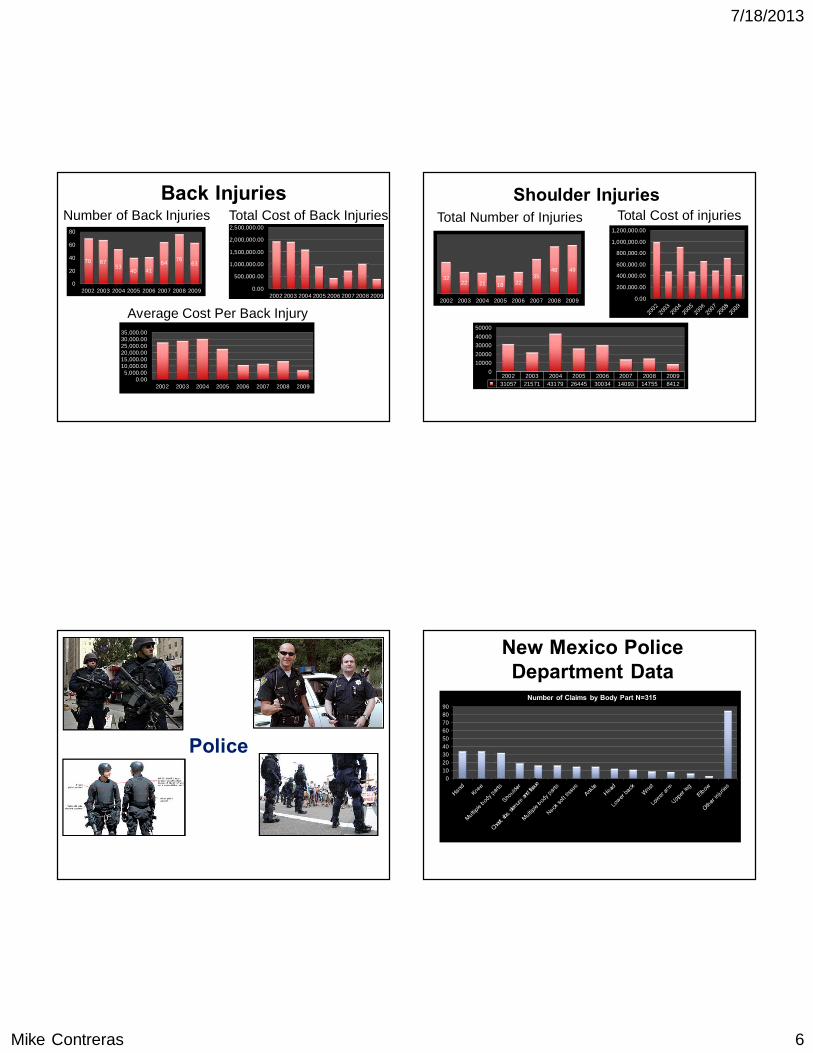
Back Injuries
70 6753
40 4164
7663
0
20
40
60
80
2002 2003 2004 2005 2006 2007 2008 2009
Number of Back Injuries
0.00
500,000.00
1,000,000.00
1,500,000.00
2,000,000.00
2,500,000.00
2002 2003 2004 2005 2006 2007 2008 2009
Total Cost of Back Injuries
0.005,000.00
10,000.0015,000.0020,000.0025,000.0030,000.0035,000.00
2002 2003 2004 2005 2006 2007 2008 2009
Average Cost Per Back Injury
Shoulder Injuries
3222 21 18 22
3548 49
2002 2003 2004 2005 2006 2007 2008 2009 0.00
200,000.00
400,000.00
600,000.00
800,000.00
1,000,000.00
1,200,000.00
Total Number of Injuries Total Cost of injuries
2002 2003 2004 2005 2006 2007 2008 2009. 31057 21571 43179 26445 30034 14093 14755 8412
01000020000300004000050000
Police
New Mexico Police Department Data
0102030405060708090
Number of Claims by Body Part N=315
7/18/2013
Mike Contreras 7
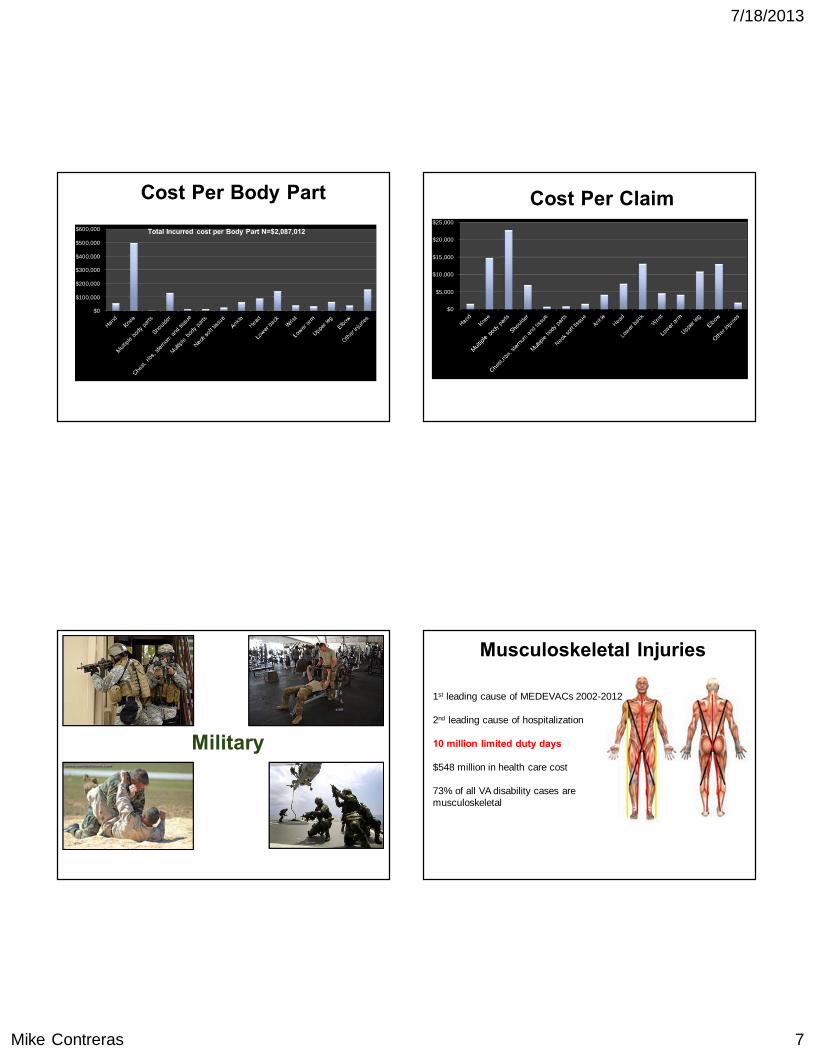
Cost Per Body Part
$0
$100,000
$200,000
$300,000
$400,000
$500,000
$600,000 Total Incurred cost per Body Part N=$2,087,012
Cost Per Claim
$0
$5,000
$10,000
$15,000
$20,000
$25,000
Military
1st leading cause of MEDEVACs 2002-2012
2nd leading cause of hospitalization
10 million limited duty days
$548 million in health care cost
73% of all VA disability cases are musculoskeletal
Musculoskeletal Injuries
7/18/2013
Mike Contreras 8
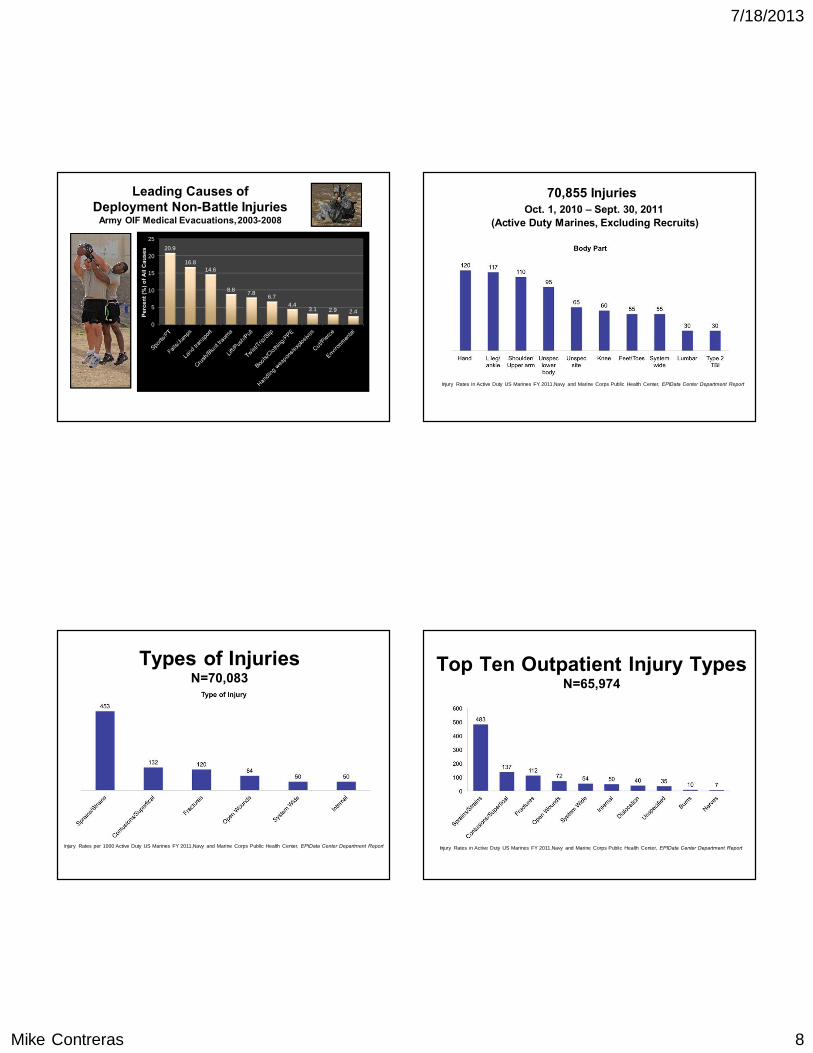
Leading Causes of Deployment Non-Battle Injuries
Army OIF Medical Evacuations,2003-2008
Source: USACHPPM Deployment Injury Surveillance System
20.9
16.814.6
8.8 7.86.7
4.43.1 2.9 2.4
0
5
10
15
20
25
Perc
ent (
%) o
f All
Cau
ses
70,855 Injuries Oct. 1, 2010 – Sept. 30, 2011
(Active Duty Marines, Excluding Recruits)
Injury Rates in Active Duty US Marines FY 2011,Navy and Marine Corps Public Health Center, EPIData Center Department Report
Types of InjuriesN=70,083
Injury Rates per 1000 Active Duty US Marines FY 2011,Navy and Marine Corps Public Health Center, EPIData Center Department Report
Top Ten Outpatient Injury TypesN=65,974
Injury Rates in Active Duty US Marines FY 2011,Navy and Marine Corps Public Health Center, EPIData Center Department Report
7/18/2013
Mike Contreras 9
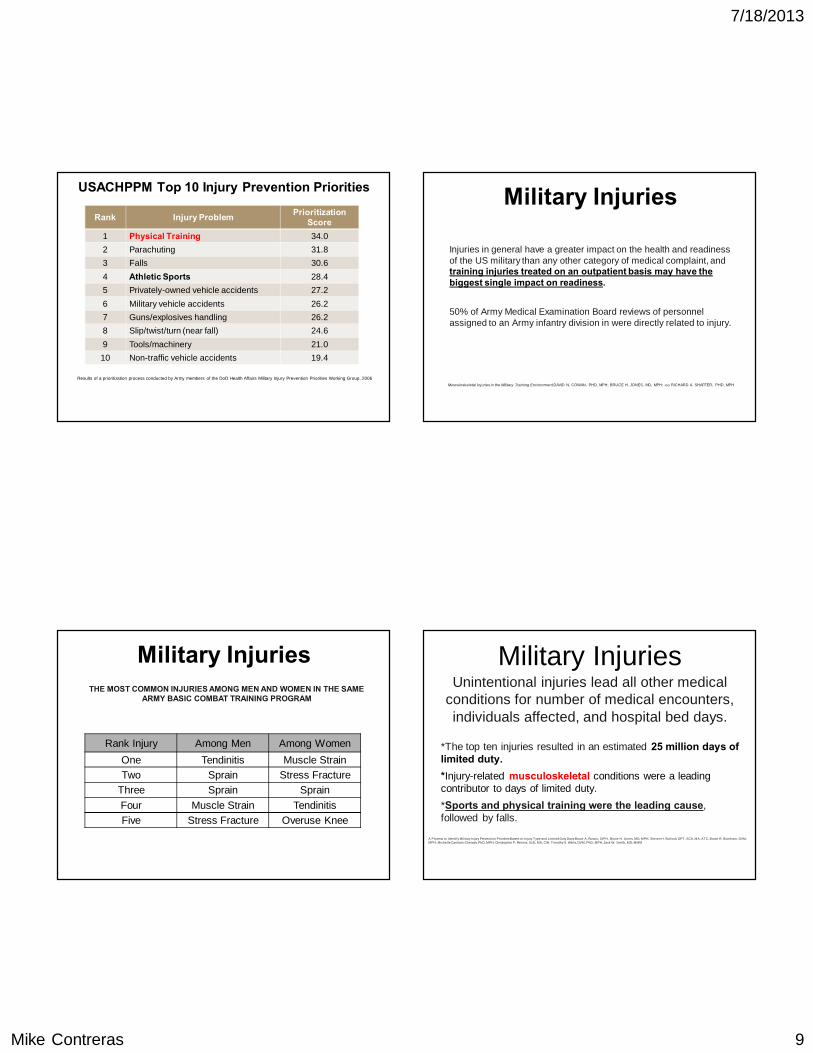
USACHPPM Top 10 Injury Prevention Priorities
Rank Injury Problem PrioritizationScore
1 Physical Training 34.02 Parachuting 31.83 Falls 30.64 Athletic Sports 28.45 Privately-owned vehicle accidents 27.26 Military vehicle accidents 26.27 Guns/explosives handling 26.28 Slip/twist/turn (near fall) 24.69 Tools/machinery 21.010 Non-traffic vehicle accidents 19.4
Results of a prioritization process conducted by Army members of the DoD Health Affairs Military Injury Prevention Priorities Working Group, 2006
Military Injuries
Injuries in general have a greater impact on the health and readiness of the US military than any other category of medical complaint, andtraining injuries treated on an outpatient basis may have the biggest single impact on readiness.
50% of Army Medical Examination Board reviews of personnel assigned to an Army infantry division in were directly related to injury.
Musculoskeletal Injuries in the Military Training Environment,DAVID N. COWAN, PHD, MPH; BRUCE H. JONES, MD, MPH; AND RICHARD A. SHAFFER, PHD, MPH
Military InjuriesTHE MOST COMMON INJURIES AMONG MEN AND WOMEN IN THE SAME
ARMY BASIC COMBAT TRAINING PROGRAM
Rank Injury Among Men Among WomenOne Tendinitis Muscle StrainTwo Sprain Stress Fracture
Three Sprain SprainFour Muscle Strain TendinitisFive Stress Fracture Overuse Knee
*The top ten injuries resulted in an estimated 25 million days of limited duty.*Injury-related musculoskeletal conditions were a leading contributor to days of limited duty.*Sports and physical training were the leading cause, followed by falls.
Military InjuriesUnintentional injuries lead all other medical
conditions for number of medical encounters, individuals affected, and hospital bed days.
A Process to Identify Military Injury Prevention Priorities Based on Injury Type and Limited Duty Days:Bruce A. Ruscio, DrPH, Bruce H. Jones, MD, MPH, Steven H. Bullock, DPT, SCS, MA, ATC, Bruce R. Burnham, DVM, MPH, Michelle Canham-Chervak, PhD, MPH, Christopher P. Rennix, ScD, MS, CIH, Timothy S. Wells, DVM, PhD, MPH, Jack W. Smith, MD, MMM
7/18/2013
Mike Contreras 10
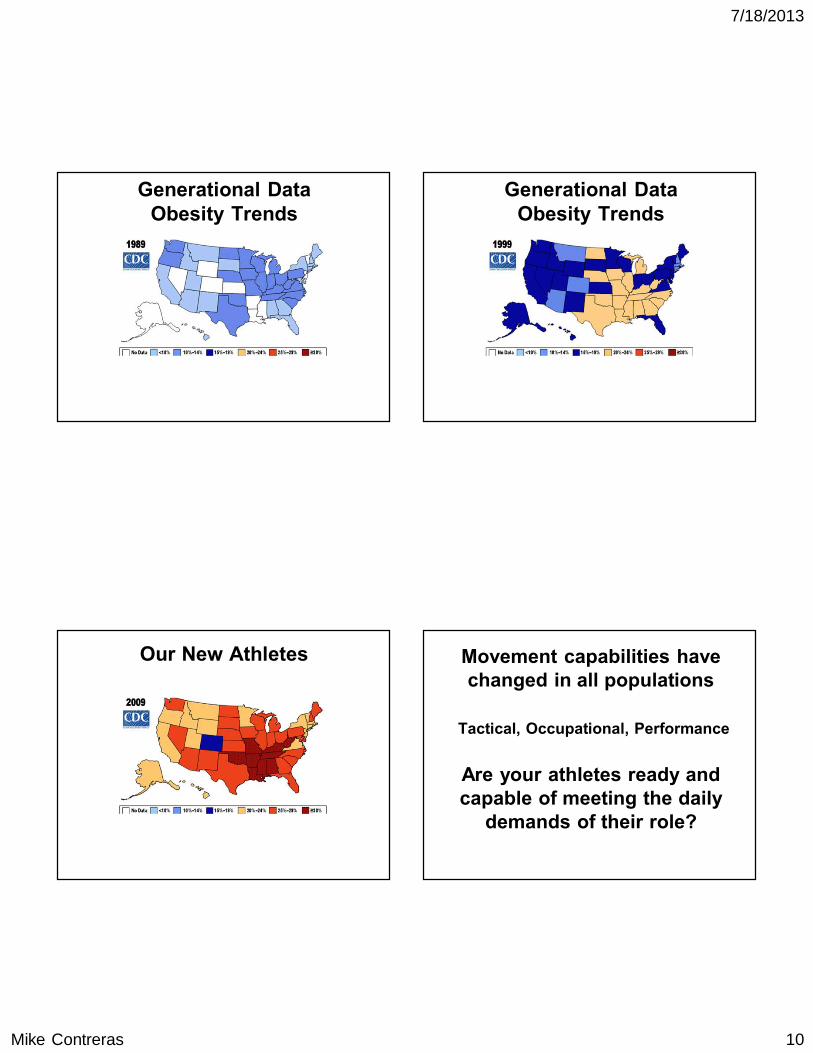
Generational DataObesity Trends
Generational DataObesity Trends
Our New Athletes Movement capabilities have changed in all populations
Tactical, Occupational, Performance
Are your athletes ready and capable of meeting the daily
demands of their role?
7/18/2013
Mike Contreras 11
Total Workers’ Compensation payments for injured US workers
in 2007 = $55.4 billion
($27.2 billion for medical care,$27.3 billion in wage replacement benefits)
Employers paid $85 billion for workers' compensationin 2007 - an average of2.28% of their payrolls.
The Long Term Costs of Injured Employees
Unknown & unfunded short and long-term liabilities• Increased medical benefit utilization
• Increased medical premiums
• Increased Workers’ Compensation costs (if self insured, reserves need to increase)
• Increased retirement costs
• Lost productivity and compromised readiness
• Filling vacated positions
Medical Costs
Text
7/18/2013
Mike Contreras 12
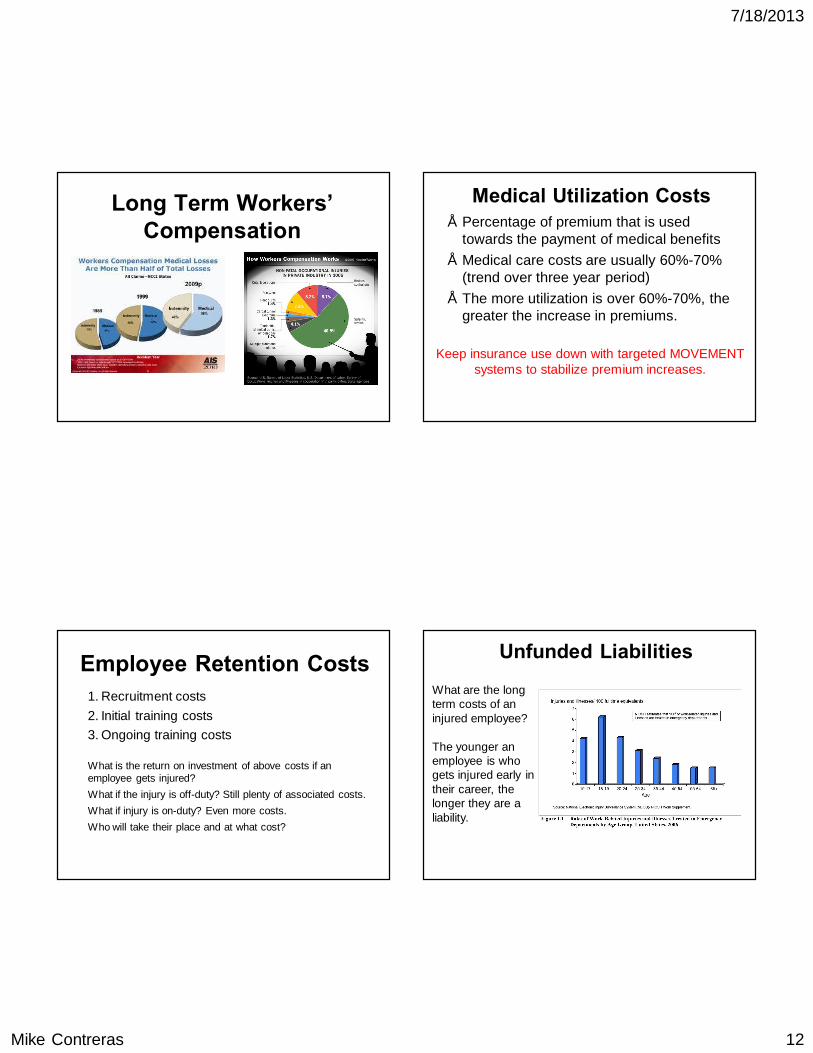
Long Term Workers’ Compensation
Medical Utilization Costs• Percentage of premium that is used
towards the payment of medical benefits• Medical care costs are usually 60%-70%
(trend over three year period)• The more utilization is over 60%-70%, the
greater the increase in premiums.
Keep insurance use down with targeted MOVEMENT systems to stabilize premium increases.
Employee Retention Costs1. Recruitment costs2. Initial training costs3. Ongoing training costs
What is the return on investment of above costs if an employee gets injured?What if the injury is off-duty? Still plenty of associated costs.What if injury is on-duty? Even more costs.Who will take their place and at what cost?
Unfunded Liabilities
What are the long term costs of an injured employee?
The younger an employee is who gets injured early in their career, the longer they are a liability.
7/18/2013
Mike Contreras 13
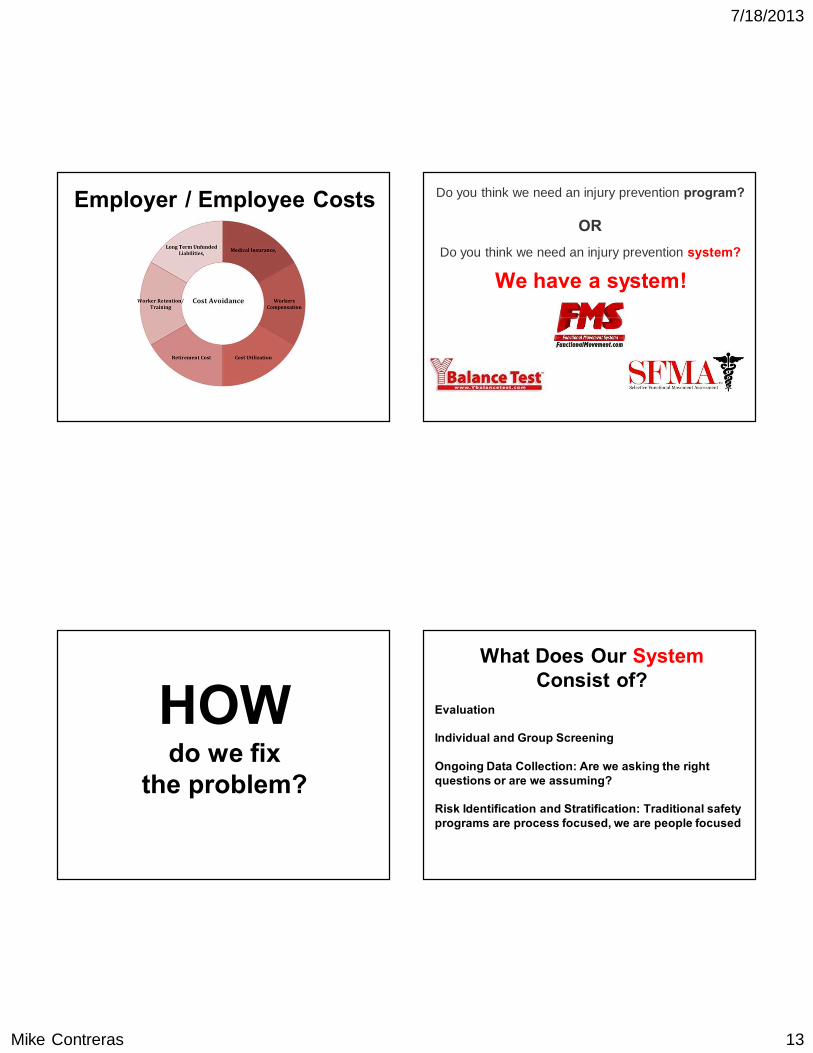
Employer / Employee Costs Do you think we need an injury prevention program?
ORDo you think we need an injury prevention system?
We have a system!
HOWdo we fix
the problem?
Evaluation
Individual and Group Screening
Ongoing Data Collection: Are we asking the right questions or are we assuming?
Risk Identification and Stratification: Traditional safety programs are process focused, we are people focused
What Does Our SystemConsist of?
7/18/2013
Mike Contreras 14
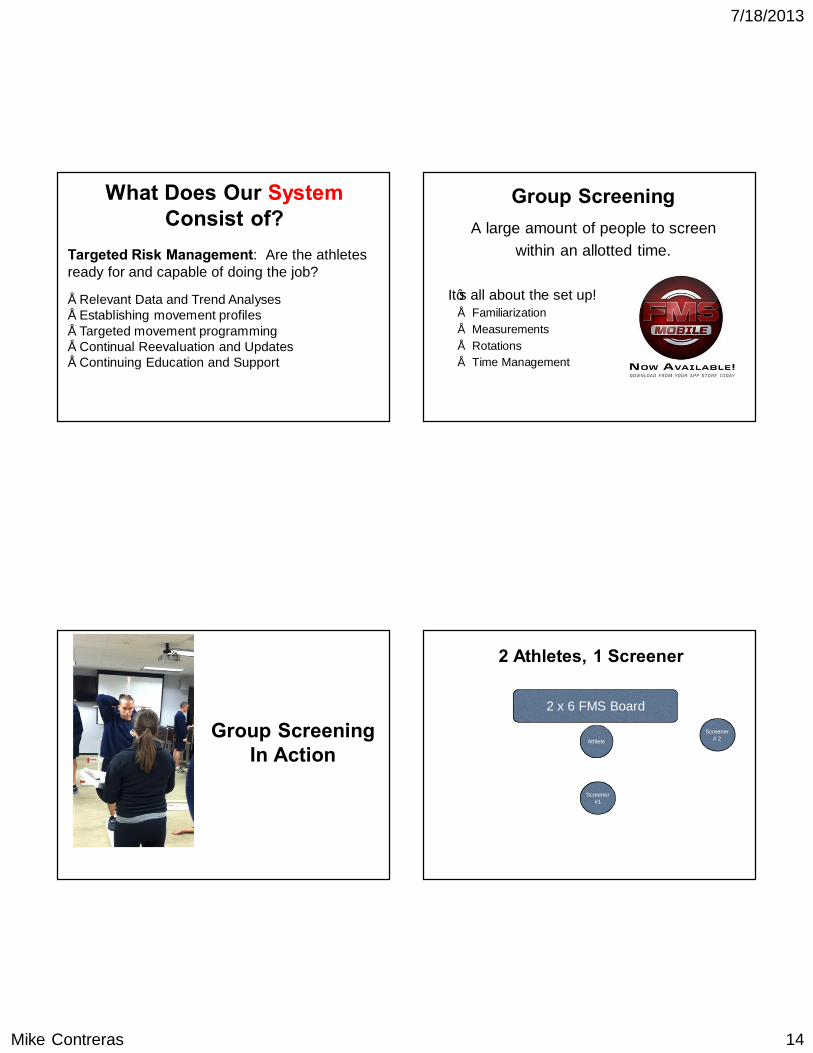
What Does Our SystemConsist of?
Targeted Risk Management: Are the athletes ready for and capable of doing the job?
• Relevant Data and Trend Analyses• Establishing movement profiles• Targeted movement programming• Continual Reevaluation and Updates• Continuing Education and Support
Group ScreeningA large amount of people to screen
within an allotted time.
It’s all about the set up!• Familiarization • Measurements• Rotations• Time Management
Group ScreeningIn Action
2 Athletes, 1 Screener
2 x 6 FMS Board
Athlete
Screener # 2
Screener #1
7/18/2013
Mike Contreras 15
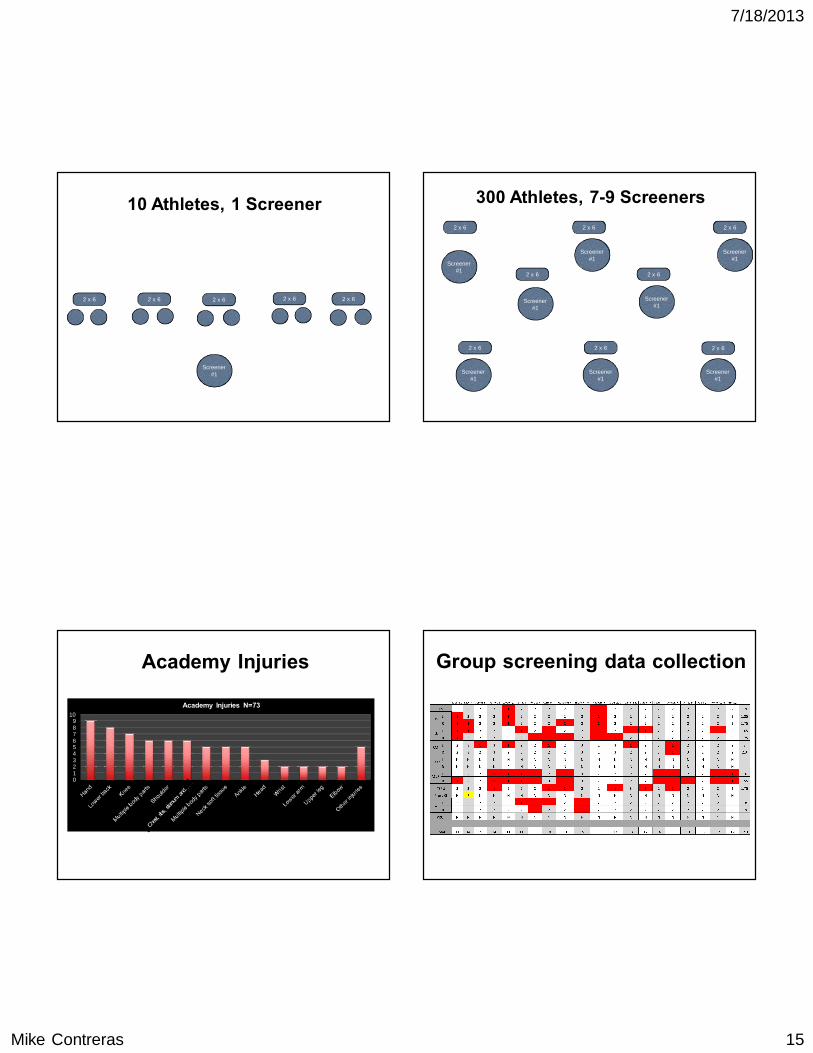
2 x 6 2 x 62 x 62 x 62 x 6
10 Athletes, 1 Screener
Screener #1
2 x 6
2 x 6
2 x 6
2 x 6
2 x 6
300 Athletes, 7-9 Screeners
Screener #1
2 x 6
2 x 6
2 x 6
Screener #1
Screener #1
Screener #1
Screener #1
Screener #1
Screener #1
Screener #1
Academy Injuries
0123456789
10Academy Injuries N=73
Group screening data collection
Spread sheet
7/18/2013
Mike Contreras 16
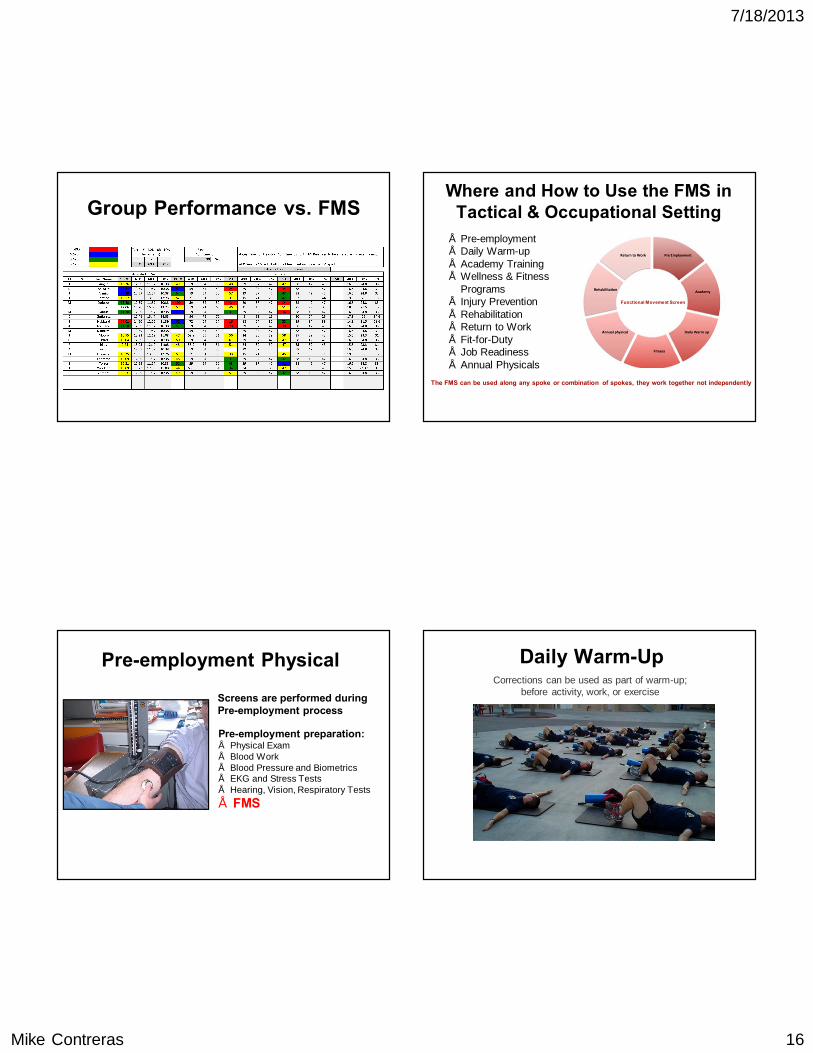
Group Performance vs. FMSWhere and How to Use the FMS in
Tactical & Occupational Setting
The FMS can be used along any spoke or combination of spokes, they work together not independently
Functional Movement Screen
• Pre-employment• Daily Warm-up• Academy Training• Wellness & Fitness
Programs• Injury Prevention• Rehabilitation• Return to Work• Fit-for-Duty• Job Readiness• Annual Physicals
Pre-employment Physical
Screens are performed duringPre-employment process
Pre-employment preparation:• Physical Exam• Blood Work• Blood Pressure and Biometrics• EKG and Stress Tests• Hearing, Vision, Respiratory Tests• FMS
Daily Warm-UpCorrections can be used as part of warm-up;
before activity, work, or exercise
7/18/2013
Mike Contreras 17
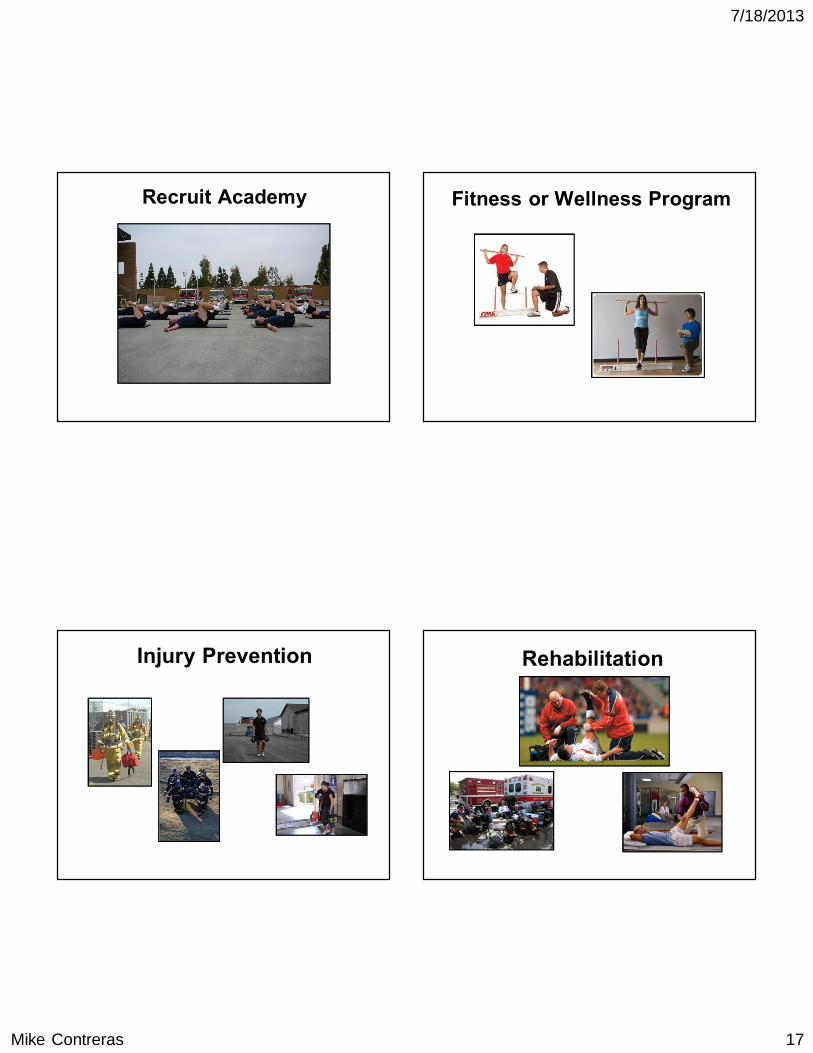
Recruit Academy Fitness or Wellness Program
Injury Prevention Rehabilitation
7/18/2013
Mike Contreras 18
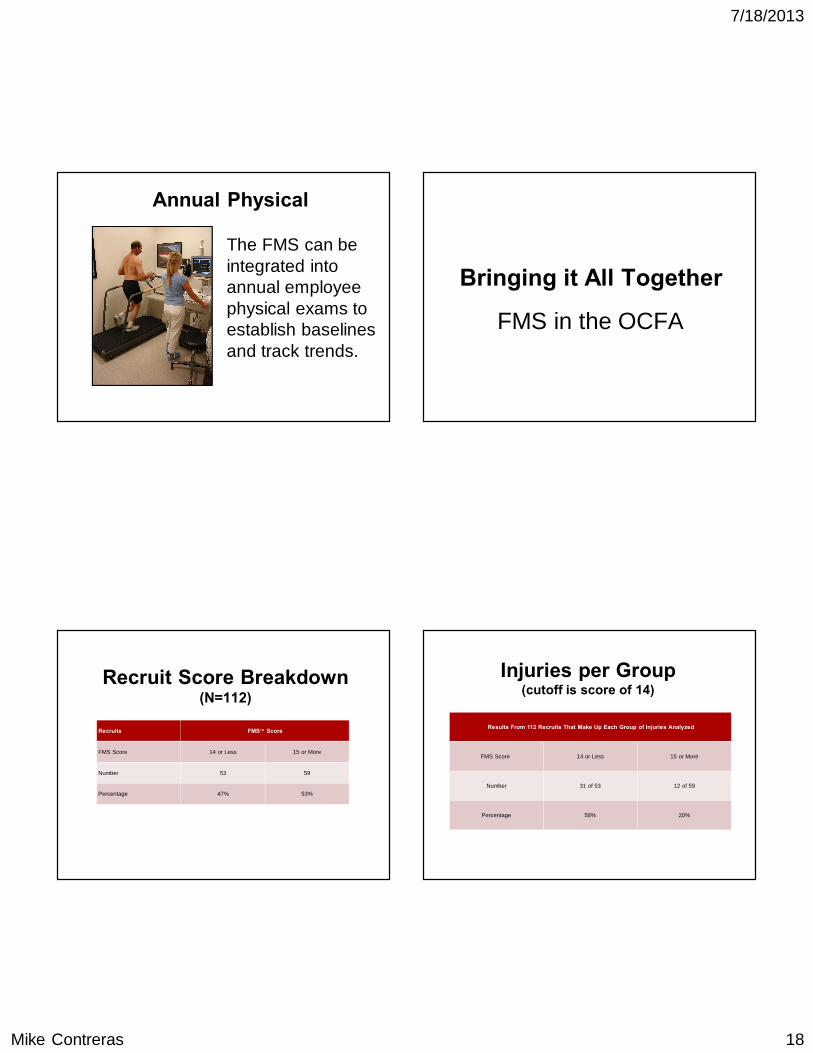
Annual Physical
The FMS can be integrated into annual employee physical exams to establish baselines and track trends.
Bringing it All Together
FMS in the OCFA
Recruit Score Breakdown(N=112)
Recruits FMS Score
FMS Score 14 or Less 15 or More
Number 53 59
Percentage 47% 53%
Injuries per Group(cutoff is score of 14)
Results From 112 Recruits That Make Up Each Group of Injuries Analyzed
FMS Score 14 or Less 15 or More
Number 31 of 53 12 of 59
Percentage 58% 20%
7/18/2013
Mike Contreras 19
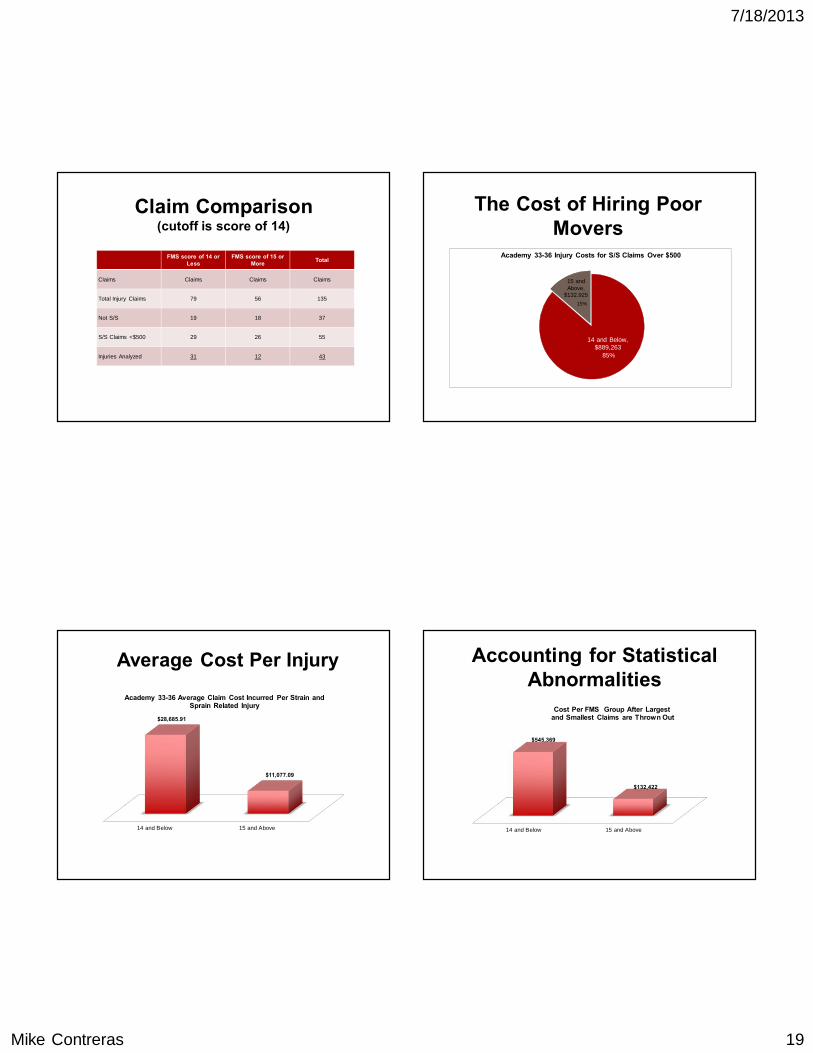
Claim Comparison(cutoff is score of 14)
FMS score of 14 or Less
FMS score of 15 or More Total
Claims Claims Claims Claims
Total Injury Claims 79 56 135
Not S/S 19 18 37
S/S Claims <$500 29 26 55
Injuries Analyzed 31 12 43
The Cost of Hiring Poor Movers
14 and Below, $889,263
15 and Above,
$132.925
Academy 33-36 Injury Costs for S/S Claims Over $500
15%
85%
Average Cost Per Injury
14 and Below 15 and Above
$28,685.91
$11,077.09
Academy 33-36 Average Claim Cost Incurred Per Strain andSprain Related Injury
Accounting for Statistical Abnormalities
14 and Below 15 and Above
$545,369
$132,422
Cost Per FMS Group After Largestand Smallest Claims are Thrown Out
7/18/2013
Mike Contreras 20
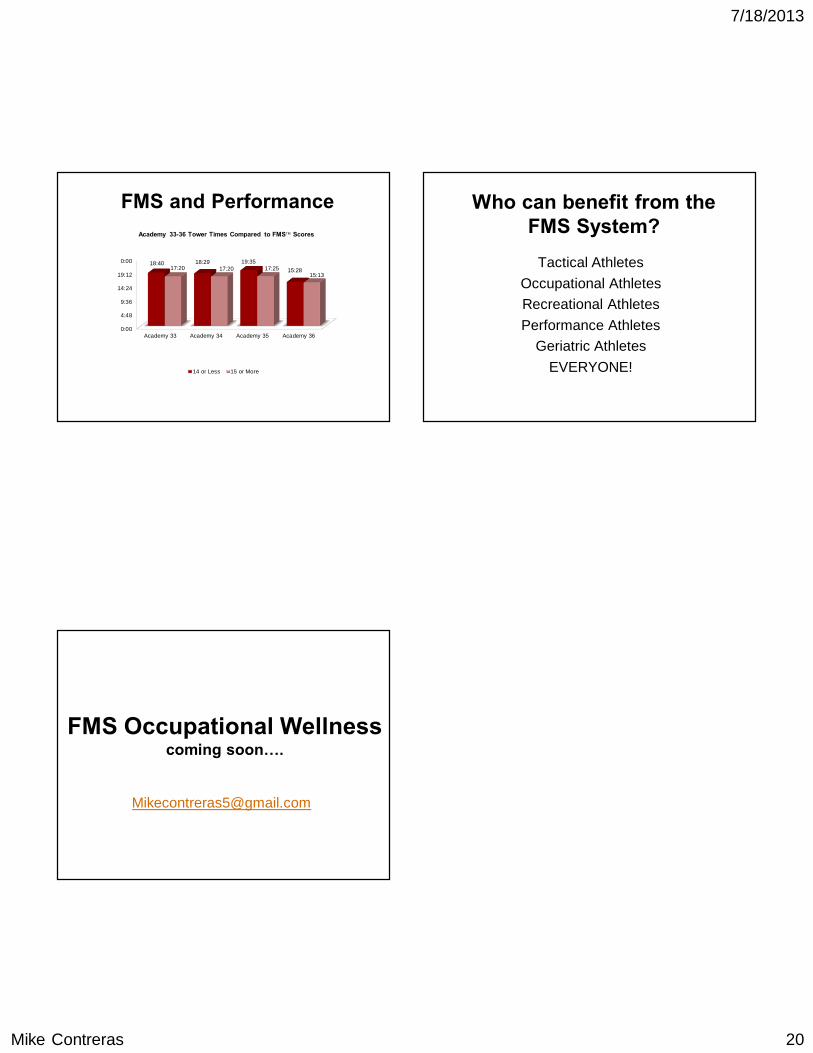
FMS and Performance
0:00
4:48
9:36
14:24
19:12
0:00
Academy 33 Academy 34 Academy 35 Academy 36
18:40 18:29 19:3515:2817:20 17:20 17:25
15:13
14 or Less 15 or More
Academy 33-36 Tower Times Compared to FMS Scores
Who can benefit from the FMS System?
Tactical AthletesOccupational AthletesRecreational AthletesPerformance Athletes
Geriatric AthletesEVERYONE!
FMS Occupational Wellnesscoming soon….