Embed Size (px)
Citation preview

Submitted to Computers Pages 1 - 21OPEN ACCESS
computersISSN 2073-431X
wwwmdpicomjournalcomputers
Article
FoamVis A Visualization System for Foam Research Designand ImplementationDan R Lipsa1 Richard C Roberts Robert S Laramee 1
1Visual and Interactive Computing Group Department of Computer Science Swansea UniversitySwansea UK
Authors to whom correspondence should be addressed dlipsa rslarameeswanseaacuk
Version February 24 2015 submitted to Computers Typeset by LATEX using class file mdpicls
Abstract Liquid foams are used in areas such as mineral separation oil recovery food1
and beverage production sanitation and fire fighting To improve the quality of products2
and efficiency of processes in these areas foam scientists wish to understand and control3
foam behavior To this end foam scientists have used foam simulations to model foam4
behavior however analyzing these simulations presents difficult challenges We describe5
the main foam research challenges and present the design of FoamVis the only existing6
visualization exploration and analysis application created to address them We describe7
FoamVisrsquo main features together with relevant design and implementation notes Our goal is8
to provide a global overview and individual features implementation details that would allow9
a visualization scientist to extend the FoamVis system with new algorithms and adapt it to10
new requirements The result is a detailed presentation of the software that is not provided11
in previous visualization research papers12
Keywords FoamVis Surface Evolver bubble-scale foam simulation time-dependent13
visualization14
1 Introduction and Requirements Liquid foams have important practical applications in areas such15
as oil extraction mineral separation food and beverage production cleaning and fire safety [24] In16
oil extraction foam is pushed through porous rock to displace oil [17] Domain experts desire to17
understand how the constricted geometry of the rock affects the flow of foam Foam is used in mineral18
Version February 24 2015 submitted to Computers 2 of 21
separation [15] in a process where ground ore is treated with foam The efficiency of the separation19
between mineral and rock depends on how objects with different properties interact with foam20
Liquid foam behavior is not yet well understood Scientists try to determine foam behavior from21
measurable properties such as bubble size and distribution liquid fraction and surface tension One22
way to study this dependence is to simulate foams at the bubble-scale which makes it possible to model23
foam properties and see their influence on general foam behavior However it also poses challenges for24
visualizing and inferring generic foam response Foam is simulated at a small scale where each bubble is25
modeled individually yet the goal is to determine behavior at a large scale where foam can be described26
as a continuous medium27
Surface Evolver (SE) [2] is the de facto standard for simulating foams at the bubble-scale SE foam28
simulations pose specific challenges29
1 Access to simulation data is difficult and requires domain-specific knowledge Parsing and special30
processing are required to access the entire simulation data Important bubble attributes are not31
provided by the simulation but inferred using domain specific-knowledge32
2 It is challenging to visualize general foam behavior While bubble-scale simulation makes it33
possible to investigate the influences that material properties have on general foam behavior it34
makes it difficult to visualize the general behavior that is of primary interest Simulation data is35
complex (unstructured grid with polygonal cells) and time-dependent with large fluctuations in36
the values of the parameters determined by changes in the topology of the soap film network37
3 Triggers to various foam behaviors are difficult to infer Multiple attributes have to be examined38
and foam properties have to be taken into account Topological changes (T1s) in which bubbles39
swap neighbors have to be considered40
4 Foam scientists work with dozens of simulations with a wide range of simulation parameters41
Examples include foam container properties (such as shape and roughness) foam attributes (such42
as bubble size and distribution liquid fraction and surface tension) or the properties of objects43
interacting with foam (such as shape size and position) The large number of existing simulations44
and the variety of simulation parameters makes it difficult to manage simulation data The45
possibility to compare related datasets results in a better understanding of various foam behaviors46
however existing tools do not facilitate that47
These challenges make it difficult to use a general-purpose visualization tool for foam research48
Domain expertsrsquo visualizations only partially address these challenges They may require intervention49
in the simulation code and potentially recomputing the simulations for summarizing and saving the50
relevant data Their standard visualizations do not have the ability to explore and analyze the data and do51
not facilitate comparison of datasets They do not have the high level of detail and speed that is achieved52
using graphics hardware We address shortcomings of existing visualizations used by domain experts53
and we provide visualizations to address foam research challenges To the best of our knowledge no54
previous visualization software exists for foam simulations modeled with SE FoamVis [101113] fills55
this void by providing a comprehensive solution which facilitates advanced examination visualization56
Version February 24 2015 submitted to Computers 3 of 21
analysis and comparison of foam simulation data This paper presents design and implementation details57
required for understanding the software not found in previous literature58
The design and implementation of the software is not featured in the previous literature which focuses59
on visualization We present a software-centric view of FoamVis which is essential for future developers60
wishing to implement or extend this framework61
The rest of this paper is organized as follows We describe how our design choices meet foam62
research challenges and provide an overview of the implementation in Sec 31 In the next sections63
we present design and implementation details for parsing and processing interface visualizations64
(simulation attributes bubble paths time-average topological changes kernel density estimate (KDE)65
and histograms) multiple linked-views and user interaction We end with conclusions and future work66
(Sec 4)67
2 Related Work In this work we aim to provide a global overview and individual features68
implementation details for FoamVis a visualization tool for foam research Our description is based69
on previous visualization literature the source code documentation [9] and the source code itself In70
a previous publication [11] we describe the foam research application area and introduce FoamVis71
a novel application that provides various techniques for visualization exploration and analysis of72
time-dependent 2D foam simulation data We show new features in foam simulation data and new73
insights into foam behavior discovered using our application Features described include color-mapping74
of scalar attributes display of topological changes visualization of bubble paths multiple-linked views75
and histograms76
Next we describe extensions [13] to FoamVis that allow comparison of related simulations and77
enhance its analysis capabilities Comparative visualization features include the two halves view78
linked time with event synchronization the reflection feature force difference and torque visualizations79
Additional visualization and analysis features include deformation tensor computation and visualization80
using ellipses time-average computation for vector and tensor simulation attributes velocity vector81
visualizations using glyphs and streamlines average around moving objects and topological changes82
kernel density estimate visualization83
Solutions to visualize and analyze 3D foam simulations are described in a third [10] paper84
Three-dimensional visualization include color-mapping of scalar attributes location and type for85
topological changes visualization of velocity vectors using glyphs average of scalar and vector86
simulation attributes and topological changes kernel density estimate A description of FoamVis from87
a userrsquos perspective is also presented [12] Again none of the previous literature provides guidance on88
how the implement the features89
3 Design and Implementation Our visualization solutions are driven by the foam research and90
visualization challenges listed in Sec 1 Surface Evolver output files are parsed and processed to access91
the complete data generated by the simulation Our application works with any SE simulation and92
no changes to the simulation output are necessary to accommodate the application This processing93
addresses challenge one94
Version February 24 2015 submitted to Computers 4 of 21
We visualize important simulation attributes (Sec 34) which include bubble scalar measures bubble95
velocity (a vector) bubble deformation (a tensor) location of topological changes and forces acting on96
objects in foam Overall foam behavior is analyzed using the average feature (Sec 36) kernel density97
estimate for topological changes (Sec 37) and bubble paths (Sec 34) This addresses challenge two98
Foam scientists wish to understand what triggers certain behavior in foam simulations (challenge99
three) Foam behavior is studied by either examining different attributes that influence it or by comparing100
simulations (challenge four) where the behavior is varied by modifying simulation parameters Both101
these requirements are addressed using multiple linked-views (Section 39)102
To present our solutions for visualization of foam simulation data we use three simulation groups103
containing related simulations the falling discs and the falling ellipse (2D) constriction (2D) and104
the falling disc (2D) and the falling sphere (3D) The falling-objects simulation group contains the105
falling-ellipse and the falling-discs simulations (Fig 6) The falling-discs simulates two discs falling106
through a monodisperse (bubbles having equal volume) foam under gravity It contains 330 time steps107
and simulates 2200 bubbles The two discs are initially side-by-side and in close proximity As they108
fall they interact with the foam and each other by rotating towards a stable orientation in which the109
line that connects their centers is parallel to gravity The falling-ellipse simulates an ellipse falling110
through a monodisperse foam under gravity This dataset contains 540 time steps and simulates 600111
bubbles The major axis of the ellipse is initially horizontal As the ellipse falls it rotates toward a112
stable orientation in which its major axis is parallel to gravity The constriction dataset contains two113
simulations one with a square-constriction and one with a rounded-constriction (Fig 8) They simulate114
a 2D polydisperse (bubbles with different volumes) foam flowing through a constricted channel with115
725 bubbles and 1000 time steps The radius of the curvature of the rounded corners of the constriction116
is five times smaller for the square-constriction compared with the rounded-constriction The falling disc117
(2D) sphere (3D) simulate a discsphere falling through a monodisperse (bubbles having equal volume)118
foam under gravity In 2D we have 254 time steps and 1500 bubbles In 3D we have 208 time steps119
and 144 bubbles Note that the number of bubbles that scientists are able to simulate in 3D is severely120
restricted by the duration of the computation time121
31 Overview In this section we present the structural relationships between FoamVisrsquo main components122
(Fig 1) For this purpose we use a UML 2 components diagram [1] Briefly a component represented123
in our diagram as a rectangle is a design unit that is typically implemented using a replaceable module124
A component may provide one or more public interfaces represented with a complete circle at their125
end (lollipop symbol) Provided interfaces represent services that the component provides to its clients126
Similarly a component may require services from other components These services are formalized127
through the required interfaces represented with a half circle at their end (socket symbol)128
FoamVis starts by executing the Parser component This component uses services from the UI129
component to allow the user to specify the simulations to be analyzed and additional information about130
the simulations This is done either through the command line or through graphical user interface Then131
the Parser parses the specified simulation files creates an in-memory representation of the simulation132
data and yields the execution to the Controller module133
Version February 24 2015 submitted to Computers 5 of 21
Figure 1 FoamVis UML Component Diagram The Parser parses simulation data andstores it in memory FoamVis uses the Model-View-Controller design pattern to separatethe data and program state (Model) the presentation (View) and the interaction with theuser (Controller) in three different components The UI provides user interface controls andclasses and the Display provides display and visualization algorithms
The main logic of the program uses the Model-View-Controller design pattern [14] This pattern134
separates the data and program state (Model) the presentation (View) and the interaction with the135
user (Controller) in three different components This architecture has two main benefits First because136
views are separated from data several views of the same data can be displayed in the same time Second137
because the Model does not depend on the View or Controller components changing the user interface138
or adding new views generally do not affect the Model This results in a more modular and maintainable139
code and in quicker development cycle140
The Controller manages the interaction between a user the Model (that stores data and program141
state) and the views that show foam simulation data142
The Model component (Fig 2) is composed of three sub-components Data which provides interfaces143
to create the in-memory representation of the foam simulation data and to read that data Settings144
which stores the program state and Average which stores and provides interfaces to compute and read145
time-averages of simulation attributes146
The View component provides visualizations for 2D and 3D foam simulation data as well as147
histograms for scalar attributes148
Each of these logical components contains several implementation files which in turn contain one149
or several related C++ classes Logical components (modules) their implementation files and classes150
and groups of member functions (member groups) are also documented [9] using Doxygen [22] We are151
going to refer to the doxygen documentation as we describe the main features of the program and present152
Version February 24 2015 submitted to Computers 6 of 21
Figure 2 The Model Component This component is responsible for storing data andprogram state It is composed from three subcomponents Data which stores simulationdata Average which stores derived time-average of simulation attributes and Settings whichstores program state
implementation notes for those features Here we provide a brief summary of the main components of153
the program Parser Model View and Controller For brevity we omit the Display and UI154
components We include the name and a brief description for each file part of a component We use a155
file name without an extension to refer to both the interface (h) and the implementation (cpp) files156
with that name157
The Parser parses Surface Evolver dmp files and calls the Data component to build a memory158
representation of the simulation data It contains the following files159
bull AttributeCreator ndash Create attributes which can be attached to vertices edges faces and bodies160
bull AttributeInfo ndash Information about attributes for vertices edges faces and bodies161
bull EvolverDatal ndash Lexical analyzer for parsing a dmp file produced by Surface Evolver162
bull EvolverDatay ndash Grammar for parsing a dmp file produced by Surface Evolver163
bull ExpressionTree ndash Nodes used in an expression tree built by the parser164
bull maincpp ndash Drives parsing of SE dmp files and creates FoamVis main objects165
bull NameSemanticValue ndash Tuple (name type value) used for a vertex edge face and body attribute166
bull ParsingData ndash Stores data used during the parsing such as identifiers variables and functions167
bull ParsingDriver ndash Drives parsing and scanning168
bull ParsingEnums ndash Enumerations used for parsing169
The Controller manages the interaction between a user the Model (that stores data and program170
state) and the views that show foam simulation data This component contains one implementation file171
bull MainWindow ndash Stores the OpenGL Vtk and Histogram widgets implements the Interface and172
manages the interaction between a user the Model and the views173
Version February 24 2015 submitted to Computers 7 of 21
Figure 3 Element class Inheritance Graph This class stores a vector of attributes thatcan be attached to bodies (bubbles) faces edges and vertices This diagram also shows thethree types of edges represented in FoamVis regular (Edge) edges that have a begin andan end vertex quadratic edges (QuadraticEdge) that have an additional middle vertexand constraint edges (ConstraintEdge) that are described using a begin vertex an endvertex and a curve f(x y z) on which the edge lies
The Data component creates processes and stores foam simulation data It contains the following174
implementation files175
bull AdjacentBody ndash Keeps track of all bodies a face is part of176
bull AdjacentOrientedFace ndash Keeps track of all faces an edge is part of177
bull ApproximationEdge ndash Curved edge approximated with a sequence of points (Fig 3)178
bull Attribute ndash Attribute that can be attached to vertices edges faces and bodies179
bull Body ndash A bubble180
bull BodyAlongTime ndash A bubble path181
bull ConstraintEdge ndash Edge on a constraint approximated with a sequence of points (Fig 3)182
bull DataProperties ndash Basic properties of the simulation data such as dimensions and if edges are183
quadratic or not184
bull Edge ndash Part of a bubble face stores a begin and an end vertex (Fig 3)185
bull Element ndash Base class for Vertex Edge Face and Body Stores a vector of attribute (Fig 3)186
bull Face ndash A bubble is represented as a list of faces a face is an oriented list of edges187
bull Foam ndash Stores information about a time step in a foam simulation188
bull ForceOneObject ndash Forces and torque acting on one object189
bull ObjectPosition ndash Stores an object interacting with foam position and rotation190
Version February 24 2015 submitted to Computers 8 of 21
bull OOBox ndash An oblique bounding box used for storing a torus original domain191
bull OrientedEdge ndash An oriented edge Allows using an Edge in direct or reversed order192
bull OrientedElement ndash Base class for OrientedFace and OrientedEdge Allows using a Face or Edge193
in direct or reversed order194
bull OrientedFace ndash An oriented face Allows using a Face in direct or reversed order195
bull ProcessBodyTorus ndash Processing done to ldquounwraprdquo bodies in torus model196
bull QuadraticEdge ndash Quadratic edge approximated with a sequence of points (Fig 3)197
bull Simulation ndash A time-dependent foam simulation198
bull T1 ndash A topological change199
bull Vertex ndash Element used to specify edges An edge has at least two vertices begin and end A200
quadratic edge has a middle vertex as well201
The Settings component stores and provides access to program state This component is composed202
from the the following files203
bull BodySelector ndash Functors that specify selected bubbles204
bull Settings ndash Settings that apply to all views205
bull ViewSettings ndash Settings that apply to one view206
The Average component computes time-average of simulation attributes It contains207
bull AttributeAverages ndash Computes the average for several attributes in a view Base class for208
AttributeAverages2D and AttributeAverages3D (Fig 4)209
bull AttributeAverages2D ndash Computes the average for several attributes in a 2D view Casts the210
computed averages to the proper 2D types (Fig 4)211
bull AttributeAverages3D ndash Computes the average for several attributes in a 3D view Casts the212
computed averages to the proper 3D types (Fig 4)213
bull Average ndash Computes a time-average of a foam attribute Base class for 2D and 3D time-average214
computation classes (Fig 4)215
bull AverageInterface ndash Interface for computing a time-average of a simulation attribute (Fig 4)216
bull AverageShaders ndash Shaders used for computing a pixel-based time-average of attributes217
bull ForceAverage ndash Time-average for forces acting on objects interacting with foam (Fig 4)218
bull ImageBasedAverage ndash Calculates a pixel-based time-average of 2D foam using shaders (Fig 4)219
Version February 24 2015 submitted to Computers 9 of 21
Figure 4 AverageInterface Inheritance Graph This class provides the interfacefor updating an average of attributes AttributeAverages stores an average ofmany simulation attributes Average provides common computation for averages offorces (ForceAverage) 2D simulation attributes (ImageBasedAverage) and 3Dsimulation attributes (RegularGridAverage) Two-dimensional averages includescalars (ScalarAverage) vectors (VectorAverage) tensors (TensorAverage)and kernel density estimates (T1KDE2D)
bull PropertySetter ndash Sends an attribute value to the graphics card (Fig 4)220
bull RegularGridAverage ndash Time-average for a 3D regular grid (Fig 4)221
bull ScalarAverage ndash Computes 2D scalar average (Fig 4)222
bull T1KDE2D ndash Calculates T1s KDE for a 2D simulation (Fig 4)223
bull TensorAverage ndash Computes a pixel-based time-average of vector and tensor attributes (Fig 4)224
bull VectorAverage ndash Computes a pixel-based time-average of vector attributes (Fig 4)225
bull VectorOperation ndash Math operations for vtkImageData used for 3D average computation226
The Model component consists of the Data Settings and Average components It also includes two227
additional files228
bull Base ndash Simulation data derived data and program status229
bull DerivedData ndash Data derived from simulation data such as caches and averages230
The View component contains the views for displaying data It contains the following implementation231
files232
bull AttributeHistogram ndash A GUI histogram of a scalar attribute useful for one time step and all time233
steps234
bull FoamvisInteractorStyle ndash Interactor that enables FoamVis style interaction in a VTK[8] view235
Version February 24 2015 submitted to Computers 10 of 21
bull Histogram ndash A histogram GUI that allows selection of bins236
bull HistogramItem ndash Implementation of a GUI histogram modified from Qwt[3]237
bull WidgetBase ndash Base class for all views WidgetGl WidgetVtk WidgetHistogram238
bull WidgetGl ndash View that displays 2D (and some 3D) foam visualizations using OpenGL239
bull WidgetHistogram ndash View for displaying histograms of scalar values240
bull WidgetSave ndash Widget that knows how to save its display as a JPG file241
bull WidgetVtk ndash View that displays 3D foam visualizations using VTK242
32 Parsing and Data Processing Foam simulation data consists of a list of SE output files one per243
time step A file stores the entire configuration of the simulated foam at a particular time step For244
maximum generality and flexibility we parse SE files directly instead of using derived files created245
by foam scientists This allows our application to work with any simulation created using SE and at246
the same time it gives us access to the entire duration and state of the simulation Parsing is done247
using flex [5] and bison [6] tools using EvolverDatal lexical analyzer and EvolverDatay248
grammar Parsing is run by SimulationParseDMPs which parses the simulation files stores the249
simulation data in memory and performs the additional processing required250
Our tool can read the following optional data that is saved by the simulation code a list of T1s and251
the network and pressure forces that act on a body (Sec 34)252
After parsing foam simulation data and creating the corresponding data structures we perform253
additional data processing (FoamPreprocess and SimulationPreprocess) First254
we compact each list of geometric elements as there can be numbering gaps in the list255
specified in a SE file (Foamcompact) Then if the foam described in the SE file256
contains periodic boundary conditions (PBC) [2021] we unwrap the geometric elements so257
that we can display the foam (Foamunwrap) Additional processing include calculating258
each bubblersquos center of mass (FoamcalculateBodyCenters) bounding box and the259
bounding box of the foam at each time step (FoamCalculateBoundingBox and260
overall (SimulationCalculateBoundingBox and calculating statistical quantities such as261
histogram minima and maxima for values of attributes (SimulationcalculateStatistics)262
For 3D foam simulations unstructured simulation data is converted to a regular grid and it is cached in263
files on disk (Sec 36)264
The design of the data structures for storing bubbles and their topology is object-oriented We have265
an object that stores an instance of each bubble The Bubble contains a list of edges These are the266
shared edges between neighboring bubbles The Bubble object also stores a pointer to its neighboring267
bubbles Technically speaking this information could be considered redundant since bubbles share edges268
however it does accelerate computation Another option is to have each edge contain a list of pointers to269
its bubble objects This is an important consideration for neighbor searching During the foam evolution270
the foam topology must be updated for every T1 event271
Version February 24 2015 submitted to Computers 11 of 21
Figure 5 The BrowseSimulations dialog which allows the user to view relatedsimulations and select simulations of interest for individual analysis or comparison
33 Interface Each dataset consists of a list of data files stored in a folder The only information about272
the simulation available without parsing the simulation files is the name of the folder While this often273
encodes important parameters of the simulation their meaning may be cryptic and only known to the274
scientist that created the simulation Additionally there is an increasing number of parameters providing275
additional information about the simulation which is not encoded in the simulation files To address these276
issues we create a simulations database and a browsing interface The simulations database records for277
each simulation three pieces of information a simulation name - usually this is the name of the folder278
that stores the simulation files a list of labels each label is used to group simulations based on specific279
criteria and simulation specific visualization parameters The database is stored as a ini file and is280
created by the user from a template The UI Options file contains classes that read options either from281
the command line or from an ini file282
The browsing feature (Fig 5) presents all grouping labels from the simulation database in a list283
When a user selects a label a list with all simulations tagged by that label is presented When a user284
selects a simulation name a picture of the first time step in the simulation is displayed The image is285
saved beforehand so no parsing of simulation files is required This allows a user to explore existing286
simulations based on similarity criteria encoded in labels and visually select simulations of interest for287
individual analysis or comparison The browsing dialog is implemented by UI BrowseSimulations288
class289
FoamVisrsquo main window (Fig 6) contains three panels that are used for both visualization and user290
interaction (Spatial and Information Visualization and Time) and one panel (Interface) that allows the291
user to specify desired visualizations and visualization parameters The spatial visualization panel292
shows multiple views with each view showing a different visualization a visualization of a different293
simulation attribute or a visualization of a different simulation The information visualization panel294
shows histograms for simulation scalars shown in the spatial visualization panel The time panel shows295
the current time step and marks time steps resulting from selections on scalar values The main window296
of the application is implemented in Controller MainWindow This class implements the Interface297
panel and handles user notifications resulted from user interactions with the panel or with simulation data298
The Spatial Visualization panel is implemented by the View component In this component WidgetGl299
class displays 2D visualizations and 3D attribute and bubble paths visualizations WidgetVtk class300
Version February 24 2015 submitted to Computers 12 of 21
Figure 6 FoamVisrsquo MainWindow showing the spatial visualization informationvisualization time and interface panels The spatial visualization panel shows two viewsbubble velocity magnitude for a falling ellipse simulation and bubble deformation a fallingdiscs simulation A selection of velocity magnitude values is performed on the histogramshowing this scalar and it is reflected in the spatial visualization and time panels We canobserve in the time panel that only 55 time steps out of 549 contain high velocity bubbles andin the spatial visualization panel we see those bubbles color mapped the rest of the bubblesare rendered in gray as context information
Spatial
visualization
Information
visualization
Time
Interface
displays 3D attribute time-average and T1s KDE visualizations The decision to use VTK [8] rather301
than plain OpenGL [18] for some of the 3D visualizations was based on the desire to speed-up the302
development of the application We believe this was a sound decision which besides speeding-up303
development opened-up a wide range of visualization algorithms for adoption into FoamVis304
34 Simulation attributes Scalar bubble attributes include velocity along principal axes velocity305
magnitude edges per face deformation pressure volume and growth rate Scalar bubble attributes306
are visualized using color mapping The user can change the color palette and change the range307
of scalar values mapped to color through clamping (Sec 310) Fig 7-a and Fig 8 Fig 6 show308
examples of scalar attributes visualized through color mapping While domain experts are mostly309
interested in bubble attributes in SE attributes can be attached to a body (bubble) face edge or vertex310
Information about predefined attributes that can be attached one of these elements is stored in Parser311
AttributesInfoElements class New attributes can be defined in a dmp file The Parser calls312
DataFoamAddAttributeInfo to register a new attribute The ParserEvolverDatay parses313
a list of attributes on the following grammar rules xxx_attribute_listwhere xxx is vertex edge314
face or body It creates a list of NameSemanticValue objects and it passes them to the Foam object315
for storage316
Bubble velocity defined as the motion of the center of mass provides information about foam flow317
We visualize bubble velocities using glyphs (2D and 3D) (Fig 7-a) and streamlines (2D only) (Fig 9)318
We compute the velocity attribute in a processing step after parsing (SimulationPreprocess) in319
SimulationcalculateVelocity Velocity glyphs are visualized using the Display module320
DisplayBodyFunctors file DisplayBodyVelocity class321
Version February 24 2015 submitted to Computers 13 of 21
Figure 7 Are the falling discs behaving like the falling ellipse (a) The foam between thediscs moves at high velocity with the discs Velocity is displayed using glyphs and velocitymagnitude is also color-mapped (b) Few topological changes occur between the discs sothe foam behaves like an elastic solid there Topological changes over time visualized usingKDE [13]
Figure 8 Rounding the corners of the constriction results in reduced elastic deformationof the foam (top versus bottom) In both simulations there is an area where bubbles arenot deformed just downstream from the constriction We show the square (top) and rounded(bottom) constriction simulations Deformation magnitude and direction is displayed withellipses deformation magnitude is also color-mapped An average over the entire durationof the simulations is displayed [13]
Bubble deformation magnitude and direction are important bubble attributes because they facilitate322
validation of simulations and provide information about the force acting on a dynamic object in323
foam While visual inspection of individual bubbles provides information about foam deformation324
this information is not quantified and more importantly cannot be averaged to obtain the general foam325
behavior To address these issues we define a bubble deformation measure [13] expressed as a tensor326
The deformation tensor is visualized using glyphs as shown in Fig 8 We compute a deformation scalar327
and tensor measures in a processing step after parsing FoamCalculateDeformationSimple328
and FoamCalculateDeformationTensor Two-dimensional deformation glyphs are329
visualized using the Display module DisplayBodyFunctors file DisplayBodyDeformation330
class331
When foam is subjected to stress bubbles deform (elastic deformation) and move past each other332
(plastic deformation) Domain experts are interested in the distribution of the plasticity which is333
indicated by the location of topological changes A topological change is a neighbor swap between334
four neighboring bubbles In a stable configuration bubble edges meet 3-way at 120 angles As foam is335
sheared bubbles move into an unstable configuration in which edges meet 4-way then quickly shift into336
Version February 24 2015 submitted to Computers 14 of 21
Figure 9 Topological changes are associated with strong circulation topological changesshown with green dots velocity field shown with streamlines t = 412 Velocity is shownwith streamlines and velocity magnitude is color-mapped
a stable configuration Topological changes for the current time step or for all time steps are visualized337
with glyphs (or spheres) of configurable color and size showing the location of the topological change338
(Fig 9) Topological changes are parsed either from a separate file or from variables inside the dmp file339
by the overloaded function SimulationParseT1s They are stored in the Simulation object340
The forces and the torque acting on objects are computed by the simulation code and stored in the341
simulation data Each force acting on an object is represented with an arrow that starts in the center of342
the object and with length proportional to the magnitude of the force343
For the falling discs simulation the interplay of the network and pressure forces rotate one disc around344
the other We provide a user option that displays the difference between the forces acting on the leading345
disc and forces acting on the trailing disc This difference allows us to better analyze the causes of the346
rotation as there is a direct correspondence between the forces displayed on the screen and the movement347
of the disc (Fig 10 right)348
The torque τ rotating an object around its center is displayed as a force F acting off-center on the349
object τ = r times F where r is the displacement vector from the center of the object to the point at which350
the force is applied The distance |r| is a user-defined parameter FoamVis calculates the appropriate351
value of F to keep the torque constant (Fig 10 left)352
The forces and torques acting on objects are read from the simulation files from variable353
names passed as parameters either from command line or from the ini file Variable names354
that store forces and torques are passed as parameters in Data ForceNamesOneObject class355
while the forces and torques are stored in Data ForceOneObject in the Foam object Forces356
are displayed using ForceAverageDisplayOneTimeStep1 for OpenGL views or using357
PipelineAverage3DcreateObjectActor for VTK views358
35 Bubble paths Visualization of bubble paths provides information about the trajectory of individual359
bubbles in the simulation The paths are a useful way to compare simulation with experiment They360
also provide insight into the overall behavior of the foam A bubble path is determined by connecting361
1 This function would better fit in the Display module as this would separate the data from its display We plan to addressthis issue in future work
Version February 24 2015 submitted to Computers 15 of 21
Figure 10 Falling-ellipse versus falling-discs The linked time with event synchronizationfeature [13] is used to synchronize the rotation of the ellipse and the two discs such that theyreach an orientation of 45 in the same time Attributes (pressure deformation and forces)are averaged over 52 time steps for the ellipse simulation (resulting in an average over 15time steps for the two disc simulation) Pressure is color-mapped deformation is shownusing ellipses The force difference between the leading disc and the trailing disc and thetorque on the ellipse is indicated The network force and torque are indicated with a blackarrow and the pressure force and torque are indicated with a red arrow
the center of bubbles with the same ID in consecutive time steps Fig 11 shows a pattern of bubbles362
traversing loops revealed by a bubble paths visualization363
Bubble paths are stored in a processing step after parsing by calling364
SimulationCacheBodiesAlongTime and they are displayed in Display365
DisplayBubblePaths366
36 Time-Average of a Simulation Attribute Bubble-scale simulations can be too detailed for observing367
general foam behavior and topological changes generate large fluctuations in attribute values that hide the368
overall trends A good way to smooth out these variations is to calculate the average of the simulation369
attributes over all time steps or over a time window before the current time step This visualization370
reveals global trends in the data because large fluctuations caused by topological changes are eradicated371
This results in only small variations between averaged successive time steps The time window is a372
parameter set by the user We compute the average for the entire simulation (Fig 8) if there are no373
dynamic objects interacting with the foam In this case at a high level of detail there is no difference374
between different time steps in the simulations For simulations that include dynamic objects interacting375
with the foam (Fig 7 10) a smaller time window is appropriate as objects may traverse transient states376
that have to be analyzed independently377
Time-averages of several 2D foam simulation attributes are stored in AttributeAverages2D378
and are referenced from WidgetGl A pixel-based time-average of one simulation attribute is379
computed by ScalarAverage VectorAverage and TensorAverage for scalars vectors380
and tensors Most of this computation is done in the base class ImageBaseAverage381
(Fig 4) Displaying an average of attributes is done by the graphics card fragment shader using382
AverageInterfaceAverageRotateAndDisplay1 overwritten for each attribute type For383
3D simulations unstructured grid data is converted to regular grid data and is cached in files inside384
foamvis folder using FoamSaveRegularGrid This is done in the processing step after385
Version February 24 2015 submitted to Computers 16 of 21
Figure 11 Pattern of bubbles traversing loops visualized using bubble paths in the fallingdiscs simulation The bubbles paths are color-mapped to velocity along Y with orangeindicating descent and purple indicating ascent The left image shows the bubble paths overthe entire simulation The red area shows the paths of the two discs The black rectangleshows the region that is magnified in the right image
parsing SimulationPreprocess Time-averages of several 3D foam simulation attributes are386
stored in AttributeAverages3D and are referenced from WidgetVtk A time-average for387
one attribute for all types of attributes is computed by RegularGridAverage and displayed388
using a VTK pipeline created by PipelineAverage3DcreateScalarAverageActor and389
PipelineAverage3DcreateVelocityGlyphActor for scalars and respective vectors390
37 Topological changes kernel density estimate (KDE) Topological changes in which bubbles change391
neighbors indicate plasticity in a foam Domain experts expect that their distribution will be an important392
tool for validating simulations Simply rendering the position of each topological change suffers from393
over-plotting so it may paint a misleading picture of the real distribution We compute (see Lipsa et394
al [13] for details) a KDE for topological changes (Fig 7 Fig 12) While traditional histograms395
show similar information and are straightforward to implement they have drawbacks which may prove396
important depending on the context Drawbacks of histograms include the discretization of data into bins397
which may introduce aliasing effects and the fact that the appearance of the histogram may depend on398
the choice of origin for the histogram bins [419] Kernel-based methods for computing the probability399
density estimate eliminate these drawbacks400
T1s KDE is computed using the average framework (Fig 4) (T1KDE2D or RegularGridAverage401
classes for 2D or 3D foam simulation) For 2D simulations for each topological change in a time step402
a Gaussian is added to the average using T1KDE2DwriteStepValues For 3D simulations a403
Gaussian determined by a topological change in a time step is returned by SimulationGetT1KDE404
This Gaussian added to the current average in RegularGridAverageOpStep405
38 Histograms We provide both a histogram of bubble attribute values over one time step and406
over all time steps To facilitate data analysis our histogram is configurable The user can407
choose a maximum height logarithmic or linear height scale and uni-color or color-coded display408
Version February 24 2015 submitted to Computers 17 of 21
Figure 12 KDE around the falling disc versus falling sphere simulations The maximumvalues in the color bar represent the maximum number of topological changes in a time stepKDE for all time steps (b) shows that for 3D topological changes on top of the spheredominate the final result This is caused by topological changes in the same area beingtriggered repeatedly in the simulation code feature discovered using our visualization
(a) KDE for one timestep t = 18 left viewand t = 21 right viewIsosurface density is 05for the right view
(b) KDE for all timesteps Isosurfacedensity is 012 for theright view
using HistogramSettings dialog Histograms are also used in selection and filtering of data409
based on attribute value and in color-map clamping used for selecting features of interest in the410
data These interactions are described in detail in Sec 310 Histograms are displayed by View411
WidgetHistogram Histograms notify the Controller when scalar selection has changed using412
WidgetHistogramSelectionChanged413
39 Multiple linked-views Foam scientists wish to understand what triggers certain behavior in414
foam simulations Foam behavior is determined by many simulations attributes so the ability to see415
different attributes at the same time and to understand how different attributes relate to one another416
is very important At the same time to understand the influence that simulation parameters have on417
foam behavior foam scientists would like to analyze and compare related simulations Both these418
requirements are addressed using multiple linked views We provide up to four different views For419
maximum flexibility each view can depict a different simulation attribute a different visualization or420
even a different simulation Each view uses its own color-bar and can show the navigation context421
Each of the three widgets used to show data (WidgetGl WidgetVtk and WidgetHistogram)422
can display up to four views These three classes are derived from WidgetBase which provides view423
related functionality WidgetBase is derived from Base which provides access to data and program424
status (Fig 13)425
To set up optimal views to analyze data users can copy viewing transformations426
(WidgetXXXCopyTransformFromSlot where XXX is Gl or Vtk) and color mapping between427
views depicting the same attribute (MainWindowCopyColorMapXXX where XXX is Scalar or428
Velocity)429
The two halves option facilitates visual comparison of two related foam simulations (Fig 8) It430
visualizes related simulations that are assumed to be symmetric with respect to one of the main axes431
Version February 24 2015 submitted to Computers 18 of 21
Figure 13 WidgetBase Inheritance Graph This class provides functionality commonto all views It inherits from Base which stores simulation data and program statusWidgetGl displays views rendered with OpenGl WidgetVtk displays views renderedwith VTK and WidgetHistogram displays histograms
While the same information can be gathered by examining the two simulations in different views432
the two halves view may facilitate analysis as images to be compared are closer together and it is433
useful for presentation as it saves space This type of visualization was previously performed manually434
by domain experts This option is only available for 2D simulations in WidgetGl It is set using435
SettingsSetTwoHalvesView436
We provide three connection operations [23] between views one linked-selection connection and437
two linked-time connections The linked-selection connection works by showing data selected in one438
view in other views This is used to see for instance the elongation of high pressure bubbles or both439
pressure and elongation for bubbles involved in a topological change This connection works by copying440
the selection in one view in any other view using ViewSettingsCopySelection441
The first linked-time connection works by having each view linked to the same time step as442
foam scientists want to analyze several attributes at the same time to understand foam behavior443
influenced by those attributes The linked-time connection is set to independent time or linked time444
using SettingsSetTimeLinkage The second linked-time connection linked-time with event445
synchronization is described next In simulations that involve dynamic objects interacting with foam446
we may want a similar event in both simulations to be visualized at the same time so that behavior447
up to that event can be compared and analyzed together When comparing the falling discs with the448
falling ellipse simulations the ellipse and the discs start in similar configurations The main axis of449
the ellipse and the line connecting the center of the two discs are horizontal We want the ellipse and450
the discs to reach intermediate configurations and the stable configuration at the same time These451
configurations are defined in terms of the angle that the major axis of the ellipse and the line connecting452
the centers of the two discs make with gravity For instance an angle for the intermediate configuration453
could be 45 while the angle for the stable configuration is 0 A new event for the current view and454
current time is added using SettingsAddLinkedTimeEvent All views that use linked-time455
with event synchronization have to have the same number of events This technique splits simulation456
times in intervals - an interval before each event and an interval after the last event For each interval457
before an event one simulation will run at its normal speed (the simulation with the longest interval as458
returned by SettingsGetLinkedTimeMaxInterval) all other simulations will be ldquoslowed459
downrdquo using SettingsGetLinkedTimeStretch Simulations will run at normal speed for the460
Version February 24 2015 submitted to Computers 19 of 21
time-interval after the last event Using this approach related events occur at the same linked time in all461
simulations facilitating their comparison as well as the comparison of their temporal context Fig 7 10462
use linked-time with event synchronization feature The complete interface for using the linked-time463
with event synchronization is in class Settings member group Time and LinkedTime464
310 Interaction Interaction with the data is an essential feature of our application465
Navigation is used to select a subset of the data to be viewed the direction of view and the level of466
detail [23] We provide the following navigation operations rotation around a bounding box center for467
specifying the direction of view and translation and scaling for specifying the subset of data and the level468
of detail Navigation operations are implemented in the WidgetGl views in mousePressEvent and469
mouseMoveEvent These operations are provided by the VTK library in the WidgetVtk views A470
navigation context (Fig 11 left) ensures that the user always knows its location and orientation during471
exploration of the data Focus and context related settings are in ViewSettings Context view472
member group473
We can select andor filter bubbles and center paths based on three distinct criteria based on474
bubble IDs (WidgetGlSelectBodiesByIds) to enable data to be related to the simulation475
files and for debugging purposes based on location of bubbles (WidgetGlmousePressEvent476
and WidgetGlmouseMoveEvent) to analyze interesting features at certain locations in the477
data and based on an interval of attribute values specified using the histogram tool (Fig 6)478
(The histogram sends WidgetHistogramselectionChanged signal which is handled in479
MainWindowSelectionChangedFromHistogram) A composite selection can be specified480
using both location and attribute values481
Selected bubbles or center paths constitute the focus of our visualization and the rest of the bubbles482
or center paths provide the context [7] The context of the visualization is displayed using user-specified483
semi-transparency or it can be hidden altogether484
Encoding operations are variations of graphical entities used in a visualization that emphasize485
features of interest [23] We provide encoding operations to change the color map used to specify486
the range of values used in the color map and to adjust the opacity of the visualization context Selection487
of the interval used in color-mapping is guided by the histogram tool (Fig 14) (the implementation is in488
EditColorMap) This provides essential information for selecting an interval that reveals features of489
interest490
4 Conclusions and Future Work We present challenges faced by domain scientists and describe491
FoamVis a software application designed to address some of these challenges We describe its main492
implementation components and their interactions and present FoamVisrsquo main features together with493
implementation notes that describe how and where these features are implemented494
We see many directions for future work We would like to add more algorithms for visualization of495
3D foam simulations enable comparison between foam simulation and experiments and support analysis496
of other kinds of Surface Evolver simulations497
Version February 24 2015 submitted to Computers 20 of 21
Figure 14 Color-map clamping guided by the histogram tool (EditColorMap class)This is a histogram of the constriction simulation which uses a logarithmic height scale Thehistogram is clamped at high values The dialog also allows the user to choose a differentcolor palette and to change highlight colors used for vector and tensor glyphs and forcesacting on objects
Acknowledgments This research was supported in part by the Research Institute of Visual498
Computing (rivicorg) Wales We thank Ken Brakke for answering our many questions about the Surface499
Evolver500
The authors declare no conflict of interest501
References502
1 D Bell UML basics The component diagram 2004 Online document accessed 25 June 2013503
httpwwwibmcomdeveloperworksrationallibrarydec04bellindexhtml504
2 K Brakke The Surface Evolver Experimental Mathematics 1(2)141ndash165 1992505
3 C A Brewer ColorBrewer Online document httpwwwColorBrewerorg accessed 3 March506
2012507
4 O Daae Lampe and H Hauser Interactive Visualization of Streaming Data with Kernel Density508
Estimation In Pacific Visualization Symposium (PacificVis) pages 171ndash178 IEEE 2011509
5 flex - The Fast Lexical Analyzer Online document httpflexsourceforgenet accessed 29 Nov510
2010511
6 Bison - GNU Parser Generator Online document httpwwwgnuorgsoftwarebison accessed 29512
Nov 2010513
Version February 24 2015 submitted to Computers 21 of 21
7 H Hauser Generalizing Focus+context Visualization Scientific visualization The visual extraction514
of knowledge from data pages 305ndash327 2006515
8 K Inc The VTK Userrsquos Guide Version 5 (Paperback) Kitware Inc 2006516
9 D Lipsa FoamVis 2013 Online document accessed 25 June 2013 httphttpcsswanacuk517
~csbobresearchfoamVisdesignhtml518
10 D R Lipsa R S Laramee S Cox and I T Davies Visualizing 3D Time-Dependent Foam519
Simulation Data In Lecture Notes in Computer Science International Symposium on Visual520
Computing (ISVC) Rethymnon Crete Greece July 2013521
11 D R Lipsa R S Laramee S J Cox and I T Davies FoamVis Visualization of 2D Foam522
Simulation Data Visualization and Computer Graphics IEEE Transactions on 17(12)2096ndash2105523
Oct 2011524
12 D R Lipsa R S Laramee S J Cox and I T Davies A Visualization Tool For Foam Research525
In NAFEMS World Congress (NWC) Conference Proceedings page 141 Salzburg Austria June526
2013527
13 D R Lipsa R S Laramee S J Cox and I T Davies Comparative Visualization and Analysis of528
Time-Dependent 2D Foam Simulation Data Technical report Swansea University 2013529
14 Microsoft Model-View-Controller 2013 Online document accessed 25 June 2013 httpmsdn530
microsoftcomen-uslibraryff649643aspx531
15 R Prudrsquohomme and G Warr Foams in Mineral Flotation and Separation Processes pages532
511ndash554 Volume 57 of prud1996foams [16] 1996533
16 R K PrudrsquoHomme and S A Khan Foams theory measurements and applications volume 57534
CRC PressI Llc 1996535
17 W Rossen Foams in Enhanced Oil Recovery pages 413ndash464 Volume 57 of prud1996foams [16]536
1996537
18 D Shreiner M Woo J Neider and T Davis OpenGL Programming Guide Fifth Edition Addison538
Wesley 2006539
19 B Silverman Density Estimation for Statistics and Data Analysis volume 26 of Monographs on540
Statistics and Applied Probability Chapman amp HallCRC 1986541
20 The Surface Evolver Jan 2008 Online document accessed 29 Nov 2010 httpwwwsusquedu542
brakkeevolverhtmlevolverhtm543
21 Surface Evolver Workshop Apr 2004 Online document accessed 1 Dec 2010 httpwwwsusqu544
edubrakkeevolverworkshopworkshophtm545
22 D van Heesch Doxygen 2013 Online document accessed 26 June 2013 httpwwwstacknl546
~dimitridoxygen547
23 M Ward G Grinstein and D Keim Interactive Data Visualization Foundations Techniques and548
Applications chapter 10 pages 315ndash334 A K Peters Ltd Natick Massachussetts 2010549
24 D Weaire and S Hutzler The Physics of Foams Oxford University Press Oxford 1999550
c⃝ February 24 2015 by the authors submitted to Computers for possible open access551
publication under the terms and conditions of the Creative Commons Attribution license552
httpcreativecommonsorglicensesby40553
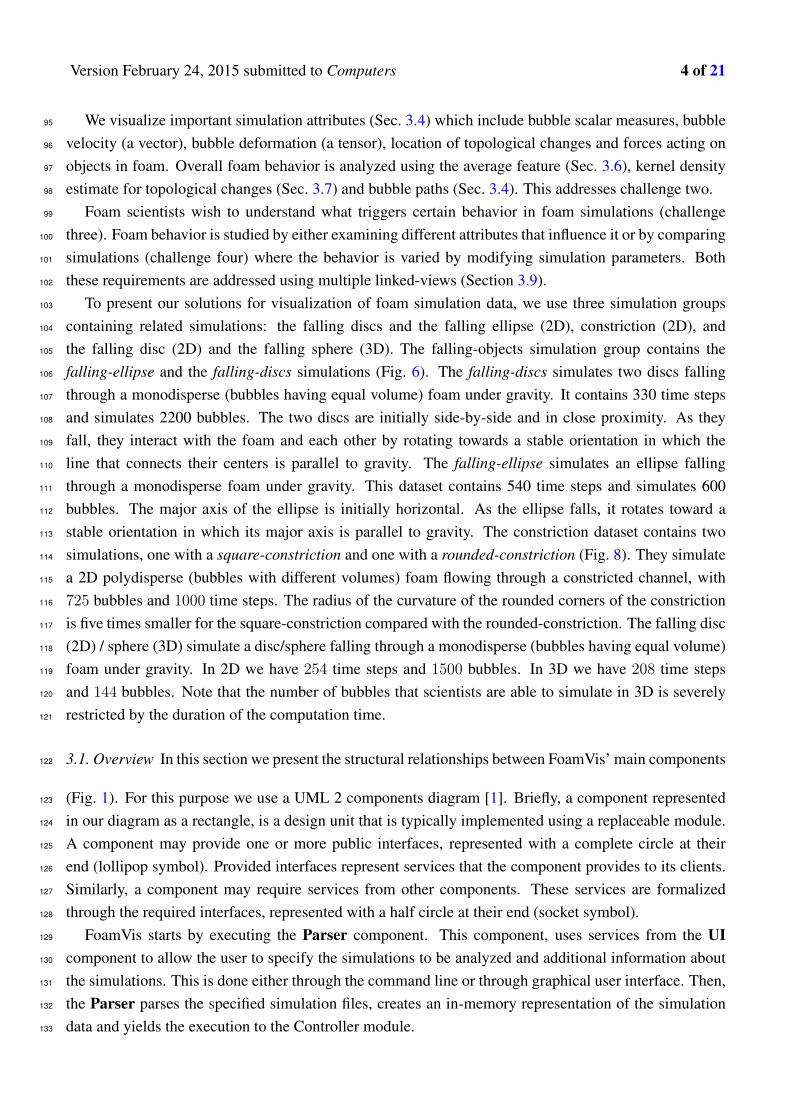
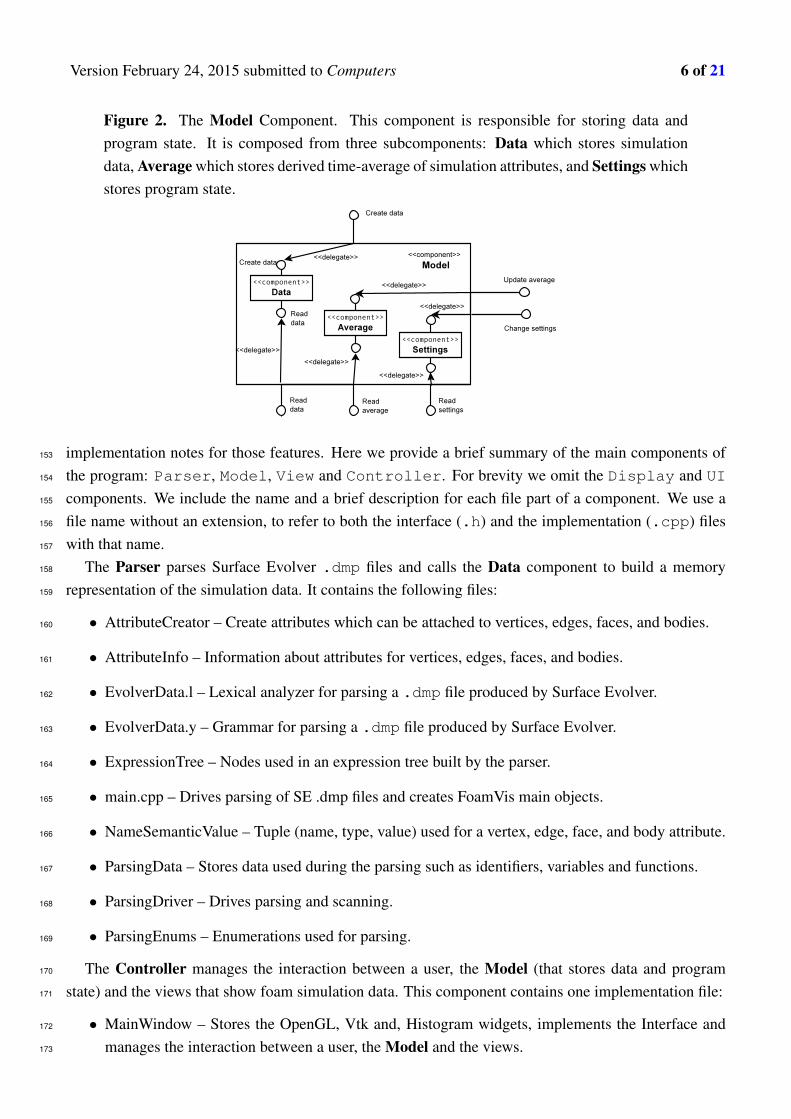
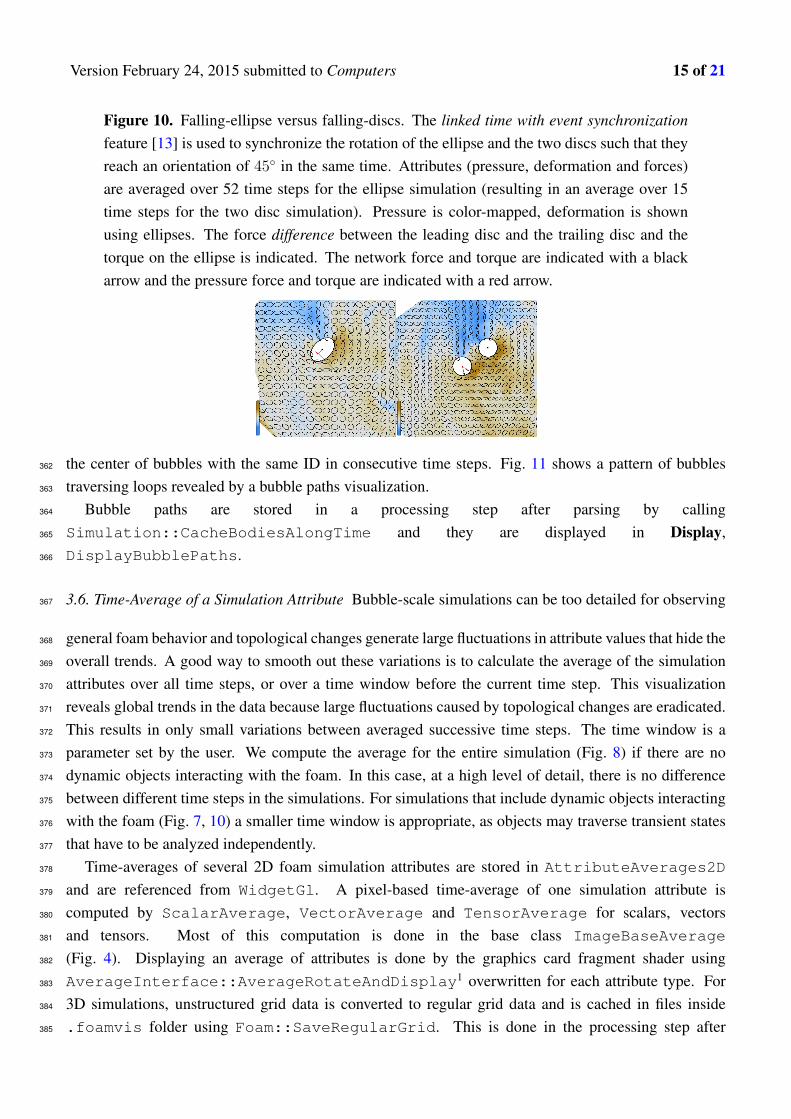
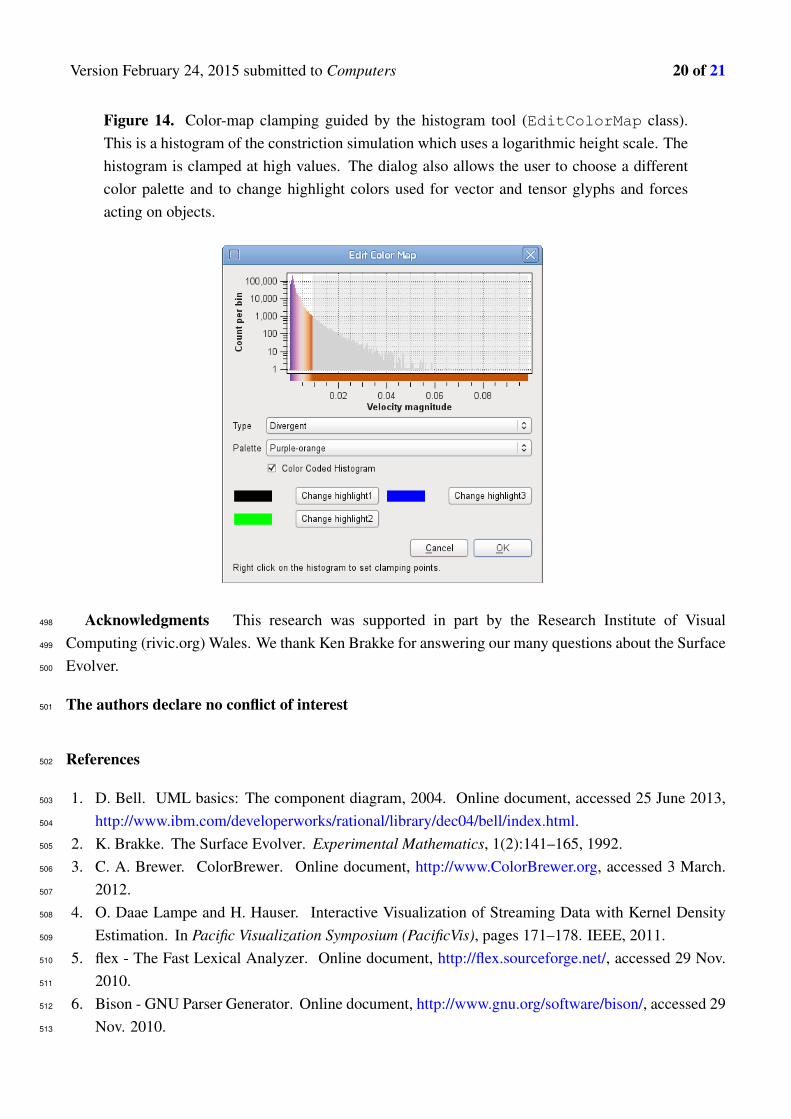