Embed Size (px)
Citation preview
FOLSOM LAND USE PATTERNS IN THE CENTRAL PLAINS
By
Emily G. Williams
Submitted to the graduate degree program in Anthropology
and the Graduate Faculty of the University of Kansas in partial fulfillment of the
requirements for the degree of Doctor of Philosophy.
________________________________
Chairperson Jack L. Hofman
________________________________
Frédéric Sellet
________________________________
Daniel S. Amick
________________________________
Rolfe D. Mandel
________________________________
Terry A. Slocum
Date Defended: February 17th, 2015
ii
The Dissertation Committee for Emily G. Williams
certifies that this is the approved version of the following dissertation:
FOLSOM LAND USE PATTERNS IN THE CENTRAL PLAINS
________________________________
Chairperson Jack L. Hofman
Date approved: February 17th, 2015
iii
Abstract
Folsom people lived in the Plains regions from 10,950 to 10,250 RCYBP. The calibrated
radiocarbon ages for Folsom range between 12,900 to 12,000 years BP. In order to study Folsom
land use in the Central Plains this study performs regional analyses of Paleoindian surface finds.
Few stratified Folsom or early Paleoindian cultural deposits have been recorded in the
Central Plains of Kansas and Nebraska (Blackmar and Hofman 2006; Hofman and Graham
1998), although many Paleoindian projectile points have been found in the region (Hofman
1996; Mandel 2008:342). Regional analyses are paramount to studying large scale land use
patterns of Folsom culture in the Central Plains and Plains region (Amick 1994; Hill 2007;
LeTourneau 2000; Meltzer 2006:16; Andrews et al. 2008). Accurate documentation and study of
diagnostic Folsom artifacts (projectile points, preforms, and channel flakes) from both site and
non-site contexts are required in order to perform regional analyses. The use of surface
collections is key in addressing questions at a regional scale, especially in Nebraska which has
no stratified or well-documented sites. As such, the study of surface artifacts offers the current
best opportunity to study Folsom land use and organization in Nebraska and the Central Plains
region.
This study gives a description of the Central Plains Folsom dataset and what it represents
and concludes by considering how this study’s dataset supports, enhances, or varies from the
expectations of previous models of Folsom land use and technological organization.

iv
Dedication
I dedicate this dissertation to my Dad, Anthony (Tony) Wayne Williams. Thank you, from the
bottom of my heart, for all your help throughout my college education.
v
Acknowledgments
I would like to thank my adviser, Dr. Jack Hofman, for his time, guidance, patience, and
feedback throughout the dissertation process and graduate school years. I know this is a much
better dissertation because of all of your input. I would also like to thank my committee members
Dr. Frédéric Sellet, Dr. Dan Amick, and Dr. Rolfe Mandel for giving their time, thoughtful
feedback, comments, and suggestions. I would like to thank Dr. Terry Slocum, my outside
committee member for his time, feedback, and willingness to serve on my committee at the last
minute.
There are several dozen avocational archaeologists that have made this work possible and
I would like to thank them all. Because of privacy issues I am not listing their names here. I
would like to thank Dr. Steve Holen and Kevin Hammond for sending me information about
additional Folsom artifacts for this project. I thank Rhonda Houser for her kindness and GIS
knowledge, tips, and tricks that she shared with me. The maps in this dissertation would not have
been possible without her imparting some of her extensive GIS skills and knowledge.
Also, I thank my friend and mentor, Dr. Mary Adair, for her support, friendship, and
mentoring throughout the years. I also thank Dr. Adair for being the best darn carpool buddy a
girl could have. I thank my many fellow graduate students and friends, you are too many to name
here, but I thank each and every one of you. I want to thank my friend Dr. Shawna Chapman—
you always knew I could do it and you were right.
I thank my siblings—Erin, Bridget, Joe, and Kate—for their support throughout the
graduate school years. I thank my parents, Tony and Janet, for their encouragement to continue
my education. Also, I thank my grandparents Bill and Willa for their support throughout the

vi
graduate school years. I want to thank my husband, Koushik Adhikari, for his emotional support
throughout the dissertation process.
vii
Table of Contents
Abstract .......................................................................................................................................... iii
Dedication ...................................................................................................................................... iv
Acknowledgments........................................................................................................................... v
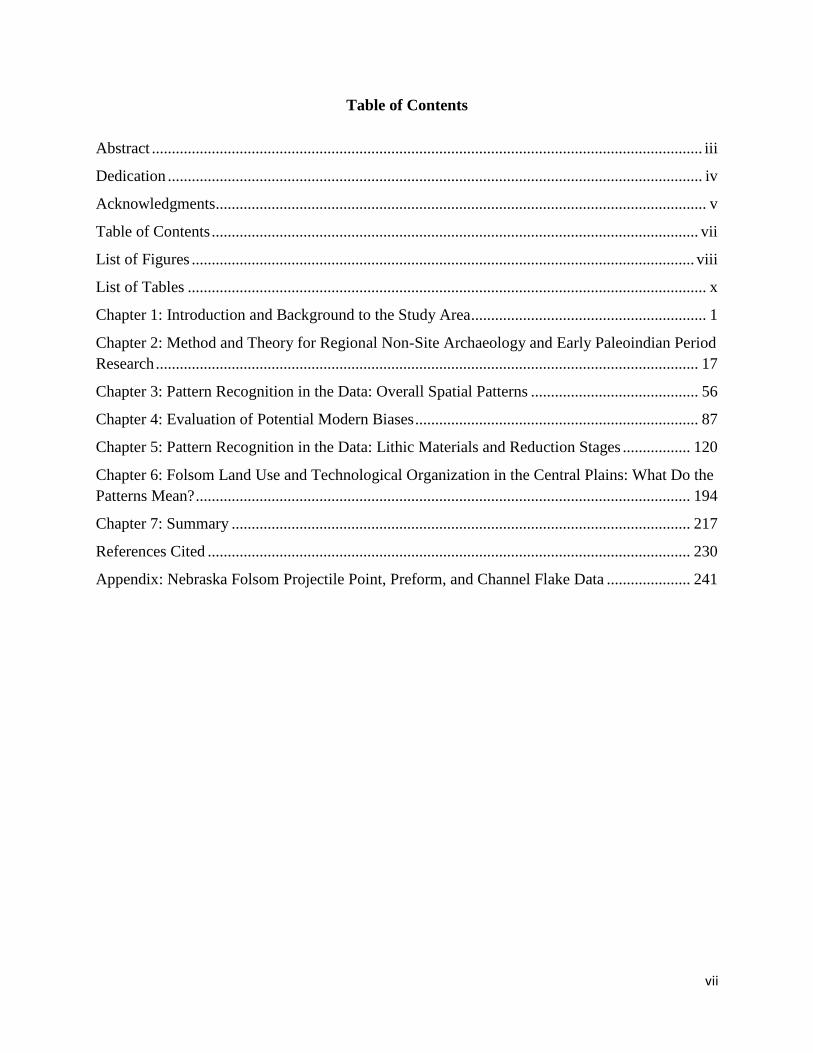
Table of Contents .......................................................................................................................... vii
List of Figures .............................................................................................................................. viii
List of Tables .................................................................................................................................. x
Chapter 1: Introduction and Background to the Study Area ........................................................... 1
Chapter 2: Method and Theory for Regional Non-Site Archaeology and Early Paleoindian Period
Research ........................................................................................................................................ 17
Chapter 3: Pattern Recognition in the Data: Overall Spatial Patterns .......................................... 56
Chapter 4: Evaluation of Potential Modern Biases ....................................................................... 87
Chapter 5: Pattern Recognition in the Data: Lithic Materials and Reduction Stages ................. 120
Chapter 6: Folsom Land Use and Technological Organization in the Central Plains: What Do the
Patterns Mean? ............................................................................................................................ 194
Chapter 7: Summary ................................................................................................................... 217
References Cited ......................................................................................................................... 230
Appendix: Nebraska Folsom Projectile Point, Preform, and Channel Flake Data ..................... 241
viii
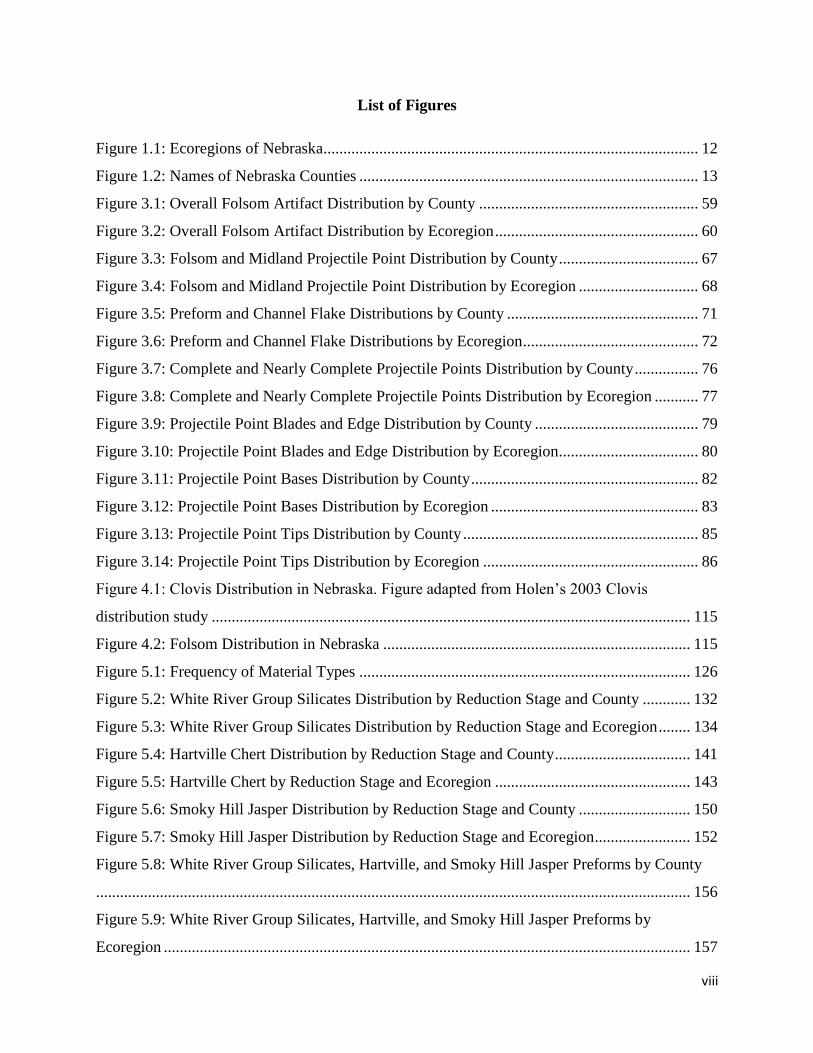
List of Figures
Figure 1.1: Ecoregions of Nebraska.............................................................................................. 12
Figure 1.2: Names of Nebraska Counties ..................................................................................... 13
Figure 3.1: Overall Folsom Artifact Distribution by County ....................................................... 59
Figure 3.2: Overall Folsom Artifact Distribution by Ecoregion ................................................... 60
Figure 3.3: Folsom and Midland Projectile Point Distribution by County ................................... 67
Figure 3.4: Folsom and Midland Projectile Point Distribution by Ecoregion .............................. 68
Figure 3.5: Preform and Channel Flake Distributions by County ................................................ 71
Figure 3.6: Preform and Channel Flake Distributions by Ecoregion............................................ 72
Figure 3.7: Complete and Nearly Complete Projectile Points Distribution by County ................ 76
Figure 3.8: Complete and Nearly Complete Projectile Points Distribution by Ecoregion ........... 77
Figure 3.9: Projectile Point Blades and Edge Distribution by County ......................................... 79
Figure 3.10: Projectile Point Blades and Edge Distribution by Ecoregion................................... 80
Figure 3.11: Projectile Point Bases Distribution by County ......................................................... 82
Figure 3.12: Projectile Point Bases Distribution by Ecoregion .................................................... 83
Figure 3.13: Projectile Point Tips Distribution by County ........................................................... 85
Figure 3.14: Projectile Point Tips Distribution by Ecoregion ...................................................... 86
Figure 4.1: Clovis Distribution in Nebraska. Figure adapted from Holen’s 2003 Clovis
distribution study ........................................................................................................................ 115
Figure 4.2: Folsom Distribution in Nebraska ............................................................................. 115
Figure 5.1: Frequency of Material Types ................................................................................... 126
Figure 5.2: White River Group Silicates Distribution by Reduction Stage and County ............ 132
Figure 5.3: White River Group Silicates Distribution by Reduction Stage and Ecoregion ........ 134
Figure 5.4: Hartville Chert Distribution by Reduction Stage and County .................................. 141
Figure 5.5: Hartville Chert by Reduction Stage and Ecoregion ................................................. 143
Figure 5.6: Smoky Hill Jasper Distribution by Reduction Stage and County ............................ 150
Figure 5.7: Smoky Hill Jasper Distribution by Reduction Stage and Ecoregion........................ 152
Figure 5.8: White River Group Silicates, Hartville, and Smoky Hill Jasper Preforms by County
..................................................................................................................................................... 156
Figure 5.9: White River Group Silicates, Hartville, and Smoky Hill Jasper Preforms by
Ecoregion .................................................................................................................................... 157
ix
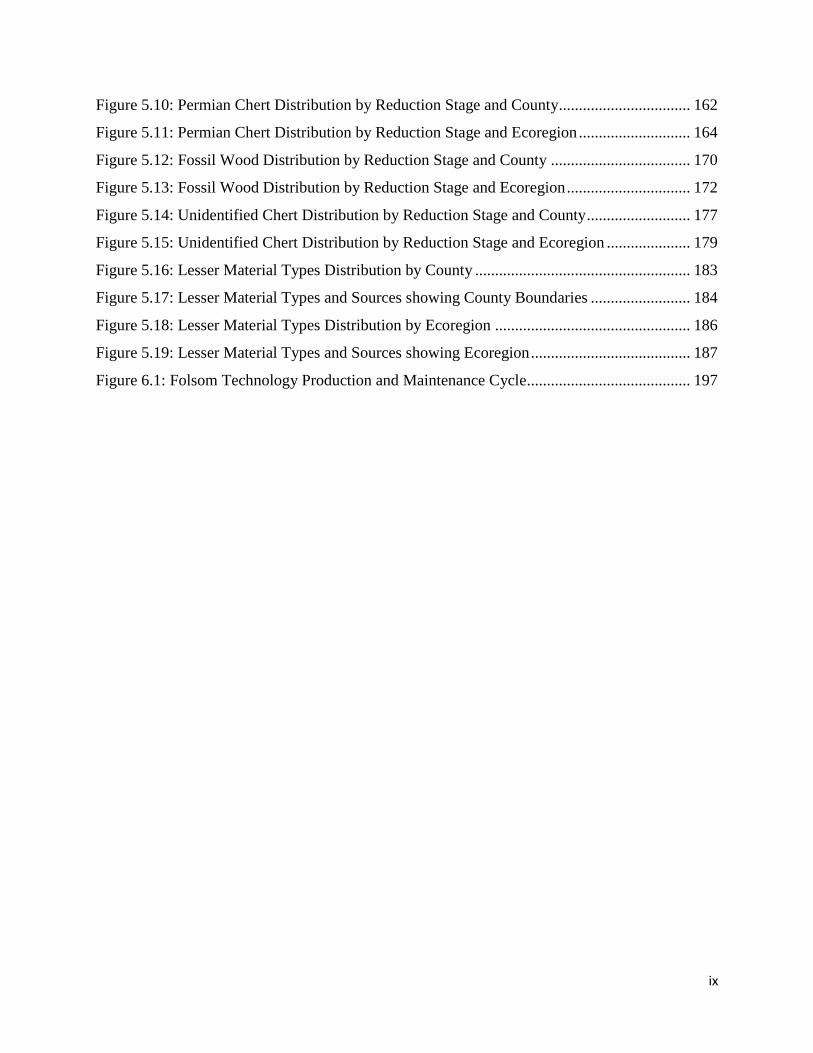
Figure 5.10: Permian Chert Distribution by Reduction Stage and County................................. 162
Figure 5.11: Permian Chert Distribution by Reduction Stage and Ecoregion ............................ 164
Figure 5.12: Fossil Wood Distribution by Reduction Stage and County ................................... 170
Figure 5.13: Fossil Wood Distribution by Reduction Stage and Ecoregion ............................... 172
Figure 5.14: Unidentified Chert Distribution by Reduction Stage and County .......................... 177
Figure 5.15: Unidentified Chert Distribution by Reduction Stage and Ecoregion ..................... 179
Figure 5.16: Lesser Material Types Distribution by County ...................................................... 183
Figure 5.17: Lesser Material Types and Sources showing County Boundaries ......................... 184
Figure 5.18: Lesser Material Types Distribution by Ecoregion ................................................. 186
Figure 5.19: Lesser Material Types and Sources showing Ecoregion ........................................ 187
Figure 6.1: Folsom Technology Production and Maintenance Cycle......................................... 197
x
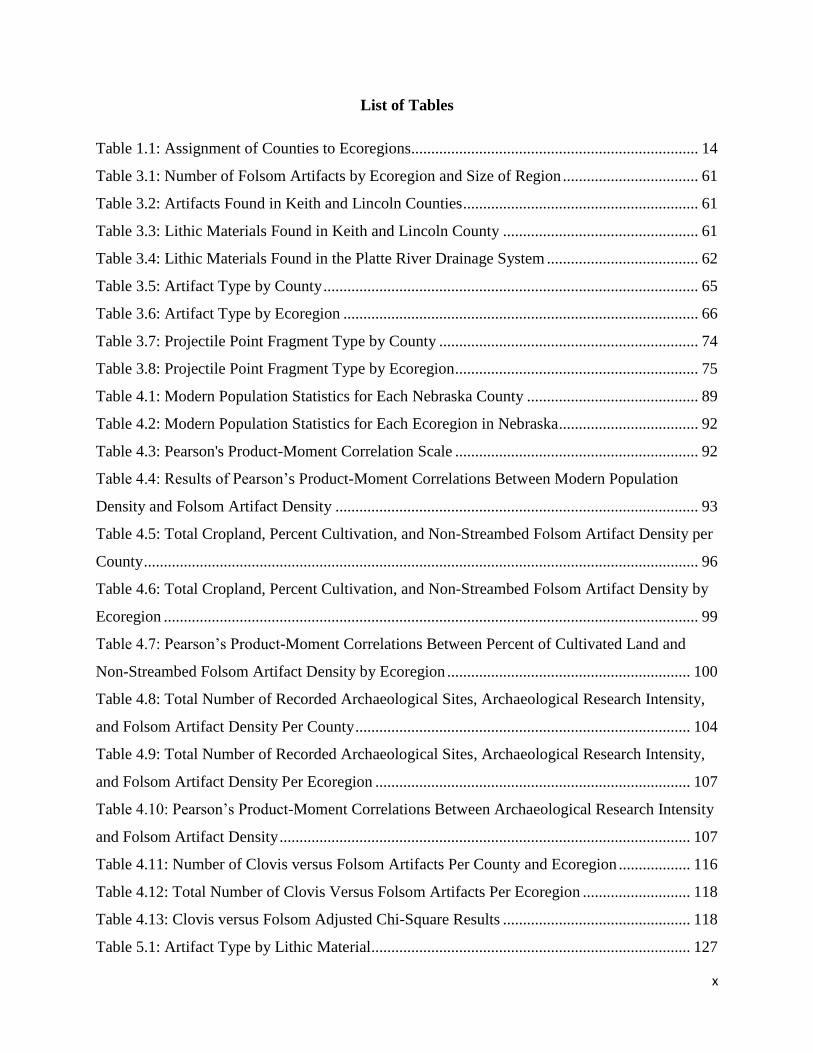
List of Tables
Table 1.1: Assignment of Counties to Ecoregions........................................................................ 14
Table 3.1: Number of Folsom Artifacts by Ecoregion and Size of Region .................................. 61
Table 3.2: Artifacts Found in Keith and Lincoln Counties ........................................................... 61
Table 3.3: Lithic Materials Found in Keith and Lincoln County ................................................. 61
Table 3.4: Lithic Materials Found in the Platte River Drainage System ...................................... 62
Table 3.5: Artifact Type by County .............................................................................................. 65
Table 3.6: Artifact Type by Ecoregion ......................................................................................... 66
Table 3.7: Projectile Point Fragment Type by County ................................................................. 74
Table 3.8: Projectile Point Fragment Type by Ecoregion ............................................................. 75
Table 4.1: Modern Population Statistics for Each Nebraska County ........................................... 89
Table 4.2: Modern Population Statistics for Each Ecoregion in Nebraska ................................... 92
Table 4.3: Pearson's Product-Moment Correlation Scale ............................................................. 92
Table 4.4: Results of Pearson’s Product-Moment Correlations Between Modern Population
Density and Folsom Artifact Density ........................................................................................... 93
Table 4.5: Total Cropland, Percent Cultivation, and Non-Streambed Folsom Artifact Density per
County ........................................................................................................................................... 96
Table 4.6: Total Cropland, Percent Cultivation, and Non-Streambed Folsom Artifact Density by
Ecoregion ...................................................................................................................................... 99
Table 4.7: Pearson’s Product-Moment Correlations Between Percent of Cultivated Land and
Non-Streambed Folsom Artifact Density by Ecoregion ............................................................. 100
Table 4.8: Total Number of Recorded Archaeological Sites, Archaeological Research Intensity,
and Folsom Artifact Density Per County .................................................................................... 104
Table 4.9: Total Number of Recorded Archaeological Sites, Archaeological Research Intensity,
and Folsom Artifact Density Per Ecoregion ............................................................................... 107
Table 4.10: Pearson’s Product-Moment Correlations Between Archaeological Research Intensity
and Folsom Artifact Density ....................................................................................................... 107
Table 4.11: Number of Clovis versus Folsom Artifacts Per County and Ecoregion .................. 116
Table 4.12: Total Number of Clovis Versus Folsom Artifacts Per Ecoregion ........................... 118
Table 4.13: Clovis versus Folsom Adjusted Chi-Square Results ............................................... 118
Table 5.1: Artifact Type by Lithic Material................................................................................ 127
xi
Table 5.2: Projectile Point Fragment Type by Lithic Material ................................................... 128
Table 5.3: Material Type by County (White River Group Silicates, Hartville, Smoky Hill Jasper,
Permian, and All Other Materials) .............................................................................................. 129
Table 5.4: All Lithic Materials by Ecoregion ............................................................................. 130
Table 5.5: White River Group Silicates Artifacts by Reduction Stage and County ................... 131
Table 5.6: White River Group Silicates Artifacts by Reduction Stage and Ecoregion .............. 133
Table 5.7: Hartville Artifacts by Reduction Stage and County .................................................. 140
Table 5.8: Hartville Artifacts by Reduction Stage and Ecoregion .............................................. 142
Table 5.9: Smoky Hill Jasper Artifacts by Reduction Stage and County ................................... 149
Table 5.10: Smoky Hill Jasper Artifacts by Reduction Stage and Ecoregion ............................ 151
Table 5.11: Permian Chert Artifacts by Reduction Stage and County ....................................... 161
Table 5.12: Permian Chert Artifacts by Reduction Stage and Ecoregion................................... 163
Table 5.13: All Other Material Types by County ....................................................................... 168
Table 5.14: Fossil Wood Artifacts by Reduction Stage and County .......................................... 169
Table 5.15: Fossil Wood Artifacts by Reduction Stage and Ecoregion ..................................... 171
Table 5.16: Unidentified Chert by Reduction Stage and County ............................................... 176
Table 5.17: Unidentified Chert by Reduction Stage and Ecoregion ........................................... 178
Table 5.18: All Lesser Material Types by Reduction Stage and by County ............................... 182
Table 5.19: All Lesser Materials by Reduction Stage and Ecoregion ........................................ 185
Table 6.1: Number of Discarded Projectile Points to Preforms and Channel Flakes for
Ecoregions and the North and South Platte River Streambeds in the Central Plains Folsom
Dataset......................................................................................................................................... 203
Table 6.2: Projectile Point to Preform Ratios for the Central Plains Folsom Dataset ................ 208
1
Chapter 1: Introduction and Background to the Study Area
Introduction
Folsom people are early Paleoindian hunter-gatherers who lived in the Plains regions of
North America from 10,950 to 10,250 RCYBP (Haynes et al. 1992:96; Holliday 2000; Meltzer
2006). The calibrated radiocarbon ages for Folsom range between 12,900 to 12,000 years BP
(Taylor et al. 1996). This dissertation performs regional analyses in order to study Folsom land
use in the Central Plains. This dataset of diagnostic Folsom artifacts is from the state of
Nebraska, but Folsom people probably did not live their entire lives in Nebraska. Common lithic
materials represented in the sample are from source areas outside of Nebraska, hence the study of
land use in the Central Plains. This work focuses on the Folsom culture because no comparable
datasets exist (i.e. regional, non-site datasets) for the Central Plains for Agate Basin, Allen, and
Cody, etc. However, this study includes a comparison of Folsom to Clovis in the Central Plains
in terms of distribution, as Holen (2001) has studied Clovis evidence in the Central Plains.
Climatic and ecological differences between Clovis and Folsom time in the region may,
however, have been substantially different.
Statement of the Problem
In the southern and western High Plains, numerous stratified Paleoindian sites have been
recorded (Holliday 2000; Albanese 2000; Mandel 2008:342). In contrast, many Paleoindian
projectile points have been found in the Central Plains of Kansas and Nebraska (Hofman 1996;
Mandel 2008:342), few stratified Folsom or early Paleoindian cultural deposits have been recorded in
the region (Blackmar and Hofman 2006; Hofman and Graham 1998).
Regional analyses are needed to study large scale land use patterns of Folsom culture in the
2
Plains region (Amick 1994; Hill 2007; LeTourneau 2000; Meltzer 2006:16; Andrews et al. 2008). In
order to perform such regional analyses, accurate documentation and study of diagnostic Folsom
artifacts (projectile points, preforms, and channel flakes) from site and non-site contexts are required.
The use of surface collections is of key importance in addressing questions at a regional scale,
especially in Nebraska. According to the Nebraska State Historical Society records, only twelve
Folsom sites have been recorded in the state. The highest level of archaeological work conducted at
these sites varied; eight were surveyed by a professional archaeologist, one was tested, and three
were reported. Extensive excavations were not conducted at any of these sites (Nelson 2015).
According to Bozell (1994:90), “Intact Clovis or Folsom sites have not been discovered in
Nebraska.” Therefore, the study of surface artifacts offers the current best opportunity to study
Folsom land use in Nebraska and the Central Plains region.
The primary goal of this dissertation is to use regional analysis to study organization and land
use patterns of Folsom people who lived in the Central Plains. This dissertation will evaluate
potential reasons for the very uneven distribution of Folsom evidence in the region as it is now
documented. The current sample lacks evidence for Folsom artifacts for the northeastern, north
central, and other portions of Nebraska. Andrews et al. (2008) also provide an example of regional
archaeology and shows gaps in the Nebraska area. This study has a greatly expanded Nebraska
Folsom dataset as compared to the sample presented in Andrews et al. (2008).
The locations for many Folsom surface finds are recorded to the county level or general
locality—rather than from specific site contexts. Nonetheless, the surface artifacts in this database
provide the best available documentation of the Folsom archaeological record within the Central
Plains region, and so provide the best available evidence for interpreting aspects of Folsom behavior
on a regional scale. Such study would not be possible if it were limited to excavated or site-based
assemblages (Williams and Hofman 2010). I acknowledge the arguments (e.g., Bamforth 2009;
Sellet 2004; Speth et al. 2010) made about limitations of studying projectile points exclusive to other
3
artifact classes. However, because this sample is from surface contexts, it is limited to only
diagnostic Folsom artifacts including projectile points, preforms, and channel flakes.
What the Nebraska Folsom Sample Represents
The current sample of Folsom artifacts for Nebraska consists of 306 artifacts, including
249 projectile points and point fragments, 48 preforms, and 9 channel flakes. This database
consists of surface collections documented in publications and private and institutional
collections. In general, surface artifact collections have limited contextual information (Sellet
2006:224), which is the case for this sample. The sample is composed entirely of weaponry-
related artifacts (projectile points, preforms, and channel flakes). The locational information for
the artifact sample is primarily at the county, locality, and site levels. The majority of the sample
is composed of isolated finds and a few localities. Only a few recorded “sites” are represented in
the sample, and these also have surface-derived collections.
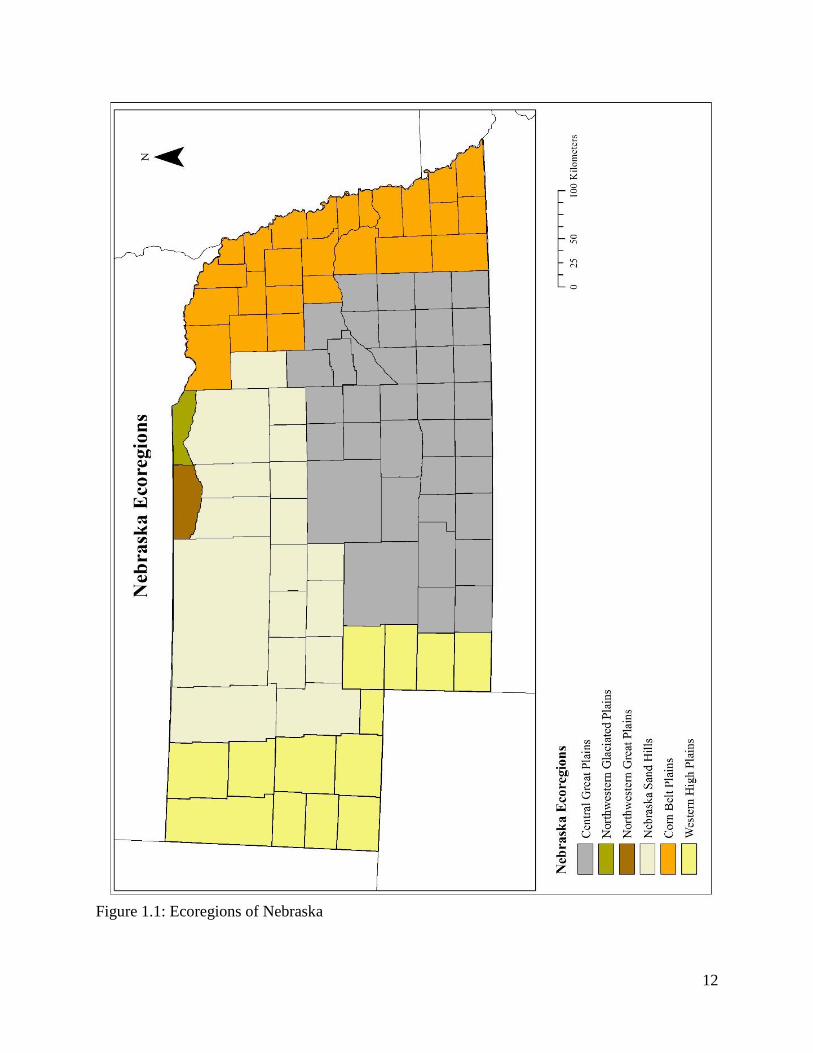
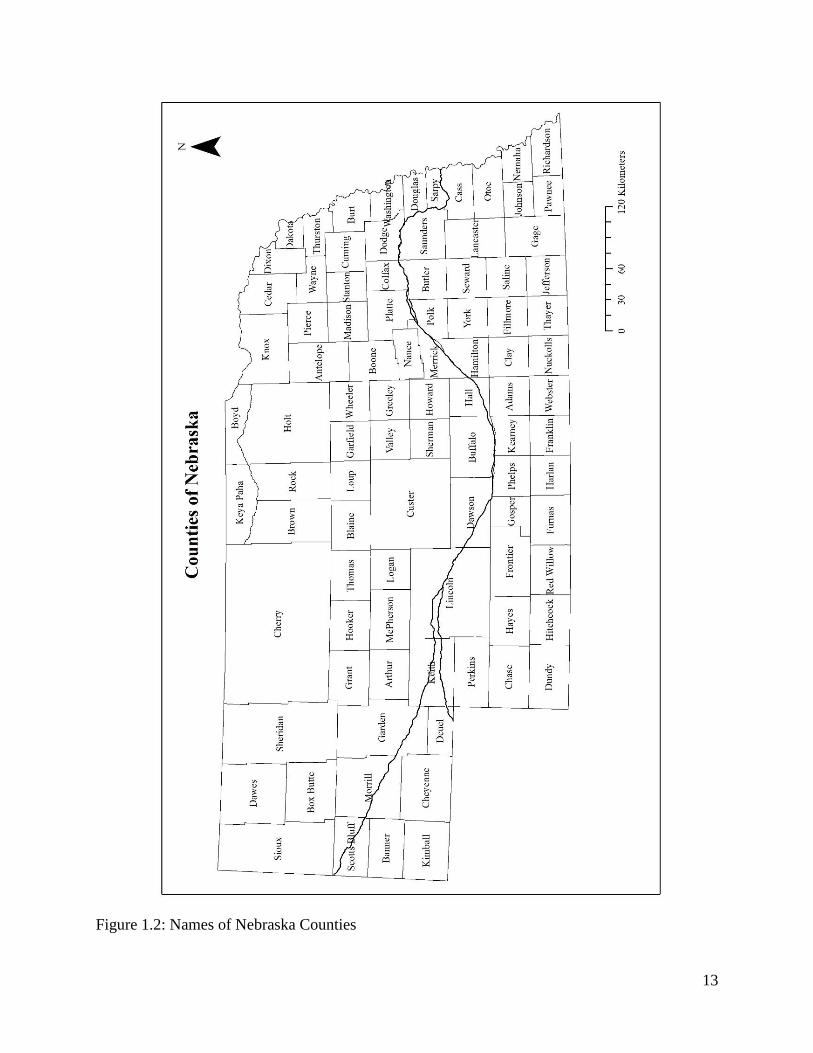
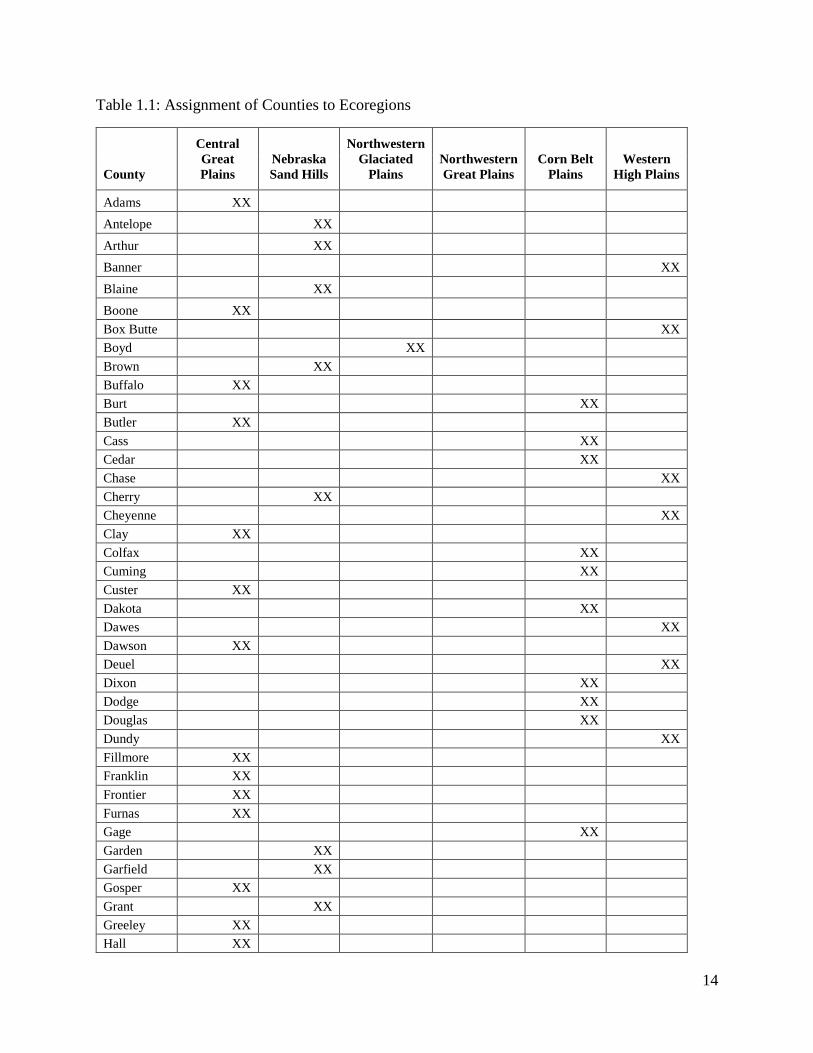
The Folsom artifacts in this study are partitioned into ecological regions (or ecoregions) and
along the North and South Platte Rivers of Nebraska in order to compare the differing patterns
among the Folsom artifact samples found across the area. The ecological regions represented in
Nebraska include: the Central Great Plains, Nebraska Sand Hills, Northwestern Glaciated Plains,
Northwestern Great Plains, Corn Belt Plains, and Western High Plains (Figure 1.1, Table 1.1).
This geographic partitioning provides the means for an initial assessment of the evenness of
Folsom archaeological evidence across the physiographically diverse Central Plains (Nebraska)
region. This distribution enables the recognition of artifact concentrations and gaps across the
region and serves as a starting point for further evaluation and investigation, which may
eventually include detailed paleo-ecological evidence. No implication exists that these modern
ecoregions correspond to specific habitats during Folsom time. These regions are linked to soils,
physiography, and drainages and may have varied with distinctive ecologies during Folsom time.
4
The artifacts in the Central Plains Folsom sample encompass a scale that is also temporally
expansive. The artifacts could be from throughout the Folsom time period, so the entire time
scale of approximately 900 years of land use by Folsom people is assumed for this study.
Temporally, this study looks at land use on the scale of many centuries to assess redundant and
recurrent regional land use patterns, based on the types of tools and lithic materials left by
Folsom peoples in the Central Plains. This study relies upon the Folsom time span as reported by
Haynes et al. (1992:96) who reported uncalibrated radiocarbon ages from 10,950 to 10,250 bp
from dates on charcoal from nine Folsom sites. The calibrated radiocarbon ages from these same
nine sites range from 12,900 to 12,000 years BP (Taylor et al. 1996). This would give Folsom a
900 year time span. Holliday (2000:227) reports that the age of Folsom on the Southern Great
Plains dates from 10,900 to 10,100 RCYBP, and on the Northern Great Plains, Folsom dates
from 10,900 to 10,200 RCYBP. Meltzer (2006:146-147) dated charcoal samples from the
Folsom site and these samples ranged from 10,010 to 11,370 RCYBP. Six samples of bison bone
from the site were dated and the mean age range for these samples was 10,490 ± 20 RCYBP.
Meltzer’s reassessment of dates from the Folsom site concluded that the charcoal yielded age
ranges that were a maximum age of the deposits, as charcoal “can be older than the sediments in
which it was embedded” (Meltzer 2006:147). Therefore, based on the bones that were directly
dated, he concluded that the age of the bison kill at the site was ~10,500 RCYBP.
The Central Plains Folsom dataset also encompasses a large geographic region, including
the entire state of Nebraska and lithic source areas outside the state. This provides an appropriate
geographic scale to address large-scale regional land use strategies because it contains a broad
diversity of physiographic regions (or ecoregions) and resources. The state of Nebraska covers
an area of 200,282 km2. Obviously, land use by Folsom peoples was not restricted by modern
5
state boundaries; their economic territories overlapped in various ways with Nebraska as
indicated by commonly used lithic source areas that occur outside the state.
Research Goals and Research Questions
This dissertation has two research goals with several research questions under each.
Research goals are as follows: 1) To evaluate modern factors and formation processes that may
have impacted the Folsom archaeological record and 2) To evaluate the evidence for Folsom
group behavior and land use based on the archaeological record of Folsom in the Central Plains.
Specifically, how can the analysis of chipped stone artifacts inform us about large-scale land use,
organization, and mobility of Folsom people in this region?
Goal #1: To evaluate modern factors and formation processes that may have impacted the
Folsom archaeological record.
Before this study could address research goal #2, we must first consider factors other than
Folsom peoples’ behaviors; e.g., modern population, contemporary land use practices, landform
changes, and potential sampling bias based on archaeological research activity, that may have
influenced the record.
Research Question 1.1 to address Goal #1: Does modern population density have a positive
correlation with the Folsom artifact distribution in Nebraska?
Methods to address Research Question 1.1. It is assumed that modern population has the
potential to affect the visibility of the Folsom archaeological record. Thus, it is important to
consider whether modern population is a factor affecting the documentation of Folsom artifacts.
Since most artifact collectors presumably hunt primarily close to where they live, modern
population density may be predicted to correlate with the number of collectors hunting in that
area (c.f., Prasciunas 2008). If so, the higher the population, other factors being equal, the greater
the chances of Folsom artifacts being found in that area. In order to answer this research
6
question, population density was derived for each county in Nebraska by dividing the total
population of each county by the land area per county. Population information for each county
with Folsom artifacts in Nebraska was derived from the U.S. Census Bureau using 1950
figures—the time when many of these artifacts were found and believed to be a better estimate
than current population to characterize overall 20th century population. Pearson’s product-
moment correlations were used to assess whether modern population density had a positive
correlation with the known Folsom artifact distribution in Nebraska.
Research Question 1.2 to address Goal #1: Do contemporary land use practices, specifically
land under cultivation, have a positive correlation with the Folsom artifact distribution in
Nebraska?
Methods to address Research Question 1.2. It is generally assumed that land under
cultivation increases the surface visibility of the archaeological record, and therefore, the greater
the amount of land under cultivation in an area, the greater chances that artifacts will be found on
the surface. Thus, it is important to consider whether cultivation is a factor affecting the visibility
of the Folsom archaeological record. In order to answer the research question, the total acreage
of cultivated land for each county with Folsom artifacts in Nebraska was extracted from the U.S.
Department of Agriculture 1950 Census of Agriculture. Cultivated acreage was converted into
km2. Then a percentage of county area under cultivation was derived by dividing the land area
under cultivation by the total county land area. Pearson’s product-moment correlation was
calculated to assess whether cultivated land had a positive correlation with the distribution of
Folsom artifacts in Nebraska found in upland contexts. Only Folsom artifacts found in non-
riverbed contexts were considered to assess this research question, as artifacts that come from
active river channels may be independent of landuse—that is, land under cultivation is
presumably not a factor for visibility of these artifacts.

7
Research Question 1.3 to address Goal #1: What is the impact of potential sampling bias
based on archaeological research activity?
Methods to address Research Question 1.3. The potential sampling bias based on
archaeological research activity was assessed by examining the total number of archaeological
sites (excavated and surface sites) reported per county and this frequency was compared with the
distribution of surface Folsom diagnostic artifacts to assess potential correlations by county. The
Nebraska archaeological site file database was used to assess the number of recorded prehistoric
sites per county, as a general measure of professional archaeological activity. The goal was to
assess potential sampling bias based on archaeological research activity.
Goal #2: Evaluate the evidence for Folsom group behavior and land use based on the
archaeological record. Specifically, how can the analysis of chipped stone artifacts inform
us about large-scale land use, organization, and mobility of Folsom people in the Central
Plains?
Specific Questions to Address Research Goal #2. After considering the above post-
depositional and biasing variables and assessing the distribution of Folsom artifacts, what
patterns remain and how may these patterns inform us about Folsom group behavior? What
evidence is there which might pertain to the behavior and land use of Folsom people? The
following questions were addressed: Can the concentration of Folsom evidence near the
confluence of the North and South Platte rivers be attributed entirely to factors other than the
behavior of Folsom people? Does the concentration of Folsom artifacts near the confluence of
the North and South Platte Rivers reflect Folsom activity rather than other variables—such as
geomorphic processes, modern population, land under cultivation, or problems with sampling?
Were Folsom people living in the area continuously, or were they exploiting specific areas in
Nebraska on a seasonal basis? Were Folsom people settling in the Rocky Mountain foothills and
then using the High Plains for hunting (c.f., Amick 1994)? How would the Folsom
archaeological record differ if they were living in Nebraska year round versus only seasonally? Is
8
the direction of resource use (from lithic material source areas) proportionately equal from the
west, east, north, and south (in proportion to the availability of lithic materials)? Is there
evidence for staging of Folsom projectile point production, and if so how does this evidence
pattern? These questions were addressed when considering the evidence for Folsom land use
based on the archaeological record of Folsom in Nebraska.
Goals of My Contribution
Spatial studies of surficial datasets are key to regional studies in archaeology (Ebert
1992). Folsom artifacts can function as horizon markers across extensive landscapes for GIS
based studies. One of the goals of this dissertation is to further demonstrate the usefulness of
using surface collections to study land use at large regional scales. Surface collections should be
viewed as a significant source of information (see Dunnell and Dancey 1983) which can
contribute to understanding and interpreting land use at large regional scales such as the Central
Plains. This is true even when excavated assemblages are available for acquiring distributional
information. Interpreting distributional patterns in Folsom artifacts was done with consideration
of the potential influence of ecological regions, historic land use practices, modern population,
and prehistoric behavior. Folsom land use patterns identified here were compared to those of
previous studies and revealed elements of similarity and diversity in Folsom techno-cultural
systems. This study evaluated models, using the Nebraska area dataset, which have been offered
for Folsom organization and technology.
Background on Using Modern Ecoregions and Paleoenvironment
This study uses modern ecoregions (Figure 1.1, Table 1.1), to divide the Central Plains
Folsom artifact sample into broad environmental regions. The GIS ecoregion data was
downloaded from the U.S. Environmental Protection Agency website
9
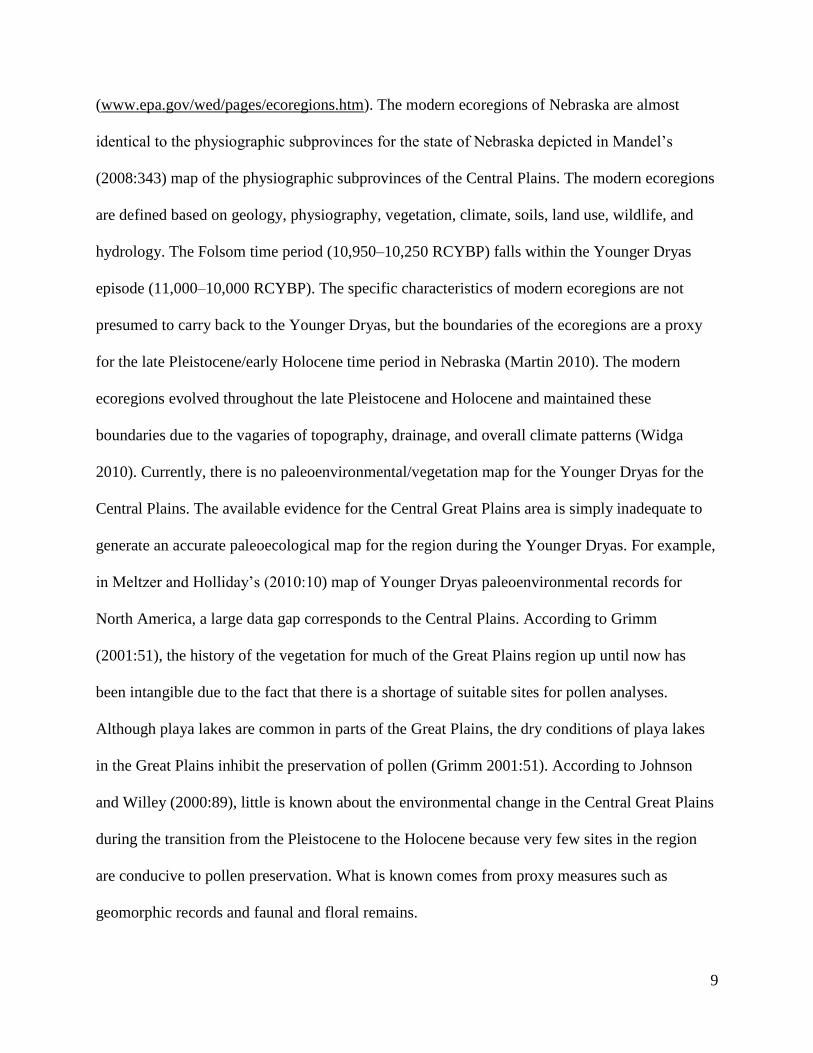
(www.epa.gov/wed/pages/ecoregions.htm). The modern ecoregions of Nebraska are almost
identical to the physiographic subprovinces for the state of Nebraska depicted in Mandel’s
(2008:343) map of the physiographic subprovinces of the Central Plains. The modern ecoregions
are defined based on geology, physiography, vegetation, climate, soils, land use, wildlife, and
hydrology. The Folsom time period (10,950–10,250 RCYBP) falls within the Younger Dryas
episode (11,000–10,000 RCYBP). The specific characteristics of modern ecoregions are not
presumed to carry back to the Younger Dryas, but the boundaries of the ecoregions are a proxy
for the late Pleistocene/early Holocene time period in Nebraska (Martin 2010). The modern
ecoregions evolved throughout the late Pleistocene and Holocene and maintained these
boundaries due to the vagaries of topography, drainage, and overall climate patterns (Widga
2010). Currently, there is no paleoenvironmental/vegetation map for the Younger Dryas for the
Central Plains. The available evidence for the Central Great Plains area is simply inadequate to
generate an accurate paleoecological map for the region during the Younger Dryas. For example,
in Meltzer and Holliday’s (2010:10) map of Younger Dryas paleoenvironmental records for
North America, a large data gap corresponds to the Central Plains. According to Grimm
(2001:51), the history of the vegetation for much of the Great Plains region up until now has
been intangible due to the fact that there is a shortage of suitable sites for pollen analyses.
Although playa lakes are common in parts of the Great Plains, the dry conditions of playa lakes
in the Great Plains inhibit the preservation of pollen (Grimm 2001:51). According to Johnson
and Willey (2000:89), little is known about the environmental change in the Central Great Plains
during the transition from the Pleistocene to the Holocene because very few sites in the region
are conducive to pollen preservation. What is known comes from proxy measures such as
geomorphic records and faunal and floral remains.
10
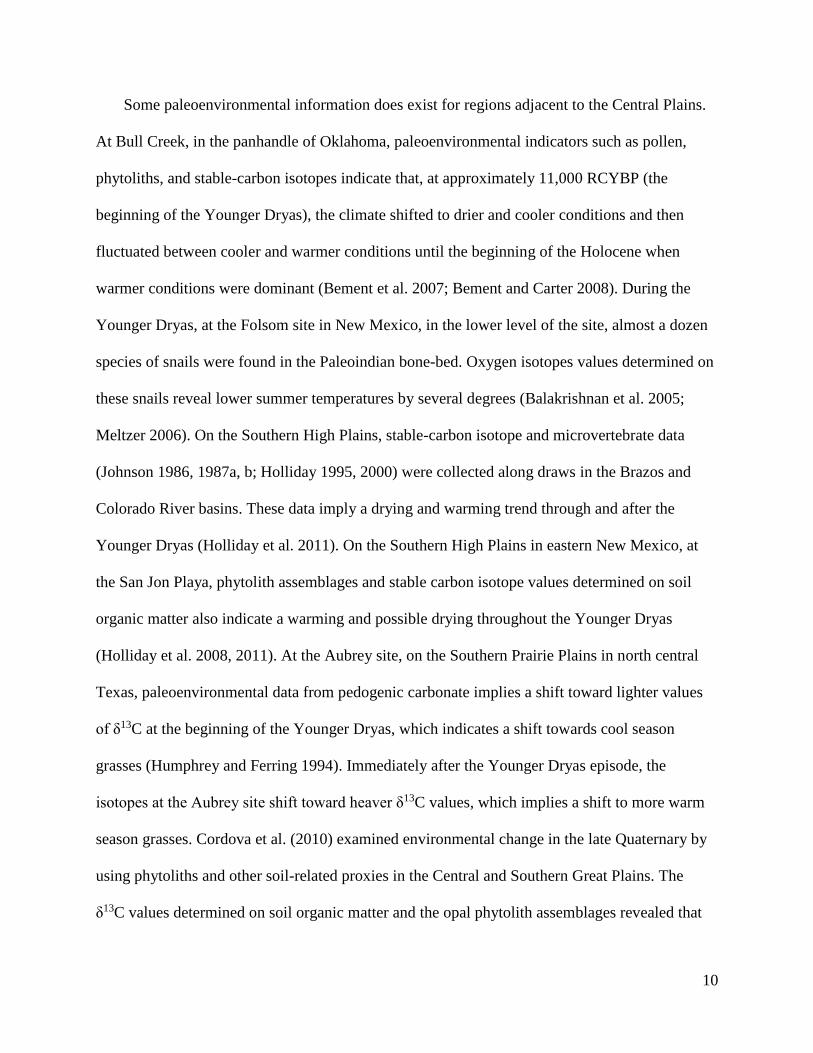
Some paleoenvironmental information does exist for regions adjacent to the Central Plains.
At Bull Creek, in the panhandle of Oklahoma, paleoenvironmental indicators such as pollen,
phytoliths, and stable-carbon isotopes indicate that, at approximately 11,000 RCYBP (the
beginning of the Younger Dryas), the climate shifted to drier and cooler conditions and then
fluctuated between cooler and warmer conditions until the beginning of the Holocene when
warmer conditions were dominant (Bement et al. 2007; Bement and Carter 2008). During the
Younger Dryas, at the Folsom site in New Mexico, in the lower level of the site, almost a dozen
species of snails were found in the Paleoindian bone-bed. Oxygen isotopes values determined on
these snails reveal lower summer temperatures by several degrees (Balakrishnan et al. 2005;
Meltzer 2006). On the Southern High Plains, stable-carbon isotope and microvertebrate data
(Johnson 1986, 1987a, b; Holliday 1995, 2000) were collected along draws in the Brazos and
Colorado River basins. These data imply a drying and warming trend through and after the
Younger Dryas (Holliday et al. 2011). On the Southern High Plains in eastern New Mexico, at
the San Jon Playa, phytolith assemblages and stable carbon isotope values determined on soil
organic matter also indicate a warming and possible drying throughout the Younger Dryas
(Holliday et al. 2008, 2011). At the Aubrey site, on the Southern Prairie Plains in north central
Texas, paleoenvironmental data from pedogenic carbonate implies a shift toward lighter values
of δ13C at the beginning of the Younger Dryas, which indicates a shift towards cool season
grasses (Humphrey and Ferring 1994). Immediately after the Younger Dryas episode, the
isotopes at the Aubrey site shift toward heaver δ13C values, which implies a shift to more warm
season grasses. Cordova et al. (2010) examined environmental change in the late Quaternary by
using phytoliths and other soil-related proxies in the Central and Southern Great Plains. The
δ13C values determined on soil organic matter and the opal phytolith assemblages revealed that
11
areas dominated today by C4 grasses were dominated by woody plants and C3 grasses before
10,000 14C yr B.P.
In their study of the stratigraphy and paleoenvironments of the Younger Dryas episode in
the Great Plains, Holliday et al. (2011:520) conclude that “the various geomorphic systems of the
Great Plains did not behave synchronously in response to any common climate driver. These
stratigraphic records reflect local environmental conditions and probably a complex response to
the reorganization of mid-latitude climates in the terminal Pleistocene and early Holocene.”
Thus, reconstruction of the climate in the Great Plains during the Younger Dryas episode relies
on proxy measures (e.g., soil and sediment data and stable carbon isotope analysis) and does not
rely on pollen.
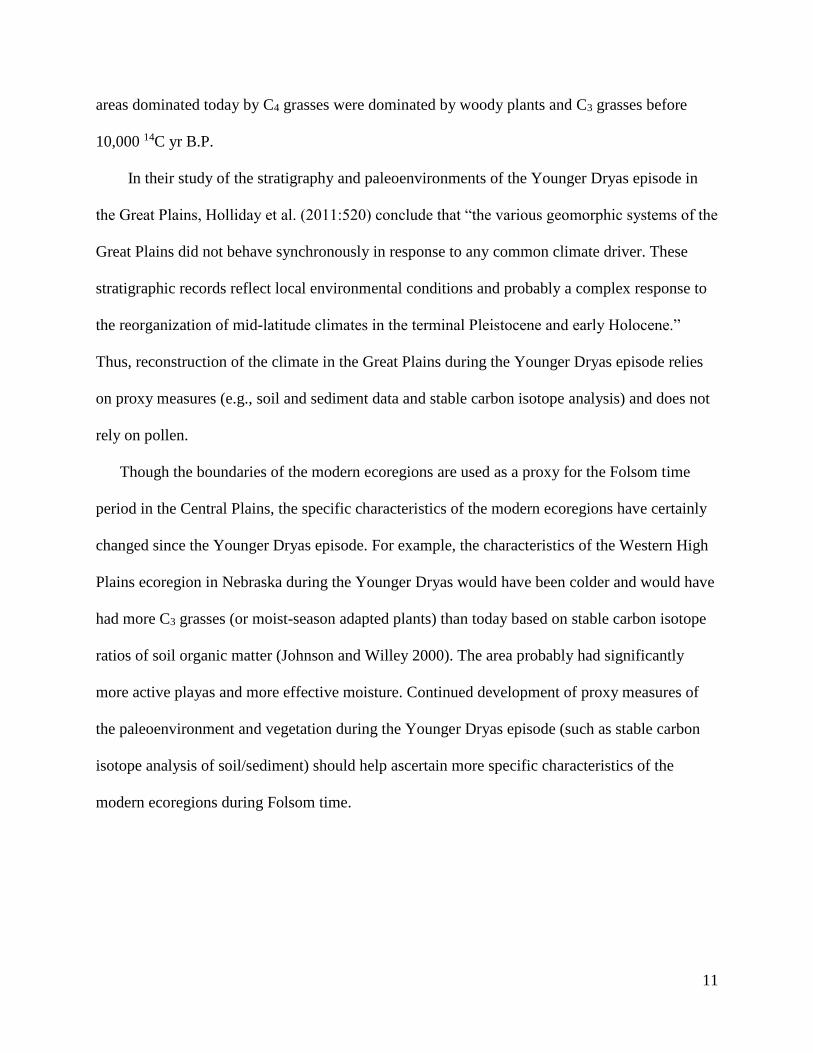
Though the boundaries of the modern ecoregions are used as a proxy for the Folsom time
period in the Central Plains, the specific characteristics of the modern ecoregions have certainly
changed since the Younger Dryas episode. For example, the characteristics of the Western High
Plains ecoregion in Nebraska during the Younger Dryas would have been colder and would have
had more C3 grasses (or moist-season adapted plants) than today based on stable carbon isotope
ratios of soil organic matter (Johnson and Willey 2000). The area probably had significantly
more active playas and more effective moisture. Continued development of proxy measures of
the paleoenvironment and vegetation during the Younger Dryas episode (such as stable carbon
isotope analysis of soil/sediment) should help ascertain more specific characteristics of the
modern ecoregions during Folsom time.
12
Figure 1.1: Ecoregions of Nebraska
13
Figure 1.2: Names of Nebraska Counties
14
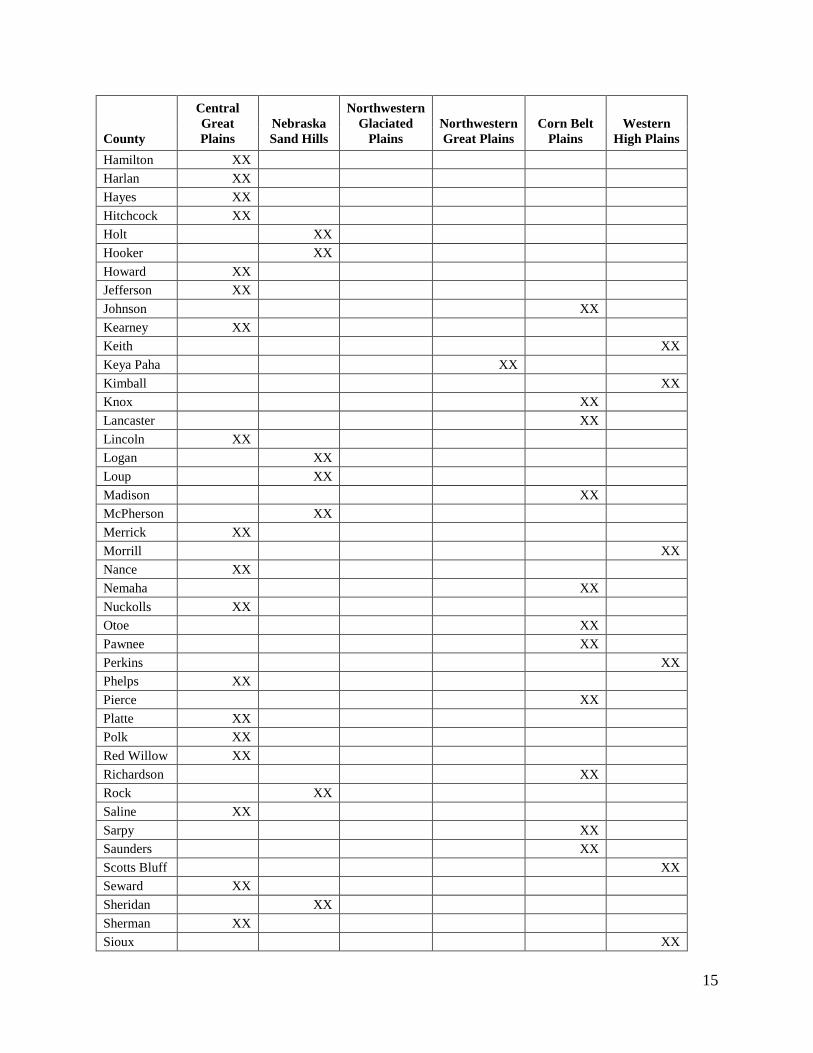
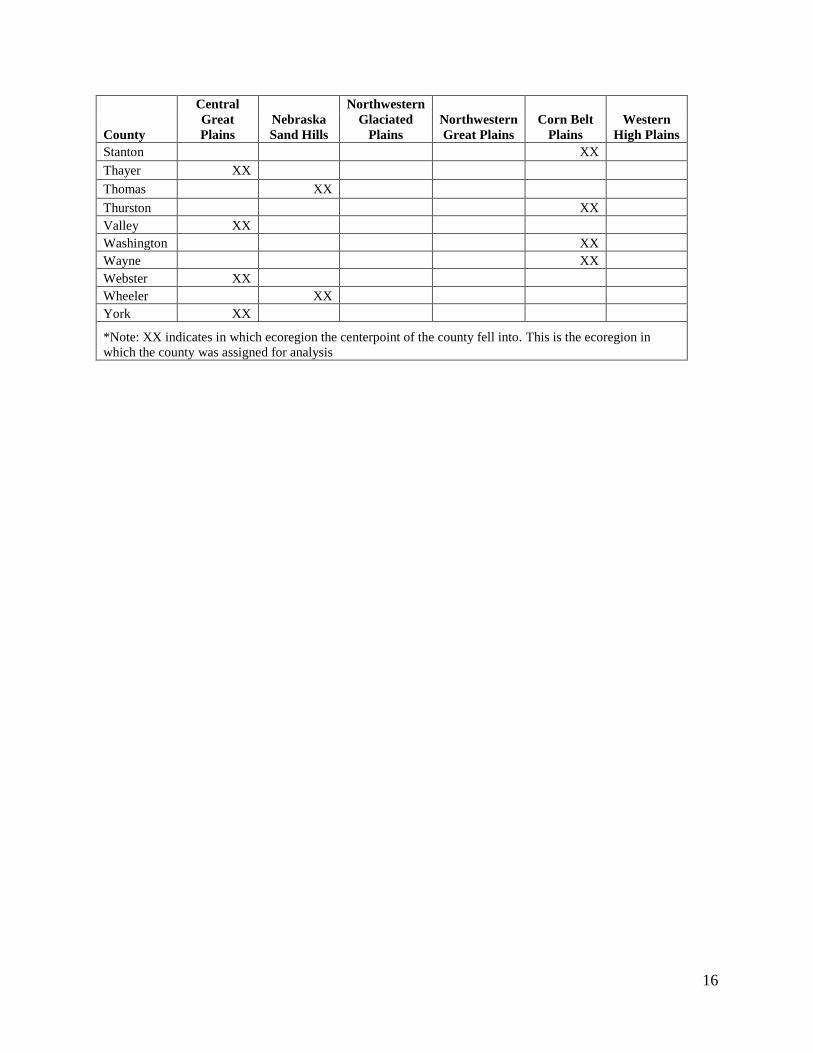
Table 1.1: Assignment of Counties to Ecoregions
County
Central
Great
Plains
Nebraska
Sand Hills
Northwestern
Glaciated
Plains
Northwestern
Great Plains
Corn Belt
Plains
Western
High Plains
Adams XX
Antelope XX
Arthur XX
Banner XX
Blaine XX
Boone XX
Box Butte XX
Boyd XX
Brown XX
Buffalo XX
Burt XX
Butler XX
Cass XX
Cedar XX
Chase XX
Cherry XX
Cheyenne XX
Clay XX
Colfax XX
Cuming XX
Custer XX
Dakota XX
Dawes XX
Dawson XX
Deuel XX
Dixon XX
Dodge XX
Douglas XX
Dundy XX
Fillmore XX
Franklin XX
Frontier XX
Furnas XX
Gage XX
Garden XX
Garfield XX
Gosper XX
Grant XX
Greeley XX
Hall XX
15
County
Central
Great
Plains
Nebraska
Sand Hills
Northwestern
Glaciated
Plains
Northwestern
Great Plains
Corn Belt
Plains
Western
High Plains
Hamilton XX
Harlan XX
Hayes XX
Hitchcock XX
Holt XX
Hooker XX
Howard XX
Jefferson XX
Johnson XX
Kearney XX
Keith XX
Keya Paha XX
Kimball XX
Knox XX
Lancaster XX
Lincoln XX
Logan XX
Loup XX
Madison XX
McPherson XX
Merrick XX
Morrill XX
Nance XX
Nemaha XX
Nuckolls XX
Otoe XX
Pawnee XX
Perkins XX
Phelps XX
Pierce XX
Platte XX
Polk XX
Red Willow XX
Richardson XX
Rock XX
Saline XX
Sarpy XX
Saunders XX
Scotts Bluff XX
Seward XX
Sheridan XX
Sherman XX
Sioux XX
16
County
Central
Great
Plains
Nebraska
Sand Hills
Northwestern
Glaciated
Plains
Northwestern
Great Plains
Corn Belt
Plains
Western
High Plains
Stanton XX
Thayer XX
Thomas XX
Thurston XX
Valley XX
Washington XX
Wayne XX
Webster XX
Wheeler XX
York XX
*Note: XX indicates in which ecoregion the centerpoint of the county fell into. This is the ecoregion in
which the county was assigned for analysis
17
Chapter 2: Method and Theory for Regional Non-Site Archaeology and Early Paleoindian
Period Research
Regional Non-Site Archaeological Theory
Regional archaeology is a theoretical construct advanced by Robert Foley and can be
used to explain why archaeological research is hindered if we limit ourselves to the study of only
excavated, documented, and well-studied sites. It can also be used to justify the importance and
significance of surface artifact datasets that represent extensive areas (e.g. an entire state). Foley
(1981a: 1) examines the archaeological record in terms of its regional scale and ecological basis
and investigates this scale in terms of its promise for offering spatial information. He constructed
a model, based on the assumption that archaeological data are connected to mainly long-standing
overall behavioral characteristics, and that ecological theory could be employed to foresee their
structure. The model ought to offer a way of obtaining information from extensive scatterings of
surface material. Foley (1981a; 1981b; 1981c) presents a theoretical basis for an “off-site”
approach to archaeology and an analysis of artifact density on regional scales.
Foley argues that for several reasons the archaeological record is spatially continuous—
that is, artifacts occur unremittingly across a landscape—and differ only in terms of their
variable density. This is what he refers to as regional archaeological structure and he advocates
an off-site approach to utilize this spatial continuity in order to maximize archaeological
information (Foley 1981a: 2). Foley establishes that the archaeological record is spatially
continuous by showing that the behavior of humans takes place continuously across the
landscape. Because the archaeological record is spatially continuous, the “site” may not be the
best framework for its analysis and is certainly not the only proper scale. Within archaeology, via
18
the process of artifact discard, it is possible to gain access to information about human behavior.
Artifact discard “is a function of the rate of use and the distribution of human activity…” and
“…access to prehistoric behavior is further influenced by the fact that human activity is
preferentially concentrated at spatial foci” (Foley 1981b: 158). But, not all human activity, and
specifically debris-producing activity, adheres to this pattern. Some of the debris-producing
activity occurs at locations away from the site or settlement. Therefore, the most straightforward
model for initial artifact distribution is a succession of concentrations which grade outward to a
dispersed scatter of artifacts.
We can infer that the activities of humans are not only focused at home bases or
settlements which could eventually become archaeological sites, but instead human activities are
dispersed across landscapes. This occurs at and can be studied at multiple scales (Andrew et al.
2008; Johnson 1977). From this viewpoint settlements or home bases are centers on the
landscape where a high-level of human activity occurs, and the distinctions between different
sections of the landscape are ones of various degree or intensity of activity of various types.
Because of this we may conclude that the behavior of humans is “spatially continuous” (Foley
1981a: 2). Instead of viewing the archaeological record as a scheme of structured sites, we
should view it as a continuous pattern of variable artifact densities and distributions (Foley
1981b).
Foley argues that human behavior is not only spatially continuous, but that its structure
can be described and understood by looking to ecological theory. Because much of human
behavior is related to subsistence strategies, it can be expected that patterns of human behavior
and archaeological distribution will correspond with rules of ecological theory that express the
association between human populations and their resources. The most relevant concept and
19
analytical device for observing this spatial patterning of human adaptation and behavior is the
“home range.” He defines the home range as “the area over which an animal normally travels in
pursuit of its routine activities,” and that the home range simply refers to the area in which
resources are exploited (Foley 1981a: 2).
Because human activity is specific to the home range and is spatially continuous, then by
way of the processes of artifact use and discard the material expressions of that human activity
will also be dispersed continuously. In essence, the artifact distribution and density will be a sign
of the configuration of the utilization of resources (Foley 1981a: 3). Therefore, the
archaeological record can best be analyzed in terms of an “off-site” (beyond the site) approach
that takes into account a regional archaeological structure and discard pattern.
Another important consideration is that of accumulation. The archaeological record is
rarely the result of a succinct occurrence of human behavior, but instead is the product of
extended buildup of repetitive events. This is particularly true with prehistory on the regional
scale where the perceptible archaeological manifestations can singularly be understood under the
circumstances of palimpsests of human activities. All of this must be considered in order to
assess the archaeological record on the regional scale signified by the patterns of artifact
densities. Based on the magnitude of the accumulative process, the extent of the archaeological
record scale is conceivably considerably bigger than we have typically thought (Foley 1981a:
12).
Analyzing the variability of regional artifact densities can offer information on the
patterned behaviors (adaptations) of prehistoric peoples (Foley 1981a: 14-16). A regional
archaeology model attempts to describe the relationship connecting observable archaeological
information and prehistoric human activities. Such models also try to assess the relationship
20
between the spatial pattern of subsistence behavior and the structure of the archaeological record.
The spatial pattern of human populations can be described, at least partially, by ecological
principles. In particular, if we think in terms of the home range, these ecological principles
underlie the archaeological record’s formation. Given that regional archaeological structure is
spatially continuous, it is further affected by geomorphological and other processes that occur
post-depositionally. Such processes are exacerbated by accumulation or palimpsests of human
behavior all contributing to the ubiquitous distribution of archaeological material which affects
not only appropriate analytical scales, but also their interpretation. It is because of these factors,
that archaeologists should define the scale of their regions of study as expansively as possible.
As for “off-site” archaeology, few human activities occur exclusively at the settlement,
just as few are totally confined outside the settlement. A more accurate way to envision debris-
and artifact-producing human activities is that they occur within the home range and that they
cluster in parts of that home range. The thickest clusters of debris will usually occur at the
settlement, but the settlement won’t be the sole cluster occurring within the home range.
Gathering places for other activities will occur outside the settlement, such as raw material
sources, artifact preparation sites, ceremonial locations, hunting blinds, tree-felling areas, water
holes, butchering areas and shade areas (Foley 1981b: 164). Therefore, the traditional focus on
sites omits a significant part of archaeological data. Sites represent only a diminutive portion of
the possible total archaeological record. The label “off-site archaeology” can be employed for
studies involved with the entire regional population of artifacts as opposed to the term “on-site
archaeology” which is concerned with only the isolated clusters in it (Foley 1981c: 10). An
artifact density study is premised on the thought that the archaeological record is less-confined to
sites than has been previously thought and that the continuous nature of archaeological debris
21
across a landscape can be used to investigate regional patterns. Therefore the low density, but
spatially continuous archaeological record is very informative and it is much more extensive than
a site-based method.
The study of surface artifact evidence is still extremely important even if we have well-
excavated, documented, and studied archaeological sites from an area. The theory of “regional
archaeology” and the methodology offered in an “off-site” archaeological approach demonstrate
that people did not limit themselves to activities carried out only at a site or settlement. Humans
performed many activities that occurred “off-site” and therefore archaeological research is
hindered if we limit ourselves only to the study of well-excavated sites.
The introduction of Geographic Information Systems (GIS) into archaeological method
further enhanced the use of regional archaeological theory and an “off-site” approach. The use of
regional archaeological data is no longer relegated to simple graphical and mathematical
procedures—now new technologies like GIS can be used to represent and enhance analysis of
spatial relationships (Kantner 2008).
Prior Work on Regional-Scale Distribution Studies of Folsom, Clovis, and Paleoindian in
the Region
An important prior work on regional-scale distribution studies of Paleoindian include
Stanford’s (1999) study of Paleoindian groups (Clovis, Folsom, Goshen, Plainview, Agate Basin,
Hell Gap, and Cody) in the Southwest and Plains. This regional-scale study is a synthesis
compiled from archaeological sites from the Plains and Southwest regions. As the study
demonstrates, the use of site-specific studies compiled on a regional-scale provides a powerful
collection of assemblages, radiocarbon dates, and cultural characteristics for each Paleoindian
cultural complex in the Plains and Southwest. The limitation of the study is that Paleoindian sites
22
and isolates that are not well-documented are omitted, which means that the evidence for each
Paleoindian complex are not based on all (or even most) of the possible materials for complexes
(such as Folsom).
Prior work on regional-scale distribution studies of Clovis in the United States includes
the work of Prasciunas (2008) who examined Clovis from both a regional-scale perspective and
at the site scale. Loebel (2012) also examined Early Paleoindian projectile point distribution on a
regional scale. Prasciunas’ regional-scale study examined projectile point distribution in 18
United States (Nevada, Utah, Arizona, Wyoming, Colorado, New Mexico, Nebraska, Kansas,
Oklahoma, Texas, Arkansas, Mississippi, Tennessee, Alabama, Georgia, Florida, South Carolina,
and North Carolina) and whether certain modern factors were biasing the Clovis distribution in
this large scale study. Prasciunas concludes that the Clovis distribution in this regional-scale
study was significantly predicted by modern population and cultivation, but Clovis distribution
had no clear relationship with archaeological research intensity. A limitation of this study is that
it does not investigate how geomorphic factors could be potentially biasing the Clovis
distribution in the study area.
Similar to Prasciunas, Loebel (2012) examined whether modern factors were biasing
fluted point distributions in the upper Midwest (i.e., the western Great Lakes area in Illinois)
using a GIS raster based approach. Loebel found that distributions of fluted points in this region
were influenced to some degree by modern population density (possibly reflecting greater
numbers of artifact collectors in areas with higher population densities), geomorphic factors, and
artifact recording. Investigations of whether modern population, modern land use practices,
archaeological research intensity, and geomorphic factors bias regional-scale distributions need
to be a regular inclusion in such projectile point distribution studies at the regional-scale.
23
In contrast, Prasciunas (2008) also examines the validity of the “high tech forager” model
of Paleoindian land use from a site-scale perspective, using the Sheaman Clovis site located in
eastern Wyoming. The “high tech forager” model of Paleoindian land use (as put forward by
Kelly and Todd (1988: 237-238)) states that early Paleoindian land use and technology was
characterized by a highly mobile technology for a highly mobile people, redundant and short-
term land use, a highly curated technology with artifacts made from exotic materials procured
from long-distance sources, tools that are reused, reworked, and recycled, raw material
conservation, tool life extension was achieved by extensive resharpening, and heavy reliance on
a bifacial technology. Prasciunas’ (2008:107) study was able to demonstrate that the Clovis
assemblage at the Sheaman site does conform to the “high tech forager” model. This testing of
Paleoindian land use was performed from an individual site-level scale.
Prior work on regional-scale distribution studies of Paleoindian in the Great Basin was
performed by Jones et al. (2003) who examine lithic source use and foraging territories of
Paleoarchaic (11.5-8.0 ka) peoples of the central Great Basin. Their study examines lithic source
and technological organization of Paleoarchaic assemblages to make inferences about mobility,
possible population movement patterns, and assess the geographic range of material movement.
This study of Great Basin groups during the Paleoarchaic is on a large geographic scale and
reveals that these groups moved in large subsistence territories spanning larger than 400 km in a
north-south direction (paralleling valley and mountain range orientations). By analyzing obsidian
sources, Jones et al. (2003) determined the geographic scale of movement for these groups of the
Great Basin during the terminal Pleistocene and early Holocene encompassed a large region—
the whole length of eastern Nevada and part of western Utah. A limitation of this study is that of
determining movement patterns from lithic material sources because the lithic material could
24
have been acquired through trade. The authors incorporated the study of technological
organization in addition to lithic source provenance to advance their arguments about the scale of
the territories in which Paleoarchaic peoples were moving in the Great Basin.
Previous work on regional-scale distribution studies of Folsom include Andrews et al.
(2008) who examined Folsom archaeological variability at multiple scales (the site scale, the
foraging scale, and the macro-regional scale). Their site-scale analysis shows a large variability
in spatial characteristics between small locales that were perhaps occupied once and large sites
with multiple occupations. In their analysis of the Folsom foraging-scale (or the space in which
hunter-gatherers forage on a day-to day basis) they found that at this scale Folsom is not well-
understood, though ethnographic records and large sites like Lindenmeier can be informative of
land use at this scale. Their most powerful arguments come from their macro-scale analysis in
which they use a sample of 619 Folsom sites, locales, and isolates from the Southwest, Great
Plains, and Rocky Mountains. Andrews et al. (2008) found that the foothills located just outside
the High Plains and intermountain basin areas (e.g. the Central Rio Grande Valley of New
Mexico; and the San Luis Valley, Middle Park, and Upper Gunnison Basin of Colorado) had the
highest frequency of Folsom locales. They attribute this to the foothills and intermountain areas
having a resource base that is diverse and these areas have a land use strategy that is more
residential (Andrews et al. 2008: 484). They note that Amick (1994) found a similar residential
pattern for Folsom in the Basin and Range region of New Mexico. A limitation of Andrews et
al.’s study of Folsom at the macro-regional scale, is that most sites at this scale of analysis are
not well-documented. But, as the authors point out, most models of Folsom land use are largely
drawn from data from a few well-documented sites. A pitfall of this is the models drawn from
these few sites do not fully capture the entire spectrum of Folsom behavior (Andrews et al.
25
2008:483). Other regional-scale distribution studies on the Plains could be compared to this
study to see if areas characterized by highly mobile prey (i.e. bison) differ from areas with a
diverse and predictable resource base (e.g., plants, small game, lithic raw materials, potable
water, wood) in respect to land use strategies.
Another regional-scale distribution study of Paleoindian in the region is Blackmar’s
(2001) study of the variability in Clovis, Folsom, and Cody land use. Blackmar examined
projectile point distributions in Kansas, Texas, and Oklahoma and found variability in land use
among these Paloeindian complexes. By investigating land use on a large scale, Blackmar was
able to examine four geographic regions—the Prairie Plains, High Plains, Savannah, and
Woodlands. Land use for Clovis peoples in these areas was deemed to be independent of
geographic region. Folsom land use was “regionally focused” on the Prairie Plains and High
Plains regions (Blackmar 2001: 65). Cody land use was found to be strongly linked with the
Woodlands region. This study incorporated a region 1,067,067 km2 in size and contains varied
environmental zones (Blackmar 2001: 65). Studies such as Blackmar’s can make a compelling
case for using regional-scale studies as a complement to site-specific studies as a likely way to
test Paleoindian models of mobility, social organization, and economy. As Blackmar points out,
a possible bias in her study may be in the form of whether the patterns of land use are actual
cultural patterns or could be a result of archaeological sampling or geomorphic landscape history
biases (Blackmar 2001: 74). Analyses of Paleoindian land use in neighboring regions can be
added and compared to Blackmar’s (2001) study of Paleoindian land use in the Southern High
Plains, Prairie Plains, Savannah, and Woodlands. This would make for a large piece of real estate
in which to evaluate large-scale questions about Paleoindian land use.
26
Holen’s (2001) study of Clovis mobility and lithic procurement in the Central Plains is
another regional-scale distribution study in the area. Holen created a regional-scale model of
Clovis mobility and adaptation to rapid climate and biotic change during the
Pleistocene/Holocene transition in the Central Plains. By studying lithic source evidence, Holen
found that some Clovis groups in the Central Plains may have migrated long distances in
response to bison movements, while other Clovis groups likely attached themselves to certain
"refugia" areas on the High Plains (e.g. the southern portion of the Black Hills)—which were
settings with protection and milder winters than higher elevations and the open plains. A
limitation of this study, which Holen points out, is that the type of data commonly used in
regional-scale studies—projectile points found in non-site surface contexts—may not have been
used, lost, and discarded the same as other items in the toolkit (Holen 2001:119). This type of
data doesn't tell us about reduction sequences or assemblage composition as the toolkit was
transported. However, Holen's study relied on non-site data from private collections—which
allowed a regional-scale study of Clovis in the Central Plains. Such a study would not have been
possible if the research had been limited to only well-excavated sites—as Clovis data from
excavated sites does not exist for the entire state of Nebraska. Using diagnostic Clovis surface
finds allowed Holen to fill a large gap in the Clovis data for much of the Central Plains region.
Loebel’s (2005) dissertation examined early Paleoindian projectile point distribution in
the western Great Lakes area of the upper Midwest and examined the organization of
technology, settlement systems, mobility, and lithic material use. He examined long term land
use patterns and mobility based on lithic resource use that suggested a large scale of land use for
early Paleoindians in the region. He found lithic material movement in south-north and north-
south directions with movements of lithic material commonly greater than 250 km, and he
27
estimated a Clovis group annual range of 340 ̶ 700 km. A possible limitation of this study is that
reliance on projectile points may bias it towards hunting activities. Lepper (1988:37) however,
argues that Clovis projectile points were multipurpose tools and as such patterns of projectile
point distributions may indicate other activities as well as hunting at a regional scale.
An important regional-scale distribution study is Amick’s (1994) Folsom land use
analysis of the Southern Plains and Southwest. He examines Folsom weaponry artifacts and
discerns patterns for comparison of Folsom regional land use strategies in the Southern Plains
and Southwest (Amick 1994:386). He uses ratios of projectile point bases to tips and points to
preforms as well as inferences of isolated Folsom finds to make his interpretations. The regional
differences in these ratios were used to identify variation in Folsom settlement and land use
strategies. Some regions had low projectile point to preform ratios and high projectile point base
to tip ratios which are thought to indicate a more residential land use strategy under more
reduced mobility. Other regions had high projectile point to preform ratios and low projectile
point base to tip ratios which is thought to indicate a Folsom land use strategy with an emphasis
on hunting and high logistical mobility (Amick 1996:416-417). He found a significant difference
between the High Plains and intermontane basin regions of the Rio Grande Valley in terms of
proportions of preforms to finished points. The High Plains had fewer preforms than the Basin
and Range areas of the Southwest. Amick concludes that in the Southern High Plains Folsom
land use patterns follow a more logistical land use strategy, while in the Basin and Range of New
Mexico it was characterized by a more residential land use strategy (Amick 1994: 426). The
large number of isolated Folsom finds in the Basin and Range is interpreted as a dependence on
encounter hunting in this area. A limitation of Amick’s study is that because his analysis relies
on weaponry artifacts, the interpretations could be biased towards hunting activities.
28
As Amick (1998:8) points out, regional comparisons are often lacking in Folsom studies
and such studies of “Folsom lifeways…are often assumed to be the same in all regions.” New
regional-scale Folsom land use studies can be used to compare Folsom land use to prior large-
scale Folsom studies in the High Plains, Prairie Plains, Savannah, and Woodlands (Blackmar
2001), the Southern Plains and Southwest (Amick 1994), the Southwest, Great Plains, and Rocky
Mountains (Andrews et al. 2008), and the Plains and Southwest of North America (Stanford
1999). In addition, new regional-scale studies of Folsom land use can be used as a comparison of
Clovis versus Folsom distributions in the Central Plains using Holen’s (2001) study of Clovis in
the Central Plains.
Land use can be examined from many scales—whether at the site scale, or at the regional
scale. The types of questions asked at the regional-scale are sometimes different, but can be the
same as those asked at the site-level scale. Both scales are important, one is not better than the
other and each scale has its own set of limitations (Sellet 2006:223). These limitations need to be
recognized and investigated in land use studies performed at both the site and regional scales.
The discernment of regional patterns from projectile point distribution studies is a valid avenue
of research, particularly in regions where there are few or no well-excavated sites. Indeed, one
can argue that even in areas where excavated and well-studied sites exist, that the combined use
of site-level data and regional-scale distribution studies provides a more robust level of analysis
that is more powerful than either scale alone can provide.
Defining Space and Scale for Folsom Study in the Central Plains and the Scales of Land
Use of Mobile Hunters
The Central Plains Folsom dataset encompasses a large geographic region, including the
entire state of Nebraska and lithic source areas outside the state. This provides an appropriate
geographic scale to address large-scale regional land use strategies because it contains a broad
29
diversity of physiographic regions (or ecoregions) and resources. The state of Nebraska covers
an area of 200,282 km2. However, land use by Folsom peoples was not restricted by state
boundaries; their economic territories overlapped in various ways with Nebraska as indicated by
commonly used lithic source areas which occur outside the state (i.e., White River Group
silicates in southeastern Wyoming, northeastern Colorado, and southwestern South Dakota;
Smoky Hill Jasper in northern Kansas; and Hartville Uplift chert in east-central Wyoming). So
this study of Folsom in the Central Plains includes the well-represented lithic source areas
outside of Nebraska.
In the now classic ethnoarchaeological study of the Nunamiut Eskimo in Alaska, Binford
(1983a, 1983b) found that the scale which archaeologists normally perceived of the land use of
mobile hunter-gatherers was not only incorrect, it was laughable. Binford reported the spatial
scale used by one group of Nunamiut for one year and then demonstrated that over the course of
a lifetime this can add up to a huge amount of space, and therefore the land use of mobile hunter-
gatherers is very large. Over the course of a year, one group of Nunamiut have an area in which
they establish base camps/settlements (Binford terms this the “residential core area”) that covers
an area 5,400 km2 in size. If the trips out from base camps/settlements are counted it includes an
area of 25,000 km2. He reports that one family of G/wi Bushman can also occupy a similar
residential core area over the course of about a year, hence the Nunamiut are not unique among
mobile hunter-gatherers (Binford 1983b:110). Five Nunamiut families can have a residential core
area that is about as large as the French Dordogne region over the course of five years (Binford
1983b:112). In other words, mobile hunter-gatherers have a scale of land use that is much larger
than archaeologists are accustomed to considering.
30
The enormous spatial scale of land used by mobile hunter-gatherers is demonstrated
when Binford describes the vast amount of space that a typical Nunamiut male uses during his
lifetime (Binford 1983a, 1983b). The long term land use cycle for the Nunamiut is the land used
over the period of a hunter’s lifetime (Binford 1983b:114). The land used shifts in a cycle, where
a certain territory is used for about 6 ̶ 10 years, after which the environment becomes depleted (in
terms of animals and firewood) and becomes filled with vermin, hence the group will move to a
different territory (Binford 1983a:38; Binford 1983b). Among the Nunamiut, the typical male
resides in 5 different territories over the course of his lifetime which covers an area that is 22,000
km2. However, the typical Nunamiut male will travel over 300,000 km2 over his lifetime while
hunting for animals (Binford 1983b:115). According to Binford, this is the amount of space, the
large scale of lifetime land use, that archaeologists must think about if we want to understand
mobile hunter-gatherers’ archaeological site variability (Binford 1983b:117). This demonstrates
that mobile hunter-gatherers are capable of using a vast amount of space, making the scale of
land use of a group of hunter-gatherers very large over the period of a lifetime.
Understanding hunter-gatherer landscape use involves understanding that individual
archaeological sites are part of an overall land use system and settlement pattern. Hunter-
gatherers settlement and land use patterns can be analyzed at multiple scales—the huge area used
by one hunter over the course of a lifetime (lifetime land use on a regional scale), the residential
core area scale (the area encompassing settlements/base camps), the site complex scale (a group
of sites that are interconnected—for instance in the hunting of bison—the kill/butchery site, the
hunting camp, etc.), the single site-level scale, and the activity-level scale (Binford 1983b:142).
If we want to understand long term patterns of land use of mobile hunter-gatherers, we must
perform archaeological analyses at all scales—including the site-level and regional-level scales.
31
Amick’s (1996) regional-scale study in the Southwest suggests an estimate for Folsom
land use and mobility that exceeds that of even the highly mobile Nunamiut (Binford 1983a).
Amick derives this from estimating a seasonal round where Folsom hunters geared up at
Edwards chert and exploited the Southern Plains and then returned to the Tularosa Basin (thus
Edwards chert was transported 700 km at the very minimum in order to reach this intermontane
basin of the Rio Grande Valley)—making the estimated annual distance 1,400 km. To put this
into perspective the total annual distance figure for the Nunamiut is 725 km per year (Binford
1983a: Table 1). Amick suggests that the wide distribution pattern of Edwards chert suggests a
Folsom land use strategy on the Southern Plains of gearing up at lithic material sources and
manufacturing Folsom weaponry before heading out onto the Southern Plains. The wide
Edwards chert distribution pattern in this region suggests Folsom hunters may have operated in
territories of 120,000 km2 in the Southern Plains region (Amick 1996: 415).
Amick uses Binford’s figures on Nunamiut land use and population densities as potential
parameter constraints for highly mobile hunters. Amick notes that the total area used by the
Nunamiut per year is 63,700 km2, and estimates that the total area used by Folsom per year in the
Southwest is between 90,402 ̶ 135,603 km2 (this is approximately one-third the size of the
entire state of New Mexico). If Amick’s minimum estimated mobility and annual ranges are
correct, this would make the scale of Folsom land use larger than any recorded for modern
hunter-gatherers, including the Nunamiut.
Amick’s estimates suggest an expansive land use pattern for Folsom—and that Folsom
groups in the Southwest and the Southern Plains may have used several intermontane basins in
the course of one year (Amick 1996:419). Amick estimates that based on lithic material
evidence, Folsom groups in the Southwest may have had an annual range between two and three
32
times the size of the annual range reported for the Nunamiut (Binford 1991:Table 12). Amick
hypothesizes that the enormous scale of land use for Folsom could have been because of their
low population densities and that they were specialized hunters of bison. A limitation of this
study, and that of most regional-scale studies that rely on projectile point data, is that the
inferences could be biased towards hunting activities (Amick 1994). Thus, stone tools that would
be indicative of other activities such as the processing of food, and hide and wood working are
captured with this type of lithic data (Sellet 2006:224).
If Amick’s (1996) estimates for the scale of Folsom land use in the Southern Plains and
the intermontane Basin and Range along the Rio Grande of the Southwest are correct, it raises
the question whether Folsom groups in other areas are operating at a scale of land use even larger
than the Nunamiut? Do Folsom groups, in general have a scale of land use larger than that
recorded for modern hunter-gatherers? For Folsom hunters, was hunting mobile prey, such as
Bison antiquus pushing the limits of the scale of hunter-gatherer mobility normally envisioned,
based on what we know about modern hunter-gatherers?
Another model addresses technological gearing up, but instead of a regional analysis,
Sellet’s (2013) analysis is performed at the site-level. Sellet (2013) created a model for
measuring anticipated mobility, as measured by “gearing up.” His study contrasts two different
strategies in which Folsom hunters might manufacture their projectile points. One strategy is
replacement or retooling (manufacturing new points to replace those that are worn out, lost, or
broken) and a second strategy of “gearing up” (where points were produced in quantities, in
preparation for a future hunt). When Folsom hunters were gearing up, the archaeological
signature should show an imbalance in the number of manufactured points versus the number of
discarded points. This can be contrasted with the strategy of replacement or retooling where the
33
ratio of preforms and channel flakes to broken and discarded points should be approximately one
to one. Sellet used two different scales of analysis for his study. First, he performs a large-scale
analysis considering ratios of manufactured points to discarded ones for many Folsom campsites,
with the results indicating that at the majority of Folsom sites, the strategy of replacement or
retooling was used (the ratio was about one to one, or an equal proportion of broken and
discarded point to preforms and channel flakes).
Sellet (2013) then shifts the scale of analysis to the site-level and examines gearing up
and anticipated mobility from the perspective of a single site—the Lindenmeier site. He found a
difference in projectile point production between Areas I and II at Lindenmeier. Whereas
Lindenmeier Area I showed a strategy of raw material conservation (only a portion of lost or
worn out points were replaced), at Lindenmeier Area II, a gearing up strategy was seen, where
points were manufactured in excess of immediate needs (where there is a lot of preforms and
channel flakes in relation to discarded points). The distinct behavior patterns defined by Sellet at
the Lindenmeier site show that the same people could perform different strategies for projectile
point production at one site. Although the analysis at Lindenmeier was from the site-scale
perspective, the implications are regional in that it reaches beyond the site for explaining
variation between sites and amongst sites. A limitation of this study is that because many Folsom
sites do not have large-scale excavations, a gearing up strategy may be difficult to detect at many
Folsom sites given the small areas sampled at most sites (Sellet 2013:386).
Sellet’s (2013) model for anticipated mobility holds important implications, one being
that the archaeological signatures of retooling versus gearing up could be used to identify places
where Folsom hunters were camping longer (possibly closer to lithic source areas) and
manufacturing hunting equipment when they were gearing up to hunt elsewhere. This contrasts
34
with places where they were hunting and maintaining hunting equipment. One way to measure
this (identify hunting versus habitation sites) is to determine the ratios of preforms and channel
flakes to discarded points (lost, worn out, or broken).
Another study of technological organization at the site-scale is Sellet’s (2006)
investigation at the Hell Gap site. Sellet used a nodule method to identify nodules from which a
single artifact was made versus nodules that were used to make multiple items. From this he was
able to determine whether sidescrapers, gravers, and endscrapers found at the Hell Gap site were
transported versus expediently-made. Interestingly, endscrapers were found to have been
transported to the site while gravers were often expediently made on-site. Sidescrapers were
found to have been expediently made on-site as well as transported to the site. Sellet
demonstrated that correlating exotic raw lithic material with transported tools and thus with the
mobility of individuals, and likewise, correlating tools made of local lithic material as being
expediently made and not transported—does not work. For instance, if a graver is made from a
biface made of exotic material, the graver could have been expediently made on-site, but was not
transported and thus could not be correlated with the mobility of humans; and as in the case of
the Hell Gap site, endscrapers were made of a material that was local to the site, however they
had not been made on-site, but instead were transported (Sellet 2006: 228). Sellet’s (2006) study
illuminates the complexity of deducing patterns of mobility from lithic tools and advocates for a
systemic approach to revealing the interactions between strategies of mobility and the possible
technological responses to these.
The limitations of Sellet’s (2006) study is that studies of technological organization
performed at the site-level scale confront difficulties with recognizing the time and space in
which lithic activities are conducted. Sellet points out that technological organization studies at
35
the site level have the problem of identifying results from continually changing processes such as
the scheduling of lithic use activities on tools which are “static objects” (Sellet 2006:225). This
study has important implications for archaeological studies that infer mobility patterns from
stone tools. Although this study was performed at the site-scale level, it reaches beyond the site
in its implications for Paleoindian mobility and settlement-subsistence systems and inferring
mobility from stone tools—this may typically be more complex than we think. We need better
models for inferences about mobility from lithic tools than simple correlations of local material
with expediently made tools and exotic lithic materials with transported tools.
Hofman’s (2003) study has regional patterning implications for Folsom artifact
distributions. Its focus is mostly on an individual site, the Nolan site, which is located in western
Nebraska in Chase County. But, the patterns seen in the Folsom artifacts at the site hold regional
implications for long term land use patterns. The strong pattern in Folsom lithic material
movement is of White River Group Silicates being moved from the Flattop Butte source area
east and southeast into northeastern Colorado, southwestern Nebraska, and the Nolan site. This
contrasts with Smoky Hill Jasper. The source of this lithic material is also located in the vicinity
of the Nolan site and southwestern Nebraska, and was only rarely moved westward from primary
sources in the Saline and Republican River Basins. Hofman interprets this as repeated
movements of Folsom groups from lithic source areas to areas where they would hunt bison.
These repeated movements are interpreted to reflect redundant and long term land use patterns in
the region. Hofman’s (2003) study provides an argument that studies performed at the site-level,
in combination with a regional-scale approach, can often be more powerful than using only one
scale or the other. The limitations of such a study, because it incorporates both the individual site
scale and the regional scale, is then subject to the limitations of both, particularly with reference
36
to the context and association of artifacts. Future work should explore whether the long term land
use patterns of logistical movement from specific lithic sources hold true for the remaining
portions of Nebraska. Are they repeatedly going out and hunting and then coming back to certain
sources as was the case in Hofman’s (2003) study? His study showed a strong pattern where
Folsom hunters were repeatedly carrying White River Group Silicates eastward from the source
into northeastern Colorado and southwestern Nebraska, while Smoky Hill Jasper was only
moved west from the source area a small percent of the time.
By focusing on two Folsom sites in the Southern Plains, the Folsom site and Lipscomb
sites, in comparison with other sites in the Southern and Great Plains (Waugh, Lake Theo,
Cooper L, Mill Iron, Lipscomb, Casper, Plainview, and Olsen-Chubbock), Hofman’s (1999)
study combines using the site-level scale from a series of excavated sites in a large region. His
study questions the traditional correlations of the proportions of projectile point fragment types
with site type. For instance, the notion that kill sites are expected to contain mostly projectile
point tips and complete points, while retooling sites and camps are traditionally thought to yield
mostly projectile point bases. Counter to the traditional thinking, forty percent of the projectile
points found in both the Lipscomb and Folsom site bonebeds were base fragments—which
would typically be thought of a pattern that occurs at camp sites—not at kills (Hofman
1999a:128). In other words, the number of projectile point bases should not automatically be
thought of as representing a camp as opposed to a kill.
Hofman’s (1999) study showed that projectile point fragment type proportions in
bonebeds are driven by occupation duration, season of kill, dispersal of carcasses, and lithic
material stress. A limitation of this study is that because of the limited extent of most
archaeological site excavations, it may be difficult to accurately assess the true proportions of

37
projectile point fragment types at particular sites. This study could be applied to land use studies
at the regional-scale using an off-site approach, as an important warning that a large proportion
of projectile point bases in a region does not automatically imply a camp site as opposed to a kill,
or that a large proportion of bases in a region implies a residential land use strategy as opposed to
a logistical one.
Except for a few places, Folsom points are usually lightly distributed across most
landscapes—necessitating the integration of Folsom collections of avocational archaeologists
with traditional site studies. A study which incorporates the use of avocational archaeological
collections in combination with excavated sites for a regional perspective on Folsom is
Hofman’s (1992a) analysis of Folsom point variability in the Southern Plains. The Shifting
Sands site is located in a dune field and artifacts exposed by deflations in the site’s blowouts
were collected and recorded over a number of years by an avocational archaeologist, Richard
Rose. Hofman’s (1992a) study primarily uses three Southern Plains Folsom sites (Lipscomb,
Shifting Sands, and Cedar Creek) in conjunction with other sites in the Southern Plains to
explain the variability seen in Folsom projectile points. A “retooling index” was devised to
measure the relative amount of retooling since the last visit to a lithic quarry. For each site, the
frequency of Folsom projectile point tips with evidence for reworking or resharpening was
plotted against the mean length of points to calculate the retooling index for the following sites:
Shifting Sands, Folsom, Lipscomb, Cedar Creek, Lubbock, Blackwater, and Elida (Figure 6.9,
Hofman 1992a:213). This study explains variation in Folsom technology and mobility from a
pattern recognition study performed from a regional perspective. A further refinement of pattern
recognition studies utilizing information about projectile points to interpret variation in Folsom
technology and mobility from a regional-scale are needed.
38
Ingbar and Hofman’s (1999) study was performed from the individual site scale, at the
Lipscomb site, with implications for Folsom at the regional-scale. They discuss lithic material
procurement, Folsom technological organization, mobility, gearing up, and variability within
Folsom assemblages. One of their observations is that frequently there is a considerable distance
between the place where projectile points were produced and the lithic material sources. This is
evidenced by manufacturing failures and preforms being recovered at considerable distances
from the material source (Ingbar and Hofman 1999:106). They argue that under a model of
economy, one would expect Folsom groups to gear up at the source of materials, and therefore,
one should see the complete sequences of the production of fluted points at these quarry
locations. Gearing up at the quarry location would be expected as it reduces the expense of the
abortion of a preform when at a place where lithic material is unavailable. A new preform of
chosen type can be produced at all times when at the lithic material source, but when away from
the material source another preform cannot always be produced. Ingbar and Hofman (1999) point
out that this scenario is seen at the Adair-Steadman site (Tunnell 1977), but, not at some other
Folsom sites—the Lipscomb site included. According to Craig (1983), Frison and Stanford
(1982), and Sellet (2004), for the channel flakes recovered at the Agate Basin site Folsom
component more than half are made from one nonlocal lithic source—Knife River Flint. A study
of the Main Folsom component at the Agate Basin site shows that the preference of lithic raw
material is a response to conditions other than distance to raw material sources (Sellet
2004:1562). Also, at the Shifting Sands site, a broad array of channel flakes and preforms were
recovered, with all of the channel flakes being made of nonlocal lithic material (Hofman et al.
1990). Therefore, quite the opposite to the assumptions of economizing models, it appears that
39
most of the final stage of production of Folsom fluted points did not happen at or even near the
lithic raw material sources (Ingbar and Hofman 1999:102).
Ingbar and Hofman’s (1999) and Sellet’s (2004) studies underscore the importance of
incorporating the study of Folsom technological organization into Folsom mobility and land use
studies. Like Sellet (2004), Ingbar and Hofman (1999) also concluded that there was often a
discrepancy between the place where projectile points were produced and the lithic material
source—as evidenced by manufacturing failures and preforms being recovered at considerable
distances from the source of the material—and that this is the case for a number of Folsom sites.
Both Ingbar and Hofman’s (1999) and Sellet’s (2004) analyses were performed at the site-level
scale, but both have implications that reach beyond the site to the regional-scale. Limitations of
Ingbar and Hofman’s (1999) and Sellet’s (2004) studies are the weakness that plague all
technological organization studies performed at the scale of the site-level—which is that it can be
difficult to identify how lithic activities were scheduled from stone tools (see Sellet 2004:225).
For mobility and land use studies, it is important to incorporate the study of technological
organization, rather than simple distance to source calculations in lithic studies. When possible, it
is important to determine frequencies of preforms and proximal channel flakes and determine the
percentages of these artifacts that were made from local versus nonlocal material—to determine
if the projectile points were produced at or near the raw material source, or if—as is the case for
a number of Folsom sites—the projectile points were produced far away from the raw material
source, presumably as need demanded.
Projectile Point-Based Studies: Limitations and Possibilities
Large, regional-scale studies often rely mainly or exclusively on projectile points, which
serve as temporal markers, in order to gain chronological control over the large number of sites
40
needed in such large-scale analyses (Sellet 2006:223). As such, it is important to discuss the
limitations of using projectile point data for any regional analysis that is primarily a projectile
point study.
One argument on the limitations of projectile point studies is Bamforth’s (2002; 2009).
He argues that projectile points differ from other tool classes in terms of the raw materials used.
According to Bamforth, tool classes other than projectile points are often made primarily from
local raw materials; versus projectile points, which are often constructed of exotic materials.
Thus, analyses that rely on projectile points provide a skewed perspective on the mobility of
landscape use of Folsom and later Paleoindian peoples. Also, based on his analysis of caches,
Bamforth (2009) challenges the assumption that exotic materials were in large part directly
procured and therefore challenges the view of Paleoindians as highly mobile. A possible
limitation of Bamforth’s argument is that part of his argument is based on archaeological data
from Lake Theo (located near a lithic material source of Tecovas jasper), the Medicine Creek
sites of Lime Creek, Red Smoke, and Allen (located near sources of Smoky Hill Jasper), and
sites located near the Knife River Flint source area (the Big Black and Bobtail Wolf sites)
(Bamforth 2002:70-71; Bamforth 2009:153, 147). A possible limitation of this arguement could
be that because these sites are located at or very near lithic material sources, many archaeologists
would expect the projectile point and non-projectile point tool assemblages to look different at a
source of lithic material versus a site located a considerable distance from a lithic material
source. Bamforth’s alternate viewpoint about projectile points being different in terms of raw
material than other tool classes, and thus studies that rely on projectile point data skew
archaeologists’ perception of the mobility and ranges of Paleoindians as highly mobile, must be
taken into account in projectile point studies.
41
Others have also shed light on the limitations of projectile point studies. Sellet (2006:223)
describes regional-scale analyses as using a large number of sites, with the intent of seeing
patterned behaviors, and at such a scale, the settings of specific site “idiosyncrasies” will
disappear. As mentioned earlier, regional-scale analyses often rely on projectile point data in
order to control for site function and chronology (Sellet 2006:223). Sellet (2006) presents an
argument that projectile points represent a specific piece of lithic systems and they differ from
other tools in terms of their replacement and manufacturing. Because of the elaborate ways in
which they were hafted, it is possible that projectile points spent more time in the overall lithic
system than other tools. Some studies (e.g., Bamforth 2009) have pointed to the prominent role
that projectile points have played in Paleoindian studies and have asked for a more equal
treatment of other tool classes with this research arena. While Sellet (2013:384) agrees with the
need to study other aspects of Paleoindian technology, he points to the validity of projectile point
studies which are instilled with “behaviorally orientated questions.” Projectile points represent a
food extraction function of lithic technology and therefore can give insights into broader aspects
of subsistence strategies. Sellet (2013:384) also gives credibility to projectile point studies that
assist in understanding the organization of strategies that are weaponry-related (e.g., Amick
1996; Hofman 1999a) and how these have improved our knowledge of the variability found in
archaeological data.
Ethical Issues with Using Private Collections for Research
The majority of this study is based on private collections and studies which use or rely on
data from private archaeological collections should address the ethical issues with using private
collections for research. Archaeological ethics have now become a standard class in many
anthropological archaeology degree programs (Science and Technology: Can You Dig It? Ethics
42
and Archaeology 2002). Many archaeological societies, including the Society for American
Archaeology, the leading archaeological society in the Americas, have adopted ethical
statements to outline appropriate behavior for their members (Lynott and Wylie 1995). When
artifacts are in private collections and not under the control of the public domain, this leaves
open the possibility that the artifacts can be bought or sold. Some artifacts can bring high prices
and provide monetary incentive for buying and selling. The buying and selling of artifacts
creates an incentive for looting archaeological sites to obtain artifacts, thus destroying or
desecrating sites and the potential to learn about them. When an artifact is bought or sold, the
contextual information about the artifact’s location and finder is oftentimes lost, and this
decreases the value of the artifact for archaeological research. “To avoid appearing unscientific
or complicit with the activities of looters, many archaeologists choose deliberately to ignore data
from objects in private collections—whatever their significance” (Science and Technology: Can
You Dig It? Ethics and Archaeology 2002: 70).
Other concerns in using artifacts in private collections for research pertain to access of
the collection to other researchers for future evaluation of study results. Artifacts in private
collections can be difficult for researchers to access at all times, as opposed to collections in
museums which are generally available for study (Hofman 1992b).
Another ethical concern with using private collections is the issue of avocational
archaeologists’ recordkeeping. It should be noted here that I am defining “avocational
archaeologists” as individuals with some understanding that context is important and they may
even be supportive of archaeological education and research. Avocational archaeologists are
different from “relic collectors” whose primary goal is to collect artifacts as objects without
necessarily knowing or caring where an artifact was found. Relic collectors commonly may
43
engage in buying, selling, and/or trading objects indiscriminately or for profit. Some
archaeologists criticize avocational archaeologists’ recordkeeping, however, the quality of
recordkeeping of professional archaeologists (not long ago) was sometimes questionable before
modern archaeological standards of excavation and recording. Standard archaeological
procedures are the byproduct of the times and each archaeological generation views the previous
generation of archaeologists as archaic in their recording and excavation procedures (Science and
Technology: Can You Dig It? Ethics and Archaeology 2002). Some of the issues evident in
private collections are also found in public collections acquired by professionals. Professional
archaeologists and public institutions are not immune from ethical scrutiny as many artifacts in
museums and institutional collections were originally collected by people as souvenirs during
their world travels in past centuries. Thus, although some professionals criticize the
recordkeeping of avocationals, professional archaeologists prior to modern archaeological
standards could likewise be criticized for their record keeping, and this is particularly true for
surface found artifacts.
Some avocational archaeologists who amass private collections in fact take more notes,
make maps, and in general have better recordkeeping than archaeologists amassing collections
for public institutions and museums prior to modern archaeological standards. The relationship
between professional archaeologists and avocational archaeologists are starting to change
(Science and Technology: Can You Dig It? Ethics and Archaeology 2002:71). Some amateur
groups (e.g., The Diggers who investigated battlefields in Belgium) will even seek professional
backing—working with a museum, other professional institutions, or in conjunction with
archaeological commissions. Although ethical issues arise when using private collections, some
of these same issues apply to public collections. One must consider all the issues before deciding
44
to include or exclude private collections for archaeological research. This is commonly a
decision which is made on a case by case basis.
The Importance of Private Archaeological Collections
People who collect artifacts can do so responsibly and private archaeological collections
should be recognized as a potentially important resource when doing archaeological research.
Collections made by private individuals can be of value if the individuals are responsible in their
recordkeeping and curation of the artifacts (Hofman 1992b). Some archaeologists refuse to use
private collections in their research, which implies that these collections have no value.
People, including Native Americans, have collected artifacts for hundreds of years.
Hofman (1992b) reports that Kirk points from the Early Archaic were found associated with
burials of Mississippian age stone box graves and historic Native Americans sometimes placed
prehistoric projectile points in their sacred bundles. The collecting of artifacts has happened in
the past and will continue to go on in the future. Thus, an argument can be made that it is the
responsibility of archaeologists to document artifacts in private collections.
It is important to distinguish between the buying and selling of artifacts to make money,
(as is done by some relic collectors), and collecting artifacts because one is interested in learning
about the past (which is what avocational archaeologists do). “Individuals who have a primary
interest in how much an artifact is worth or how much they can make from selling artifacts are
not avocational archaeologists and do a considerable disservice to the potential of others to learn
about the past” (Hofman 1992b). The knowledge that can be obtained about an artifact is largely
dependent on the context in which the artifact was found. When the contextual information about
an artifact is lost or separated from the artifact, as commonly happens when it is bought or sold,
it has little research value, though it may still have high monetary value (Hofman 1992b).
45
Avocational archaeologists with collections who practice responsible curation and recordkeeping
can help to preserve the archaeological record. It is only through working with avocationals that
professional archaeologists can help document important information in private collections and
help educate avocationals in stewardship of the past.
Responsible avocational archaeologists with collections tend to keep records of the
location and context where artifacts were found. Their recordkeeping can be as simple as
assigning a letter or number for each site, or keeping artifacts from each site separately in
containers (Hofman 1992b), but this sort of recordkeeping is still extremely helpful in learning
about the past. Relic collectors who are not responsible and lose contextual information about an
artifact or the artifact itself are essentially destroying information about the past. If good records
are kept by avocational archaeologists with collections then their collections can be valuable
additions to the archaeological documentation of a site or region.
Avocational archaeologists who have collected artifacts at a site or region over an
extended period of time can amass collections that are much more representative of the
archaeology of a site or region than that found in the limited excavations and once-over surveys
performed by archaeologists. Since archaeologists spend relatively little time doing fieldwork
and what is known about a site or region is usually confined to fieldwork done in a short amount
of time (Hofman 1992b); this often leads to incomplete knowledge about a site or region. If we
avoid working with avocational archaeologists with collections who keep records of their finds
we are excluding the very individuals that possibly have the most information about
archaeological materials from a site or region (Hofman 1992b). The importance of local
avocationals has been recognized by some government agencies. For example, the U.S. Army
Corps of Engineers have allotted time and money for their archaeologists to interview local
46
avocational archaeologists. Ultimately, if archaeologists limit their study to public collections,
they will likely miss the variability that can be learned about a site or region when private
collections are included in our research.
Often times important archaeological sites can be missed if archaeologists do not work
with local avocationals. Hofman (1992b) reports that while working on the Duck River in
Tennessee, a site was originally evaluated as non-significant based on a single archaeological
survey by the original contract archaeologist. This site was brought to his attention after a local
avocational informed him about the site’s significance as a shell midden. The site was threatened
by an impending reservoir project and had it not been for a local avocational archaeologist, this
site would never have been studied. If professional archaeologists ignore local avocational
archaeologists, this can have significant consequences to our understanding of the archaeology of
a site or region. Archaeologists need to work with local avocationals so that important sites and
collections are not overlooked.
When we accept the fact that archaeologists have limited time and funding, it is important
to ask can archaeology as a profession afford to ignore the private collections of avocational
archaeologists? When we stop to consider the knowledge that is at stake, does it make sense to
lump avocational archaeologists with relic collectors by ignoring private avocational collections?
According to Hofman (1992b) archaeologists cannot possibly study all sites or regions. Even
when archaeologists do excavate sites, these sites are typically only sampled and not completely
excavated. Therefore, surface artifacts in private collections can add important and vital
information to what archaeologists know and can learn about sites. Often times, archaeologists
have questions they want to ask which concern regions, as opposed to specific sites (Hofman
1992b). In these instances, more relevant information can be learned by examining many private
47
surface collections across a region than through the excavation of solitary sites. Therefore, for
large regional-scale studies, the use of private collections is vital since using data collected by
avocationals allows us to ask and answer questions on a regional scale.
When relying upon private collections for research, archaeologists must exercise time and
patience and build mutual trust to determine the dependability of provenience information
(Hofman 1992b). A researcher must assess whether the avocational took care to reliably
document the location where an artifact was found. Hofman (1992b) notes that the
trustworthiness of provenience information is of concern even when using museum collections;
this is not a concern that is unique to working with private collections. In the end, using private
collections enables a much more complete study of an entire region. This is true even for site-
based studies; incorporating private collections enables a more complete study of a specific site’s
assemblage. By taking the time and care to build relationships with avocationals, professional
archaeologists can be more assured of provenience information of private collections and more
thoroughly document the archaeology of a site or region. The process is also one of education
and improving future documentation of archaeological evidence.
Other reasons for working with avocational archaeologists for archaeological research is
it provides an avenue for avocationals to become integral to the future stewardship and research
possibilities of their collections. Private collections can become separated from their associated
records if they are not housed at museums (Hofman 1992b). If private collections are given away
or sold at garage sales or estate sales after the death of the individual who originally found them,
then the associated artifact information is likely lost or separated from the artifacts and the
collection is likely to become scattered thus making the artifacts little more than novelties. The
possibility to learn about the past from these collections will have been lost or reduced. If,
48
however, an avocational donates the collection to a museum the collection can be kept together
with its associated information and records and long-term curation can be more assured. Instead
of having the collection dispersed and separated from its provenience information, an
avocational can donate it to an institution for extended curation and care. A collection that is
donated to a museum can become an honor and legacy to the person that originally collected it
(Hofman 1992b). In addition, a private collection donated to a museum is intact and always
available to be studied, whereas if it becomes scattered among relatives, or sold individually, we
lose much of the potential to learn about the past from it. It is only through working with
avocationals, as opposed to ignoring them, that we can have avenues for educating them about
the importance of their collections to archaeological research; also, by working with avocationals
we can impart the knowledge that museums are often the best place for the long-term care,
curation, and future study of the their collections.
When we think of the importance of avocational archaeologists we must also be realistic.
Professional archaeologists and private institutions and museums have limited time and funding.
In some cases, avocational archaeologists can be as good or better stewards of collections than
some poorly funded public institutions and/or poorly curated public collections. In some cases,
private individuals may have more time and financial means than professional archaeologists and
public agencies to attend to preserving the archaeological record. Often, it is more effective (in
terms of cost, time, and energy) to have an avocational archaeologist monitoring and surface
collecting at the same site, locality, or region over a period of a number of years, than it is to
have a single, expensive excavation done by professional archaeologists.
Richard Rose, an avocational archaeologist, who has collected artifacts at the Shifting
Sands site in Texas for over 30 years, is an outstanding model of an avocational archaeologist
49
who has worked with a professional archaeologist. He is an example of how an avocational can
be an asset to documentation and stewardship of the archaeological record. He has been able to
monitor and collect artifacts at this site, which is continuously changing because of wind erosion;
therefore artifacts are continuing to erode out onto the surface. He has shared the archaeological
information he gathers with numerous professional archaeologists. This type of archaeological
monitoring of and information gathering from a site would not be possible if the archaeology
performed at Shifting Sands were limited to only professional archaeologists. In addition,
because of Rose’s continuous monitoring and surface collecting at this site, he is able to inform
professional archaeologists if the site is being threatened by looters or destructive forces; and
therefore subsequent protective measures need to be put in place by professional archaeologists
in order to protect the site. He has made arrangements for his collection and the associated
information to go to a public institution upon his death. Professional archaeologists need to work
in conjunction with the private sector in order to achieve the best possible preservation of the
archaeological record. The Shifting Sands site underscores how collaboration between
avocational and professional archaeologists can result in a more complete picture of a site and
even result in the donation of a private collection to a museum for long-term curation and future
study. Because the majority of this study uses private collections, the ethical issues with working
with private collections and importance of using private collections must be discussed.
Discussion of the Limitations of This Study: Problems with Inferring Patterns of Mobility
from Lithic Material Distributions
Lithic material distributions are not sufficient for inferring patterns of mobility. The three
discussions of how lithic material economy does not directly represent mobility presented here
are: Brantingham (2006), Sellet (2006), and Ingbar (1994). Brantingham (2006) addressed the
connection between patterns of mobility and the distribution of lithic material. He built a model
50
of forager mobility based on the application of the Lévy random walk. Through this model he
ran simulations which could be used to gain information about forager mobility using lithic
material transport distances. In summary, Brantingham concluded that moves of identical lengths
or continuous short moves by foragers are equated with minimal levels of planning depth in his
model; while forager moves, which transport stone, that are longer in distance and have
increased unevenness in their lengths, denote higher levels of planning depth (Brantingham
2006:444-445). Brantingham addressed the problem with inferring patterns of mobility from
lithic raw material distributions. He particularly investigated the patterns of mobility of foragers
as to the length and frequency of their residential moves. He stressed that models of the discard
and transport of lithic materials should take into account that foragers have transported lithic
material through a certain number of residential moves and not that foragers have made only one
move between the lithic material source and where the tool stone was eventually found.
Brantingham’s (2006) article underscores the mistake that many archaeologists regularly
make—that of deducing the land use of hunter-gatherers from the quantity and distribution of
lithic materials. His study showed that land use models that use simple linear distance from the
source come up short—because they assume that only one move was made between the source
and where the tool was found. His study has important implications for my data sample and
study of Folsom land use in the Central Plains. I used more than just simple lithic material
distributions and linear distances from the tool stone source to get at Folsom land use. I
incorporated many lines of evidence to get at land use—such as the way Folsom chipped stone
technology was organized, the variability in the amount of tool use between trips to lithic
material sources, and the direction of movement in relation to lithic material sources.
51
Brantingham’s (2006) formal model and simulations provide an important addition to
modeling forager mobility and land use. Additionally he examined the problem of inferring
mobility from the distributions and abundance of lithic materials. A limitation of his study is that
it may be difficult to apply his model to actual archaeological data given the quantity of
simplifying assumptions he needed to use to isolate specific variables and achieve the results of
his simulations.
Another researcher who cautions against using raw material distributions to infer patterns
of mobility is Sellet. His 2006 article demonstrated that the inference of mobility from material
economy does not work. He particularly stressed that the local/exotic model does not work. By
performing a nodule analysis of artifacts from the oldest four archaeological components at
locality one at the Hell Gap site in southeastern Wyoming, Sellet was able to demonstrate that
even though 95% of the lithic materials at the site were local in origin (Sellet 2006:226); tools
made from local lithic materials were not always manufactured on site and therefore, were not
expediently made tools. This was especially the case with the tool class of endscrapers—unlike
gravers, which were usually made at the site, endscrapers were made elsewhere and then
transported to the site. Thus, this made endscrapers part of the transported toolkit (Sellet
2006:228). Sellet’s 2006 study revealed that the local/exotic model does not hold up to scrutiny.
Therefore, Sellet demonstrated that using raw material distributions to infer mobility patterns of
Paleoindians is problematic.
Now I will turn to discussing how Ingbar (1994) addressed the problem with inferring
patterns of mobility from lithic material source proportions. Archaeologists habitually and in an
informal way infer the land use of hunter-gathers from the distribution and quantity of lithic
material from material sources. Ingbar (1994) performed some simulations that held the
52
following factors constant: location and number of material sources, the number of tools
expended at each location, and the direction of movement. His simulations altered only the
mobility rate, the number of events that depleted tools, and the number of tools in the toolkit.
From his simulations he concluded a poor association existed between the proportions of raw
material sources and patterns of mobility (Ingbar 1994:46).
For two of Ingbar’s simulations, the results showed that depending on where in the
simulation cycle one were to take a sample, if the occurrence of raw material sources in the
assemblage was used to infer the group’s territory or mobility pattern, one could easily infer that
not all three raw material sources were part of the group’s territory (Ingbar 1994:49). In Ingbar’s
last simulation, when the parameter of the number of tools contained in the group’s toolkit was
changed, or in other words when a characteristic of the technological organization was changed,
this resulted in yet another and different pattern of material source proportions (Ingbar 1994:51).
He deduced from this that the proportions of material sources are extremely reactive to patterns
in technological organization. He emphasized that knowing about the organization of a
technology, past the utilization of certain sources of materials, is a requirement for understanding
the different patterns in the proportions of material sources (Ingbar 1994:50). Ingbar (1994: 50,
54) defined the study of technological organization as the study of patterns in acquiring lithic
material and lithic tool production, transport, use, modification, and discard; this is similar to the
chaîne opératoire (Sellet 1993).
To illustrate the connecting of material source use to technological organization, Ingbar
presented an example from the Hanson site, located in northwestern Wyoming (Ingbar 1994:51).
At the Hanson site, almost the whole projectile point and biface manufacturing sequences were
found. However, Ingbar points out that these sequences showed a segmented pattern in terms of
53
lithic material—between the local and non-local materials (Ingbar 1994:52; also see Ingbar
1992:186). By a segmented pattern between the local and non-local lithic materials, Ingbar
means that “while nearly complete biface and projectile point production sequences have been
recovered at the Hanson site, these sequences are not present in the local materials” (Ingbar
1992:186). In other words, complete biface and projectile point production sequences exist for
the non-local lithic materials at the Hanson site, but this is not the case for the local lithic
materials at the site. He proposed that this segmented pattern in lithic raw materials was the
result of a certain organizational strategy, that of serial flexibility (cf. Nelson 1991:83)—which is
when a toolkit is continuously provisioned. When serial flexibility is associated with “serial or
irregular source use, only the last few sources visited may appear in the active toolkit” (Ingbar
1994:52).
Ingbar concluded that the representation of lithic raw materials in archaeological
assemblages was strongly connected to a group’s technological organization strategies (Ingbar
1994:54). Explanations of a group’s territory or range and mobility patterns based only on
material source proportions, with the type of technological organization strategies shown in
Ingbar’s simulations and his example from the Hanson site would be misinforming. Ingbar
argues that direct correlations of material source proportions with mobility are precarious.
However, he does conclude that the identification of lithic material sources is a significant
addition to technological organization studies, and they must advance together (Ingbar 1994:54).
Brantingham’s (2006), Ingbar’s (1994), and Sellet’s (2006) articles underscored the
importance of including the study of technological organization in archaeological research.
Ingbar (1994:50, 54) defines the study of technological organization as the study of patterns in
acquiring lithic raw material, and lithic tool production, transport, use, discard, and modification.
54
Description of the Sample
Since few diagnostic Folsom artifacts exist from excavated contexts in the area of this
study, it is essential to use the available information about the Folsom archaeological record to
explore land use at a large regional scale. This available information is confined to surface
diagnostic Folsom artifacts (projectile points, preforms, and channel flakes). The data for this
study was obtained from private collections (found through word-of-mouth), public collections,
and published accounts of diagnostic Folsom artifacts. The dataset consists entirely of surface
artifacts. Only a few recorded sites are represented in the sample and these are also surface
collections.
The Central Plains Folsom dataset consists of 317 Folsom artifacts, including the
following: 227 projectile points and point fragments, 50 preforms, 9 channel flakes, and 31
Midland points. Dr. Jack Hofman began recording artifacts for this study in the 1970s. His
recording of Folsom artifacts is ongoing—he continues to record Folsom artifacts from both
private and public collections throughout the Plains.
Description of Data Collection and Variables Recorded and Coding of the Data
Overall, the data for this study was collected in an opportunistic manner as time permitted.
Some of the data collection was snowball, or collected in a word-of-mouth manner, in that one
collector would know of other collectors that could be contacted for documentation of artifacts in
their collection to include in this study. Some of the data was collected systematically by going
through site records. The public museums and institutions contacted were the University of
Nebraska State Museum (UNSM) and the Nebraska State Historical Society (NSHS). Although
strategies such as snowball and systematic sampling were used, overall the data was collected in
an opportunistic way.
55
In terms of the private collections, sixty-four avocational archaeologists’ collections are
represented in the sample of Folsom artifacts. Avocational archaeologists with collections were
found by looking at the Nebraska site files and notes and through Dr. Steve Holen’s contacts
with landowners and avocational archaeologists with collections. In addition, avocational
archaeologists were found by following leads from early professional archaeologists’ reports.
After the artifacts were recorded, they were given a unique specimen number with the letter
“N” before the number (e.g., N1, N2, N3….). The following variables were recorded and later
coded for the sample of artifacts. The variables coded include the following: county name where
the artifact was found; name of the locality where the artifact was found (if applicable); site
number (in the rare instances when the artifact was found at a surface site); river drainage where
the artifact was found; context of artifact find (e.g., blowout, streambed, terrace, upland);
ecoregion in which the artifact was found (i.e., Central Great Plains, Nebraska Sand Hills,
Western High Plains, etc.); latitude and longitude; lithic material (e.g., White River Group
Silicate, Niobrara Jasper, Hartville Uplift); name of collection (whether in a private or public
collection); specimen number written on the artifact by a private avocational archaeologist with
collections or public institution; artifact type (i.e., Folsom point, Folsom preform, channel flake,
Midland point); the number of flutes on the artifact; portion of the artifact (i.e. complete,
projectile point tip, projectile point base); maximum length of the artifact (recorded in
centimeters—up to three decimal places); references where the artifact was described if
recorded from a publication; and any technical notes about the artifact.
56
Chapter 3: Pattern Recognition in the Data: Overall Spatial Patterns
Introduction
Different kinds of projectile point fragments and preforms can potentially inform us
about different elements of Folsom people’s activities or concentrations of their activities.
Complete projectile points can be lost in hunting at kills or elsewhere. Projectile point bases may
be intentionally discarded and indicate camp or retooling sites. Projectile point tips may be lost
in carcasses and may be indications of kill areas. Preforms are evidence of point production.
Broken preforms can be indications of places where retooling and fabrication of points is
occurring. This is useful information in terms of where Folsom groups are carrying out activities
on the landscape organizationally in relation to sources.
Overall Folsom Artifact Distribution
The overall Folsom distribution in Nebraska reveals that most of the documented artifacts
are found in western Nebraska (Figure 3.1) with a secondary concentration found in the southern
tier of Nebraska counties (Williams and Hofman 2010). The sample has obvious data gaps as
evidenced by counties with no Folsom evidence (e.g. Logan and Perkins) which are adjacent to
counties where Folsom artifacts are commonly found. Keith and Lincoln counties have the most
Folsom evidence with 120 Folsom artifacts found in these two counties (Tables 3.2 and 3.3).
This area was possibly a place of repeated and focused Folsom activity. The North and South
Platte confluence area lies in Keith and Lincoln Counties which are in two different ecoregions.
In addition, Keith and Lincoln Counties lie adjacent to a third ecoregion. It is important to note
that the concentration of Folsom evidence at the North and South Platte River confluence area
does not extend eastward along the Platte River. The North and South Platte River confluence is
an area with diverse resources which would have been attractive to bison and other species—and
57
to the people who hunted those animals. Part of the ecological diversity and the interest in this
area by Folsom people may be because three ecoregions come together near the North and South
Platte River confluence area (i.e., the Nebraska Sand Hills, Western High Plains, and Central
Great Plains). The North and South Platte River confluence area appears to be a “hot spot” for
Folsom evidence. Other areas that could be considered as “hot spots” for Folsom include the San
Luis Valley, Middle Park, and Upper Gunnison Basin in Colorado and Central Rio Grande
Valley in New Mexico (see Andrews et al. 2008:481).
The overall Folsom distribution also highlights areas where little to no evidence exists—
specifically in northeastern Nebraska. The distribution of Folsom and Clovis in Nebraska are
both uneven. But these distributions are distinctly different from one another (see Figures 4.1 and
4.2). By comparing the Folsom distribution to other late Pleistocene–early Holocene evidence,
we see that Clovis is well-represented in northeastern Nebraska. The presence of Clovis artifacts
in the area suggest that we should expect to find Folsom, because the exposed land surfaces are
old enough. Nor does the lack of Folsom evidence in northeastern Nebraska reflect a lack of
archaeological research or documentation of artifacts in this area, Clovis is well represented here
(Holen 2001, 2003). The lack of Folsom artifacts in northeastern Nebraska could reflect limited
activity of Folsom people in the area. Perhaps this overall distribution points to the low
population of Folsom people in northeastern Nebraska, while their presence was concentrated in
western and southern Nebraska and especially the Platte River system. Evaluating these patterns
and their causes is a central focus of this study.
Looking at the number of artifacts by ecoregion is revealing (Table 3.1, Figure 3.2). The
ecoregion with the most Folsom evidence is the Central Great Plains (80 artifacts), followed by
the Nebraska Sand Hills (75 artifacts), and the Western High Plains (72 artifacts). The number of
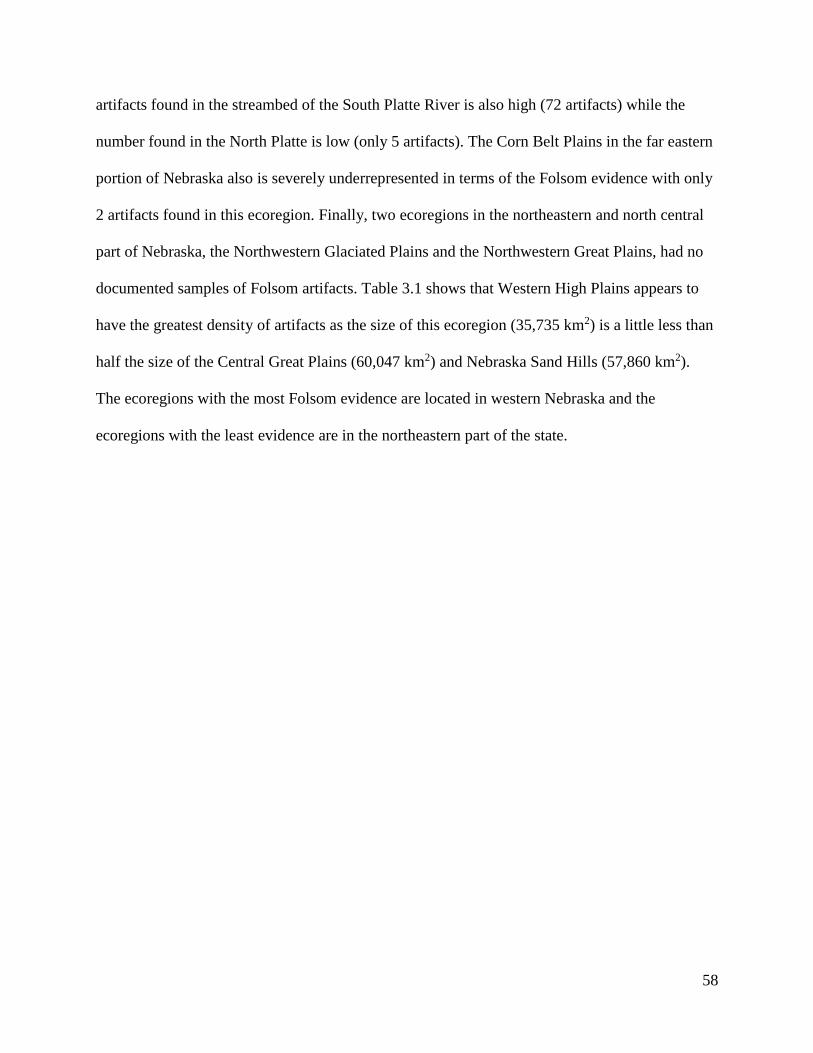
58
artifacts found in the streambed of the South Platte River is also high (72 artifacts) while the
number found in the North Platte is low (only 5 artifacts). The Corn Belt Plains in the far eastern
portion of Nebraska also is severely underrepresented in terms of the Folsom evidence with only
2 artifacts found in this ecoregion. Finally, two ecoregions in the northeastern and north central
part of Nebraska, the Northwestern Glaciated Plains and the Northwestern Great Plains, had no
documented samples of Folsom artifacts. Table 3.1 shows that Western High Plains appears to
have the greatest density of artifacts as the size of this ecoregion (35,735 km2) is a little less than
half the size of the Central Great Plains (60,047 km2) and Nebraska Sand Hills (57,860 km2).
The ecoregions with the most Folsom evidence are located in western Nebraska and the
ecoregions with the least evidence are in the northeastern part of the state.

59
Figure 3.1: Overall Folsom Artifact Distribution by County
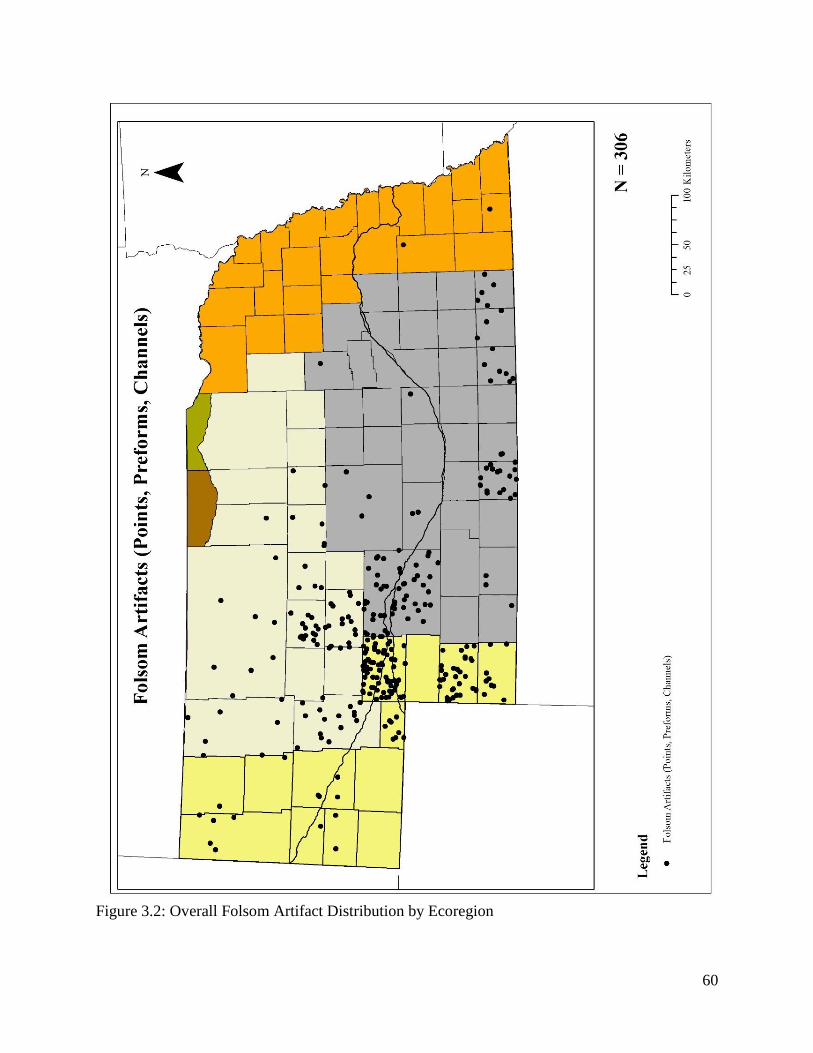
60
Figure 3.2: Overall Folsom Artifact Distribution by Ecoregion
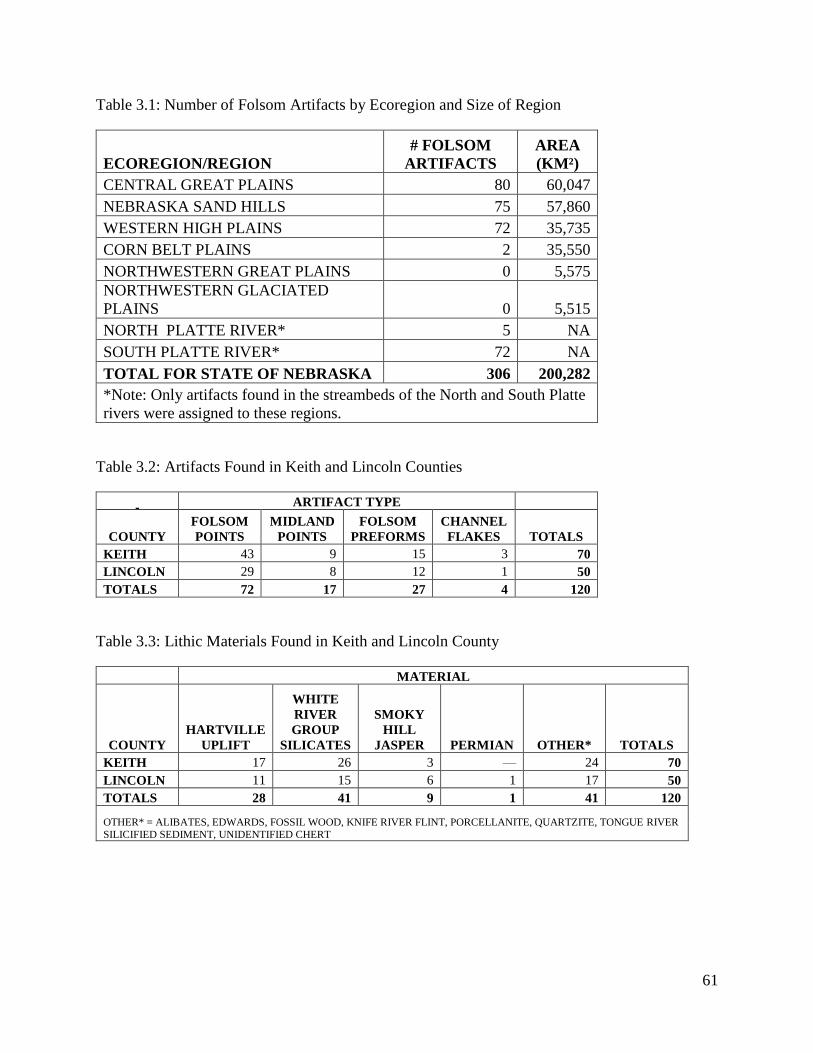
61
Table 3.1: Number of Folsom Artifacts by Ecoregion and Size of Region
ECOREGION/REGION
# FOLSOM
ARTIFACTS
AREA
(KM²)
CENTRAL GREAT PLAINS 80 60,047
NEBRASKA SAND HILLS 75 57,860
WESTERN HIGH PLAINS 72 35,735
CORN BELT PLAINS 2 35,550
NORTHWESTERN GREAT PLAINS 0 5,575
NORTHWESTERN GLACIATED
PLAINS 0 5,515
NORTH PLATTE RIVER* 5 NA
SOUTH PLATTE RIVER* 72 NA
TOTAL FOR STATE OF NEBRASKA 306 200,282
*Note: Only artifacts found in the streambeds of the North and South Platte
rivers were assigned to these regions.
Table 3.2: Artifacts Found in Keith and Lincoln Counties
ARTIFACT TYPE
COUNTY
FOLSOM
POINTS
MIDLAND
POINTS
FOLSOM
PREFORMS
CHANNEL
FLAKES TOTALS
KEITH 43 9 15 3 70
LINCOLN 29 8 12 1 50
TOTALS 72 17 27 4 120
Table 3.3: Lithic Materials Found in Keith and Lincoln County
MATERIAL
COUNTY
HARTVILLE
UPLIFT
WHITE
RIVER
GROUP
SILICATES
SMOKY
HILL
JASPER PERMIAN OTHER* TOTALS
KEITH 17 26 3 — 24 70
LINCOLN 11 15 6 1 17 50
TOTALS 28 41 9 1 41 120
OTHER* = ALIBATES, EDWARDS, FOSSIL WOOD, KNIFE RIVER FLINT, PORCELLANITE, QUARTZITE, TONGUE RIVER
SILICIFIED SEDIMENT, UNIDENTIFIED CHERT
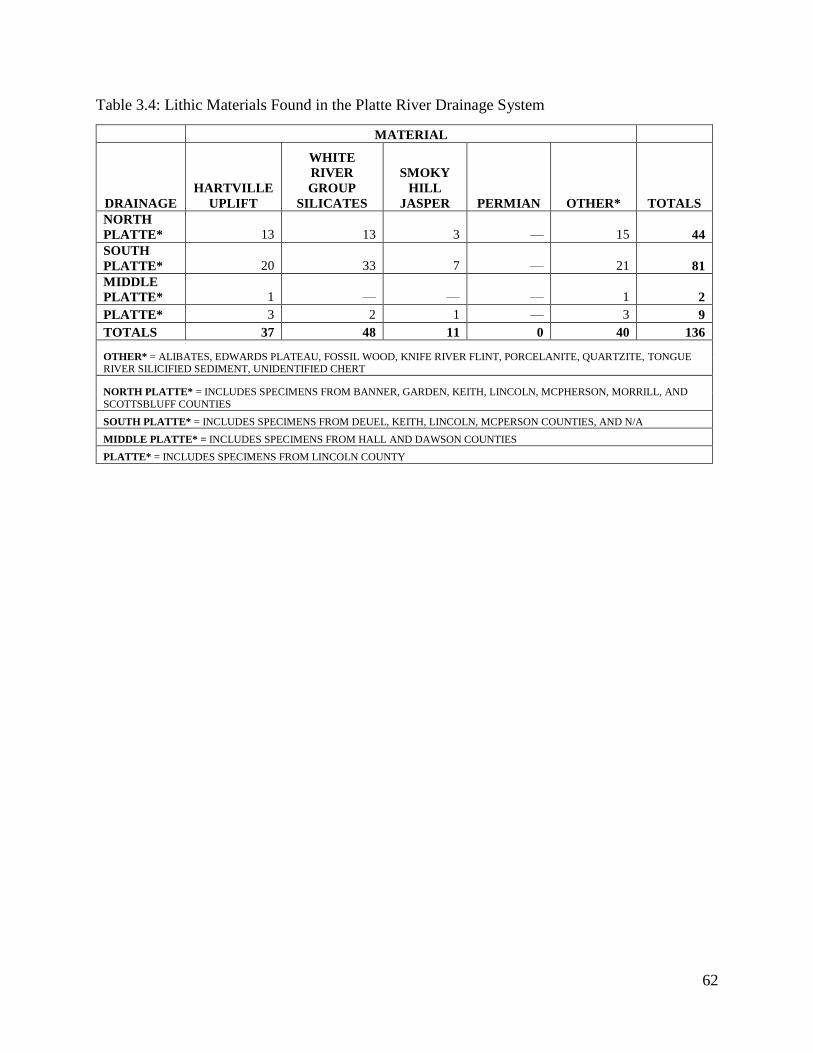
62
Table 3.4: Lithic Materials Found in the Platte River Drainage System
MATERIAL
DRAINAGE
HARTVILLE
UPLIFT
WHITE
RIVER
GROUP
SILICATES
SMOKY
HILL
JASPER PERMIAN OTHER* TOTALS
NORTH
PLATTE* 13 13 3 — 15 44
SOUTH
PLATTE* 20 33 7 — 21 81
MIDDLE
PLATTE* 1 — — — 1 2
PLATTE* 3 2 1 — 3 9
TOTALS 37 48 11 0 40 136
OTHER* = ALIBATES, EDWARDS PLATEAU, FOSSIL WOOD, KNIFE RIVER FLINT, PORCELANITE, QUARTZITE, TONGUE RIVER SILICIFIED SEDIMENT, UNIDENTIFIED CHERT
NORTH PLATTE* = INCLUDES SPECIMENS FROM BANNER, GARDEN, KEITH, LINCOLN, MCPHERSON, MORRILL, AND
SCOTTSBLUFF COUNTIES
SOUTH PLATTE* = INCLUDES SPECIMENS FROM DEUEL, KEITH, LINCOLN, MCPERSON COUNTIES, AND N/A
MIDDLE PLATTE* = INCLUDES SPECIMENS FROM HALL AND DAWSON COUNTIES
PLATTE* = INCLUDES SPECIMENS FROM LINCOLN COUNTY
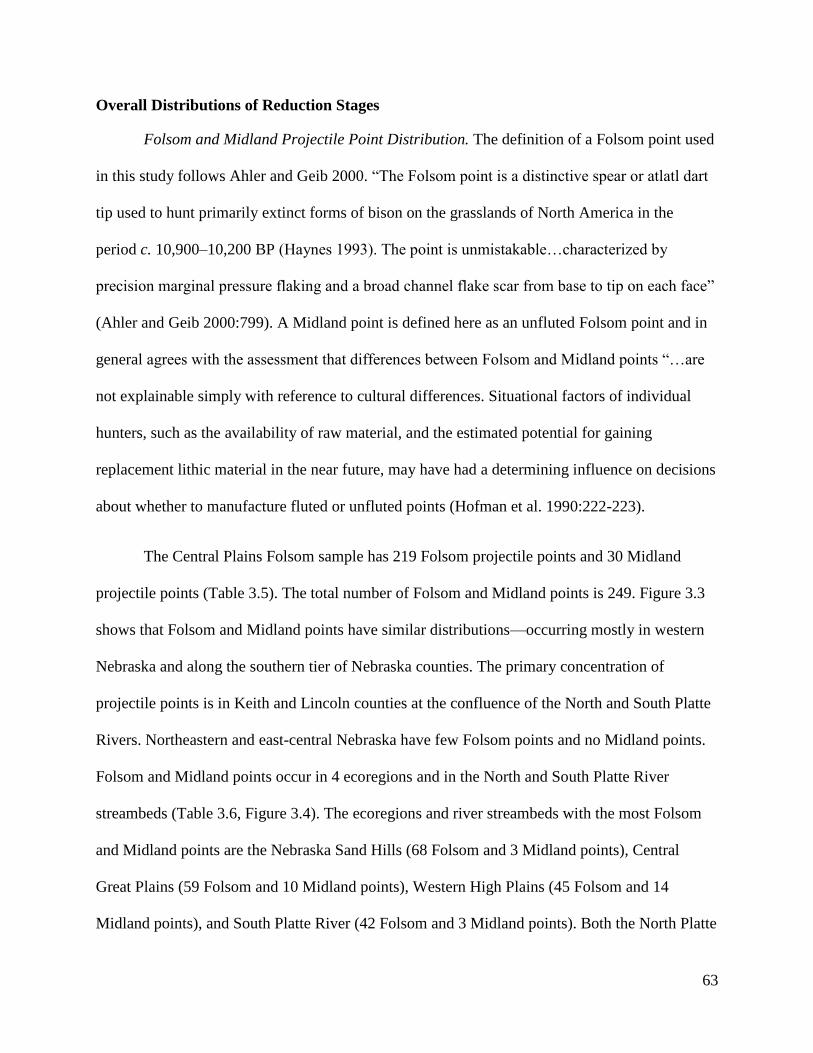
63
Overall Distributions of Reduction Stages
Folsom and Midland Projectile Point Distribution. The definition of a Folsom point used
in this study follows Ahler and Geib 2000. “The Folsom point is a distinctive spear or atlatl dart
tip used to hunt primarily extinct forms of bison on the grasslands of North America in the
period c. 10,900–10,200 BP (Haynes 1993). The point is unmistakable…characterized by
precision marginal pressure flaking and a broad channel flake scar from base to tip on each face”
(Ahler and Geib 2000:799). A Midland point is defined here as an unfluted Folsom point and in
general agrees with the assessment that differences between Folsom and Midland points “…are
not explainable simply with reference to cultural differences. Situational factors of individual
hunters, such as the availability of raw material, and the estimated potential for gaining
replacement lithic material in the near future, may have had a determining influence on decisions
about whether to manufacture fluted or unfluted points (Hofman et al. 1990:222-223).
The Central Plains Folsom sample has 219 Folsom projectile points and 30 Midland
projectile points (Table 3.5). The total number of Folsom and Midland points is 249. Figure 3.3
shows that Folsom and Midland points have similar distributions—occurring mostly in western
Nebraska and along the southern tier of Nebraska counties. The primary concentration of
projectile points is in Keith and Lincoln counties at the confluence of the North and South Platte
Rivers. Northeastern and east-central Nebraska have few Folsom points and no Midland points.
Folsom and Midland points occur in 4 ecoregions and in the North and South Platte River
streambeds (Table 3.6, Figure 3.4). The ecoregions and river streambeds with the most Folsom
and Midland points are the Nebraska Sand Hills (68 Folsom and 3 Midland points), Central
Great Plains (59 Folsom and 10 Midland points), Western High Plains (45 Folsom and 14
Midland points), and South Platte River (42 Folsom and 3 Midland points). Both the North Platte

64
River (3 Folsom and 0 Midland points) and Corn Belt Plains (2 Folsom and 0 Midland points)
had sparse Folsom evidence. The Corn Belt Plains lies in the eastern quarter of Nebraska and this
ecoregion has little Folsom evidence in general for all artifact types.
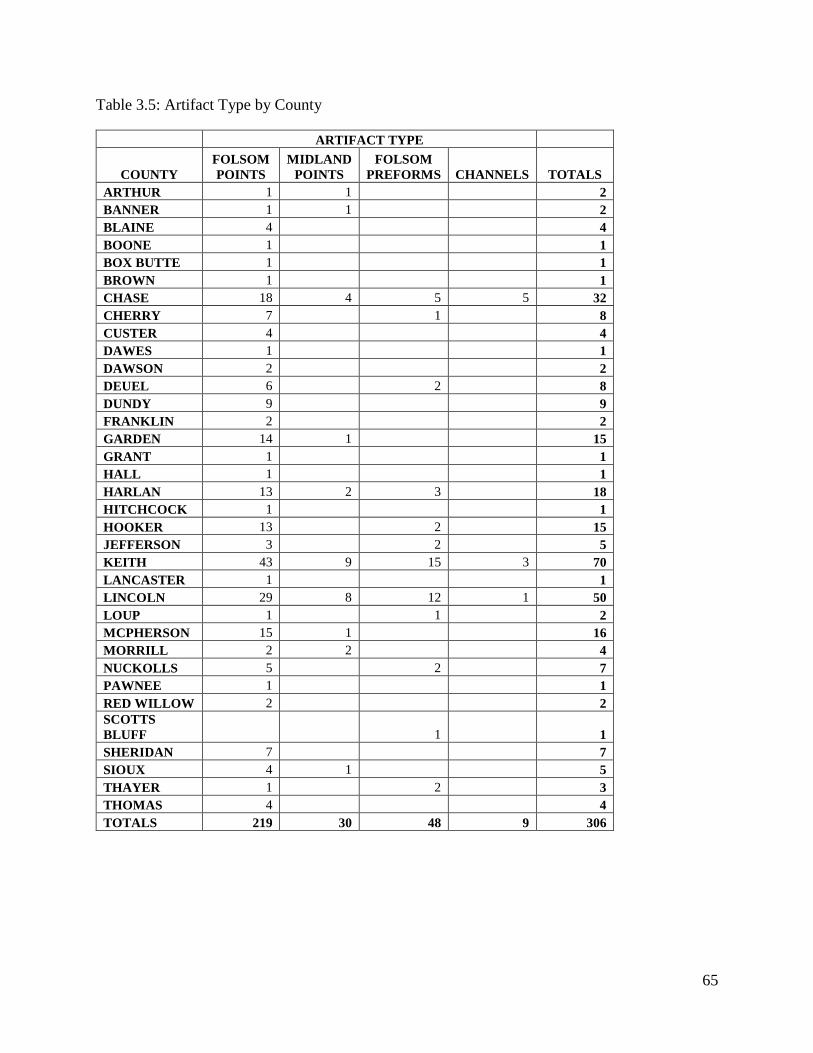
65
Table 3.5: Artifact Type by County
ARTIFACT TYPE
COUNTY
FOLSOM
POINTS
MIDLAND
POINTS
FOLSOM
PREFORMS CHANNELS TOTALS
ARTHUR 1 1 2
BANNER 1 1 2
BLAINE 4 4
BOONE 1 1
BOX BUTTE 1 1
BROWN 1 1
CHASE 18 4 5 5 32
CHERRY 7 1 8
CUSTER 4 4
DAWES 1 1
DAWSON 2 2
DEUEL 6 2 8
DUNDY 9 9
FRANKLIN 2 2
GARDEN 14 1 15
GRANT 1 1
HALL 1 1
HARLAN 13 2 3 18
HITCHCOCK 1 1
HOOKER 13 2 15
JEFFERSON 3 2 5
KEITH 43 9 15 3 70
LANCASTER 1 1
LINCOLN 29 8 12 1 50
LOUP 1 1 2
MCPHERSON 15 1 16
MORRILL 2 2 4
NUCKOLLS 5 2 7
PAWNEE 1 1
RED WILLOW 2 2
SCOTTS
BLUFF 1 1
SHERIDAN 7 7
SIOUX 4 1 5
THAYER 1 2 3
THOMAS 4 4
TOTALS 219 30 48 9 306
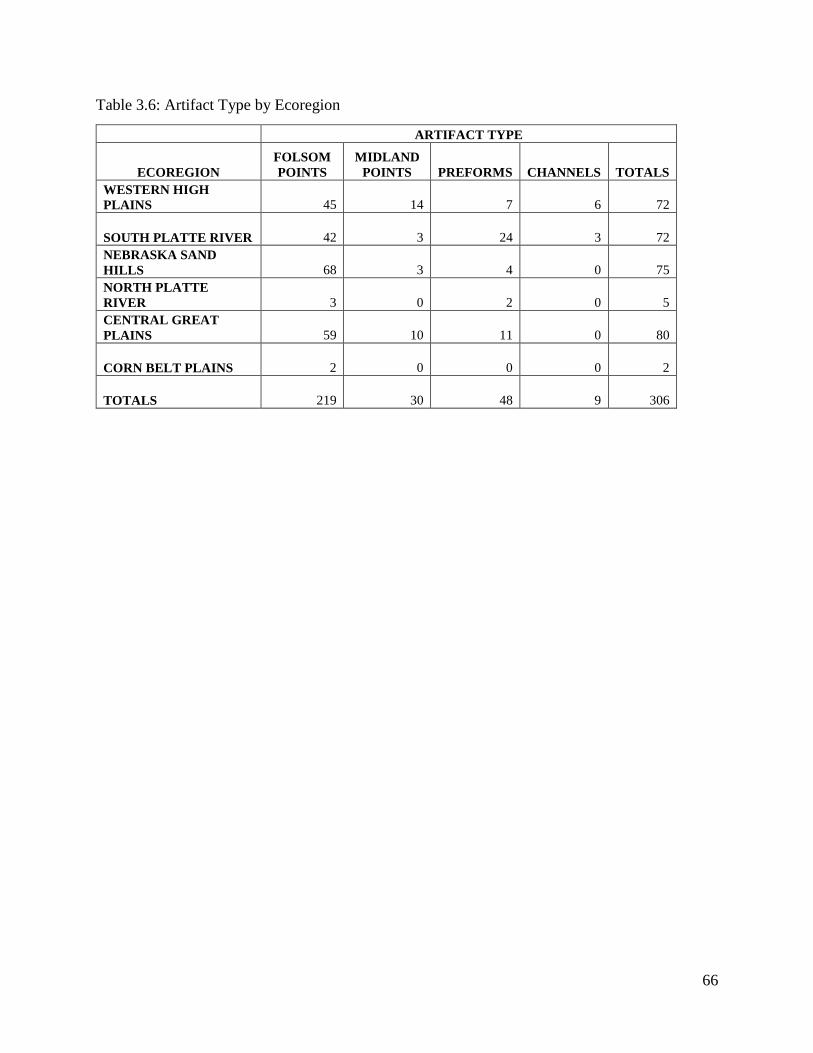
66
Table 3.6: Artifact Type by Ecoregion
ARTIFACT TYPE
ECOREGION
FOLSOM
POINTS
MIDLAND
POINTS PREFORMS CHANNELS TOTALS
WESTERN HIGH
PLAINS 45 14 7 6 72
SOUTH PLATTE RIVER 42 3 24 3 72
NEBRASKA SAND
HILLS 68 3 4 0 75
NORTH PLATTE
RIVER 3 0 2 0 5
CENTRAL GREAT
PLAINS 59 10 11 0 80
CORN BELT PLAINS 2 0 0 0 2
TOTALS 219 30 48 9 306
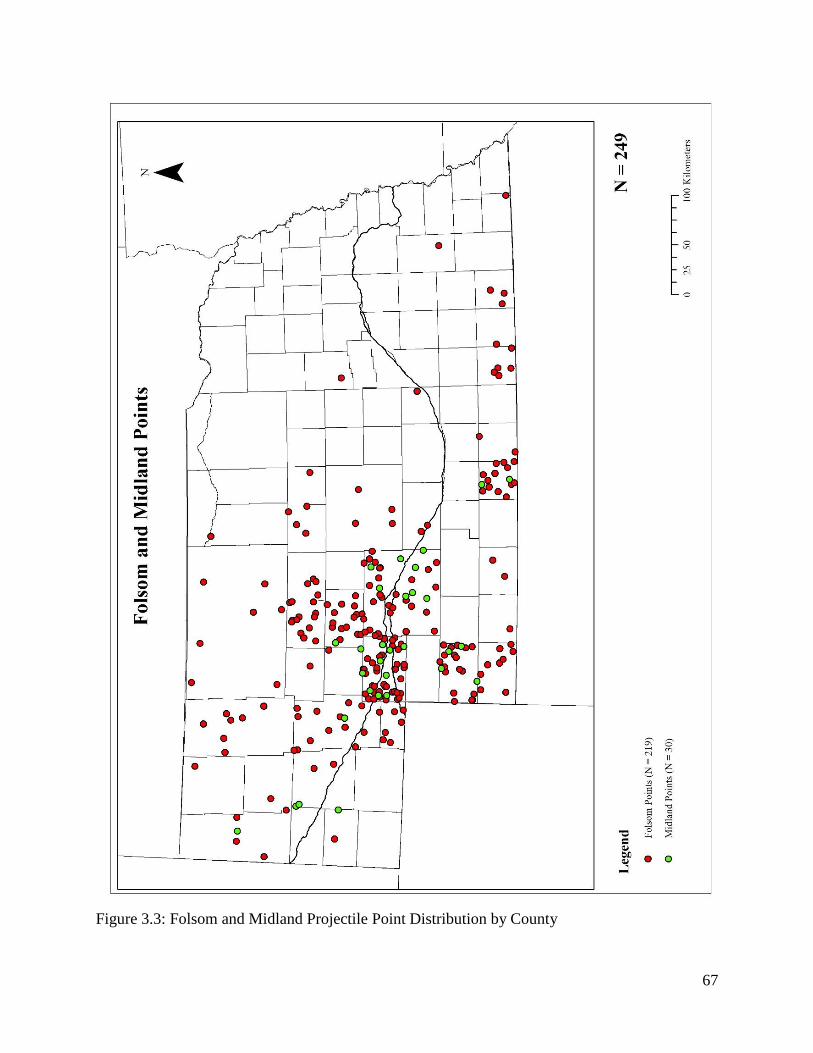
67
Figure 3.3: Folsom and Midland Projectile Point Distribution by County
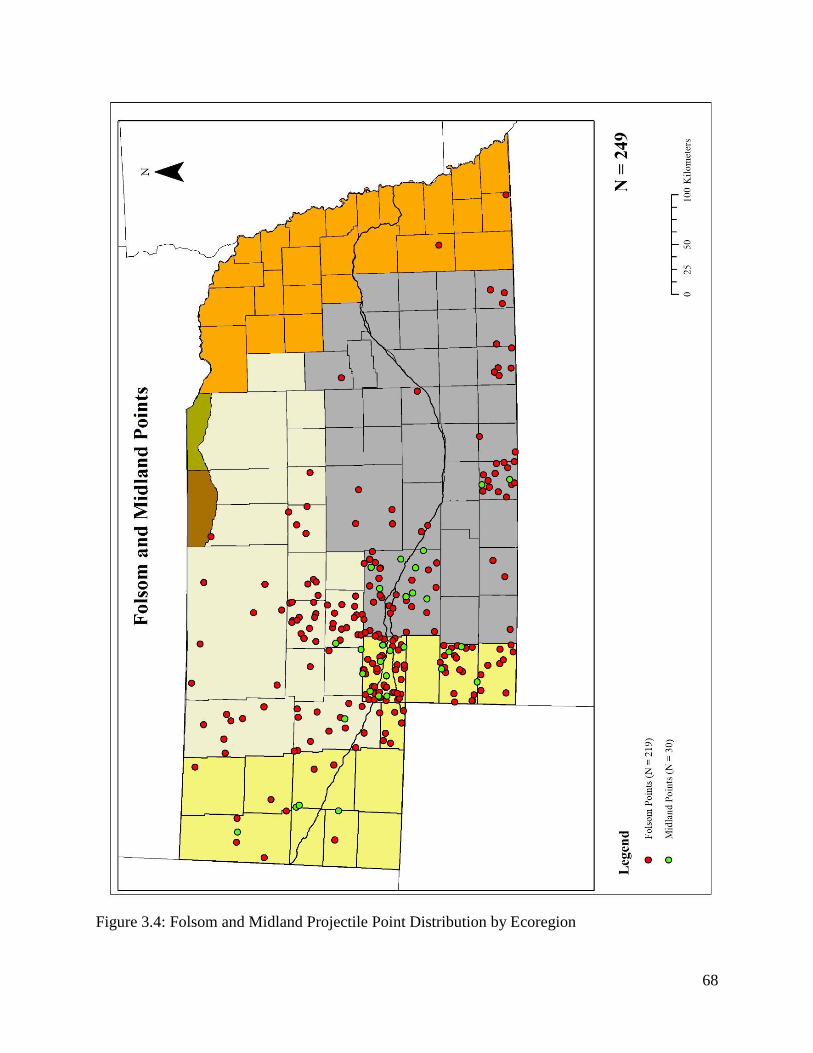
68
Figure 3.4: Folsom and Midland Projectile Point Distribution by Ecoregion
69
Preform Distribution. Crabtree (1972) defines a preform as a blank that has in one way or
another been additionally modified. For the purposes of this study, a Folsom preform is
recognized based on combinations of attributes including basal platform preparation, Folsom
type fluting, preform shape, and type of marginal retouch that indicate a Folsom point was being
manufactured. The Central Plains Folsom sample has 48 preforms (Table 3.5). Figure 3.5 and
Table 3.5 show the primary concentration of preforms occurs in western Nebraska. This
concentration occurs near the confluence of the North and South Platte Rivers in Keith and
Lincoln Counties (27 preforms) and Chase County of western Nebraska (5 preforms). A
secondary concentration occurs in the southern and east-southern tier of counties of Harlan,
Nuckolls, Thayer, and Jefferson (9 preforms). The north-eastern part the state is void of
documented preforms.
Preforms occur in 3 ecoregions and both the North and South Platte River streambeds
(Table 3.6, Figure 3.6). Most preforms were found in the South Platte streambed (24 preforms).
The Central Great Plains ecoregion had 11 preforms, but the preform evidence diminishes after
that with 7 found in the Western High Plains and 4 in the Nebraska Sand Hills. Only two
preforms were found in the North Platte streambed. No preforms were found in the eastern and
northeastern ecoregions (the Corn Belt Plains, Northwestern Glaciated Plains, and Northwestern
Great Plains). Preforms and fragments of preforms are more recognizable than channel flakes
(especially channel fragments) which could be why they are more widespread than channels.
Channel Flake Distribution. The Central Plains Folsom sample includes 9 channel flakes
with the primary concentration in Chase County (5 channels), located in southwestern Nebraska
(Table 3.5, Figure 3.5). A secondary concentration occurs in Keith (3 channels) and Lincoln (1
channel) Counties located in the area of the North and South Platte River confluence. Table 3.6
70
and Figure 3.6 show that channel flakes occur in only one ecoregion, the Western High Plains (6
channel flakes) and in the streambed of the South Platte River (3 channels). We have no channel
flake evidence for the North Platte River streambed and the Nebraska Sand Hills, Central Great
Plains, Corn Belt Plains, Northwestern Glaciated Plains, and Northwestern Great Plains
ecoregions. The channel flake evidence is confined to the southwestern and western part of the
state.
The current evidence shows that we do not have an adequate sample of channel flakes for
a detailed spatial analysis. It really represents only a few sites where they were recognized (i.e.,
the Nolan site). Folsom preforms are generally larger and more recognizable than channel
flakes—which could be why the preforms exhibit a more widespread distribution. Not
surprisingly, channel flakes occur within the area of Folsom preform occurrences.
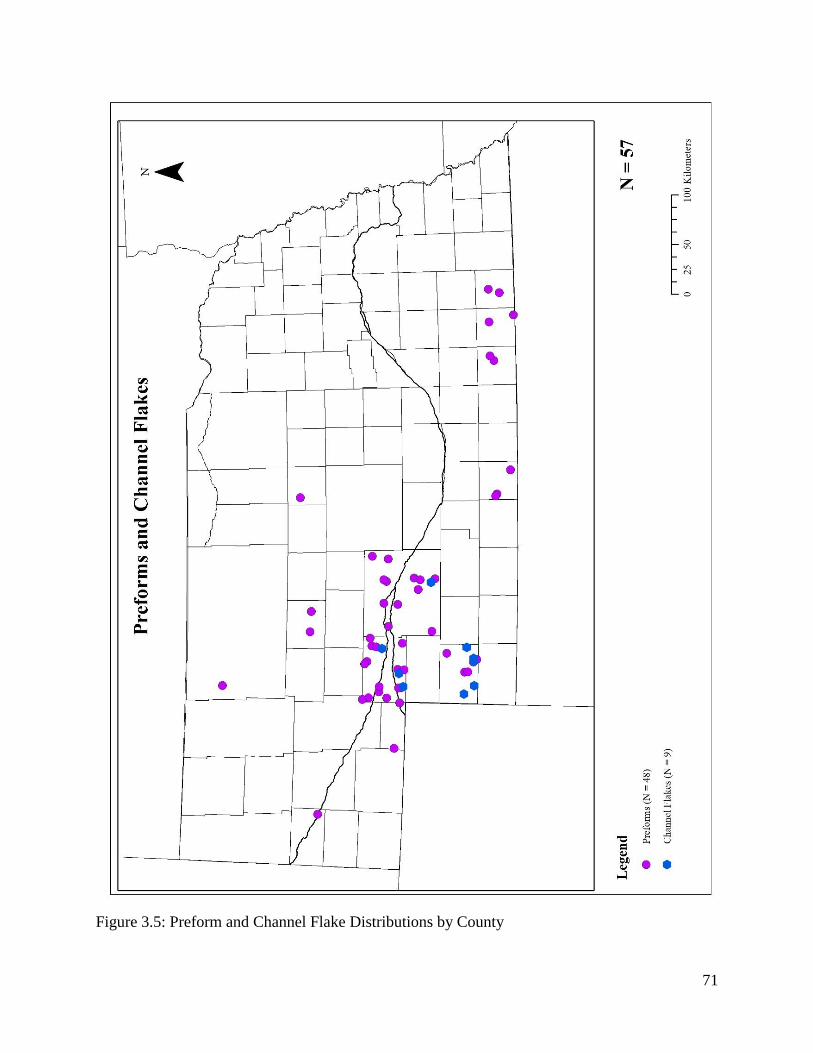
71
Figure 3.5: Preform and Channel Flake Distributions by County
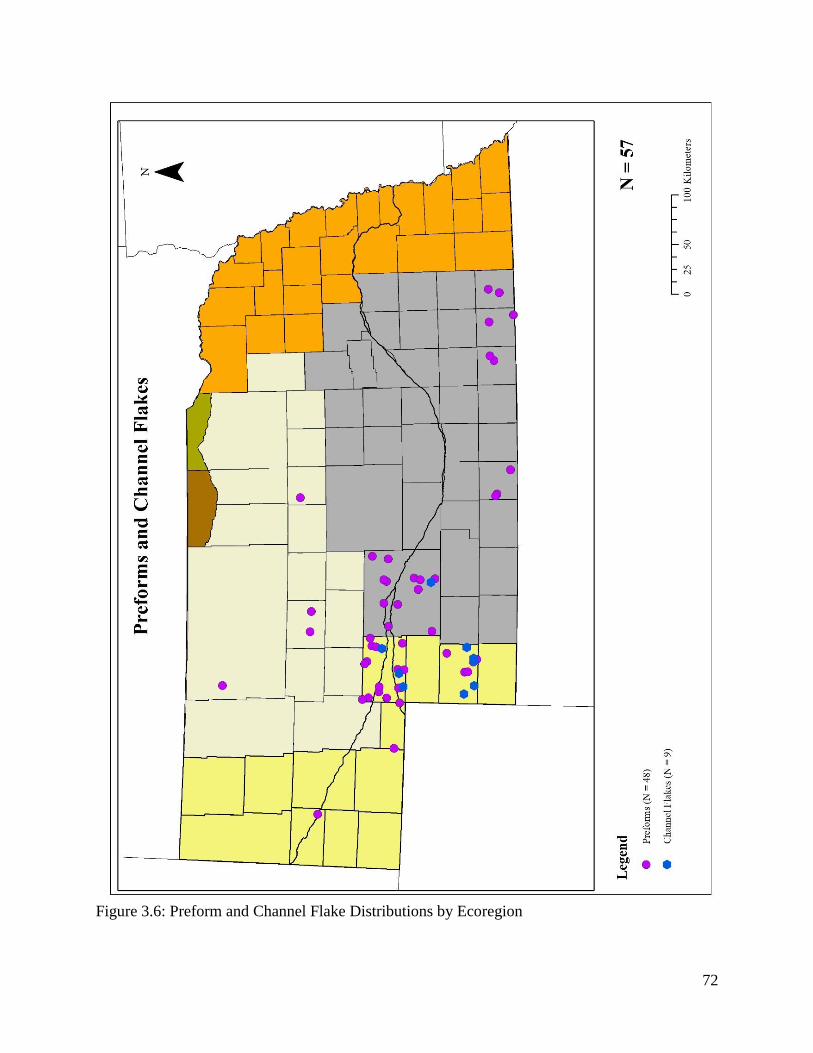
72
Figure 3.6: Preform and Channel Flake Distributions by Ecoregion
73
Overall Distributions of Projectile Point Fragment Types
Complete and Nearly Complete Projectile Points Distribution. The Central Plains Folsom
database has 97 complete and nearly complete projectile points (Table 3.7, Figure 3.7). The
distribution of complete and nearly complete points is more evenly distributed in the western part
of the state with one to three complete and nearly complete points occurring in most counties in
western Nebraska. The eastern and northeastern part of the state is nearly void of Folsom
evidence with only four complete and nearly complete points occurring there. The counties with
the most complete and nearly complete points occur in the western portion of Nebraska in Chase
(8 artifacts), Hooker (8 artifacts), Harlan (5 artifacts), and Lincoln (6 artifacts) Counties. Keith
County has the most complete and nearly complete projectile points with 22 specimens.
Complete and nearly complete points are found in four ecoregions and the North and
South Platte River streambeds (Table 3.8, Figure 3.8). The Nebraska Sand Hills has 34 complete
and nearly complete specimens, the Western High Plains has 19, and the Central Great Plains has
20 specimens. The eastern ecoregions are sparse in terms of complete and nearly complete points
with the Corn Belt Plains having only one specimen and the Northwestern Great Plains and
Northwestern Glaciated Plains are void of complete point evidence. Twenty-one specimens were
found in the South Platte River streambed, while only two came from the North Platte. Out of 69
complete points, only 27 of them are thought to possibly be discards (where their length was less
than 40 mm). The majority of the complete points (42 of them) are thought to be lost in hunting
at kills or elsewhere.
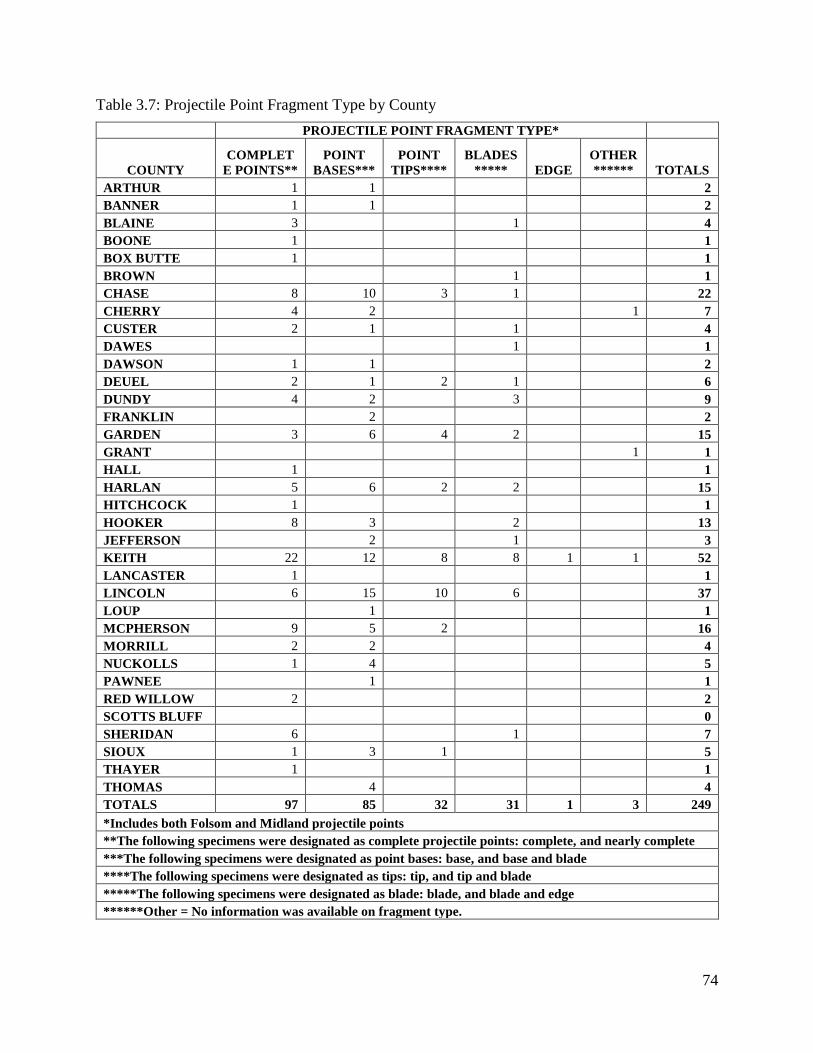
74
Table 3.7: Projectile Point Fragment Type by County
PROJECTILE POINT FRAGMENT TYPE*
COUNTY
COMPLET
E POINTS**
POINT
BASES***
POINT
TIPS****
BLADES
***** EDGE
OTHER
****** TOTALS
ARTHUR 1 1 2
BANNER 1 1 2
BLAINE 3 1 4
BOONE 1 1
BOX BUTTE 1 1
BROWN 1 1
CHASE 8 10 3 1 22
CHERRY 4 2 1 7
CUSTER 2 1 1 4
DAWES 1 1
DAWSON 1 1 2
DEUEL 2 1 2 1 6
DUNDY 4 2 3 9
FRANKLIN 2 2
GARDEN 3 6 4 2 15
GRANT 1 1
HALL 1 1
HARLAN 5 6 2 2 15
HITCHCOCK 1 1
HOOKER 8 3 2 13
JEFFERSON 2 1 3
KEITH 22 12 8 8 1 1 52
LANCASTER 1 1
LINCOLN 6 15 10 6 37
LOUP 1 1
MCPHERSON 9 5 2 16
MORRILL 2 2 4
NUCKOLLS 1 4 5
PAWNEE 1 1
RED WILLOW 2 2
SCOTTS BLUFF 0
SHERIDAN 6 1 7
SIOUX 1 3 1 5
THAYER 1 1
THOMAS 4 4
TOTALS 97 85 32 31 1 3 249
*Includes both Folsom and Midland projectile points
**The following specimens were designated as complete projectile points: complete, and nearly complete
***The following specimens were designated as point bases: base, and base and blade
****The following specimens were designated as tips: tip, and tip and blade
*****The following specimens were designated as blade: blade, and blade and edge
******Other = No information was available on fragment type.
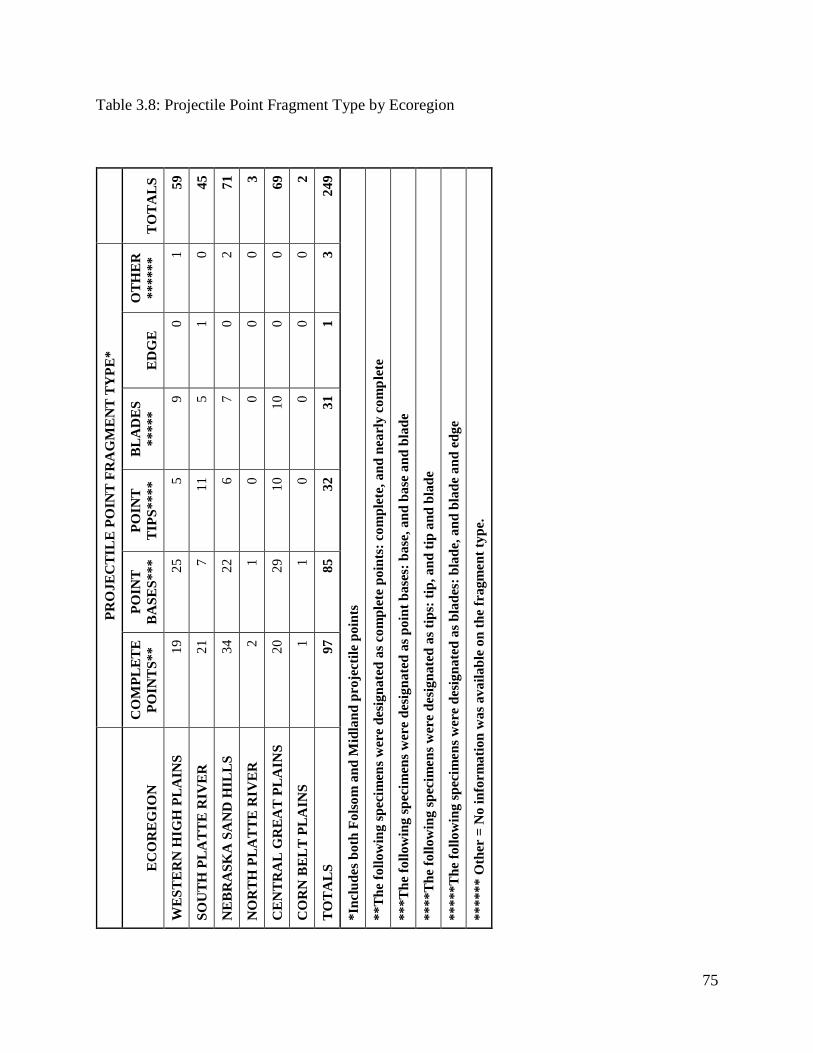
75
Table 3.8: Projectile Point Fragment Type by Ecoregion
P
RO
JE
CT
ILE
PO
INT
FR
AG
ME
NT
TY
PE
*
EC
OR
EG
ION
CO
MP
LE
TE
PO
INT
S*
*
PO
INT
BA
SE
S*
**
PO
INT
TIP
S*
**
*
BL
AD
ES
**
***
ED
GE
OT
HE
R
**
***
*
TO
TA
LS
WE
ST
ER
N H
IGH
PL
AIN
S
19
25
5
9
0
1
59
SO
UT
H P
LA
TT
E R
IVE
R
21
7
11
5
1
0
45
NE
BR
AS
KA
SA
ND
HIL
LS
3
4
22
6
7
0
2
71
NO
RT
H P
LA
TT
E R
IVE
R
2
1
0
0
0
0
3
CE
NT
RA
L G
RE
AT
PL
AIN
S
20
29
10
10
0
0
69
CO
RN
BE
LT
PL
AIN
S
1
1
0
0
0
0
2
TO
TA
LS
9
7
85
32
31
1
3
24
9
*In
clu
des
bo
th F
ols
om
an
d M
idla
nd
pro
jecti
le p
oin
ts
**
Th
e fo
llo
win
g s
pec
imen
s w
ere
des
ign
ate
d a
s co
mp
lete
po
ints
: co
mp
lete
, a
nd
nea
rly
co
mp
lete
**
*T
he
foll
ow
ing
sp
ecim
ens
wer
e d
esig
na
ted
as
po
int
ba
ses:
ba
se,
an
d b
ase
an
d b
lad
e
**
**
Th
e fo
llow
ing
sp
ecim
en
s w
ere
des
ign
ate
d a
s ti
ps:
tip
, a
nd
tip
an
d b
lad
e
**
***
Th
e fo
llo
win
g s
pec
imen
s w
ere
des
ign
ate
d a
s b
lad
es:
bla
de,
an
d b
lad
e a
nd
ed
ge
**
***
* O
ther
= N
o i
nfo
rm
ati
on
wa
s av
ail
ab
le o
n t
he
fragm
en
t ty
pe.
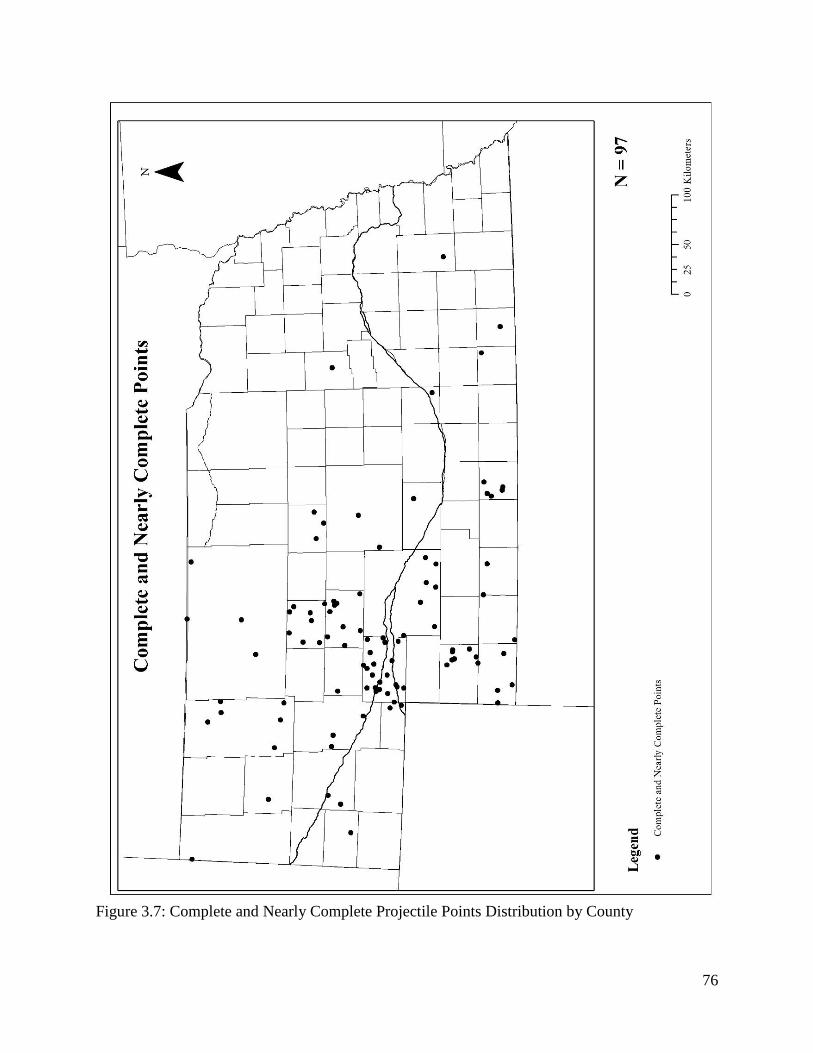
76
Figure 3.7: Complete and Nearly Complete Projectile Points Distribution by County
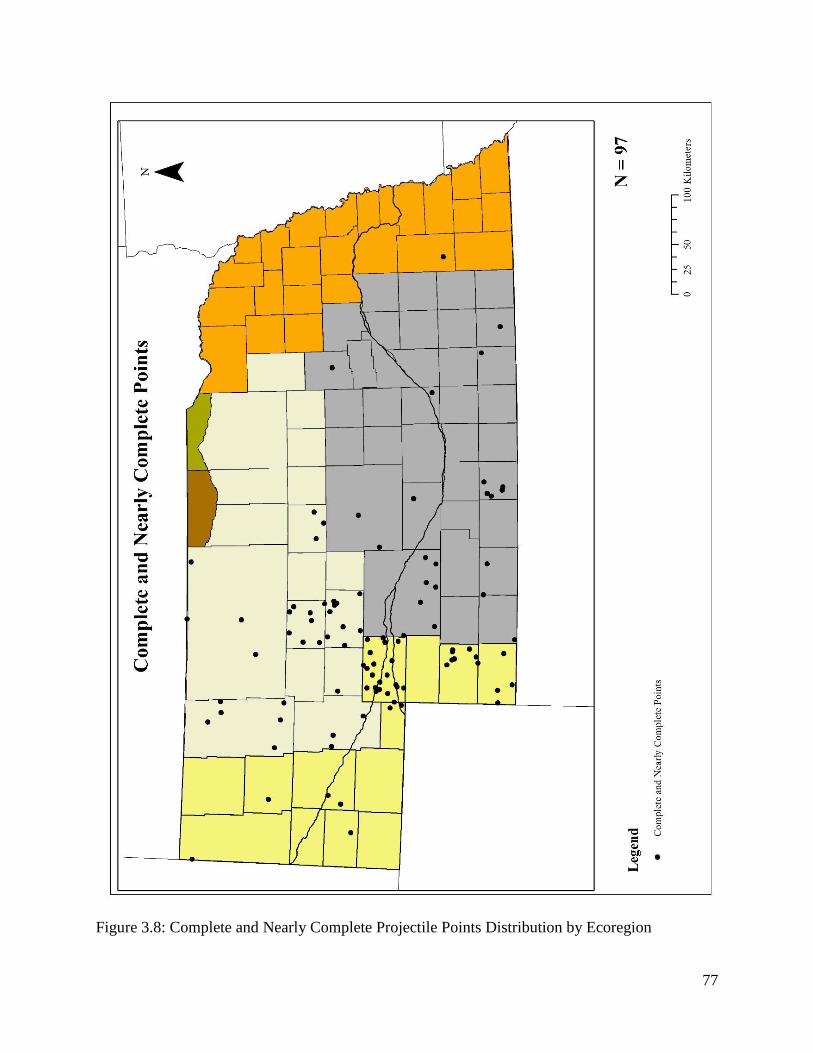
77
Figure 3.8: Complete and Nearly Complete Projectile Points Distribution by Ecoregion
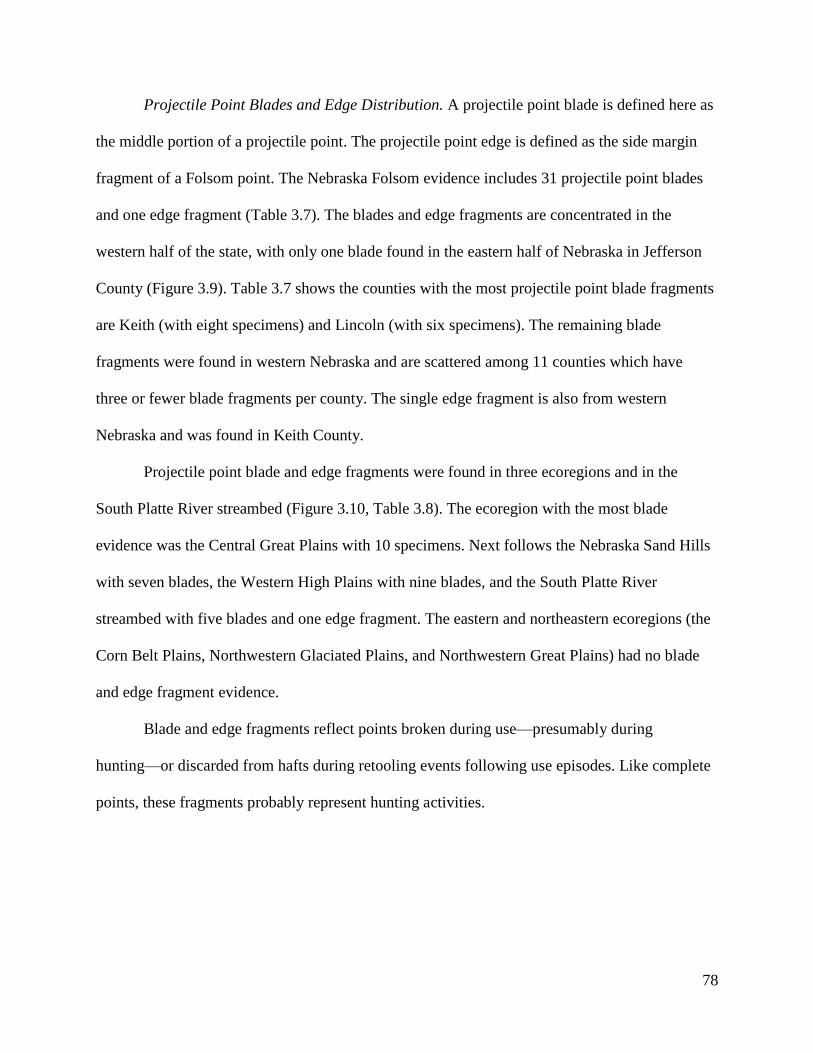
78
Projectile Point Blades and Edge Distribution. A projectile point blade is defined here as
the middle portion of a projectile point. The projectile point edge is defined as the side margin
fragment of a Folsom point. The Nebraska Folsom evidence includes 31 projectile point blades
and one edge fragment (Table 3.7). The blades and edge fragments are concentrated in the
western half of the state, with only one blade found in the eastern half of Nebraska in Jefferson
County (Figure 3.9). Table 3.7 shows the counties with the most projectile point blade fragments
are Keith (with eight specimens) and Lincoln (with six specimens). The remaining blade
fragments were found in western Nebraska and are scattered among 11 counties which have
three or fewer blade fragments per county. The single edge fragment is also from western
Nebraska and was found in Keith County.
Projectile point blade and edge fragments were found in three ecoregions and in the
South Platte River streambed (Figure 3.10, Table 3.8). The ecoregion with the most blade
evidence was the Central Great Plains with 10 specimens. Next follows the Nebraska Sand Hills
with seven blades, the Western High Plains with nine blades, and the South Platte River
streambed with five blades and one edge fragment. The eastern and northeastern ecoregions (the
Corn Belt Plains, Northwestern Glaciated Plains, and Northwestern Great Plains) had no blade
and edge fragment evidence.
Blade and edge fragments reflect points broken during use—presumably during
hunting—or discarded from hafts during retooling events following use episodes. Like complete
points, these fragments probably represent hunting activities.
79
Figure 3.9: Projectile Point Blades and Edge Distribution by County
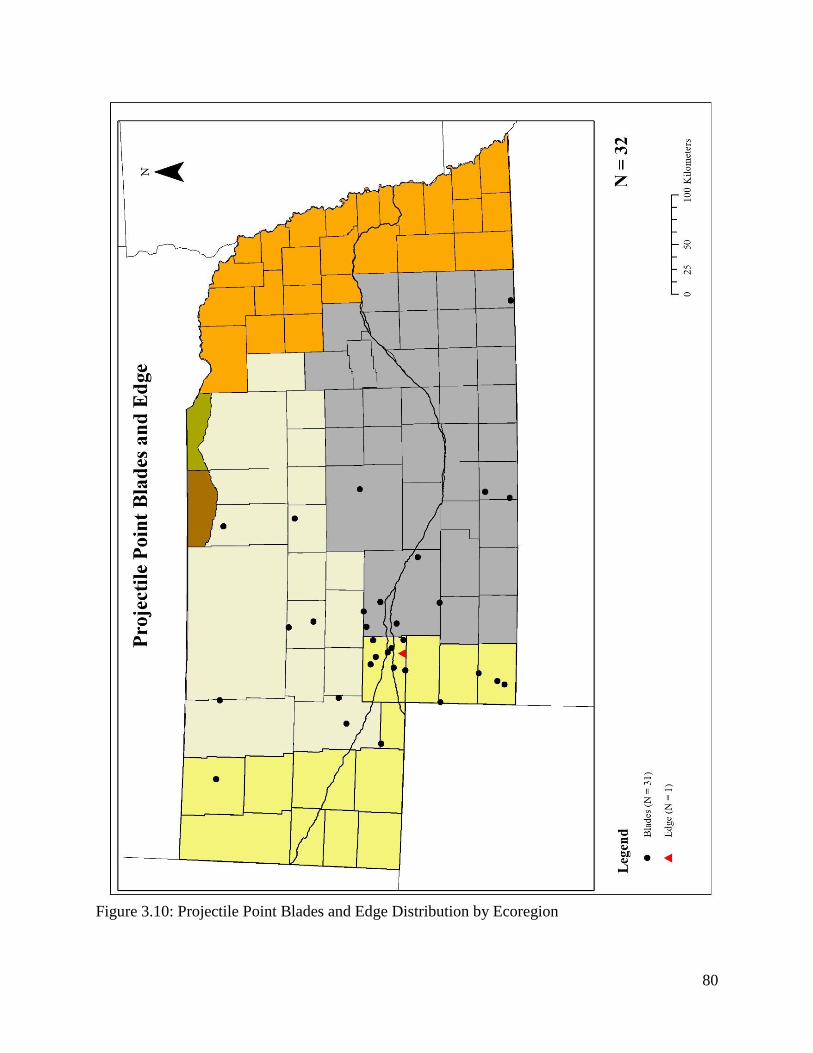
80
Figure 3.10: Projectile Point Blades and Edge Distribution by Ecoregion
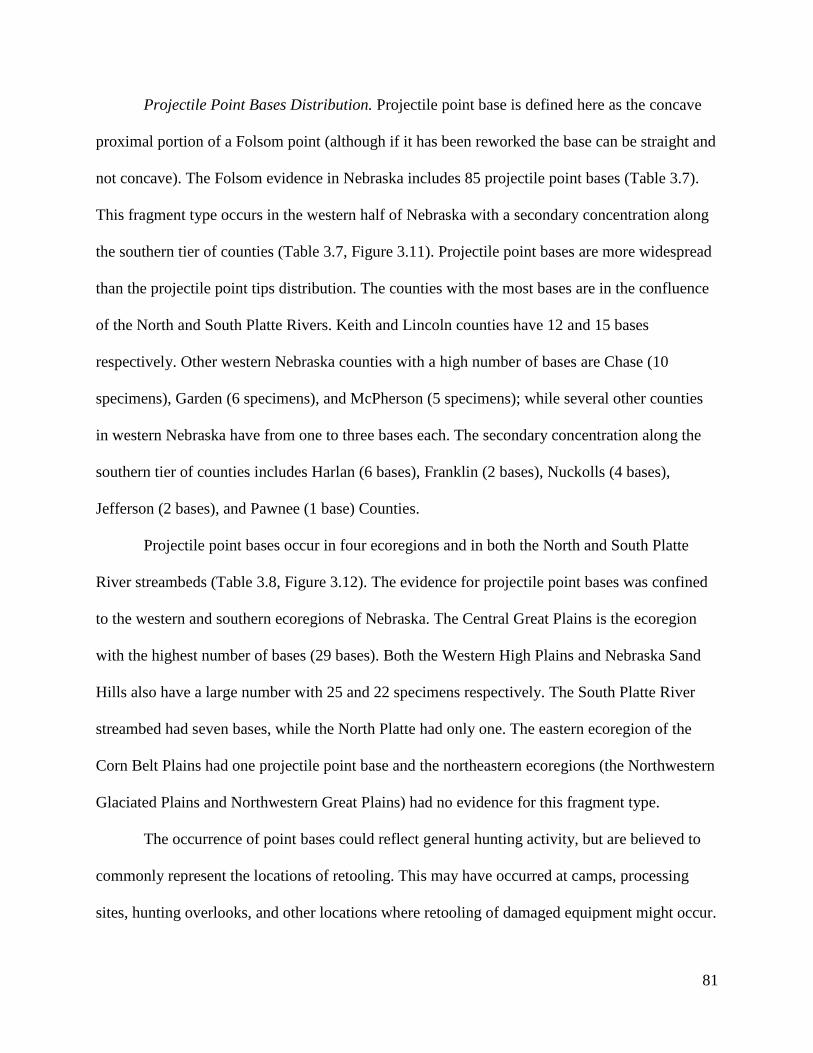
81
Projectile Point Bases Distribution. Projectile point base is defined here as the concave
proximal portion of a Folsom point (although if it has been reworked the base can be straight and
not concave). The Folsom evidence in Nebraska includes 85 projectile point bases (Table 3.7).
This fragment type occurs in the western half of Nebraska with a secondary concentration along
the southern tier of counties (Table 3.7, Figure 3.11). Projectile point bases are more widespread
than the projectile point tips distribution. The counties with the most bases are in the confluence
of the North and South Platte Rivers. Keith and Lincoln counties have 12 and 15 bases
respectively. Other western Nebraska counties with a high number of bases are Chase (10
specimens), Garden (6 specimens), and McPherson (5 specimens); while several other counties
in western Nebraska have from one to three bases each. The secondary concentration along the
southern tier of counties includes Harlan (6 bases), Franklin (2 bases), Nuckolls (4 bases),
Jefferson (2 bases), and Pawnee (1 base) Counties.
Projectile point bases occur in four ecoregions and in both the North and South Platte
River streambeds (Table 3.8, Figure 3.12). The evidence for projectile point bases was confined
to the western and southern ecoregions of Nebraska. The Central Great Plains is the ecoregion
with the highest number of bases (29 bases). Both the Western High Plains and Nebraska Sand
Hills also have a large number with 25 and 22 specimens respectively. The South Platte River
streambed had seven bases, while the North Platte had only one. The eastern ecoregion of the
Corn Belt Plains had one projectile point base and the northeastern ecoregions (the Northwestern
Glaciated Plains and Northwestern Great Plains) had no evidence for this fragment type.
The occurrence of point bases could reflect general hunting activity, but are believed to
commonly represent the locations of retooling. This may have occurred at camps, processing
sites, hunting overlooks, and other locations where retooling of damaged equipment might occur.
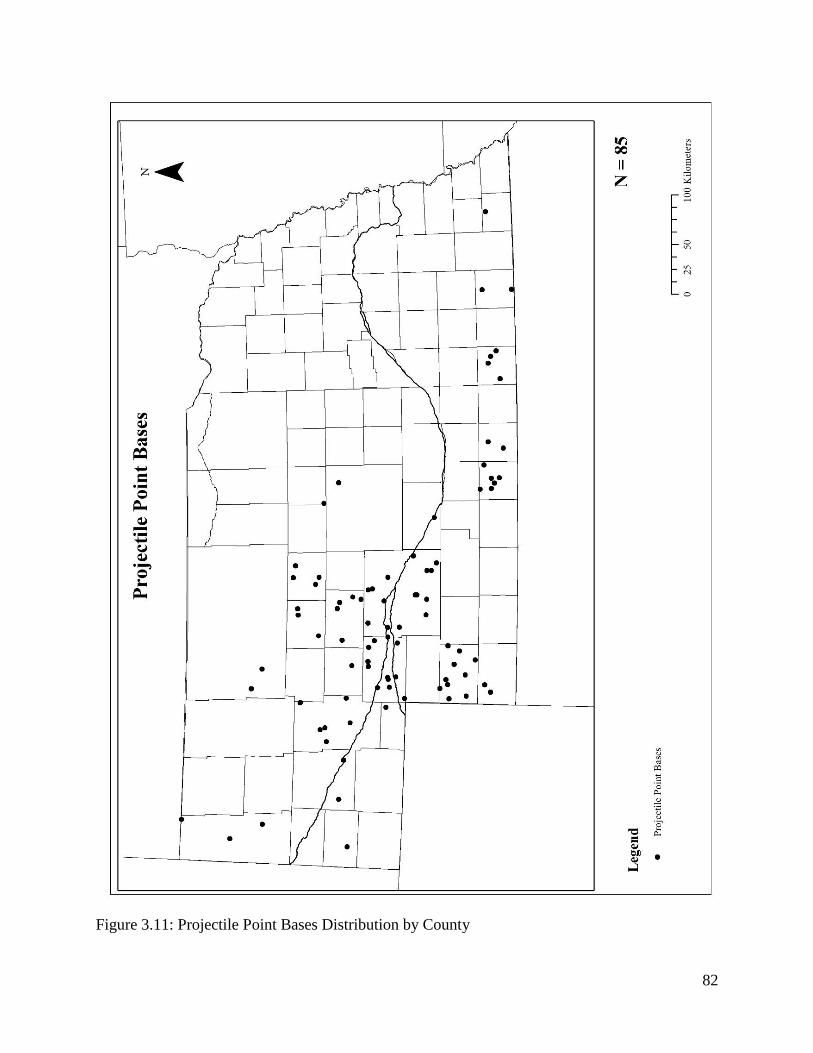
82
Figure 3.11: Projectile Point Bases Distribution by County
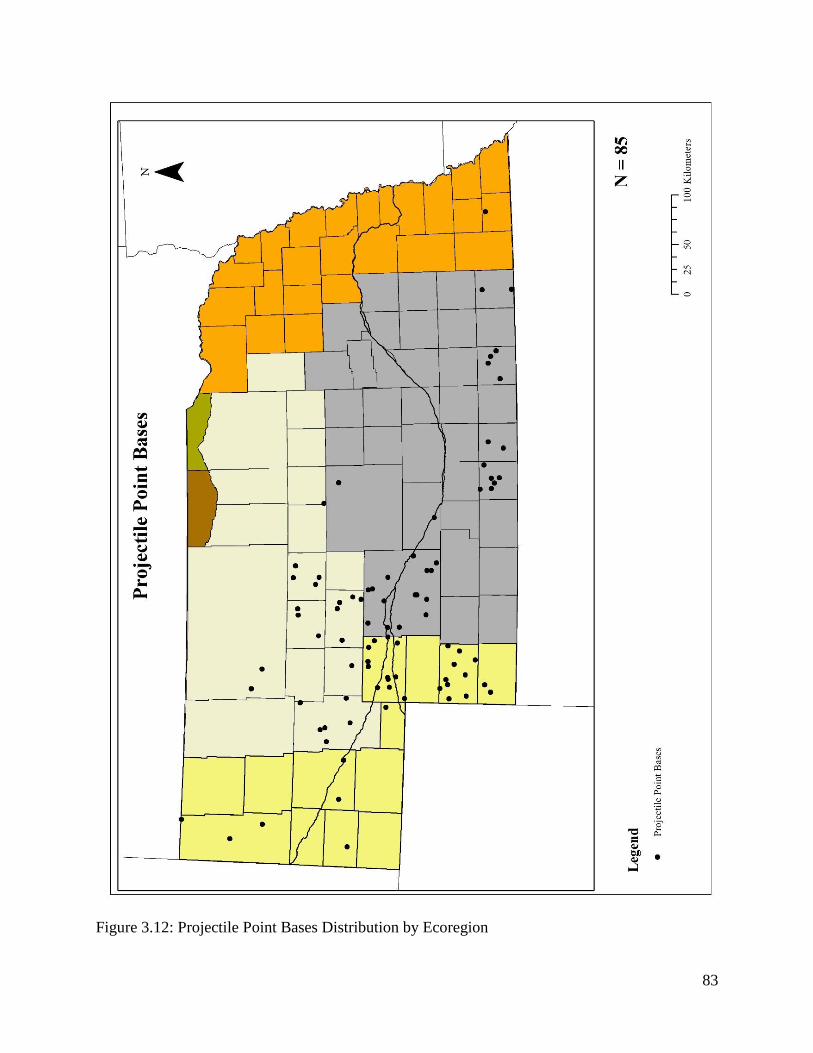
83
Figure 3.12: Projectile Point Bases Distribution by Ecoregion
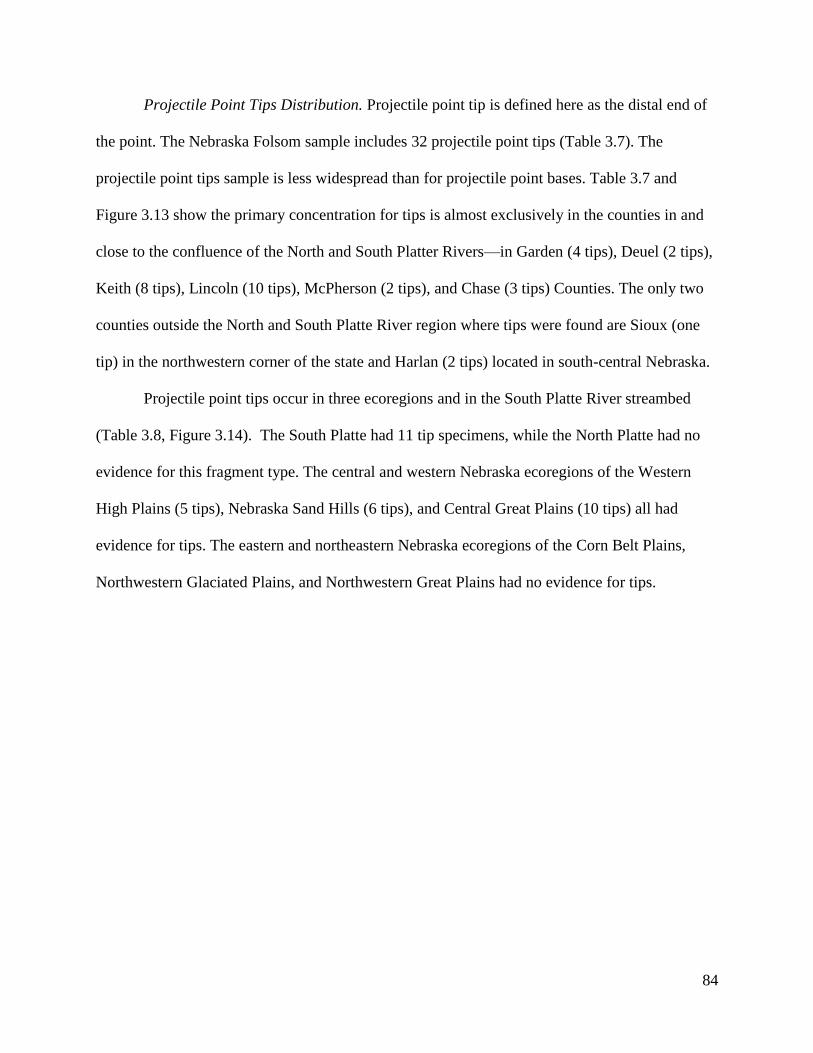
84
Projectile Point Tips Distribution. Projectile point tip is defined here as the distal end of
the point. The Nebraska Folsom sample includes 32 projectile point tips (Table 3.7). The
projectile point tips sample is less widespread than for projectile point bases. Table 3.7 and
Figure 3.13 show the primary concentration for tips is almost exclusively in the counties in and
close to the confluence of the North and South Platter Rivers—in Garden (4 tips), Deuel (2 tips),
Keith (8 tips), Lincoln (10 tips), McPherson (2 tips), and Chase (3 tips) Counties. The only two
counties outside the North and South Platte River region where tips were found are Sioux (one
tip) in the northwestern corner of the state and Harlan (2 tips) located in south-central Nebraska.
Projectile point tips occur in three ecoregions and in the South Platte River streambed
(Table 3.8, Figure 3.14). The South Platte had 11 tip specimens, while the North Platte had no
evidence for this fragment type. The central and western Nebraska ecoregions of the Western
High Plains (5 tips), Nebraska Sand Hills (6 tips), and Central Great Plains (10 tips) all had
evidence for tips. The eastern and northeastern Nebraska ecoregions of the Corn Belt Plains,
Northwestern Glaciated Plains, and Northwestern Great Plains had no evidence for tips.
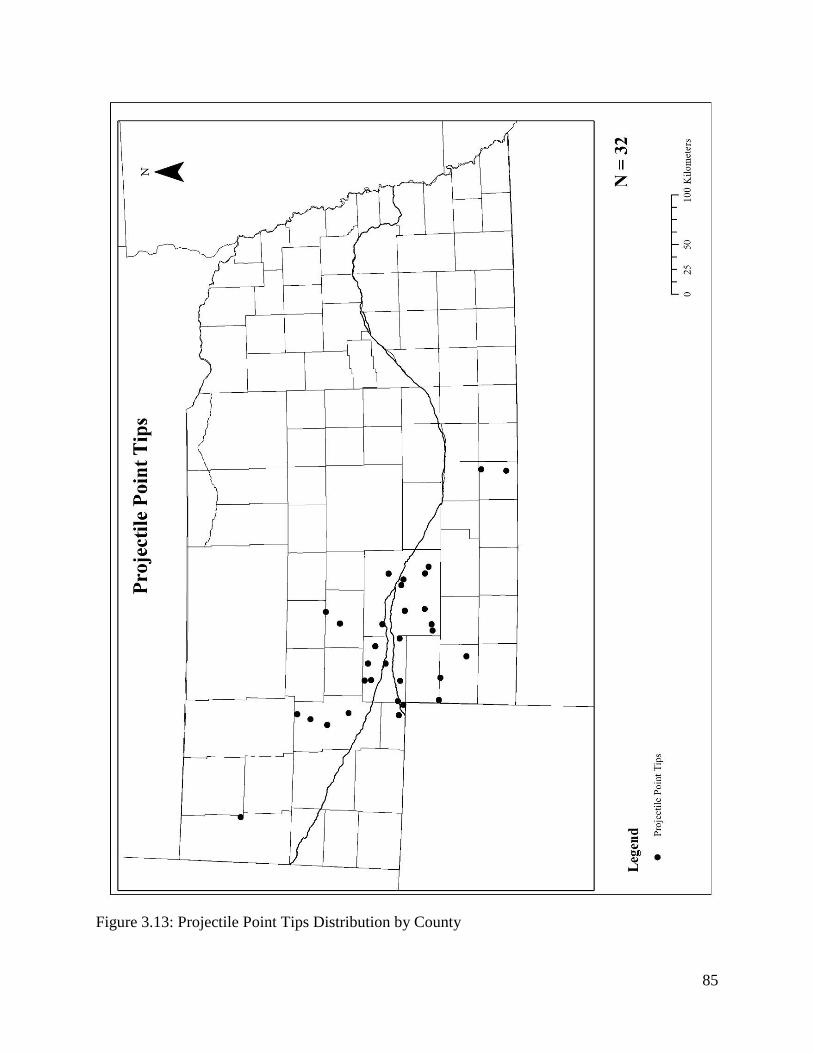
85
Figure 3.13: Projectile Point Tips Distribution by County

86
Figure 3.14: Projectile Point Tips Distribution by Ecoregion
87
Chapter 4: Evaluation of Potential Modern Biases
Before assessing patterns of Folsom artifacts in the Central Plains, it is important to
address possible modern sampling biases. This chapter considers four main factors that might
contribute bias in the Folsom distribution in the Central Plains. These factors are modern
population, contemporary land use practices (i.e. cultivation), archaeological research intensity,
and geomorphic factors.
Evaluation of Potential Modern Population Sampling Bias
It is assumed that modern population has the potential to affect the visibility of the
Folsom archaeological record. Thus, it is important to consider whether this factor is affecting
the Folsom distribution in the Central Plains. Since most artifact collectors hunt most intensively
where they live, modern population density of an area should correlate with the number of
collectors hunting in that area (c.f. Prasciunas 2008). Therefore, the higher the population, the
greater the chances of Folsom artifacts being found in that area, assuming all other factors are
equal. The population density for each county in Nebraska was calculated by dividing the total
population of each county by the land area per county. Population information for each county
with Folsom artifacts in Nebraska was derived from the U.S. Census Bureau using 1950
figures—the time when many of the artifacts in the sample were found and believed to be a
better estimate than current population to characterize overall 20th century population. The
population for all counties in an ecoregion was added to get the total population per ecoregion.
To standardize calculations and control for county and ecoregion sizes Folsom artifact density
per county and ecoregion were calculated by dividing the number of Folsom artifacts per county
and ecoregion by the total area of the county and ecoregion. Because these densities were small,
88
they were multiplied by 1,000 to get the Folsom artifact occurrence per 1,000 km2 for each
county and ecoregion (cf. Prasciunas 2008:37). The population statistics for each county and
ecoregion in Nebraska are presented in Tables 4.1 and 4.2 respectively. It is important to note
that artifacts found in the North and South Platte Rivers were included in this analysis and were
assigned to an ecoregion based on the county in which they were found.
Pearson’s product-moment correlation coefficient was used to determine the relationship
between Folsom artifact density and modern population density in each ecoregion. The results of
this analysis are presented in Table 4.4. The scale used to interpret Pearson’s product-moment
correlations is given in Table 4.3. Pearson’s could not be calculated for two of the regions (the
Northwestern Glaciated Plains and Northwestern Great Plains) because of insufficient sample
sizes in these region.
The results revealed small negative correlations in both the Western High Plains and
Corn Belt Plains, a medium negative correlation in the Nebraska Sand Hills, and no correlation
in the Central Great Plains. But, the associated P values (where P ≤ .05) revealed the results were
not statistically significant in any of these regions. Thus, there does not appear to be a correlation
between Folsom artifact density and modern population density for any of the ecoregions in
Nebraska. Modern population is not a potential sampling bias for this study.
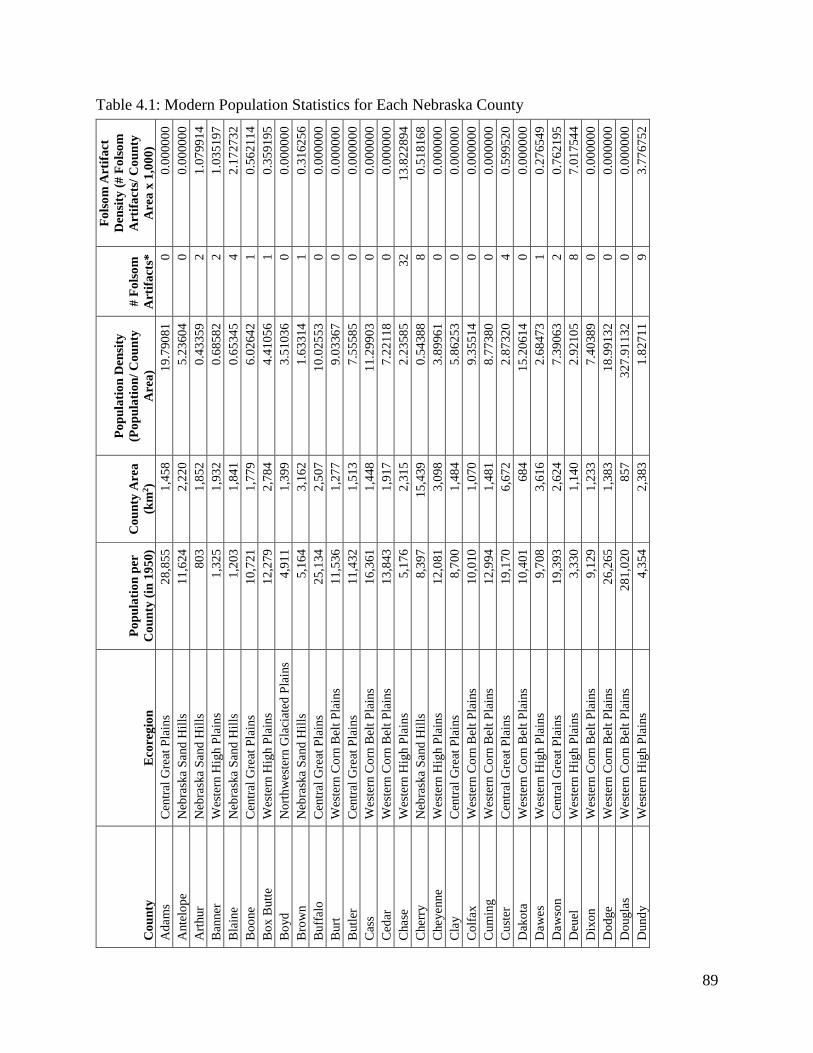
89
Table 4.1: Modern Population Statistics for Each Nebraska County
Co
un
ty
Eco
reg
ion
Po
pu
lati
on
per
Co
un
ty (
in 1
95
0)
Co
un
ty A
rea
(km
2)
Po
pu
lati
on
Den
sity
(Po
pu
lati
on
/ C
ou
nty
Are
a)
# F
ols
om
Art
ifa
cts*
Fo
lso
m A
rtif
act
Den
sity
(#
Fo
lso
m
Art
ifa
cts/
Co
un
ty
Are
a x
1,0
00)
Ad
am
s C
entr
al G
reat
Pla
ins
28
,855
1,4
58
19
.790
81
0
0
.00
00
00
Ante
lop
e N
ebra
ska
Sand
Hil
ls
11
,624
2,2
20
5.2
360
4
0
0.0
000
00
Art
hur
Neb
rask
a S
and
Hil
ls
80
3
1,8
52
0.4
335
9
2
1.0
799
14
Ban
ner
W
este
rn H
igh P
lain
s 1
,32
5
1,9
32
0.6
858
2
2
1.0
351
97
Bla
ine
Neb
rask
a S
and
Hil
ls
1,2
03
1,8
41
0.6
534
5
4
2.1
727
32
Bo
one
Cen
tral
Gre
at P
lain
s 1
0,7
21
1,7
79
6.0
264
2
1
0.5
621
14
Bo
x B
utt
e W
este
rn H
igh P
lain
s 1
2,2
79
2,7
84
4.4
105
6
1
0.3
591
95
Bo
yd
N
ort
hw
este
rn G
laci
ated
Pla
ins
4,9
11
1,3
99
3.5
103
6
0
0.0
000
00
Bro
wn
N
ebra
ska
Sand
Hil
ls
5,1
64
3,1
62
1.6
331
4
1
0.3
162
56
Buff
alo
C
entr
al G
reat
Pla
ins
25
,134
2,5
07
10
.025
53
0
0
.00
00
00
Burt
W
este
rn C
orn
Bel
t P
lain
s 1
1,5
36
1,2
77
9.0
336
7
0
0.0
000
00
Butl
er
Cen
tral
Gre
at P
lain
s 1
1,4
32
1,5
13
7.5
558
5
0
0.0
000
00
Cas
s W
este
rn C
orn
Bel
t P
lain
s 1
6,3
61
1,4
48
11
.299
03
0
0
.00
00
00
Ced
ar
Wes
tern
Co
rn B
elt
Pla
ins
13
,843
1,9
17
7.2
211
8
0
0.0
000
00
Chase
W
este
rn H
igh P
lain
s 5
,17
6
2,3
15
2.2
358
5
32
13
.822
894
Cher
ry
Neb
rask
a S
and
Hil
ls
8,3
97
15
,439
0.5
438
8
8
0.5
181
68
Cheyenne
Wes
tern
Hig
h P
lain
s 1
2,0
81
3,0
98
3.8
996
1
0
0.0
000
00
Cla
y
Cen
tral
Gre
at P
lain
s 8
,70
0
1,4
84
5.8
625
3
0
0.0
000
00
Co
lfax
W
este
rn C
orn
Bel
t P
lain
s 1
0,0
10
1,0
70
9.3
551
4
0
0.0
000
00
Cu
min
g
Wes
tern
Co
rn B
elt
Pla
ins
12
,994
1,4
81
8.7
738
0
0
0.0
000
00
Cu
ster
C
entr
al G
reat
Pla
ins
19
,170
6,6
72
2.8
732
0
4
0.5
995
20
Dak
ota
W
este
rn C
orn
Bel
t P
lain
s 1
0,4
01
68
4
15
.206
14
0
0
.00
00
00
Daw
es
Wes
tern
Hig
h P
lain
s 9
,70
8
3,6
16
2.6
847
3
1
0.2
765
49
Daw
son
C
entr
al G
reat
Pla
ins
19
,393
2,6
24
7.3
906
3
2
0.7
621
95
Deu
el
Wes
tern
Hig
h P
lain
s 3
,33
0
1,1
40
2.9
210
5
8
7.0
175
44
Dix
on
W
este
rn C
orn
Bel
t P
lain
s 9
,12
9
1,2
33
7.4
038
9
0
0.0
000
00
Do
dge
Wes
tern
Co
rn B
elt
Pla
ins
26
,265
1,3
83
18
.991
32
0
0
.00
00
00
Do
ugla
s W
este
rn C
orn
Bel
t P
lain
s 2
81
,02
0
85
7
32
7.9
11
32
0
0
.00
00
00
Du
nd
y
Wes
tern
Hig
h P
lain
s 4
,35
4
2,3
83
1.8
271
1
9
3.7
767
52
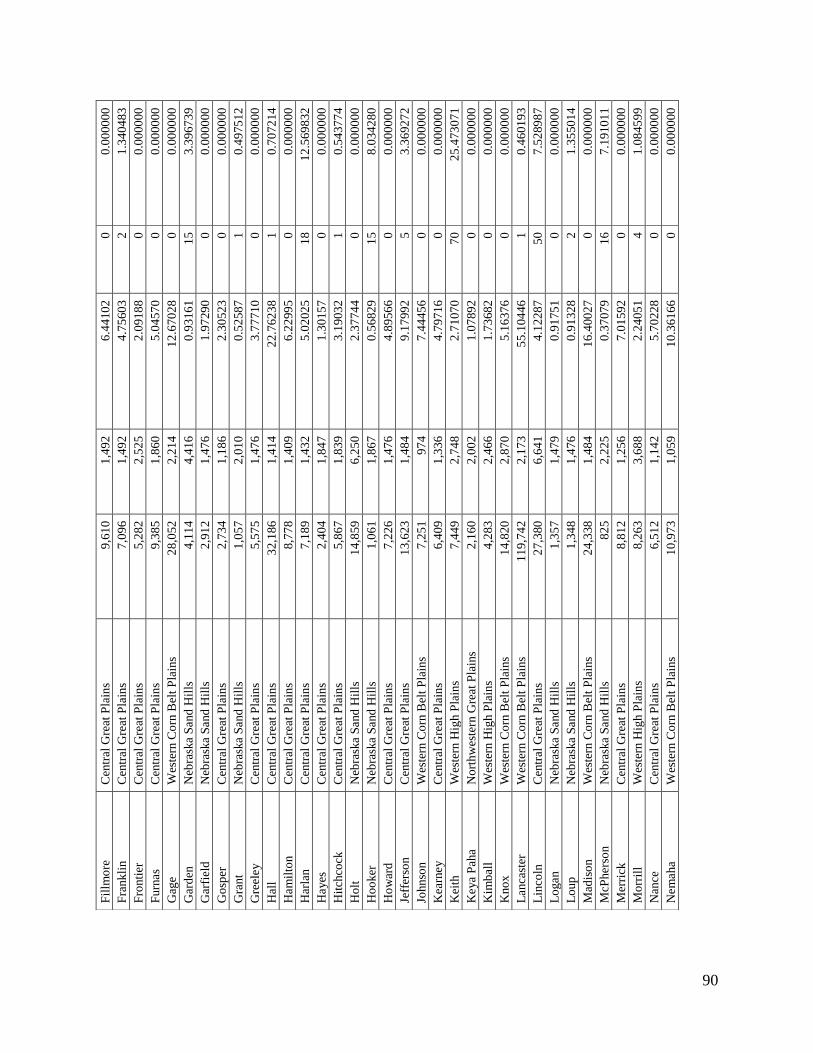
90
Fil
lmo
re
Cen
tral
Gre
at P
lain
s 9
,61
0
1,4
92
6.4
410
2
0
0.0
000
00
Fra
nk
lin
C
entr
al G
reat
Pla
ins
7,0
96
1,4
92
4.7
560
3
2
1.3
404
83
Fro
nti
er
Cen
tral
Gre
at P
lain
s 5
,28
2
2,5
25
2.0
918
8
0
0.0
000
00
Furn
as
Cen
tral
Gre
at P
lain
s 9
,38
5
1,8
60
5.0
457
0
0
0.0
000
00
Gag
e
Wes
tern
Co
rn B
elt
Pla
ins
28
,052
2,2
14
12
.670
28
0
0
.00
00
00
Gar
den
N
ebra
ska
Sand
Hil
ls
4,1
14
4,4
16
0.9
316
1
15
3.3
967
39
Gar
fiel
d
Neb
rask
a S
and
Hil
ls
2,9
12
1,4
76
1.9
729
0
0
0.0
000
00
Go
sper
C
entr
al G
reat
Pla
ins
2,7
34
1,1
86
2.3
052
3
0
0.0
000
00
Gra
nt
Neb
rask
a S
and
Hil
ls
1,0
57
2,0
10
0.5
258
7
1
0.4
975
12
Gre
eley
Cen
tral
Gre
at P
lain
s 5
,57
5
1,4
76
3.7
771
0
0
0.0
000
00
Hal
l C
entr
al G
reat
Pla
ins
32
,186
1,4
14
22
.762
38
1
0
.70
72
14
Ham
ilto
n
Cen
tral
Gre
at P
lain
s 8
,77
8
1,4
09
6.2
299
5
0
0.0
000
00
Har
lan
C
entr
al G
reat
Pla
ins
7,1
89
1,4
32
5.0
202
5
18
12
.569
832
Hayes
C
entr
al G
reat
Pla
ins
2,4
04
1,8
47
1.3
015
7
0
0.0
000
00
Hit
chco
ck
Cen
tral
Gre
at P
lain
s 5
,86
7
1,8
39
3.1
903
2
1
0.5
437
74
Ho
lt
Neb
rask
a S
and
Hil
ls
14
,859
6,2
50
2.3
774
4
0
0.0
000
00
Ho
oker
N
ebra
ska
Sand
Hil
ls
1,0
61
1,8
67
0.5
682
9
15
8.0
342
80
Ho
war
d
Cen
tral
Gre
at P
lain
s 7
,22
6
1,4
76
4.8
956
6
0
0.0
000
00
Jeff
erso
n
Cen
tral
Gre
at P
lain
s 1
3,6
23
1,4
84
9.1
799
2
5
3.3
692
72
Johnso
n
Wes
tern
Co
rn B
elt
Pla
ins
7,2
51
97
4
7.4
445
6
0
0.0
000
00
Kea
rney
Cen
tral
Gre
at P
lain
s 6
,40
9
1,3
36
4.7
971
6
0
0.0
000
00
Kei
th
Wes
tern
Hig
h P
lain
s 7
,44
9
2,7
48
2.7
107
0
70
25
.473
071
Keya
Pah
a
No
rth
wes
tern
Gre
at P
lain
s 2
,16
0
2,0
02
1.0
789
2
0
0.0
000
00
Kim
bal
l W
este
rn H
igh P
lain
s 4
,28
3
2,4
66
1.7
368
2
0
0.0
000
00
Kno
x
Wes
tern
Co
rn B
elt
Pla
ins
14
,820
2,8
70
5.1
637
6
0
0.0
000
00
Lanca
ster
W
este
rn C
orn
Bel
t P
lain
s 1
19
,74
2
2,1
73
55
.104
46
1
0
.46
01
93
Lin
coln
C
entr
al G
reat
Pla
ins
27
,380
6,6
41
4.1
228
7
50
7.5
289
87
Lo
gan
N
ebra
ska
Sand
Hil
ls
1,3
57
1,4
79
0.9
175
1
0
0.0
000
00
Lo
up
N
ebra
ska
Sand
Hil
ls
1,3
48
1,4
76
0.9
132
8
2
1.3
550
14
Mad
iso
n
Wes
tern
Co
rn B
elt
Pla
ins
24
,338
1,4
84
16
.400
27
0
0
.00
00
00
McP
her
son
N
ebra
ska
San
d H
ills
8
25
2,2
25
0.3
707
9
16
7.1
910
11
Mer
rick
C
entr
al G
reat
Pla
ins
8,8
12
1,2
56
7.0
159
2
0
0.0
000
00
Mo
rril
l W
este
rn H
igh P
lain
s 8
,26
3
3,6
88
2.2
405
1
4
1.0
845
99
Nan
ce
Cen
tral
Gre
at P
lain
s 6
,51
2
1,1
42
5.7
022
8
0
0.0
000
00
Nem
aha
Wes
tern
Co
rn B
elt
Pla
ins
10
,973
1,0
59
10
.361
66
0
0
.00
00
00
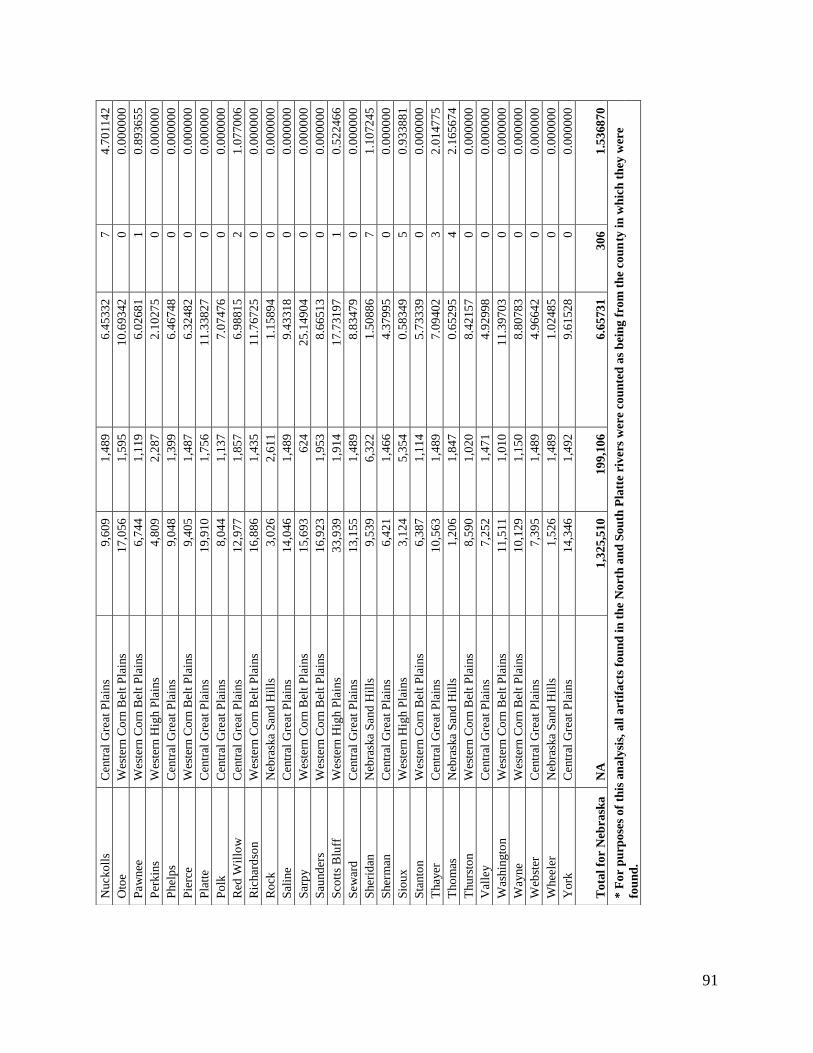
91
Nucko
lls
Cen
tral
Gre
at P
lain
s 9
,60
9
1,4
89
6.4
533
2
7
4.7
011
42
Oto
e W
este
rn C
orn
Bel
t P
lain
s 1
7,0
56
1,5
95
10
.693
42
0
0
.00
00
00
Paw
nee
W
este
rn C
orn
Bel
t P
lain
s 6
,74
4
1,1
19
6.0
268
1
1
0.8
936
55
Per
kin
s W
este
rn H
igh P
lain
s 4
,80
9
2,2
87
2.1
027
5
0
0.0
000
00
Phel
ps
Cen
tral
Gre
at P
lain
s 9
,04
8
1,3
99
6.4
674
8
0
0.0
000
00
Pie
rce
Wes
tern
Co
rn B
elt
Pla
ins
9,4
05
1,4
87
6.3
248
2
0
0.0
000
00
Pla
tte
Cen
tral
Gre
at P
lain
s 1
9,9
10
1,7
56
11
.338
27
0
0
.00
00
00
Po
lk
Cen
tral
Gre
at P
lain
s 8
,04
4
1,1
37
7.0
747
6
0
0.0
000
00
Red
Wil
low
C
entr
al G
reat
Pla
ins
12
,977
1,8
57
6.9
881
5
2
1.0
770
06
Ric
har
dso
n
Wes
tern
Co
rn B
elt
Pla
ins
16
,886
1,4
35
11
.767
25
0
0
.00
00
00
Ro
ck
Neb
rask
a S
and
Hil
ls
3,0
26
2,6
11
1.1
589
4
0
0.0
000
00
Sal
ine
Cen
tral
Gre
at P
lain
s 1
4,0
46
1,4
89
9.4
331
8
0
0.0
000
00
Sar
py
Wes
tern
Co
rn B
elt
Pla
ins
15
,693
62
4
25
.149
04
0
0
.00
00
00
Sau
nd
ers
Wes
tern
Co
rn B
elt
Pla
ins
16
,923
1,9
53
8.6
651
3
0
0.0
000
00
Sco
tts
Blu
ff
Wes
tern
Hig
h P
lain
s 3
3,9
39
1,9
14
17
.731
97
1
0
.52
24
66
Sew
ard
C
entr
al G
reat
Pla
ins
13
,155
1,4
89
8.8
347
9
0
0.0
000
00
Sher
idan
N
ebra
ska
Sand
Hil
ls
9,5
39
6,3
22
1.5
088
6
7
1.1
072
45
Sher
man
C
entr
al G
reat
Pla
ins
6,4
21
1,4
66
4.3
799
5
0
0.0
000
00
Sio
ux
W
este
rn H
igh P
lain
s 3
,12
4
5,3
54
0.5
834
9
5
0.9
338
81
Sta
nto
n
Wes
tern
Co
rn B
elt
Pla
ins
6,3
87
1,1
14
5.7
333
9
0
0.0
000
00
Thay
er
Cen
tral
Gre
at P
lain
s 1
0,5
63
1,4
89
7.0
940
2
3
2.0
147
75
Tho
mas
N
ebra
ska
Sand
Hil
ls
1,2
06
1,8
47
0.6
529
5
4
2.1
656
74
Thurs
ton
W
este
rn C
orn
Bel
t P
lain
s 8
,59
0
1,0
20
8.4
215
7
0
0.0
000
00
Val
ley
Cen
tral
Gre
at P
lain
s 7
,25
2
1,4
71
4.9
299
8
0
0.0
000
00
Was
hin
gto
n
Wes
tern
Co
rn B
elt
Pla
ins
11
,511
1,0
10
11
.397
03
0
0
.00
00
00
Way
ne
Wes
tern
Co
rn B
elt
Pla
ins
10
,129
1,1
50
8.8
078
3
0
0.0
000
00
Web
ster
C
entr
al G
reat
Pla
ins
7,3
95
1,4
89
4.9
664
2
0
0.0
000
00
Whee
ler
Neb
rask
a S
and
Hil
ls
1,5
26
1,4
89
1.0
248
5
0
0.0
000
00
Yo
rk
Cen
tral
Gre
at P
lain
s 1
4,3
46
1,4
92
9.6
152
8
0
0.0
000
00
To
tal
for
Neb
rask
a
NA
1
,32
5,5
10
19
9,1
06
6.6
573
1
30
6
1.5
368
70
* F
or
pu
rpo
ses
of
this
an
aly
sis,
all
art
ifa
cts
fou
nd
in
th
e N
ort
h a
nd
So
uth
Pla
tte
riv
ers
wer
e co
un
ted
as
bei
ng
fro
m t
he
cou
nty
in
wh
ich
th
ey w
ere
fou
nd
.
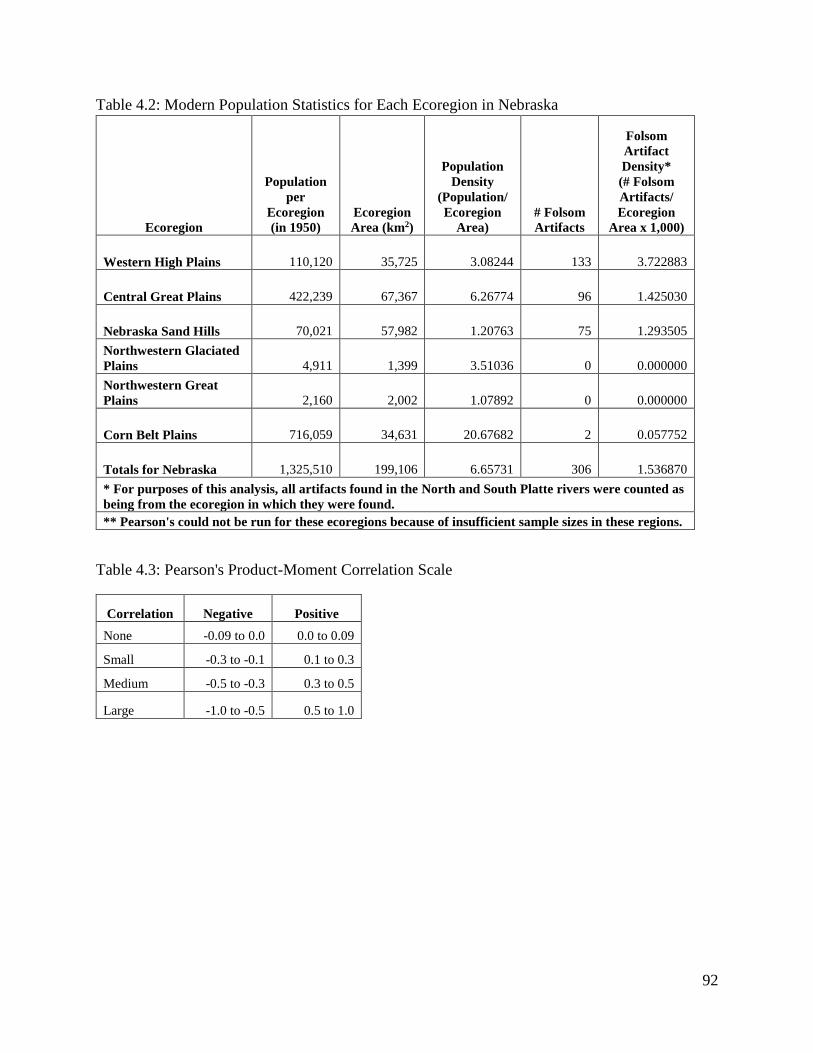
92
Table 4.2: Modern Population Statistics for Each Ecoregion in Nebraska
Table 4.3: Pearson's Product-Moment Correlation Scale
Correlation Negative Positive
None -0.09 to 0.0 0.0 to 0.09
Small -0.3 to -0.1 0.1 to 0.3
Medium -0.5 to -0.3 0.3 to 0.5
Large -1.0 to -0.5 0.5 to 1.0
Ecoregion
Population
per
Ecoregion
(in 1950)
Ecoregion
Area (km2)
Population
Density
(Population/
Ecoregion
Area)
# Folsom
Artifacts
Folsom
Artifact
Density*
(# Folsom
Artifacts/
Ecoregion
Area x 1,000)
Western High Plains 110,120 35,725 3.08244 133 3.722883
Central Great Plains 422,239 67,367 6.26774 96 1.425030
Nebraska Sand Hills 70,021 57,982 1.20763 75 1.293505
Northwestern Glaciated
Plains 4,911 1,399 3.51036 0 0.000000
Northwestern Great
Plains 2,160 2,002 1.07892 0 0.000000
Corn Belt Plains 716,059 34,631 20.67682 2 0.057752
Totals for Nebraska 1,325,510 199,106 6.65731 306 1.536870
* For purposes of this analysis, all artifacts found in the North and South Platte rivers were counted as
being from the ecoregion in which they were found.
** Pearson's could not be run for these ecoregions because of insufficient sample sizes in these regions.
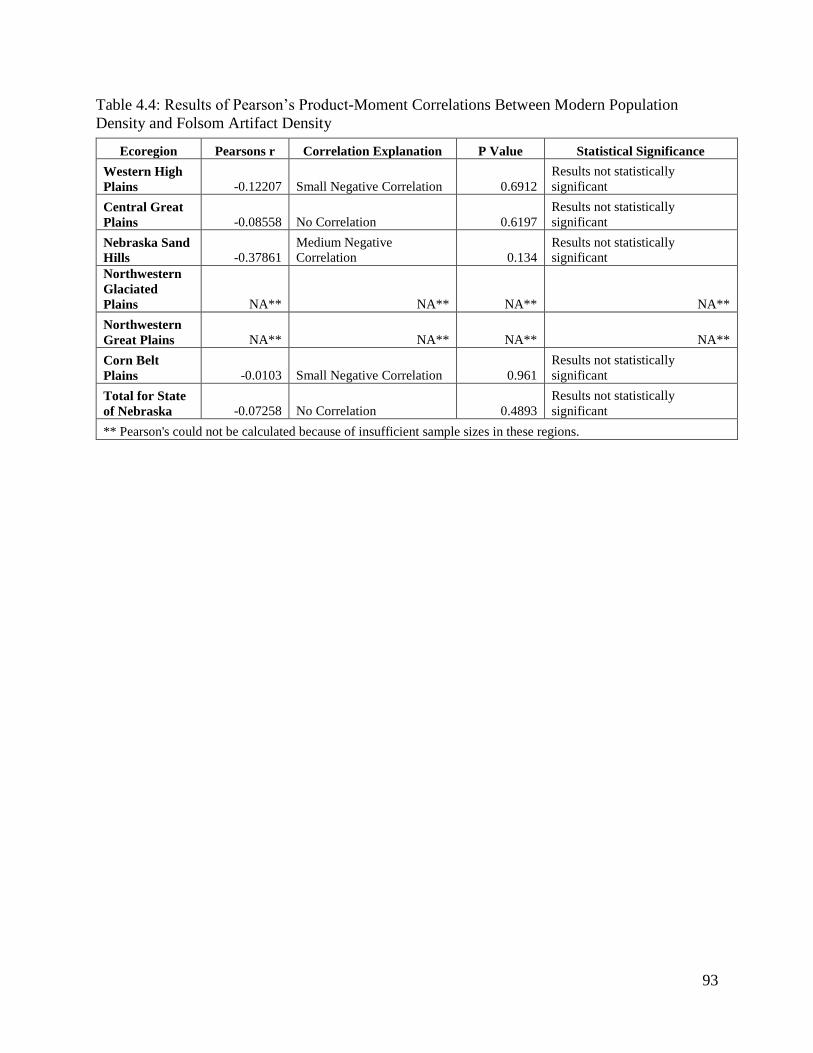
93
Table 4.4: Results of Pearson’s Product-Moment Correlations Between Modern Population
Density and Folsom Artifact Density
Ecoregion Pearsons r Correlation Explanation P Value Statistical Significance
Western High
Plains -0.12207 Small Negative Correlation 0.6912
Results not statistically
significant
Central Great
Plains -0.08558 No Correlation 0.6197
Results not statistically
significant
Nebraska Sand
Hills -0.37861
Medium Negative
Correlation 0.134
Results not statistically
significant
Northwestern
Glaciated
Plains NA** NA** NA** NA**
Northwestern
Great Plains NA** NA** NA** NA**
Corn Belt
Plains -0.0103 Small Negative Correlation 0.961
Results not statistically
significant
Total for State
of Nebraska -0.07258 No Correlation 0.4893
Results not statistically
significant
** Pearson's could not be calculated because of insufficient sample sizes in these regions.
94
Evaluation of Potential Modern Landuse (Cultivation) Sampling Bias
It is generally assumed that land under cultivation increases the surface visibility of the
archaeological record (Lepper 1983:271). According to Prasciunas (2008:37), the greater the
amount of land under cultivation in an area, the greater chances that an artifact will be found on
the surface. Thus, it is important to consider whether cultivation is a factor affecting the visibility
of the archaeological record. For this analysis, Folsom artifacts known to have been found in
stream beds were excluded from calculations.
To address whether land under cultivation had a correlation with the Folsom artifact
density, I extracted the total acreage of cultivated land, for each Nebraska county with Folsom
artifacts, from the U.S. Department of Agriculture 1950 Census of Agriculture. Cultivated
acreage was converted into km2. Then the percent of county area under cultivation was derived
by dividing the land area under cultivation by the total county land area. Raw Folsom artifact
counts were standardized by converting them to densities (dividing the total number of Folsom
artifacts per county by the total county area and multiplying by 1,000) (cf. Prasciunas 2008:37).
The total cultivated land for each county, percent of county area under cultivation, and Folsom
artifact densities per county are presented in Table 4.5.
The land that was in cultivation for all the counties in each ecoregion was added to get
the total cropland area (in km2) for each ecoregion. The percent of cultivated land was calculated
by dividing the total agricultural area (cropland) of each ecoregion and dividing that by the total
ecoregion area and multiplying by 100. The total cropland, percent of cultivated land, and non-
streambed Folsom artifact density for each ecoregion are presented in Table 4.6. Pearson’s
product-moment correlations were calculated for each ecoregion to assess whether the percent of
cultivated land in each region had a correlation with the Folsom artifact density in each region
95
for artifacts found in non-streambed contexts. I considered only Folsom artifacts found in non-
streambed contexts in this analysis, as artifacts that come from active river channels may be
independent of landuse—that is, land under cultivation was not a direct factor for visibility of
these artifacts.
The results of Pearson’s product-moment correlation between the Folsom artifacts from
non-streambed contexts and percent of cultivated land in each ecoregion (along with associated P
values) are presented in Table 4.7. A scale for Pearson’s correlation, which was used to interpret
the results, is shown in Table 4.3. Two of the ecoregions (the Northwestern Glaciated Plains and
Northwestern Great Plains), did not have adequate sample sizes and therefore Pearson’s product-
moment correlation could not be calculated for these regions.
The results of the analysis indicated a small negative correlation between the percent of
cultivated land and Folsom artifact density in two of the ecoregions (the Western High Plains
and Central Great Plains); but, these were not found to be statistically significant. However, for
the Nebraska Sand Hills a large negative correlation was found, and in the Corn Belt Plains a
medium negative correlation was found. Both of these results were statistically significant
(where P ≤ .05). A significant negative correlation between the percent of cultivated land and
Folsom artifact density was found in both these regions. In other words, in the Nebraska Sand
Hills and Corn Belt Plains, land with more cultivation was less likely to yield Folsom artifacts.
One explanation for these results could be that cropland is usually on low terraces where the ages
of the surfaces are too young to have Folsom cultural deposits (Mandel 2008). We would expect
to find Folsom-aged deposits in the T2 and higher terraces.
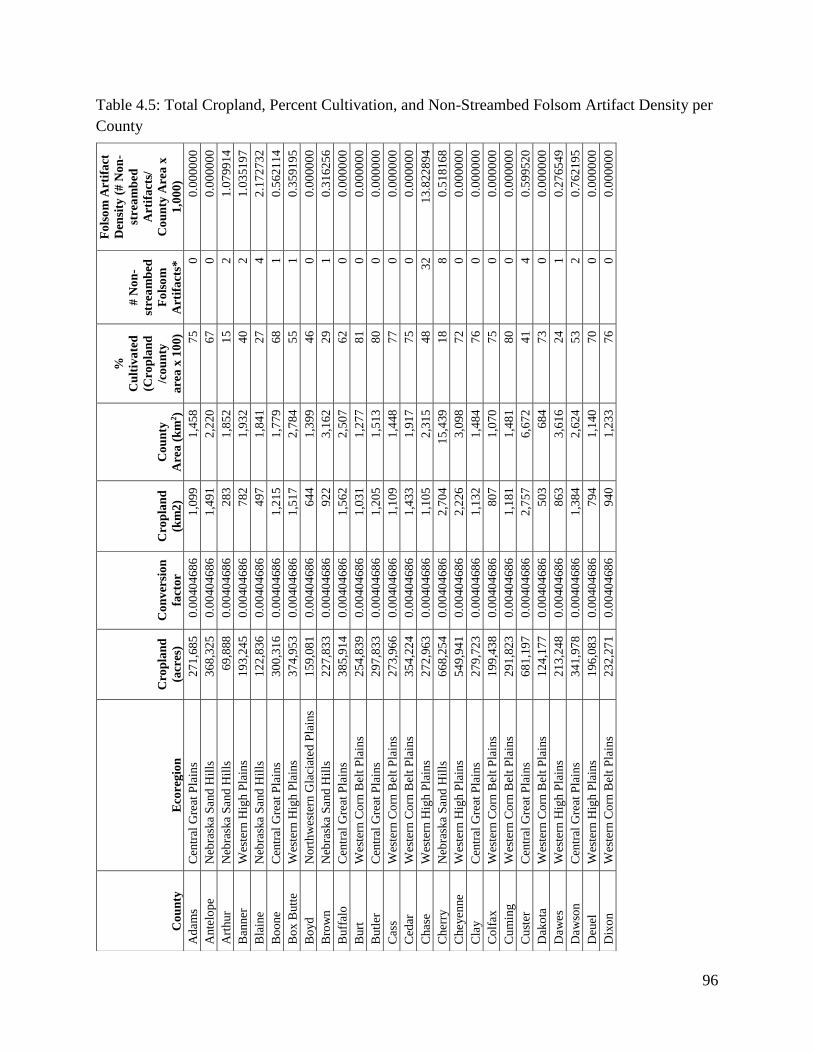
96
Table 4.5: Total Cropland, Percent Cultivation, and Non-Streambed Folsom Artifact Density per
County
Co
un
ty
Eco
reg
ion
Cro
pla
nd
(acr
es)
Co
nv
ersi
on
fact
or
Cro
pla
nd
(km
2)
Co
un
ty
Are
a (
km
2)
%
Cu
ltiv
ate
d
(Cro
pla
nd
/co
un
ty
are
a x
10
0)
# N
on
-
stre
am
bed
Fo
lso
m
Art
ifa
cts*
Fo
lso
m A
rtif
act
Den
sity
(#
No
n-
stre
am
bed
Art
ifa
cts/
Co
un
ty A
rea
x
1,0
00)
Ad
am
s C
entr
al G
reat
Pla
ins
27
1,6
85
0
.00
40
468
6
1,0
99
1,4
58
75
0
0.0
000
00
Ante
lop
e N
ebra
ska
Sand
Hil
ls
36
8,3
25
0
.00
40
468
6
1,4
91
2,2
20
67
0
0.0
000
00
Art
hur
Neb
rask
a S
and
Hil
ls
69
,888
0
.00
40
468
6
28
3
1,8
52
15
2
1.0
799
14
Ban
ner
W
este
rn H
igh P
lain
s 1
93
,24
5
0.0
040
468
6
78
2
1,9
32
40
2
1.0
351
97
Bla
ine
Neb
rask
a S
and
Hil
ls
12
2,8
36
0
.00
40
468
6
49
7
1,8
41
27
4
2.1
727
32
Bo
one
Cen
tral
Gre
at P
lain
s 3
00
,31
6
0.0
040
468
6
1,2
15
1,7
79
68
1
0.5
621
14
Bo
x B
utt
e W
este
rn H
igh P
lain
s 3
74
,95
3
0.0
040
468
6
1,5
17
2,7
84
55
1
0.3
591
95
Bo
yd
N
ort
hw
este
rn G
laci
ated
Pla
ins
15
9,0
81
0
.00
40
468
6
64
4
1,3
99
46
0
0.0
000
00
Bro
wn
N
ebra
ska
Sand
Hil
ls
22
7,8
33
0
.00
40
468
6
92
2
3,1
62
29
1
0.3
162
56
Buff
alo
C
entr
al G
reat
Pla
ins
38
5,9
14
0
.00
40
468
6
1,5
62
2,5
07
62
0
0.0
000
00
Burt
W
este
rn C
orn
Bel
t P
lain
s 2
54
,83
9
0.0
040
468
6
1,0
31
1,2
77
81
0
0.0
000
00
Butl
er
Cen
tral
Gre
at P
lain
s 2
97
,83
3
0.0
040
468
6
1,2
05
1,5
13
80
0
0.0
000
00
Cas
s W
este
rn C
orn
Bel
t P
lain
s 2
73
,96
6
0.0
040
468
6
1,1
09
1,4
48
77
0
0.0
000
00
Ced
ar
Wes
tern
Co
rn B
elt
Pla
ins
35
4,2
24
0
.00
40
468
6
1,4
33
1,9
17
75
0
0.0
000
00
Chase
W
este
rn H
igh P
lain
s 2
72
,96
3
0.0
040
468
6
1,1
05
2,3
15
48
32
13
.822
894
Cher
ry
Neb
rask
a S
and
Hil
ls
66
8,2
54
0
.00
40
468
6
2,7
04
15
,439
18
8
0.5
181
68
Cheyenne
Wes
tern
Hig
h P
lain
s 5
49
,94
1
0.0
040
468
6
2,2
26
3,0
98
72
0
0.0
000
00
Cla
y
Cen
tral
Gre
at P
lain
s 2
79
,72
3
0.0
040
468
6
1,1
32
1,4
84
76
0
0.0
000
00
Co
lfax
W
este
rn C
orn
Bel
t P
lain
s 1
99
,43
8
0.0
040
468
6
80
7
1,0
70
75
0
0.0
000
00
Cu
min
g
Wes
tern
Co
rn B
elt
Pla
ins
29
1,8
23
0
.00
40
468
6
1,1
81
1,4
81
80
0
0.0
000
00
Cu
ster
C
entr
al G
reat
Pla
ins
68
1,1
97
0
.00
40
468
6
2,7
57
6,6
72
41
4
0.5
995
20
Dak
ota
W
este
rn C
orn
Bel
t P
lain
s 1
24
,17
7
0.0
040
468
6
50
3
68
4
73
0
0.0
000
00
Daw
es
Wes
tern
Hig
h P
lain
s 2
13
,24
8
0.0
040
468
6
86
3
3,6
16
24
1
0.2
765
49
Daw
son
C
entr
al G
reat
Pla
ins
34
1,9
78
0
.00
40
468
6
1,3
84
2,6
24
53
2
0.7
621
95
Deu
el
Wes
tern
Hig
h P
lain
s 1
96
,08
3
0.0
040
468
6
79
4
1,1
40
70
0
0.0
000
00
Dix
on
W
este
rn C
orn
Bel
t P
lain
s 2
32
,27
1
0.0
040
468
6
94
0
1,2
33
76
0
0.0
000
00
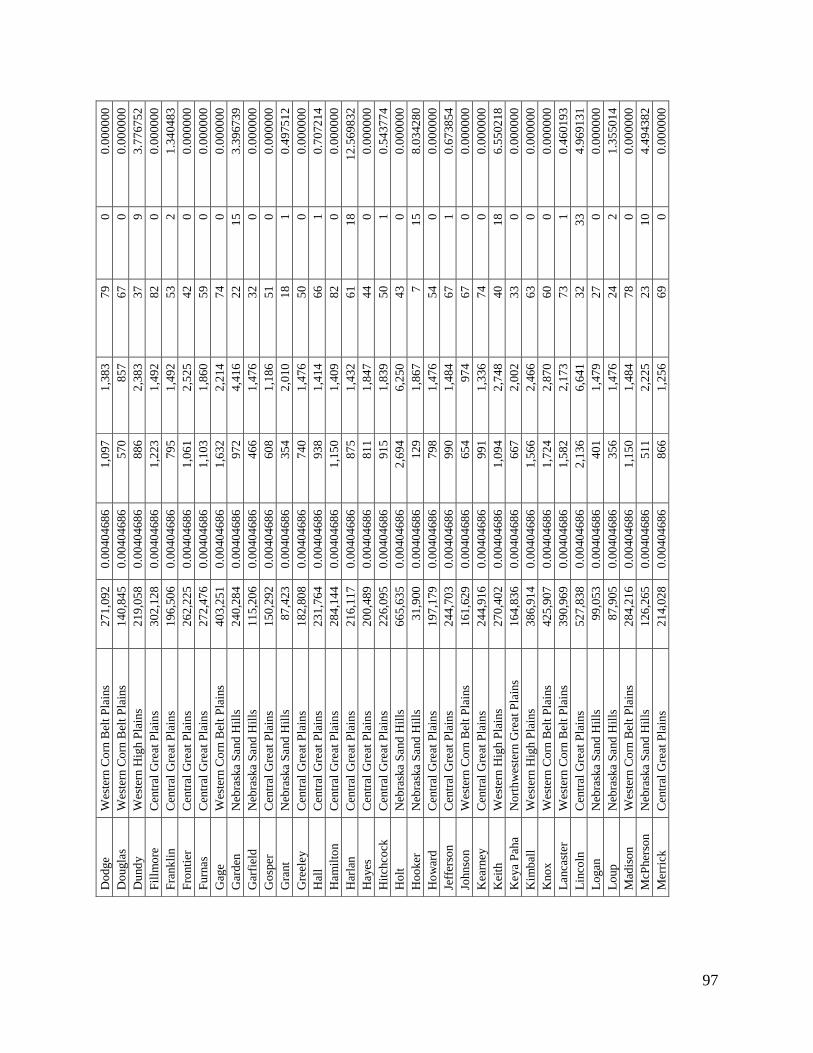
97
Do
dge
Wes
tern
Co
rn B
elt
Pla
ins
27
1,0
92
0
.00
40
468
6
1,0
97
1,3
83
79
0
0.0
000
00
Do
ugla
s W
este
rn C
orn
Bel
t P
lain
s 1
40
,84
5
0.0
040
468
6
57
0
85
7
67
0
0.0
000
00
Du
nd
y
Wes
tern
Hig
h P
lain
s 2
19
,05
8
0.0
040
468
6
88
6
2,3
83
37
9
3.7
767
52
Fil
lmo
re
Cen
tral
Gre
at P
lain
s 3
02
,12
8
0.0
040
468
6
1,2
23
1,4
92
82
0
0.0
000
00
Fra
nk
lin
C
entr
al G
reat
Pla
ins
19
6,5
06
0
.00
40
468
6
79
5
1,4
92
53
2
1.3
404
83
Fro
nti
er
Cen
tral
Gre
at P
lain
s 2
62
,22
5
0.0
040
468
6
1,0
61
2,5
25
42
0
0.0
000
00
Furn
as
Cen
tral
Gre
at P
lain
s 2
72
,47
6
0.0
040
468
6
1,1
03
1,8
60
59
0
0.0
000
00
Gag
e
Wes
tern
Co
rn B
elt
Pla
ins
40
3,2
51
0
.00
40
468
6
1,6
32
2,2
14
74
0
0.0
000
00
Gar
den
N
ebra
ska
Sand
Hil
ls
24
0,2
84
0
.00
40
468
6
97
2
4,4
16
22
15
3.3
967
39
Gar
fiel
d
Neb
rask
a S
and
Hil
ls
11
5,2
06
0
.00
40
468
6
46
6
1,4
76
32
0
0.0
000
00
Go
sper
C
entr
al G
reat
Pla
ins
15
0,2
92
0
.00
40
468
6
60
8
1,1
86
51
0
0.0
000
00
Gra
nt
Neb
rask
a S
and
Hil
ls
87
,423
0
.00
40
468
6
35
4
2,0
10
18
1
0.4
975
12
Gre
eley
Cen
tral
Gre
at P
lain
s 1
82
,80
8
0.0
040
468
6
74
0
1,4
76
50
0
0.0
000
00
Hal
l C
entr
al G
reat
Pla
ins
23
1,7
64
0
.00
40
468
6
93
8
1,4
14
66
1
0.7
072
14
Ham
ilto
n
Cen
tral
Gre
at P
lain
s 2
84
,14
4
0.0
040
468
6
1,1
50
1,4
09
82
0
0.0
000
00
Har
lan
C
entr
al G
reat
Pla
ins
21
6,1
17
0
.00
40
468
6
87
5
1,4
32
61
18
12
.569
832
Hayes
C
entr
al G
reat
Pla
ins
20
0,4
89
0
.00
40
468
6
81
1
1,8
47
44
0
0.0
000
00
Hit
chco
ck
Cen
tral
Gre
at P
lain
s 2
26
,09
5
0.0
040
468
6
91
5
1,8
39
50
1
0.5
437
74
Ho
lt
Neb
rask
a S
and
Hil
ls
66
5,6
35
0
.00
40
468
6
2,6
94
6,2
50
43
0
0.0
000
00
Ho
oker
N
ebra
ska
Sand
Hil
ls
31
,900
0
.00
40
468
6
12
9
1,8
67
7
15
8.0
342
80
Ho
war
d
Cen
tral
Gre
at P
lain
s 1
97
,17
9
0.0
040
468
6
79
8
1,4
76
54
0
0.0
000
00
Jeff
erso
n
Cen
tral
Gre
at P
lain
s 2
44
,70
3
0.0
040
468
6
99
0
1,4
84
67
1
0.6
738
54
Johnso
n
Wes
tern
Co
rn B
elt
Pla
ins
16
1,6
29
0
.00
40
468
6
65
4
97
4
67
0
0.0
000
00
Kea
rney
Cen
tral
Gre
at P
lain
s 2
44
,91
6
0.0
040
468
6
99
1
1,3
36
74
0
0.0
000
00
Kei
th
Wes
tern
Hig
h P
lain
s 2
70
,40
2
0.0
040
468
6
1,0
94
2,7
48
40
18
6.5
502
18
Keya
Pah
a
No
rth
wes
tern
Gre
at P
lain
s 1
64
,83
6
0.0
040
468
6
66
7
2,0
02
33
0
0.0
000
00
Kim
bal
l W
este
rn H
igh P
lain
s 3
86
,91
4
0.0
040
468
6
1,5
66
2,4
66
63
0
0.0
000
00
Kno
x
Wes
tern
Co
rn B
elt
Pla
ins
42
5,9
07
0
.00
40
468
6
1,7
24
2,8
70
60
0
0.0
000
00
Lanca
ster
W
este
rn C
orn
Bel
t P
lain
s 3
90
,96
9
0.0
040
468
6
1,5
82
2,1
73
73
1
0.4
601
93
Lin
coln
C
entr
al G
reat
Pla
ins
52
7,8
38
0
.00
40
468
6
2,1
36
6,6
41
32
33
4.9
691
31
Lo
gan
N
ebra
ska
Sand
Hil
ls
99
,053
0
.00
40
468
6
40
1
1,4
79
27
0
0.0
000
00
Lo
up
N
ebra
ska
Sand
Hil
ls
87
,905
0
.00
40
468
6
35
6
1,4
76
24
2
1.3
550
14
Mad
iso
n
Wes
tern
Co
rn B
elt
Pla
ins
28
4,2
16
0
.00
40
468
6
1,1
50
1,4
84
78
0
0.0
000
00
McP
her
son
N
ebra
ska
Sand
Hil
ls
12
6,2
65
0
.00
40
468
6
51
1
2,2
25
23
10
4.4
943
82
Mer
rick
C
entr
al G
reat
Pla
ins
21
4,0
28
0
.00
40
468
6
86
6
1,2
56
69
0
0.0
000
00
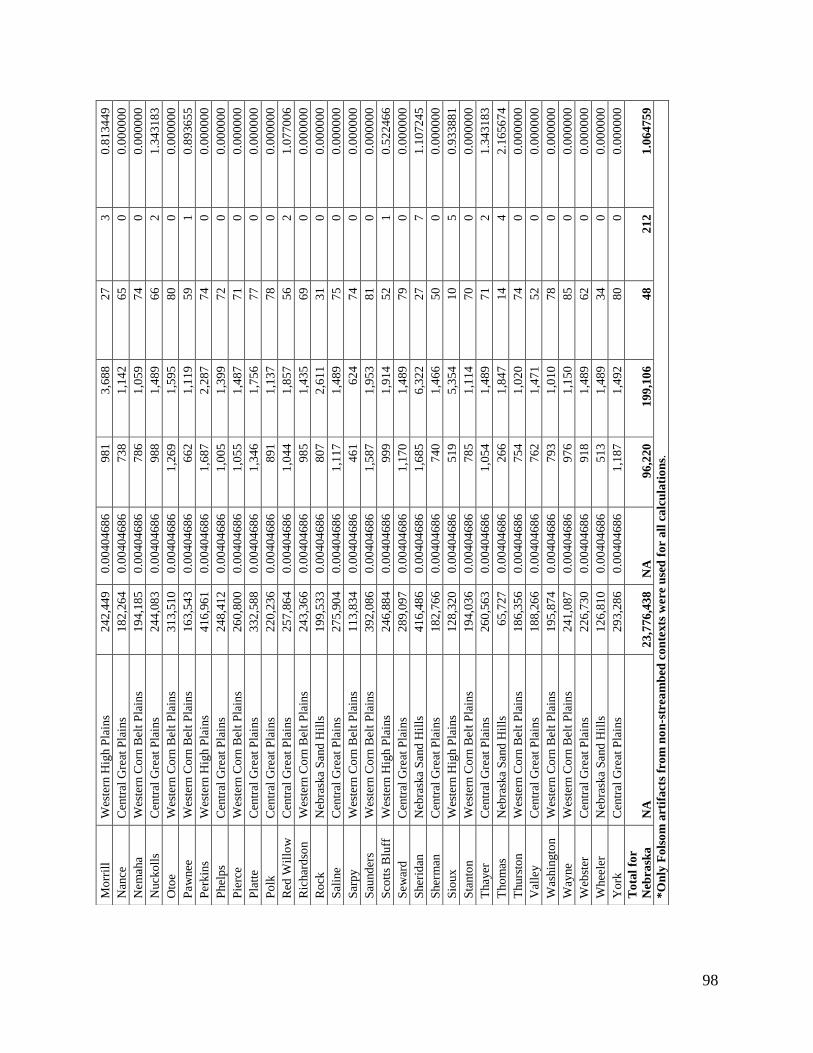
98
Mo
rril
l W
este
rn H
igh P
lain
s 2
42
,44
9
0.0
040
468
6
98
1
3,6
88
27
3
0.8
134
49
Nan
ce
Cen
tral
Gre
at P
lain
s 1
82
,26
4
0.0
040
468
6
73
8
1,1
42
65
0
0.0
000
00
Nem
aha
Wes
tern
Co
rn B
elt
Pla
ins
19
4,1
85
0
.00
40
468
6
78
6
1,0
59
74
0
0.0
000
00
Nucko
lls
Cen
tral
Gre
at P
lain
s 2
44
,08
3
0.0
040
468
6
98
8
1,4
89
66
2
1.3
431
83
Oto
e W
este
rn C
orn
Bel
t P
lain
s 3
13
,51
0
0.0
040
468
6
1,2
69
1,5
95
80
0
0.0
000
00
Paw
nee
W
este
rn C
orn
Bel
t P
lain
s 1
63
,54
3
0.0
040
468
6
66
2
1,1
19
59
1
0.8
936
55
Per
kin
s W
este
rn H
igh P
lain
s 4
16
,96
1
0.0
040
468
6
1,6
87
2,2
87
74
0
0.0
000
00
Phel
ps
Cen
tral
Gre
at P
lain
s 2
48
,41
2
0.0
040
468
6
1,0
05
1,3
99
72
0
0.0
000
00
Pie
rce
Wes
tern
Co
rn B
elt
Pla
ins
26
0,8
00
0
.00
40
468
6
1,0
55
1,4
87
71
0
0.0
000
00
Pla
tte
Cen
tral
Gre
at P
lain
s 3
32
,58
8
0.0
040
468
6
1,3
46
1,7
56
77
0
0.0
000
00
Po
lk
Cen
tral
Gre
at P
lain
s 2
20
,23
6
0.0
040
468
6
89
1
1,1
37
78
0
0.0
000
00
Red
Wil
low
C
entr
al G
reat
Pla
ins
25
7,8
64
0
.00
40
468
6
1,0
44
1,8
57
56
2
1.0
770
06
Ric
har
dso
n
Wes
tern
Co
rn B
elt
Pla
ins
24
3,3
66
0
.00
40
468
6
98
5
1,4
35
69
0
0.0
000
00
Ro
ck
Neb
rask
a S
and
Hil
ls
19
9,5
33
0
.00
40
468
6
80
7
2,6
11
31
0
0.0
000
00
Sal
ine
Cen
tral
Gre
at P
lain
s 2
75
,90
4
0.0
040
468
6
1,1
17
1,4
89
75
0
0.0
000
00
Sar
py
Wes
tern
Co
rn B
elt
Pla
ins
11
3,8
34
0.0
040
468
6
46
1
62
4
74
0
0.0
000
00
Sau
nd
ers
Wes
tern
Co
rn B
elt
Pla
ins
39
2,0
86
0
.00
40
468
6
1,5
87
1,9
53
81
0
0.0
000
00
Sco
tts
Blu
ff
Wes
tern
Hig
h P
lain
s 2
46
,88
4
0.0
040
468
6
99
9
1,9
14
52
1
0.5
224
66
Sew
ard
C
entr
al G
reat
Pla
ins
28
9,0
97
0
.00
40
468
6
1,1
70
1,4
89
79
0
0.0
000
00
Sher
idan
N
ebra
ska
Sand
Hil
ls
41
6,4
86
0
.00
40
468
6
1,6
85
6,3
22
27
7
1.1
072
45
Sher
man
C
entr
al G
reat
Pla
ins
18
2,7
66
0
.00
40
468
6
74
0
1,4
66
50
0
0.0
000
00
Sio
ux
W
este
rn H
igh P
lain
s 1
28
,32
0
0.0
040
468
6
51
9
5,3
54
10
5
0.9
338
81
Sta
nto
n
Wes
tern
Co
rn B
elt
Pla
ins
19
4,0
36
0
.00
40
468
6
78
5
1,1
14
70
0
0.0
000
00
Thay
er
Cen
tral
Gre
at P
lain
s 2
60
,56
3
0.0
040
468
6
1,0
54
1,4
89
71
2
1.3
431
83
Tho
mas
N
ebra
ska
Sand
Hil
ls
65
,727
0
.00
40
468
6
26
6
1,8
47
14
4
2.1
656
74
Thurs
ton
W
este
rn C
orn
Bel
t P
lain
s 1
86
,35
6
0.0
040
468
6
75
4
1,0
20
74
0
0.0
000
00
Val
ley
Cen
tral
Gre
at P
lain
s 1
88
,26
6
0.0
040
468
6
76
2
1,4
71
52
0
0.0
000
00
Was
hin
gto
n
Wes
tern
Co
rn B
elt
Pla
ins
19
5,8
74
0
.00
40
468
6
79
3
1,0
10
78
0
0.0
000
00
Way
ne
Wes
tern
Co
rn B
elt
Pla
ins
24
1,0
87
0
.00
40
468
6
97
6
1,1
50
85
0
0.0
000
00
Web
ster
C
entr
al G
reat
Pla
ins
22
6,7
30
0
.00
40
468
6
91
8
1,4
89
62
0
0.0
000
00
Whee
ler
Neb
rask
a S
and
Hil
ls
12
6,8
10
0
.00
40
468
6
51
3
1,4
89
34
0
0.0
000
00
Yo
rk
Cen
tral
Gre
at P
lain
s 2
93
,28
6
0.0
040
468
6
1,1
87
1,4
92
80
0
0.0
000
00
To
tal
for
Neb
rask
a
NA
2
3,7
76
,43
8
NA
9
6,2
20
19
9,1
06
48
21
2
1.0
647
59
*O
nly
Fo
lso
m a
rtif
act
s fr
om
no
n-s
trea
mb
ed c
on
texts
wer
e u
sed
fo
r a
ll c
alc
ula
tio
ns.
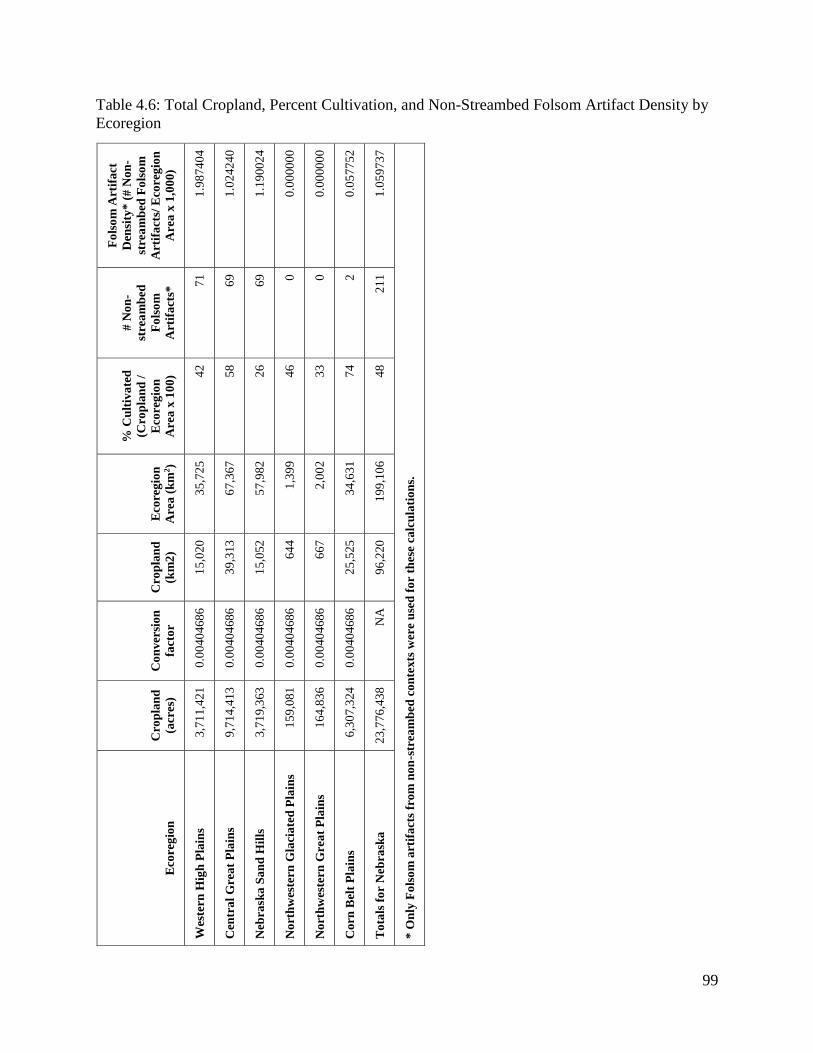
99
Table 4.6: Total Cropland, Percent Cultivation, and Non-Streambed Folsom Artifact Density by
Ecoregion
Eco
reg
ion
Cro
pla
nd
(acr
es)
Co
nv
ersi
on
fact
or
Cro
pla
nd
(km
2)
Eco
reg
ion
Are
a (
km
2)
% C
ult
iva
ted
(Cro
pla
nd
/
Eco
reg
ion
Are
a x
10
0)
# N
on
-
stre
am
bed
Fo
lso
m
Art
ifa
cts*
Fo
lso
m A
rtif
act
Den
sity
* (
# N
on
-
stre
am
bed
Fo
lso
m
Art
ifa
cts/
Eco
reg
ion
Are
a x
1,0
00)
Wes
tern
Hig
h P
lain
s 3
,71
1,4
21
0
.00
40
468
6
15
,020
35
,725
42
71
1.9
874
04
Cen
tra
l G
rea
t P
lain
s 9
,71
4,4
13
0
.00
40
468
6
39
,313
67
,367
58
69
1.0
242
40
Neb
rask
a S
an
d H
ills
3
,71
9,3
63
0
.00
40
468
6
15
,052
57
,982
26
69
1.1
900
24
No
rth
wes
tern
Gla
cia
ted
Pla
ins
15
9,0
81
0.0
040
468
6
64
4
1,3
99
46
0
0.0
000
00
No
rth
wes
tern
Gre
at
Pla
ins
16
4,8
36
0.0
040
468
6
66
7
2,0
02
33
0
0.0
000
00
Co
rn B
elt
Pla
ins
6,3
07,3
24
0
.00
40
468
6
25
,525
34
,631
74
2
0.0
577
52
To
tals
fo
r N
ebra
ska
2
3,7
76
,43
8
NA
9
6,2
20
19
9,1
06
48
21
1
1.0
597
37
* O
nly
Fo
lso
m a
rtif
act
s fr
om
no
n-s
trea
mb
ed c
on
texts
wer
e u
sed
fo
r th
ese
calc
ula
tio
ns.
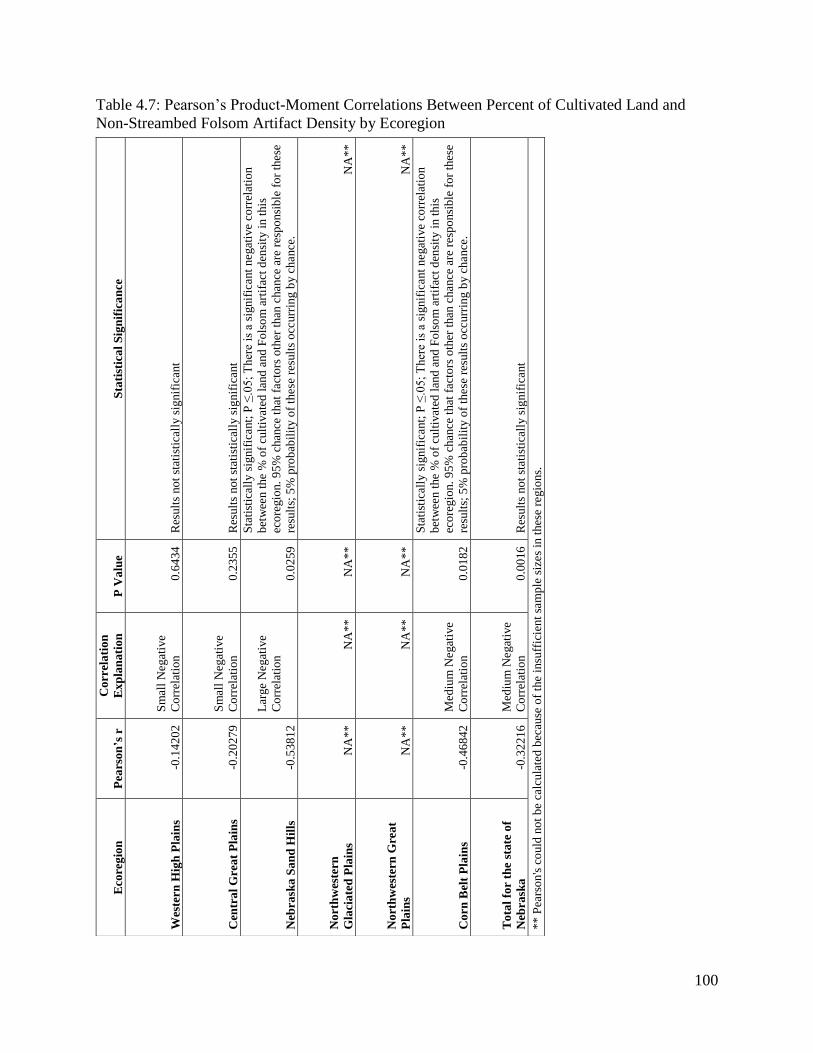
100
Table 4.7: Pearson’s Product-Moment Correlations Between Percent of Cultivated Land and
Non-Streambed Folsom Artifact Density by Ecoregion
Eco
reg
ion
P
ears
on’s
r
Co
rrel
ati
on
Ex
pla
na
tio
n
P V
alu
e
Sta
tist
ica
l S
ign
ific
an
ce
Wes
tern
Hig
h P
lain
s -0
.14
20
2
Sm
all
Negat
ive
Co
rrel
atio
n
0.6
434
Res
ult
s no
t st
atis
tica
lly s
ignif
ican
t
Cen
tra
l G
rea
t P
lain
s -0
.20
27
9
Sm
all
Negat
ive
Co
rrel
atio
n
0.2
355
Res
ult
s no
t st
atis
tica
lly s
ignif
ican
t
Neb
rask
a S
an
d H
ills
-0
.53
81
2
Lar
ge
Negat
ive
Co
rrel
atio
n
0.0
259
Sta
tist
ical
ly s
ignif
icant;
P ≤
.05
; T
her
e is
a s
ignif
icant
negat
ive
corr
elat
ion
bet
wee
n t
he
% o
f cu
ltiv
ate
d l
and
and
Fo
lso
m a
rtif
act
den
sity
in t
his
eco
regio
n.
95
% c
han
ce t
hat
fact
ors
oth
er t
han
chance
are
res
po
nsi
ble
fo
r th
ese
resu
lts;
5%
pro
bab
ilit
y o
f th
ese
res
ult
s o
ccurr
ing b
y c
hance
.
No
rth
wes
tern
Gla
cia
ted
Pla
ins
NA
**
N
A*
*
NA
**
N
A*
*
No
rth
wes
tern
Gre
at
Pla
ins
NA
**
N
A*
*
NA
**
N
A*
*
Co
rn B
elt
Pla
ins
-0.4
68
42
Med
ium
Negat
ive
Co
rrel
atio
n
0.0
182
Sta
tist
ical
ly s
ignif
icant;
P ≤
.05
; T
her
e is
a s
ignif
icant
negat
ive
corr
elat
ion
bet
wee
n t
he
% o
f cu
ltiv
ate
d l
and
and
Fo
lso
m a
rtif
act
den
sity
in t
his
eco
regio
n.
95
% c
han
ce t
hat
fact
ors
oth
er t
han
chance
are
res
po
nsi
ble
fo
r th
ese
resu
lts;
5%
pro
bab
ilit
y o
f th
ese
res
ult
s o
ccurr
ing b
y c
hance
.
To
tal
for
the s
tate
of
Neb
rask
a
-0.3
22
16
Med
ium
Negat
ive
Co
rrel
atio
n
0.0
016
Res
ult
s no
t st
atis
tica
lly s
ignif
ican
t
** P
ears
on
's c
ould
no
t b
e ca
lcula
ted
bec
ause
of
the
insu
ffic
ient
sam
ple
siz
es
in t
hes
e re
gio
ns.
101
Evaluation of the Potential Bias of Archaeological Research Intensity
Archaeological research intensity is often considered a potential bias in artifact
distribution studies because it is assumed that the greater the archaeological research conducted
in an area, the higher likelihood that artifacts and sites will be recorded in the area. This potential
bias was assessed by examining the total number of archaeological sites (excavated and surface
sites) from all time periods reported per county. Then all the archaeological sites were added for
all the counties in each ecoregion to get the total number of archaeological sites per ecoregion. I
obtained the total number of archaeological sites from all time periods in each county from the
Nebraska State Historical Society (personal communication, Trisha Nelson, January 15, 2014).
The Nebraska State Historical Society distinguishes a site “by placing a spatial limit on the
defined or observable material remains of former human behavior that created the remains. What
constitutes adequate spatial segregation between artifactual material in order to designate a site
or multiple sites is not specifically defined here beyond the exercise of common sense” (pp. 22,
Nebraska State Historic Preservation Office, Section 106 Guidelines, May 22, 2006). The
Nebraska State Historical Society treats isolated archaeological finds the same as scatters and
features—in that all get a site number (personal communication Trisha Nelson, March 3, 2015).
However, “prehistoric isolated finds (i.e., single artifacts), which are clearly in a secondary
induced context (e.g., stream-eroded, artificially moved, etc.) will not be given site status…All
other isolated finds which are or may be due to primary or secondary human (direct or indirect)
action will be accounted for by assigning them a site number” (pp. 22, Nebraska State Historic
Preservation Office, Section 106 Guidelines, May 22, 2006). The archaeological sites recorded
by the Nebraska State Historical Society include sites turned in by avocational archaeologists,
professional archaeological surveys, and incidental documentation. It is assumed that the number
102
of overall sites corresponds to the intensity of professional archaeological involvement by people
who would recognize diagnostic Folsom artifacts. All things being equal, intensity of site
reporting is used here as an approximation of intensity of archaeological documentation.
Archaeological research intensity was determined by taking the total number of recorded
sites per ecoregion divided by the total ecoregion area. To standardize calculations and control
for county and ecoregion sizes Folsom artifact densities were calculated by dividing the number
of Folsom artifacts per county and ecoregion by the total area of the county and ecoregion,
respectively. Because these densities were small, they were multiplied by 1,000 to get the
Folsom artifact occurrence per 1,000 km2 in each county and ecoregion (cf., Prasciunas
2008:37). The total number of recorded archaeological sites, archaeological research intensity,
and Folsom artifact density per county and ecoregion are presented in Tables 4.8 and 4.9,
respectively. It is important to note that artifacts found in the North and South Platte were
included in this analysis and assigned to an ecoregion based on the county in which they were
found.
Pearson’s product-moment correlations were calculated to determine the relationship
between archaeological research intensity and Folsom artifact density for each ecoregion. The
goal was to assess sampling bias based on modern archaeological activity. The results of the
correlations are presented in Table 4.10 (and as for the two previous analyses, a scale used for
interpreting Pearson’s product-moment correlations can be seen in Table 4.3). For two of the
ecoregions (the Northwestern Glaciated Plains and Northwestern Great Plains) Pearson’s
correlations could not be calculated because of the insufficient sample sizes in these regions.
There was a small positive correlation in the Central Great Plains, and no correlations in all three
of the remaining regions of the Western High Plains, Nebraska Sand Hills, and Corn Belt Plains.
103
For all ecoregions, the results were not statistically significant (where P ≤ .05). For all regions,
no significant correlation exists between archaeological research intensity and Folsom artifact
density. Archaeological research intensity does not appear to be a potential sampling bias in this
study. It should be noted that many of the Folsom artifacts reported here are not from recorded
sites, but instead are isolates, or streambed finds. This is not believed to be a key factor in the
results presented here.
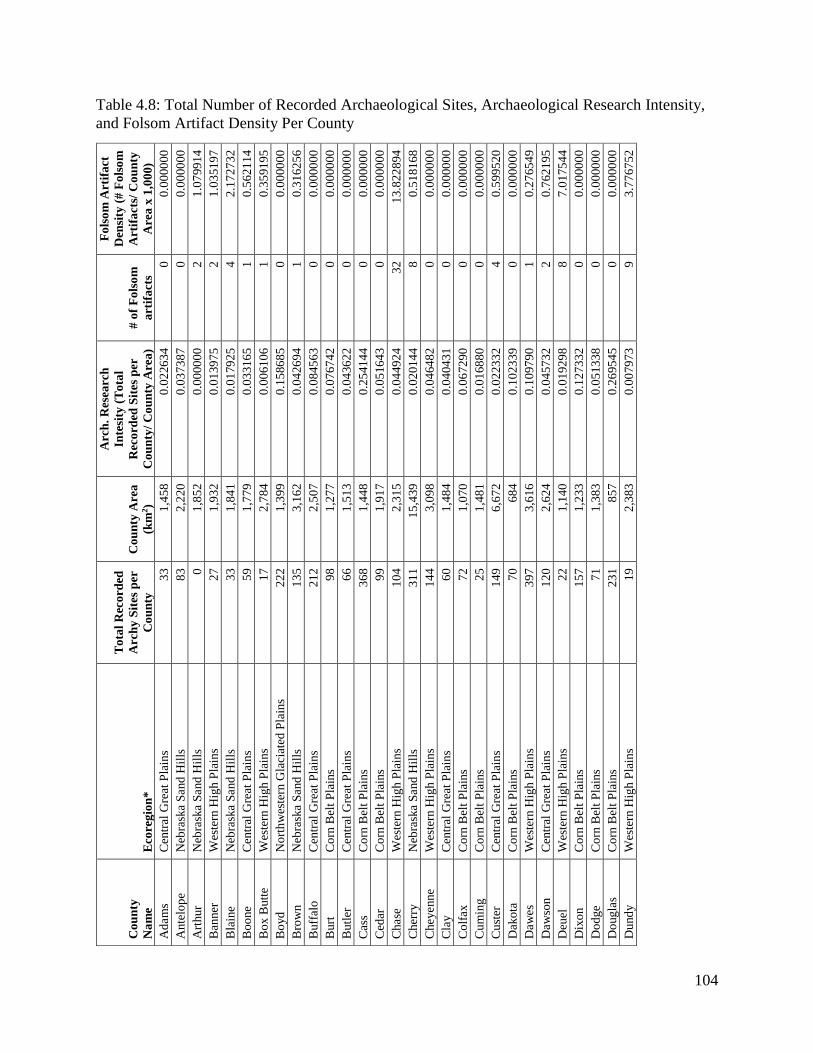
104
Table 4.8: Total Number of Recorded Archaeological Sites, Archaeological Research Intensity,
and Folsom Artifact Density Per County
Co
un
ty
Na
me
Eco
reg
ion
*
To
tal
Rec
ord
ed
Arc
hy
Sit
es
per
Co
un
ty
Co
un
ty A
rea
(km
2)
Arc
h.
Res
earc
h
Inte
sity
(T
ota
l
Rec
ord
ed S
ites
per
Co
un
ty/
Co
un
ty A
rea
)
# o
f F
ols
om
art
ifa
cts
Fo
lso
m A
rtif
act
Den
sity
(#
Fo
lso
m
Art
ifa
cts/
Co
un
ty
Are
a x
1,0
00)
Ad
am
s C
entr
al G
reat
Pla
ins
33
1,4
58
0.0
226
34
0
0
.00
00
00
Ante
lop
e N
ebra
ska
Sand
Hil
ls
83
2,2
20
0.0
373
87
0
0
.00
00
00
Art
hur
Neb
rask
a S
and
Hil
ls
0
1,8
52
0.0
000
00
2
1
.07
99
14
Ban
ner
W
este
rn H
igh P
lain
s 2
7
1,9
32
0.0
139
75
2
1
.03
51
97
Bla
ine
Neb
rask
a S
and
Hil
ls
33
1,8
41
0.0
179
25
4
2
.17
27
32
Bo
one
Cen
tral
Gre
at P
lain
s 5
9
1,7
79
0.0
331
65
1
0
.56
21
14
Bo
x B
utt
e W
este
rn H
igh P
lain
s 1
7
2,7
84
0.0
061
06
1
0
.35
91
95
Bo
yd
N
ort
hw
este
rn G
laci
ated
Pla
ins
22
2
1,3
99
0.1
586
85
0
0
.00
00
00
Bro
wn
N
ebra
ska
Sand
Hil
ls
13
5
3,1
62
0.0
426
94
1
0
.31
62
56
Buff
alo
C
entr
al G
reat
Pla
ins
21
2
2,5
07
0.0
845
63
0
0
.00
00
00
Burt
C
orn
Bel
t P
lain
s 9
8
1,2
77
0.0
767
42
0
0
.00
00
00
Butl
er
Cen
tral
Gre
at P
lain
s 6
6
1,5
13
0.0
436
22
0
0
.00
00
00
Cas
s C
orn
Bel
t P
lain
s 3
68
1,4
48
0.2
541
44
0
0
.00
00
00
Ced
ar
Co
rn B
elt
Pla
ins
99
1,9
17
0.0
516
43
0
0
.00
00
00
Chase
W
este
rn H
igh P
lain
s 1
04
2,3
15
0.0
449
24
3
2
13
.822
894
Cher
ry
Neb
rask
a S
and
Hil
ls
31
1
15
,439
0
.02
01
44
8
0
.51
81
68
Cheyenne
Wes
tern
Hig
h P
lain
s 1
44
3,0
98
0.0
464
82
0
0
.00
00
00
Cla
y
Cen
tral
Gre
at P
lain
s 6
0
1,4
84
0.0
404
31
0
0
.00
00
00
Co
lfax
C
orn
Bel
t P
lain
s 7
2
1,0
70
0.0
672
90
0
0
.00
00
00
Cu
min
g
Co
rn B
elt
Pla
ins
25
1,4
81
0.0
168
80
0
0
.00
00
00
Cu
ster
C
entr
al G
reat
Pla
ins
14
9
6,6
72
0.0
223
32
4
0
.59
95
20
Dak
ota
C
orn
Bel
t P
lain
s 7
0
68
4
0.1
023
39
0
0
.00
00
00
Daw
es
Wes
tern
Hig
h P
lain
s 3
97
3,6
16
0.1
097
90
1
0
.27
65
49
Daw
son
C
entr
al G
reat
Pla
ins
12
0
2,6
24
0.0
457
32
2
0
.76
21
95
Deu
el
Wes
tern
Hig
h P
lain
s 2
2
1,1
40
0.0
192
98
8
7
.01
75
44
Dix
on
C
orn
Bel
t P
lain
s 1
57
1,2
33
0.1
273
32
0
0
.00
00
00
Do
dge
Co
rn B
elt
Pla
ins
71
1,3
83
0.0
513
38
0
0
.00
00
00
Do
ugla
s C
orn
Bel
t P
lain
s 2
31
85
7
0.2
695
45
0
0
.00
00
00
Du
nd
y
Wes
tern
Hig
h P
lain
s 1
9
2,3
83
0.0
079
73
9
3
.77
67
52
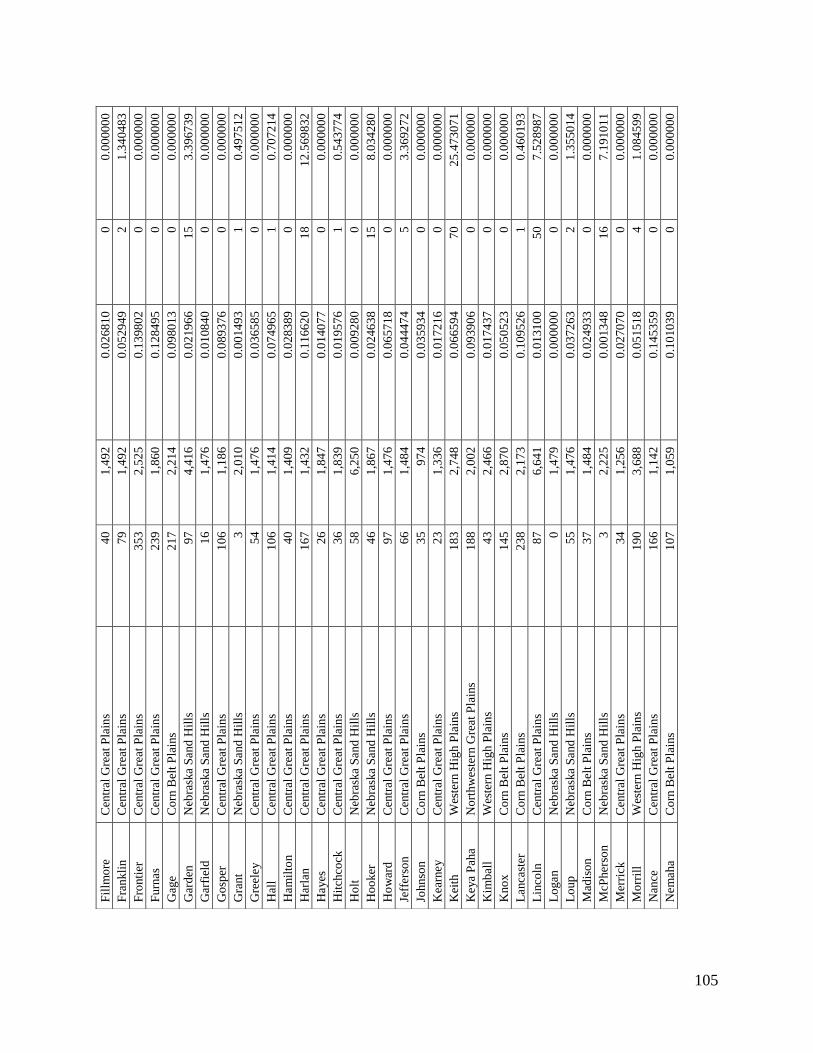
105
Fil
lmo
re
Cen
tral
Gre
at P
lain
s 4
0
1,4
92
0.0
268
10
0
0
.00
00
00
Fra
nk
lin
C
entr
al G
reat
Pla
ins
79
1,4
92
0.0
529
49
2
1
.34
04
83
Fro
nti
er
Cen
tral
Gre
at P
lain
s 3
53
2,5
25
0.1
398
02
0
0.0
000
00
Furn
as
Cen
tral
Gre
at P
lain
s 2
39
1,8
60
0.1
284
95
0
0
.00
00
00
Gag
e
Co
rn B
elt
Pla
ins
21
7
2,2
14
0.0
980
13
0
0
.00
00
00
Gar
den
N
ebra
ska
Sand
Hil
ls
97
4,4
16
0.0
219
66
1
5
3.3
967
39
Gar
fiel
d
Neb
rask
a S
and
Hil
ls
16
1,4
76
0.0
108
40
0
0
.00
00
00
Go
sper
C
entr
al G
reat
Pla
ins
10
6
1,1
86
0.0
893
76
0
0
.00
00
00
Gra
nt
Neb
rask
a S
and
Hil
ls
3
2,0
10
0.0
014
93
1
0
.49
75
12
Gre
eley
Cen
tral
Gre
at P
lain
s 5
4
1,4
76
0.0
365
85
0
0
.00
00
00
Hal
l C
entr
al G
reat
Pla
ins
10
6
1,4
14
0.0
749
65
1
0
.70
72
14
Ham
ilto
n
Cen
tral
Gre
at P
lain
s 4
0
1,4
09
0.0
283
89
0
0
.00
00
00
Har
lan
C
entr
al G
reat
Pla
ins
16
7
1,4
32
0.1
166
20
1
8
12
.569
832
Hayes
C
entr
al G
reat
Pla
ins
26
1,8
47
0.0
140
77
0
0
.00
00
00
Hit
chco
ck
Cen
tral
Gre
at P
lain
s 3
6
1,8
39
0.0
195
76
1
0
.54
37
74
Ho
lt
Neb
rask
a S
and
Hil
ls
58
6,2
50
0.0
092
80
0
0
.00
00
00
Ho
oker
N
ebra
ska
Sand
Hil
ls
46
1,8
67
0.0
246
38
1
5
8.0
342
80
Ho
war
d
Cen
tral
Gre
at P
lain
s 9
7
1,4
76
0.0
657
18
0
0
.00
00
00
Jeff
erso
n
Cen
tral
Gre
at P
lain
s 6
6
1,4
84
0.0
444
74
5
3
.36
92
72
Johnso
n
Co
rn B
elt
Pla
ins
35
97
4
0.0
359
34
0
0
.00
00
00
Kea
rney
Cen
tral
Gre
at P
lain
s 2
3
1,3
36
0.0
172
16
0
0
.00
00
00
Kei
th
Wes
tern
Hig
h P
lain
s 1
83
2,7
48
0.0
665
94
7
0
25
.473
071
Keya
Pah
a
No
rth
wes
tern
Gre
at P
lain
s 1
88
2,0
02
0.0
939
06
0
0
.00
00
00
Kim
bal
l W
este
rn H
igh P
lain
s 4
3
2,4
66
0.0
174
37
0
0
.00
00
00
Kno
x
Co
rn B
elt
Pla
ins
14
5
2,8
70
0.0
505
23
0
0.0
000
00
Lanca
ster
C
orn
Bel
t P
lain
s 2
38
2,1
73
0.1
095
26
1
0
.46
01
93
Lin
coln
C
entr
al G
reat
Pla
ins
87
6,6
41
0.0
131
00
5
0
7.5
289
87
Lo
gan
N
ebra
ska
Sand
Hil
ls
0
1,4
79
0.0
000
00
0
0
.00
00
00
Lo
up
N
ebra
ska
Sand
Hil
ls
55
1,4
76
0.0
372
63
2
1
.35
50
14
Mad
iso
n
Co
rn B
elt
Pla
ins
37
1,4
84
0.0
249
33
0
0
.00
00
00
McP
her
son
N
ebra
ska
Sand
Hil
ls
3
2,2
25
0.0
013
48
1
6
7.1
910
11
Mer
rick
C
entr
al G
reat
Pla
ins
34
1,2
56
0.0
270
70
0
0
.00
00
00
Mo
rril
l W
este
rn H
igh P
lain
s 1
90
3,6
88
0.0
515
18
4
1
.08
45
99
Nan
ce
Cen
tral
Gre
at P
lain
s 1
66
1,1
42
0.1
453
59
0
0
.00
00
00
Nem
aha
Co
rn B
elt
Pla
ins
10
7
1,0
59
0.1
010
39
0
0
.00
00
00
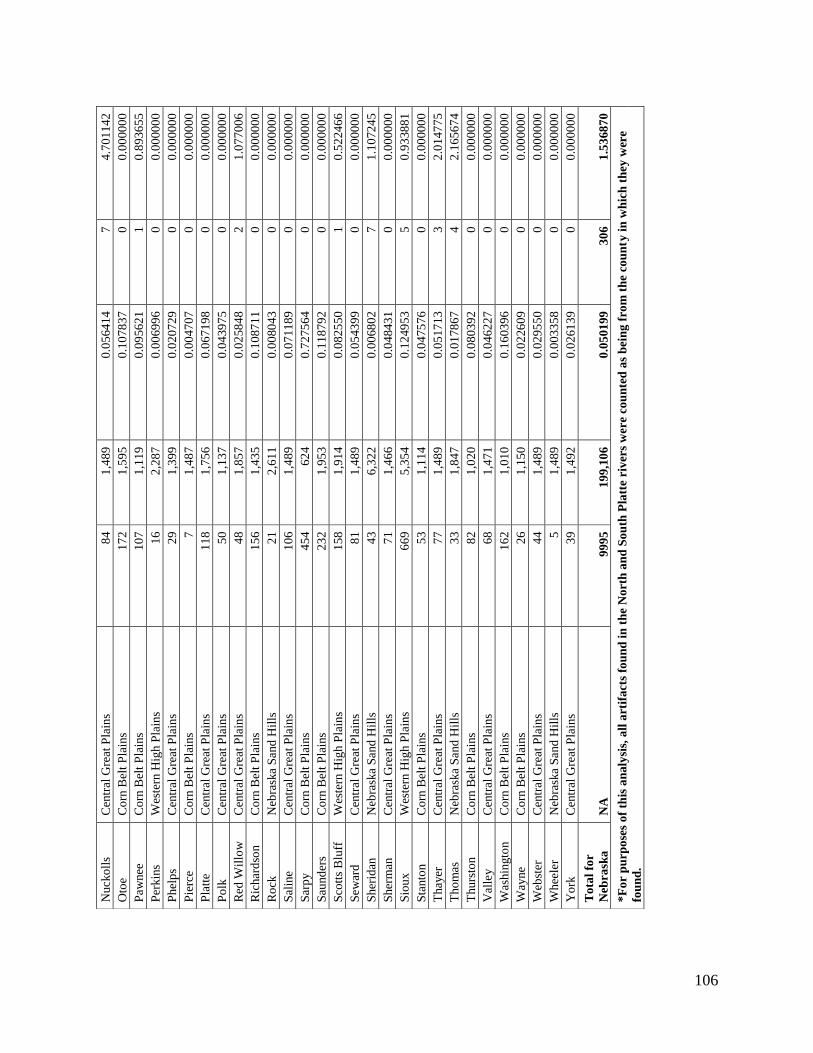
106
Nucko
lls
Cen
tral
Gre
at P
lain
s 8
4
1,4
89
0.0
564
14
7
4
.70
11
42
Oto
e C
orn
Bel
t P
lain
s 1
72
1,5
95
0.1
078
37
0
0
.00
00
00
Paw
nee
C
orn
Bel
t P
lain
s 1
07
1,1
19
0.0
956
21
1
0
.89
36
55
Per
kin
s W
este
rn H
igh P
lain
s 1
6
2,2
87
0.0
069
96
0
0
.00
00
00
Phel
ps
Cen
tral
Gre
at P
lain
s 2
9
1,3
99
0.0
207
29
0
0
.00
00
00
Pie
rce
Co
rn B
elt
Pla
ins
7
1,4
87
0.0
047
07
0
0
.00
00
00
Pla
tte
Cen
tral
Gre
at P
lain
s 1
18
1,7
56
0.0
671
98
0
0
.00
00
00
Po
lk
Cen
tral
Gre
at P
lain
s 5
0
1,1
37
0.0
439
75
0
0.0
000
00
Red
Wil
low
C
entr
al G
reat
Pla
ins
48
1,8
57
0.0
258
48
2
1
.07
70
06
Ric
har
dso
n
Co
rn B
elt
Pla
ins
15
6
1,4
35
0.1
087
11
0
0
.00
00
00
Ro
ck
Neb
rask
a S
and
Hil
ls
21
2,6
11
0.0
080
43
0
0
.00
00
00
Sal
ine
Cen
tral
Gre
at P
lain
s 1
06
1,4
89
0.0
711
89
0
0
.00
00
00
Sar
py
Co
rn B
elt
Pla
ins
45
4
62
4
0.7
275
64
0
0
.00
00
00
Sau
nd
ers
Co
rn B
elt
Pla
ins
23
2
1,9
53
0.1
187
92
0
0
.00
00
00
Sco
tts
Blu
ff
Wes
tern
Hig
h P
lain
s 1
58
1,9
14
0.0
825
50
1
0
.52
24
66
Sew
ard
C
entr
al G
reat
Pla
ins
81
1,4
89
0.0
543
99
0
0
.00
00
00
Sher
idan
N
ebra
ska
Sand
Hil
ls
43
6,3
22
0.0
068
02
7
1
.10
72
45
Sher
man
C
entr
al G
reat
Pla
ins
71
1,4
66
0.0
484
31
0
0
.00
00
00
Sio
ux
W
este
rn H
igh P
lain
s 6
69
5,3
54
0.1
249
53
5
0
.93
38
81
Sta
nto
n
Co
rn B
elt
Pla
ins
53
1,1
14
0.0
475
76
0
0
.00
00
00
Thay
er
Cen
tral
Gre
at P
lain
s 7
7
1,4
89
0.0
517
13
3
2
.01
47
75
Tho
mas
N
ebra
ska
Sand
Hil
ls
33
1,8
47
0.0
178
67
4
2
.16
56
74
Thurs
ton
C
orn
Bel
t P
lain
s 8
2
1,0
20
0.0
803
92
0
0
.00
00
00
Val
ley
Cen
tral
Gre
at P
lain
s 6
8
1,4
71
0.0
462
27
0
0
.00
00
00
Was
hin
gto
n
Co
rn B
elt
Pla
ins
16
2
1,0
10
0.1
603
96
0
0
.00
00
00
Way
ne
Co
rn B
elt
Pla
ins
26
1,1
50
0.0
226
09
0
0
.00
00
00
Web
ster
C
entr
al G
reat
Pla
ins
44
1,4
89
0.0
295
50
0
0
.00
00
00
Whee
ler
Neb
rask
a S
and
Hil
ls
5
1,4
89
0.0
033
58
0
0
.00
00
00
Yo
rk
Cen
tral
Gre
at P
lain
s 3
9
1,4
92
0.0
261
39
0
0
.00
00
00
To
tal
for
Neb
rask
a
NA
9
99
5
19
9,1
06
0
.05
01
99
3
06
1.5
368
70
*F
or
pu
rpo
ses
of
this
an
aly
sis,
all
art
ifa
cts
fou
nd
in
th
e N
ort
h a
nd
So
uth
Pla
tte
riv
ers
wer
e co
un
ted
as
bei
ng
fro
m t
he
cou
nty
in
wh
ich
th
ey w
ere
fou
nd
.
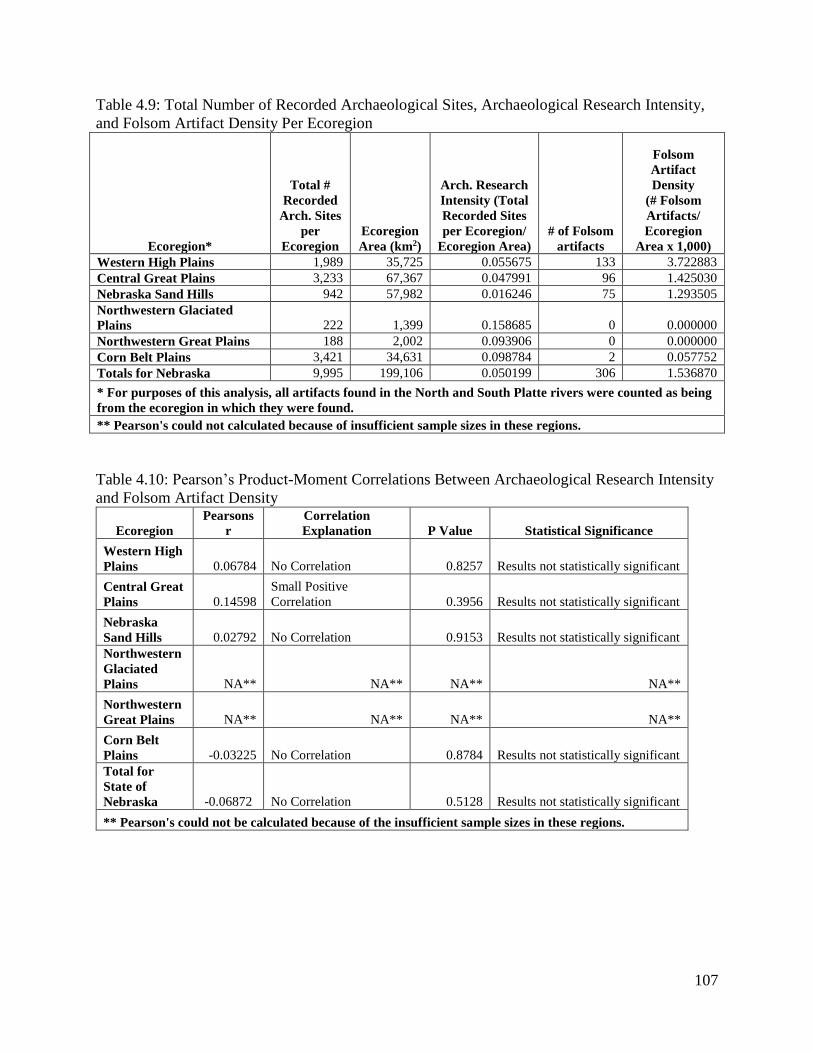
107
Table 4.9: Total Number of Recorded Archaeological Sites, Archaeological Research Intensity,
and Folsom Artifact Density Per Ecoregion
Ecoregion*
Total #
Recorded
Arch. Sites
per
Ecoregion
Ecoregion
Area (km2)
Arch. Research
Intensity (Total
Recorded Sites
per Ecoregion/
Ecoregion Area)
# of Folsom
artifacts
Folsom
Artifact
Density
(# Folsom
Artifacts/
Ecoregion
Area x 1,000)
Western High Plains 1,989 35,725 0.055675 133 3.722883
Central Great Plains 3,233 67,367 0.047991 96 1.425030
Nebraska Sand Hills 942 57,982 0.016246 75 1.293505
Northwestern Glaciated
Plains 222 1,399 0.158685 0 0.000000
Northwestern Great Plains 188 2,002 0.093906 0 0.000000
Corn Belt Plains 3,421 34,631 0.098784 2 0.057752
Totals for Nebraska 9,995 199,106 0.050199 306 1.536870
* For purposes of this analysis, all artifacts found in the North and South Platte rivers were counted as being
from the ecoregion in which they were found.
** Pearson's could not calculated because of insufficient sample sizes in these regions.
Table 4.10: Pearson’s Product-Moment Correlations Between Archaeological Research Intensity
and Folsom Artifact Density
Ecoregion
Pearsons
r
Correlation
Explanation P Value Statistical Significance
Western High
Plains 0.06784 No Correlation 0.8257 Results not statistically significant
Central Great
Plains 0.14598
Small Positive
Correlation 0.3956 Results not statistically significant
Nebraska
Sand Hills 0.02792 No Correlation 0.9153 Results not statistically significant
Northwestern
Glaciated
Plains NA** NA** NA** NA**
Northwestern
Great Plains NA** NA** NA** NA**
Corn Belt
Plains -0.03225 No Correlation 0.8784 Results not statistically significant
Total for
State of
Nebraska -0.06872 No Correlation 0.5128 Results not statistically significant
** Pearson's could not be calculated because of the insufficient sample sizes in these regions.
108
Evaluation of Potential Geomorphic Factors Sampling Bias
Geomorphic factors such as terrace formation in alluvial valleys, loess deposition, sand
dunes, and associated erosion in the Holocene since Folsom time all have the potential to bias the
Folsom distribution in this study. Each are briefly considered herein.
Alluvial Valleys. The size of the T-1 terraces in the Central Plains, and in particular along
the large Platte River system, impact the potential for Folsom surface finds. The low T-1 terraces
occupy thousands of acres in some counties and this impacts the potential for finding surface
Folsom artifacts and could essentially bias the Folsom distribution in this study. This is because
the ages of these geomorphic surfaces are too young to contain Folsom-age sites. If Folsom-age
artifacts are found on the T-1 terraces, then they were introduced by later peoples (for example
the Folsom projectile point excavated from a ceramic-age site trash pit in Hall County). Given
knowledge of the alluvial stratigraphy of the Central Plains, we can expect that there will not be
any Folsom-age artifacts on the low T-1 terraces—the potential to find Folsom artifacts on these
young surfaces should be very low. Therefore, the large area that T-1 terraces occupy in alluvial
valleys can affect the Folsom distribution in the Central Plains.
However, rivers have a high potential for attracting animals, and therefore the people that
hunt those animals, and they also provide critical sources of water, wood, and other resources.
We would expect to find Folsom artifacts on the T-2 terraces, gravel bars, and flood plains. The
Folsom activity and artifacts on the river bottom/flood plains is probably not just a derivative of
reworked material out of T2 terraces. Many of the artifacts found in the river channel probably
started out in the river channel, but just upstream. The gravel bars, the river channels, may have
been good places for Folsom groups to camp because the reason to be in the channels is high
because of water, wood, lithics, protection, and animals. The number of artifacts that come out of
river channels is high. This is likely because the gravel bars, the flood plains are going to be
109
targets for seasonal occupation by Folsom groups and others. The gravel bars are good for
seasonal, not all year round, occupation because obviously one would not want to be in the river
channel and flood plain if it’s flooding.
Schultz et al. (1951:30) were the first to give a detailed valley evolution model for
Nebraska. This model revealed the stratigraphic position where Paleoindian cultural deposits
could be found. At the Lime Creek site, charcoal recovered approximately 40 feet below the
surface of the T-2 terrace fill yielded a radiocarbon age of 10, 493 ± 1,500 yrs B.P (Bamforth
2002; Holen and May 2002; Schultz et al. 1951:34). This radiocarbon age is important because it
indicates that Folsom cultural deposits could occur at great depths in the Terrace 2A fill in
Schultz’s valley evolution model for Nebraska. There has been a variety of work that has dated
Folsom-age cultural deposits in the T-2 terraces of the Central Plains. For example, soil organic
matter from buried paleosols in the Elba terrace fill located at Cooper’s Canyon on the North
Loup River yielded radiocarbon ages between ca. 11,000 and 9,000 RCYBP (May 1990). Also,
Mandel (2008:352) obtained an age of 10,340 ± 100 RCYBP from the upper 10 cm of Soil 9 in
the T-2 terrace fill from Locality 44, a high-order stream locality on the Little Blue River in
southeastern Nebraska. Therefore, in alluvial settings there are landscapes that date to Folsom
time in the Central Plains, but they are deeply buried in the T-2 terraces—they will not be found
on the modern land surface. Where are we going to find Folsom period archaeological sites
preserved in the Central Plains? Mandel (2008) reported that we are going to find Folsom period
archaeological sites preserved in high-order streams throughout the region, in alluvial fans, and
in draws on the High Plains of western Kansas.
Folsom people may have occupied gravel bars and their artifacts may have remained in
the channel through the Holocene. However, Folsom age finds will not be found on the low
110
terraces of alluvial systems as these surfaces are too young to contain Folsom-age deposits.
Alluvial valleys are one of the geomorphic factors that can affect the distribution of Folsom
artifacts in this study.
Sand Hills. The sand in this region is wind deposited and wind activated. Sand dunes
were very active during the late Holocene (Bettis et al. 2003) and this has buried or exposed a lot
of the Folsom-age record. Even given this fact, we do find Folsom artifacts in the Sand Hills.
Folsom artifacts do occur in the Sand Hills. The fact that Clovis and Folsom artifacts are found
there (Figures 4.1 and 4.2) would suggest that not all of the Paleoindian sites are buried (Holen
and Hofman 1999). The current Folsom and Clovis distributions in the Sand Hills suggests there
are exposures in the region and that we need more systematic documentation there.
Climatic and Vegetative changes that led to Erosion and Deposition in the Holocene
since Folsom time. During the early Holocene and continuing through the mid-Holocene,
climatic and vegetative changes occurred that led to erosion and deposition since Folsom time.
The Altithermal climatic episode, a period of time when drier and warmer conditions prevailed,
occurred from approximately 8,000 to 5,000 RCYBP (Antevs 1955; Bryson et al. 1970; Deevy
and Flint 1957; Greiser 1985; Mandel 1995; Webb and Bryson 1972). During the early
Holocene, fewer but more erosive and powerful thunderstorms occurred in the middle of the
continent (Knox 1983:34). During the Altithermal, a change in prairies occurred, from tall- and
mixed-grass to short grass prairies. This led to uplands being prone to erosion at this time
(Kutzbach 1987; Mandel 2006). Additionally, it is probable that during this period, frequent fires
eliminated ground cover and thus increased erosion on hillslopes (Mandel 1995). The effect of
the vegetative and climatic changes that occurred during the early- through mid-Holocene led to
erosion on the uplands that occurred at a high rate. This large upland sediment yield was
111
transported to streams “where it was deposited on alluvial fans and floodplains resulting in deep
burial of Paleoindian-age landscapes” (Mandel 2008:359). Therefore, landscapes that date to the
Folsom period exist; however, it is likely that erosion has removed at least some of it, or
deposition has buried it. It is also likely that deflation has exposed Folsom-age deposits in some
upland settings. Also, in northeastern Nebraska, because of significant erosion on uplands, lower
elevation Folsom-age surfaces may be buried. This is probably the reason why we have found no
stratified Folsom archaeological sites in Nebraska. Instead, our window into the Folsom record is
limited to surface diagnostic Folsom artifacts in this region.
Loess Deposition. Northeastern, eastern, and south-central areas of Nebraska have thick
deposits of loess on the uplands. This loess deposition and re-deposition could potentially bury
Folsom artifacts. The Pleistocene Peoria loess is quite thick (up to 50 meters) and accumulated
across the Great Plains region from ca. 23,000 cal yrs. B.P. until about 12,000 cal yrs. B.P (Bettis
et al. 2003; Holen and May 2002; Forman and Pierson 2002; May and Holen 1993, 2003, 2005;
Muhs et al. 1999). Therefore, Peoria loess deposition ended by about Folsom time (i.e.,
calibrated radiocarbon ages for Folsom are 12,900–12,000 cal yrs. B.P) and therefore should not
greatly interfere with the visibility of the Folsom record. In some places, Bignell loess buried the
Peoria and is much thinner (usually less than 2 meters) and accumulated in episodes throughout
the entire Holocene. However it did not accumulate throughout the Great Plains region (Bettis et
al. 2003; Maat and Johnson 1996; Martin 1993; Mason and Kuzila 2000; Mason et al. 2002;
Muhs et al. 1999; Pye et al. 1995). Therefore, the Bignell loess buried some of the upland
surfaces that potentially could have Folsom-age sites. However, considerable wind and water
erosion has occurred in these same settings hence many of the uplands do have exposures. Many
Folsom sites and artifacts, even in the higher elevations of uplands could be buried, but there is
112
also the chance for re-exposure through erosion. Therefore, we cannot assume that all of the
Folsom record is buried, nor that it is evenly or consistently exposed.
The northeastern, eastern, and south central part of Nebraska (the Northwestern Glaciated
Plains, Corn Belt Plains, and Central Great Plains ecoregions) have some of the best Folsom-age
surface exposure potential in the state. In other words the surfaces are about the right age for
Folsom in these areas (personal communication, Rolfe Mandel, 3-1-12). Therefore, if Folsom
people were in northeastern, eastern, and south central Nebraska, we should find Folsom artifacts
on the surface. Eastern Nebraska has had a lot of loess deposition and also a lot of erosion.
Clovis surface artifacts have been found throughout eastern Nebraska (Holen 2003), so we
should expect that these same surfaces would have Folsom-age artifacts exposed if Folsom
people were there.
Comparison of Clovis versus Folsom Distributions in Nebraska
To compare the distribution of Clovis versus Folsom in Nebraska figures for Clovis by
county were obtained from Holen 2001 and 2003. The number of Clovis versus Folsom by
county and ecoregion are present in Tables 4.11 and 4.12. If we compare Clovis and Folsom for
the state of Nebraska, we see that the distributions are quite different. Figures 4.1 and 4.2 show
the distribution for Clovis and Folsom respectively. In two ecoregions, the Northwestern
Glaciated Plains and Northwestern Great Plains, no Clovis and Folsom artifacts were found
(Table 4.12). In all other ecoregions except one, the Folsom artifact count was greater than for
Clovis. However, in the Corn Belt Plains the Clovis artifact county was greater than for Folsom.
We see an opposite pattern for Clovis versus Folsom in this ecoregion than seen in the rest of the
state.
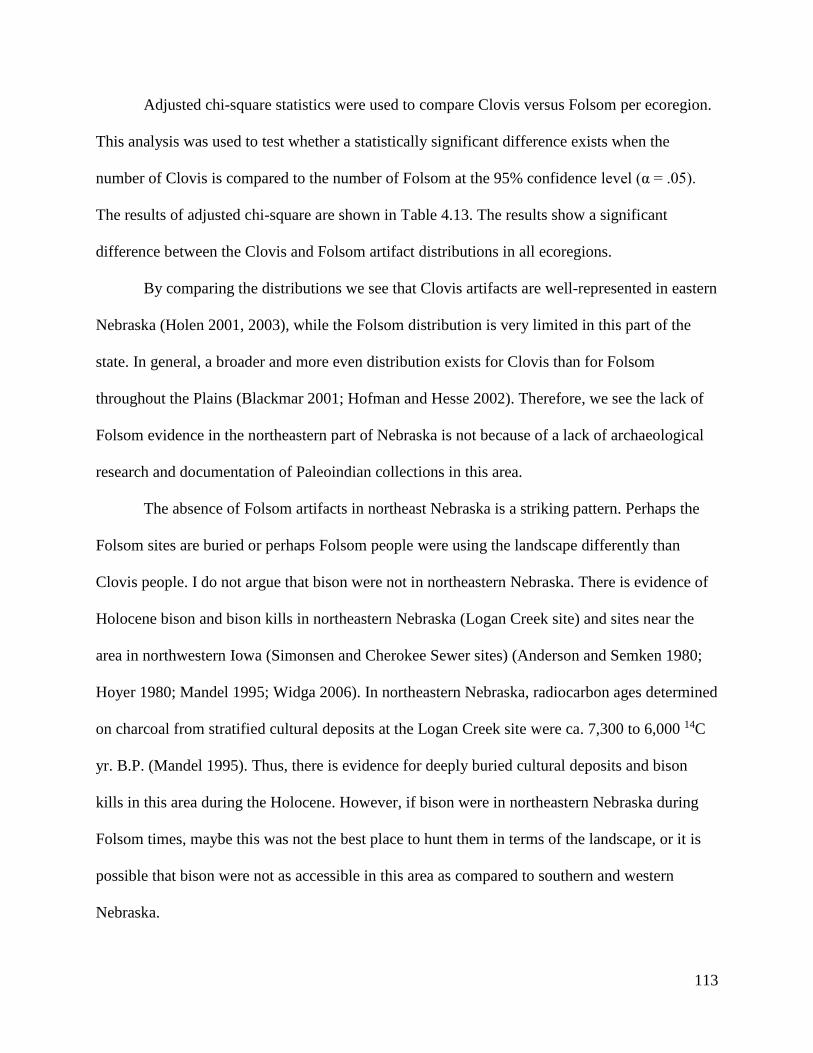
113
Adjusted chi-square statistics were used to compare Clovis versus Folsom per ecoregion.
This analysis was used to test whether a statistically significant difference exists when the
number of Clovis is compared to the number of Folsom at the 95% confidence level (α = .05).
The results of adjusted chi-square are shown in Table 4.13. The results show a significant
difference between the Clovis and Folsom artifact distributions in all ecoregions.
By comparing the distributions we see that Clovis artifacts are well-represented in eastern
Nebraska (Holen 2001, 2003), while the Folsom distribution is very limited in this part of the
state. In general, a broader and more even distribution exists for Clovis than for Folsom
throughout the Plains (Blackmar 2001; Hofman and Hesse 2002). Therefore, we see the lack of
Folsom evidence in the northeastern part of Nebraska is not because of a lack of archaeological
research and documentation of Paleoindian collections in this area.
The absence of Folsom artifacts in northeast Nebraska is a striking pattern. Perhaps the
Folsom sites are buried or perhaps Folsom people were using the landscape differently than
Clovis people. I do not argue that bison were not in northeastern Nebraska. There is evidence of
Holocene bison and bison kills in northeastern Nebraska (Logan Creek site) and sites near the
area in northwestern Iowa (Simonsen and Cherokee Sewer sites) (Anderson and Semken 1980;
Hoyer 1980; Mandel 1995; Widga 2006). In northeastern Nebraska, radiocarbon ages determined
on charcoal from stratified cultural deposits at the Logan Creek site were ca. 7,300 to 6,000 14C
yr. B.P. (Mandel 1995). Thus, there is evidence for deeply buried cultural deposits and bison
kills in this area during the Holocene. However, if bison were in northeastern Nebraska during
Folsom times, maybe this was not the best place to hunt them in terms of the landscape, or it is
possible that bison were not as accessible in this area as compared to southern and western
Nebraska.
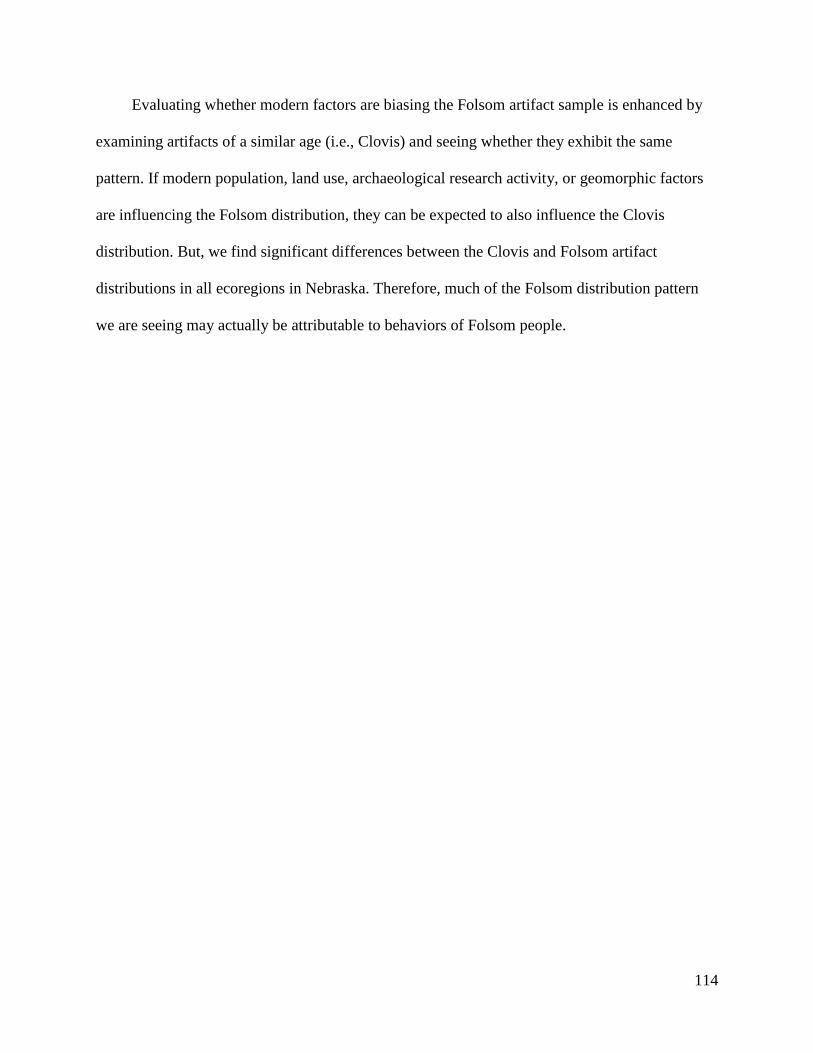
114
Evaluating whether modern factors are biasing the Folsom artifact sample is enhanced by
examining artifacts of a similar age (i.e., Clovis) and seeing whether they exhibit the same
pattern. If modern population, land use, archaeological research activity, or geomorphic factors
are influencing the Folsom distribution, they can be expected to also influence the Clovis
distribution. But, we find significant differences between the Clovis and Folsom artifact
distributions in all ecoregions in Nebraska. Therefore, much of the Folsom distribution pattern
we are seeing may actually be attributable to behaviors of Folsom people.
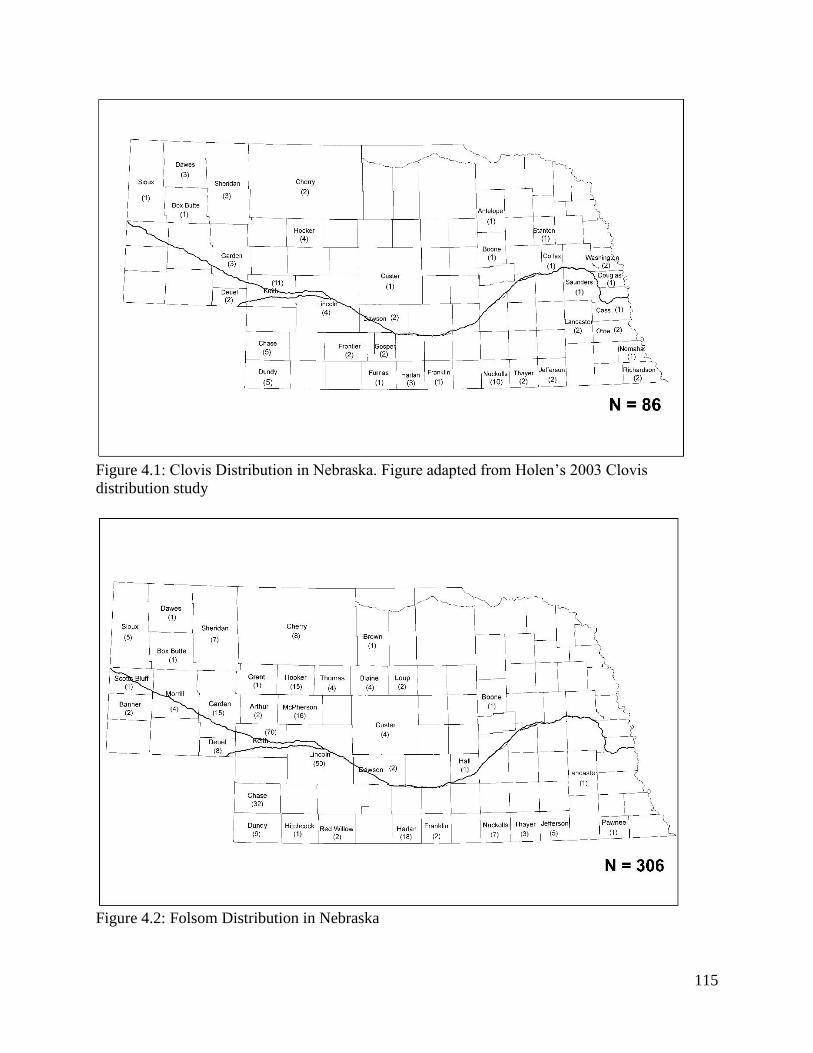
115
Figure 4.1: Clovis Distribution in Nebraska. Figure adapted from Holen’s 2003 Clovis
distribution study
Figure 4.2: Folsom Distribution in Nebraska
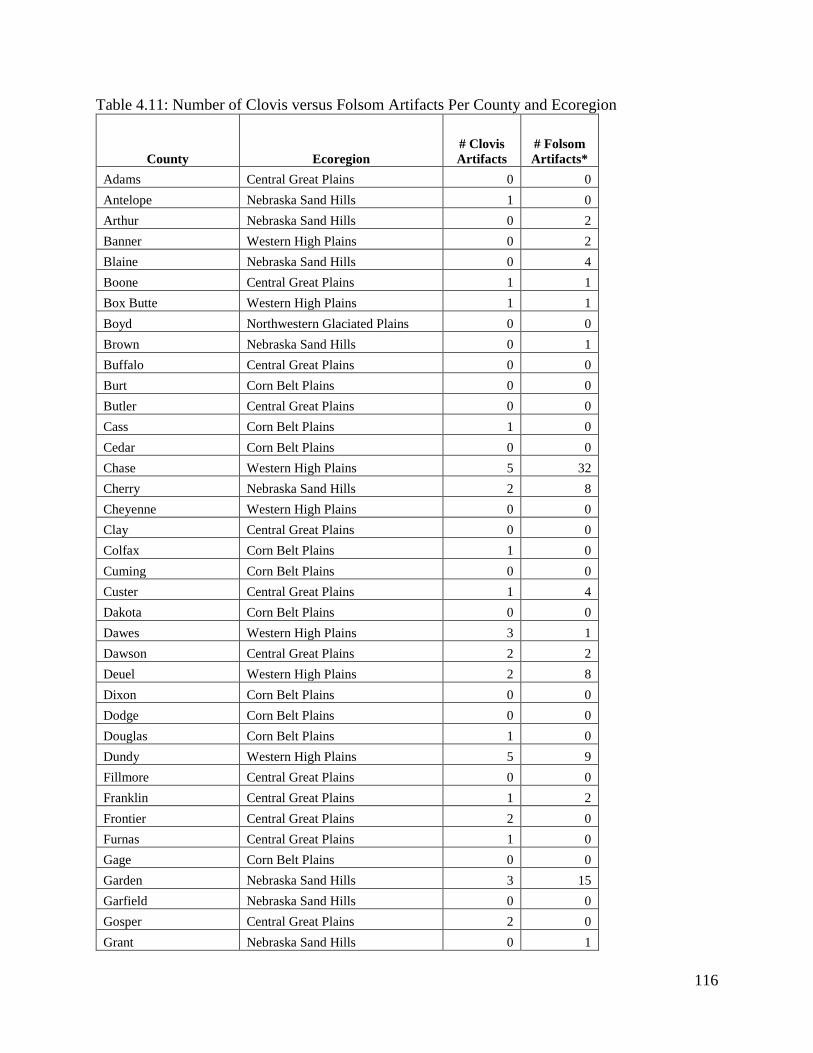
116
Table 4.11: Number of Clovis versus Folsom Artifacts Per County and Ecoregion
County Ecoregion
# Clovis
Artifacts
# Folsom
Artifacts*
Adams Central Great Plains 0 0
Antelope Nebraska Sand Hills 1 0
Arthur Nebraska Sand Hills 0 2
Banner Western High Plains 0 2
Blaine Nebraska Sand Hills 0 4
Boone Central Great Plains 1 1
Box Butte Western High Plains 1 1
Boyd Northwestern Glaciated Plains 0 0
Brown Nebraska Sand Hills 0 1
Buffalo Central Great Plains 0 0
Burt Corn Belt Plains 0 0
Butler Central Great Plains 0 0
Cass Corn Belt Plains 1 0
Cedar Corn Belt Plains 0 0
Chase Western High Plains 5 32
Cherry Nebraska Sand Hills 2 8
Cheyenne Western High Plains 0 0
Clay Central Great Plains 0 0
Colfax Corn Belt Plains 1 0
Cuming Corn Belt Plains 0 0
Custer Central Great Plains 1 4
Dakota Corn Belt Plains 0 0
Dawes Western High Plains 3 1
Dawson Central Great Plains 2 2
Deuel Western High Plains 2 8
Dixon Corn Belt Plains 0 0
Dodge Corn Belt Plains 0 0
Douglas Corn Belt Plains 1 0
Dundy Western High Plains 5 9
Fillmore Central Great Plains 0 0
Franklin Central Great Plains 1 2
Frontier Central Great Plains 2 0
Furnas Central Great Plains 1 0
Gage Corn Belt Plains 0 0
Garden Nebraska Sand Hills 3 15
Garfield Nebraska Sand Hills 0 0
Gosper Central Great Plains 2 0
Grant Nebraska Sand Hills 0 1

117
Greeley Central Great Plains 0 0
Hall Central Great Plains 0 1
Hamilton Central Great Plains 0 0
Harlan Central Great Plains 3 18
Hayes Central Great Plains 0 0
Hitchcock Central Great Plains 0 1
Holt Nebraska Sand Hills 0 0
Hooker Nebraska Sand Hills 4 15
Howard Central Great Plains 0 0
Jefferson Central Great Plains 2 5
Johnson Corn Belt Plains 0 0
Kearney Central Great Plains 0 0
Keith Western High Plains 11 70
Keya Paha Northwestern Great Plains 0 0
Kimball Western High Plains 0 0
Knox Corn Belt Plains 0 0
Lancaster Corn Belt Plains 2 1
Lincoln Central Great Plains 4 50
Logan Nebraska Sand Hills 0 0
Loup Nebraska Sand Hills 0 2
Madison Corn Belt Plains 0 0
McPherson Nebraska Sand Hills 0 16
Merrick Central Great Plains 0 0
Morrill Western High Plains 0 4
Nance Central Great Plains 0 0
Nemaha Corn Belt Plains 1 0
Nuckolls Central Great Plains 10 7
Otoe Corn Belt Plains 2 0
Pawnee Corn Belt Plains 0 1
Perkins Western High Plains 0 0
Phelps Central Great Plains 0 0
Pierce Corn Belt Plains 0 0
Platte Central Great Plains 0 0
Polk Central Great Plains 0 0
Red Willow Central Great Plains 0 2
Richardson Corn Belt Plains 2 0
Rock Nebraska Sand Hills 0 0
Saline Central Great Plains 0 0
Sarpy Corn Belt Plains 0 0
Saunders Corn Belt Plains 1 0
Scotts Bluff Western High Plains 0 1
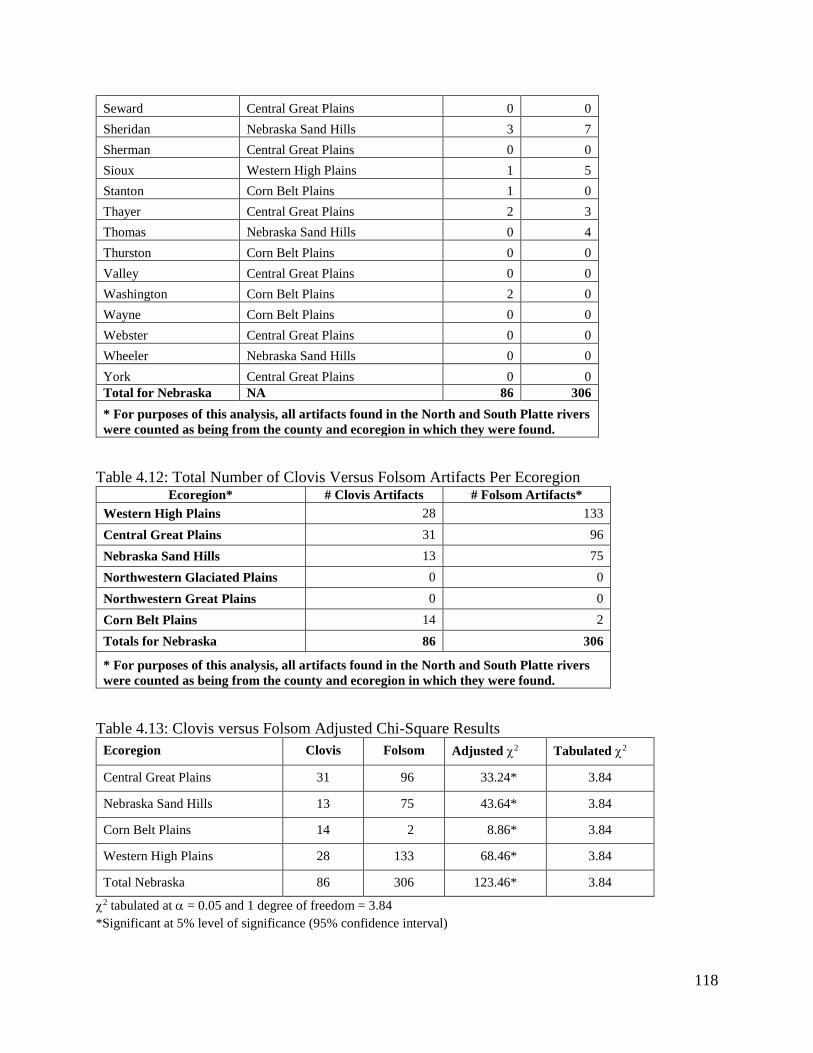
118
Seward Central Great Plains 0 0
Sheridan Nebraska Sand Hills 3 7
Sherman Central Great Plains 0 0
Sioux Western High Plains 1 5
Stanton Corn Belt Plains 1 0
Thayer Central Great Plains 2 3
Thomas Nebraska Sand Hills 0 4
Thurston Corn Belt Plains 0 0
Valley Central Great Plains 0 0
Washington Corn Belt Plains 2 0
Wayne Corn Belt Plains 0 0
Webster Central Great Plains 0 0
Wheeler Nebraska Sand Hills 0 0
York Central Great Plains 0 0
Total for Nebraska NA 86 306
* For purposes of this analysis, all artifacts found in the North and South Platte rivers
were counted as being from the county and ecoregion in which they were found.
Table 4.12: Total Number of Clovis Versus Folsom Artifacts Per Ecoregion Ecoregion* # Clovis Artifacts # Folsom Artifacts*
Western High Plains 28 133
Central Great Plains 31 96
Nebraska Sand Hills 13 75
Northwestern Glaciated Plains 0 0
Northwestern Great Plains 0 0
Corn Belt Plains 14 2
Totals for Nebraska 86 306
* For purposes of this analysis, all artifacts found in the North and South Platte rivers
were counted as being from the county and ecoregion in which they were found.
Table 4.13: Clovis versus Folsom Adjusted Chi-Square Results
Ecoregion Clovis Folsom Adjusted 2 Tabulated 2
Central Great Plains 31 096 033.24* 3.84
Nebraska Sand Hills 13 075 043.64* 3.84
Corn Belt Plains 14 002 008.86* 3.84
Western High Plains 28 133 068.46* 3.84
Total Nebraska 86 306 123.46* 3.84
2 tabulated at = 0.05 and 1 degree of freedom = 3.84
*Significant at 5% level of significance (95% confidence interval)
119
Conclusion about Potential Modern Sampling Biases
The take away message from examining the potential of modern factors which may
influence the Folsom distribution in the Central Plains is that some appear to be potential biases
(geomorphic factors such as alluvial valleys), while others do not (modern land use, modern
population, and archaeological research intensity). We are seeing a pattern in the Folsom
distribution that is apparently independent of land use, modern population, and archaeological
research activity.
The patterns in the Central Plains Folsom sample are probably independent of
geomorphic factors. We find artifacts in the uplands, in river gravels, sand dunes, and eroded
loess surfaces. All kinds of landscapes are represented except Holocene terrace surfaces—and
we don’t expect to see Folsom-age artifacts here because these terraces are too young for
Folsom. The Folsom distribution does not appear to have much to do with potential modern
biases, and thus the pattern we are seeing is likely to be, at least in part, about actual Folsom
behavior.
The Folsom distribution in the Central Plains does not have a statistically significant
correlation with modern population, land use, or archaeological research activity; and is likely
independent of geomorphic factors such as sand dunes, loess deposition, and Holocene
deposition and erosion that occurred since Folsom time. Since the modern biases do not seem to
be the driving determinants of the Central Plains Folsom dataset patterns or distribution that we
see, a reason exists to investigate the patterns and distribution further.
120
Chapter 5: Pattern Recognition in the Data: Lithic Materials and Reduction Stages
Introduction
A small fraction of the Central Plains Folsom dataset is composed of minor lithic material
types (i.e., Alibates, Knife River Flint, Edwards chert, Porcelanite, and Tongue River Silicified
Sediment). The sample also includes Fossil Wood and Permian chert as minority lithics
represented in the dataset. Because of the lithic material samples in the Central Plains Folsom
dataset this chapter focuses on the three main material types represented (i.e., White River Group
Silicates, Hartville Uplift chert, and Smoky Hill Jasper) in terms of looking at distributions and
patterning of reduction stages.
White River Group Silicates (WRGS): Overall Patterns
Because of the overlap in color between sources of White River Group Silicates
(WRGS), it is impossible to determine the specific source of some WRGS macroscopically. In
these cases neutron activation analysis must be used (Hoard et al. 1991, Holen 2001,). Flattop
Butte is the closest source for WRGS for nearly all artifacts in the Nebraska Folsom sample,
therefore this source was used to determine distances. Distances were calculated from the
material source to the center of the county where the artifacts were found. Other sources of
WRGS include Table Mountain, Wyoming and White Horse Creek, South Dakota (Hannus
1985; Koch and Miller 1996). WRGS also washes out in residual gravels (Ahler 1977). The
Flattop Butte source is located west of Sterling in northeastern Colorado and WRGS was moved
in a northeastern, eastern, and southeastern direction into western Nebraska (Figure 5.2). The
maximum distance moved from the source was 395 km into Franklin County in south-central
Nebraska. The shortest distance was 97 km into Morrill County (Table 5.5). The mean distance
(from the source to the center of the county) for all WRGS artifacts was 187 km (Table 5.5).
121
A total of 96 WRGS artifacts are in the Nebraska Folsom sample (Figure 5.1) which
comprises 31.4% of the total sample. The artifact types for the WRGS sample consists of 67
Folsom points, 8 Midland points, 15 preforms, and 6 channel flakes (Table 5.1). The total
number of WRGS Midland and Folsom projectile points is 75 and these are assigned to the
following fragment types: 36 complete points and 19 point bases, 10 tips, and 10 blades (Table
5.2).
The greatest frequency of WRGS is found in the counties located in the confluence area
of the North and South Platte Rivers in Keith and Lincoln Counties with 26 and 15 specimens
respectively for a total of 41 WRGS artifacts found in these two counties (Table 5.3, Figure 5.2).
Table 5.3 and Figure 5.2 show the majority of the WRGS evidence is in western Nebraska with
Chase (19 artifacts), Dundy (6 artifacts), Garden (5 artifacts), and McPherson (8 artifacts)
Counties having the most WRGS evidence outside the North and South Platte River confluence.
Two counties in south-central Nebraska have a few WRGS artifacts (Harlan with three and
Franklin with one). The eastern and northeastern portions of Nebraska are void of WRGS
Folsom evidence.
WRGS artifacts are found in three ecoregions and the South Platte River streambed
(Tables 5.4 and 5.6; Figure 5.3). The western and south central Nebraska ecoregions are well
represented by WRGS evidence. The Western High Plains has 31 WRGS artifacts, Nebraska
Sand Hills has 22, and Central Great Plains has 12 (Table 5.4). The South Platte River has 31
WRGS artifacts. No WRGS artifacts were found in the eastern and northeastern ecoregions of
the Corn Belt Plains, Northwestern Great Plains, and Northwestern Glaciated Plains.
122
White River Group Silicates (WRGS): Patterns in Reduction Stages
White River Group Silicates Preforms. Table 5.5 and Figure 5.2 show the WRGS preform
sample includes a total of 15 preforms from four counties (Keith, Lincoln, Chase, and Hooker).
All these counties are located in western Nebraska with the highest concentration in Keith and
Lincoln Counties at the confluence of the North and South Platte River, with five WRGS
preforms in each county. The next highest preform evidence is in Chase County with four
WRGS preforms, and lastly Hooker County had one. The distance from the source ranged from
159 to 233 km, with a mean distance of 188 km (Table 5.5).
Table 5.6 and Figure 5.3 show that the 15 WRGS preforms came from three ecoregions
(the Western High Plains with 4, Nebraska Sand Hills with 1, and Central Great Plains with 1).
The South Platte River had the most preforms with nine. No WRGS preforms were found in the
North Platte River nor the eastern and northeastern ecoregions (the Corn Belt Plains,
Northwestern Glaciated Plains, and Northwestern Great Plains).
White River Group Silicates (WRGS) Channel Flakes. The Nebraska Folsom sample
contains a total of six WRGS channel flakes from three counties (Chase, Keith, and Lincoln).
Table 5.5 and Figure 5.2 show that Chase County, located in southwest Nebraska east of the
Flattop Butte source area, had four WRGS channel flakes. Keith and Lincoln Counties have one
WRGS channel flake each, and as mentioned these encompass the confluence of the North and
South Platte Rivers. The WRGS channel flakes from Chase County are from the Nolan site and
are located 159 km from the Flattop Butte source (Table 5.5). The ones from Keith and Lincoln
Counties are located 159 km and 233 km from the source respectively. The mean distance for
WRGS channel flakes from the source to the center of each county was 171 km (Table 5.5). The
evidence for WRGS channel flakes was from one ecoregion (the Western High Plains with four)
123
and the South Platte River with two channel flakes (Table 5.6 and Figure 5.3). This is within the
area of WRGS Folsom preform occurrences. No evidence for WRGS channel flakes exists in the
eastern and northeastern part of the state.
All 4 WRGS channels from Chase County are from the Nolan site. The WRGS channel
from Keith County is from a private collection, while the one from Lincoln County is from a
different private collection. It is fair to ask the question—whether the evidence for channel flakes
in this area is because of sampling bias. We might expect the distribution of channel flakes to
mirror that of Folsom preforms, but channel flakes are less recognizable to most collectors and
archaeologists.
White River Group Silicates Non-Reworked Projectile Points. The Nebraska Folsom
sample contained a total of 26 WRGS non-reworked points (Table 5.5, Figure 5.2). The county
with the largest number of WRGS non-reworked points is Keith County with nine specimens.
Chase, Lincoln and McPherson Counties have 4, 4, and 3 non-reworked points, respectively. The
remaining evidence for non-reworked points is found in Dundy, Garden, Harlan, Hitchcock,
Sheridan, and Thomas Counties, each having one specimen. All of these counties lie in western
Nebraska with the exception of south-centrally located Harlan County. The distance from the
Flattop Butte source area to the WRGS non-reworked points found in the western Nebraska
counties ranged between 125 and 270 km (Table 5.5). The maximum distance for the WRGS
non-reworked sample was the specimen from Harlan County found 357 km from the source. The
mean distance for the WRGS non-reworked points was 192 km (Table 5.5).
Table 5.6 and Figure 5.3 show WRGS non-reworked points occur in three ecoregions and
the South Platte River. The South Platte River had the most evidence for WRGS non-reworked
points with 9 specimens, while the Nebraska Sand Hills had 6, Western High Plains had 6, and
124
the Central Great Plains had 5. Non-reworked points were not found in the North Platte nor in
the eastern and northeastern ecoregions (i.e., the Corn Belt Plains, Northwestern Glaciated
Plains, and Northwestern Great Plains).
White River Group Silicates Reworked Projectile Points. The Nebraska Folsom sample
has 23 WRGS reworked points. Table 5.5 and Figure 5.2 show the largest number of WRGS
reworked points were found in Chase (3 specimens), Dundy (4 specimens), Keith (4 specimens),
Lincoln (3 specimens) and McPherson (3 specimens) Counties. All of these counties are in
western Nebraska with Keith and Lincoln lying at the confluence of the North and South Platte
Rivers. A sparse scattering of reworked points are found in Deuel (1 specimen), Garden (1
specimen), Hooker (1 specimen), and Sheridan (2 specimens) Counties. These counties also lie
in western Nebraska. The only county with evidence for reworked points which is outside of
western Nebraska is Harlan County with one specimen (located in south-central Nebraska). The
reworked points from western Nebraska are between 101 and 233 kilometers from the Flattop
Butte source in northeastern Colorado (Table 5.5). The maximum distance for the WRGS
reworked point sample was the specimen from Harlan County, in south-central Nebraska, which
was found 357 km from the source. However, the mean distance for the WRGS reworked points
was 190 km (Table 5.5)
Table 5.6 and Figure 5.3 show that reworked points occur in three ecoregions and the
South Platte River. The ecoregions with the greatest number of WRGS reworked points are the
Western High Plains (seven specimens) and Nebraska Sand Hills (seven artifacts). The South
Platte River both had six reworked points, while the south-centrally located Central Great Plains
had three WRGS reworked points.
125
White River Group Silicates Undetermined (or Indeterminate) Projectile Points. Table
5.5 and Figure 5.2 show the Nebraska Folsom sample contains 26 WRGS undetermined points
(in terms of reworking). The largest number of WRGS undetermined points were found in Keith
County with seven specimens (Table 5.5, Figure 5.2). Chase County had 4 WRGS undetermined
points, Garden had 3, and Lincoln, McPherson and Morrill had 2 each. In Arthur, Dundy,
Franklin, Harlan, Hooker, and Sheridan Counties there is one specimen in each. All of the
counties where WRGS undetermined points are found are in western Nebraska, with the
exception of Harlan and Franklin Counties located in south-central Nebraska. The distance, from
the source area to the WRGS undetermined points found in the western Nebraska counties,
ranged between 97 and 233 km (Table 5.5). The maximum distance where WRGS undetermined
points were found from the source area was in Harlan and Franklin Counties located 357 and 395
km from the source respectively. The mean distance for WRGS undetermined points was 182 km
(Table 5.5).
Table 5.6 and Figure 5.3 show that WRGS undetermined points occur in 3 ecoregions
and the South Platte River. The Western High Plains had the most evidence for WRGS
undetermined points with 10 specimens, the Nebraska Sand Hills had 8 specimens, South Platte
River had 5, and the Central Great Plains had 3. No WRGS undetermined points were found in
the North Platte nor in the eastern and northeastern ecoregions (i.e. the Corn Belt Plains,
Northwestern Glaciated Plains, and Northwestern Great Plains).
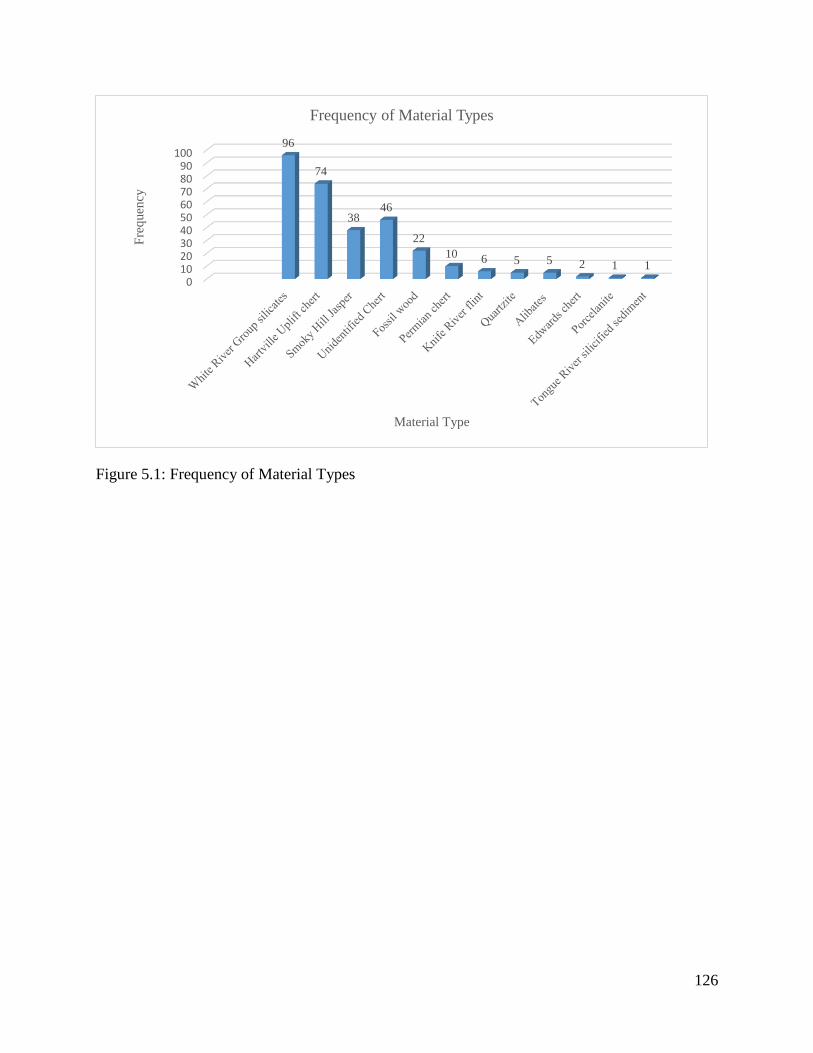
126
Figure 5.1: Frequency of Material Types
0102030405060708090
10096
74
3846
22
10 6 5 5 2 1 1
Fre
quen
cy
Material Type
Frequency of Material Types
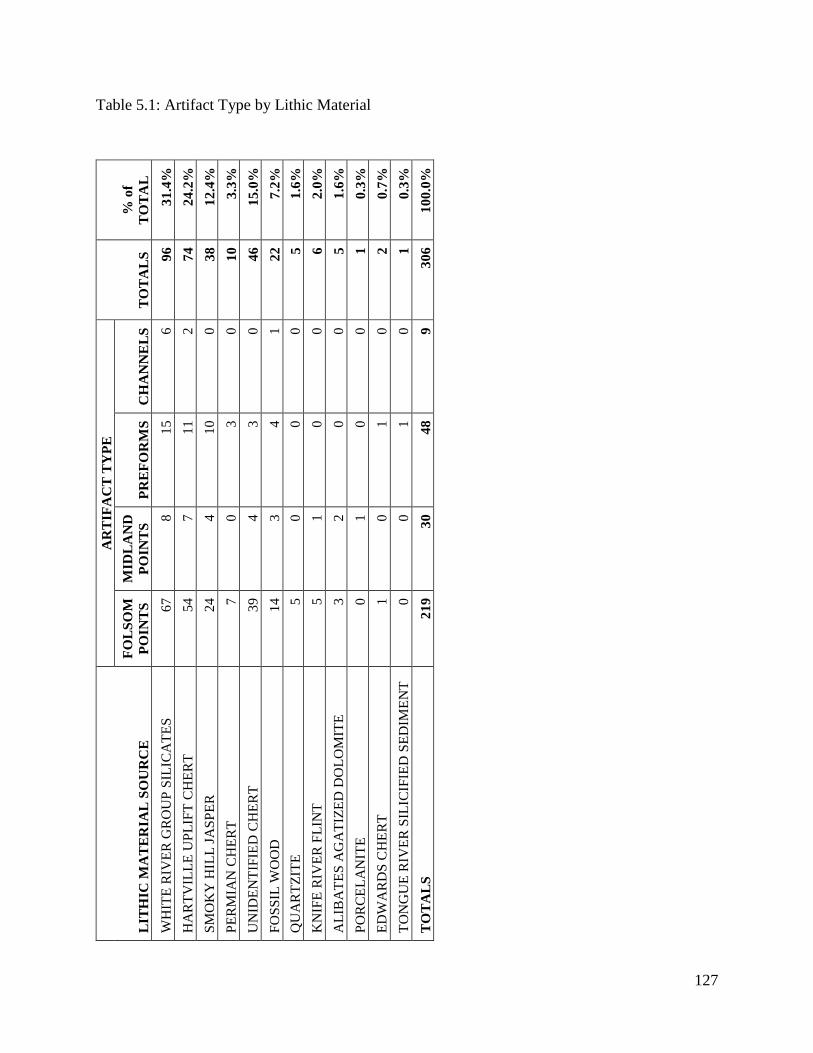
127
Table 5.1: Artifact Type by Lithic Material
LIT
HIC
MA
TE
RIA
L S
OU
RC
E
AR
TIF
AC
T T
YP
E
TO
TA
LS
%
of
TO
TA
L
FO
LS
OM
PO
INT
S
MID
LA
ND
PO
INT
S
PR
EF
OR
MS
C
HA
NN
EL
S
WH
ITE
RIV
ER
GR
OU
P S
ILIC
AT
ES
6
7
8
15
6
96
31
.4%
HA
RT
VIL
LE
UP
LIF
T C
HE
RT
5
4
7
11
2
74
24
.2%
SM
OK
Y H
ILL
JA
SP
ER
2
4
4
10
0
38
12
.4%
PE
RM
IAN
CH
ER
T
7
0
3
0
10
3.3
%
UN
IDE
NT
IFIE
D C
HE
RT
3
9
4
3
0
46
15
.0%
FO
SS
IL W
OO
D
14
3
4
1
22
7.2
%
QU
AR
TZ
ITE
5
0
0
0
5
1
.6%
KN
IFE
RIV
ER
FL
INT
5
1
0
0
6
2
.0%
AL
IBA
TE
S A
GA
TIZ
ED
DO
LO
MIT
E
3
2
0
0
5
1.6
%
PO
RC
EL
AN
ITE
0
1
0
0
1
0
.3%
ED
WA
RD
S C
HE
RT
1
0
1
0
2
0
.7%
TO
NG
UE
RIV
ER
SIL
ICIF
IED
SE
DIM
EN
T
0
0
1
0
1
0.3
%
TO
TA
LS
2
19
30
48
9
30
6
10
0.0
%
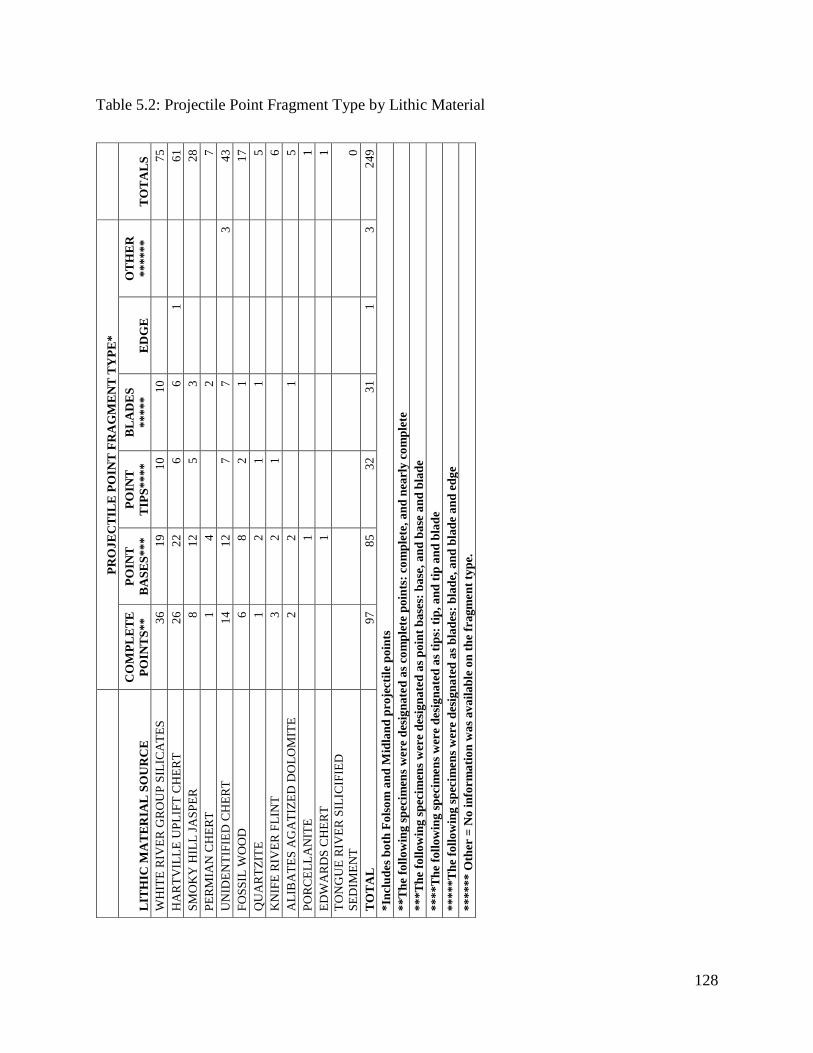
128
Table 5.2: Projectile Point Fragment Type by Lithic Material
P
RO
JE
CT
ILE
PO
INT
FR
AG
ME
NT
TY
PE
*
LIT
HIC
MA
TE
RIA
L S
OU
RC
E
CO
MP
LE
TE
PO
INT
S*
*
PO
INT
BA
SE
S*
**
PO
INT
TIP
S*
**
*
BL
AD
ES
**
***
ED
GE
OT
HE
R
**
***
*
TO
TA
LS
WH
ITE
RIV
ER
GR
OU
P S
ILIC
AT
ES
3
6
19
10
10
75
HA
RT
VIL
LE
UP
LIF
T C
HE
RT
2
6
22
6
6
1
6
1
SM
OK
Y H
ILL
JA
SP
ER
8
1
2
5
3
28
PE
RM
IAN
CH
ER
T
1
4
2
7
UN
IDE
NT
IFIE
D C
HE
RT
1
4
12
7
7
3
4
3
FO
SS
IL W
OO
D
6
8
2
1
17
QU
AR
TZ
ITE
1
2
1
1
5
KN
IFE
RIV
ER
FL
INT
3
2
1
6
AL
IBA
TE
S A
GA
TIZ
ED
DO
LO
MIT
E
2
2
1
5
PO
RC
EL
LA
NIT
E
1
1
ED
WA
RD
S C
HE
RT
1
1
TO
NG
UE
RIV
ER
SIL
ICIF
IED
SE
DIM
EN
T
0
TO
TA
L
97
85
32
31
1
3
24
9
*In
clu
des
bo
th F
ols
om
an
d M
idla
nd
pro
jecti
le p
oin
ts
**
Th
e fo
llo
win
g s
pec
imen
s w
ere
des
ign
ate
d a
s co
mp
lete
po
ints
: co
mp
lete
, a
nd
nea
rly
co
mp
lete
**
*T
he
foll
ow
ing
sp
ecim
ens
wer
e d
esig
na
ted
as
po
int
ba
ses:
ba
se,
an
d b
ase
an
d b
lad
e
**
**
Th
e fo
llow
ing
sp
ecim
en
s w
ere
des
ign
ate
d a
s ti
ps:
tip
, a
nd
tip
an
d b
lad
e
**
***
Th
e fo
llo
win
g s
pec
imen
s w
ere
des
ign
ate
d a
s b
lad
es:
bla
de,
an
d b
lad
e a
nd
ed
ge
**
***
* O
ther
= N
o i
nfo
rm
ati
on
wa
s av
ail
ab
le o
n t
he
fragm
en
t ty
pe.
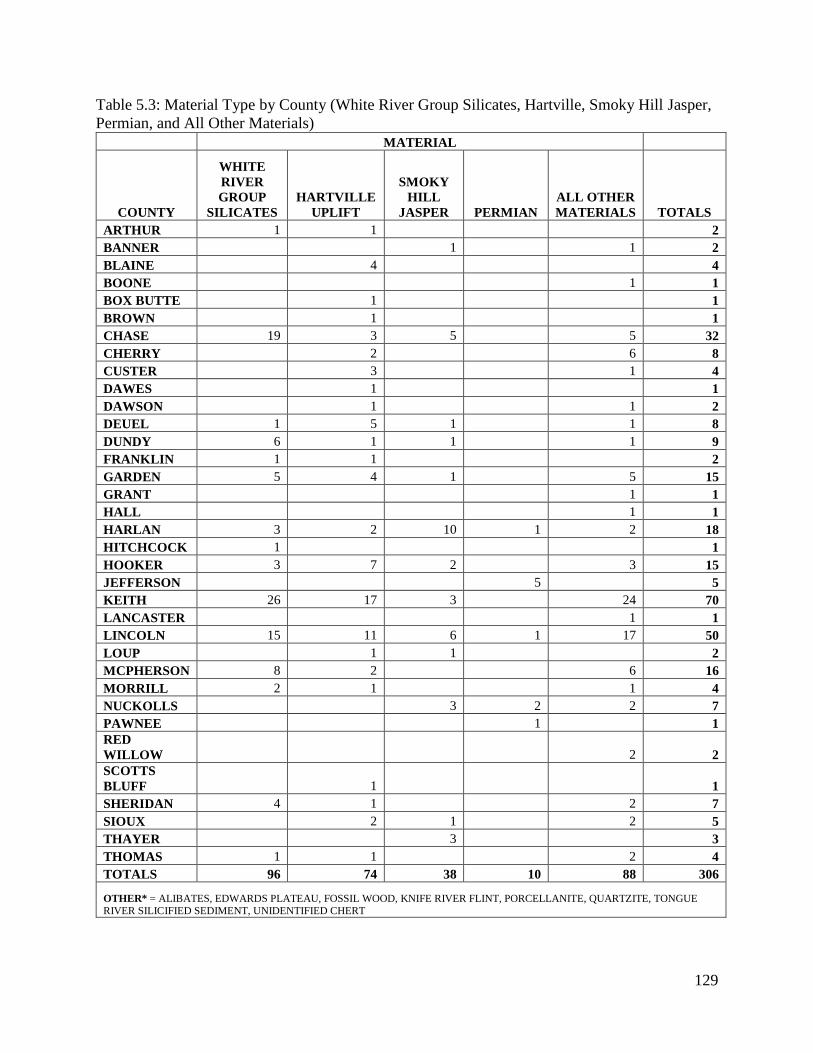
129
Table 5.3: Material Type by County (White River Group Silicates, Hartville, Smoky Hill Jasper,
Permian, and All Other Materials)
MATERIAL
COUNTY
WHITE
RIVER
GROUP
SILICATES
HARTVILLE
UPLIFT
SMOKY
HILL
JASPER PERMIAN
ALL OTHER
MATERIALS TOTALS
ARTHUR 1 1 2
BANNER 1 1 2
BLAINE 4 4
BOONE 1 1
BOX BUTTE 1 1
BROWN 1 1
CHASE 19 3 5 5 32
CHERRY 2 6 8
CUSTER 3 1 4
DAWES 1 1
DAWSON 1 1 2
DEUEL 1 5 1 1 8
DUNDY 6 1 1 1 9
FRANKLIN 1 1 2
GARDEN 5 4 1 5 15
GRANT 1 1
HALL 1 1
HARLAN 3 2 10 1 2 18
HITCHCOCK 1 1
HOOKER 3 7 2 3 15
JEFFERSON 5 5
KEITH 26 17 3 24 70
LANCASTER 1 1
LINCOLN 15 11 6 1 17 50
LOUP 1 1 2
MCPHERSON 8 2 6 16
MORRILL 2 1 1 4
NUCKOLLS 3 2 2 7
PAWNEE 1 1
RED
WILLOW 2 2
SCOTTS
BLUFF 1 1
SHERIDAN 4 1 2 7
SIOUX 2 1 2 5
THAYER 3 3
THOMAS 1 1 2 4
TOTALS 96 74 38 10 88 306
OTHER* = ALIBATES, EDWARDS PLATEAU, FOSSIL WOOD, KNIFE RIVER FLINT, PORCELLANITE, QUARTZITE, TONGUE
RIVER SILICIFIED SEDIMENT, UNIDENTIFIED CHERT
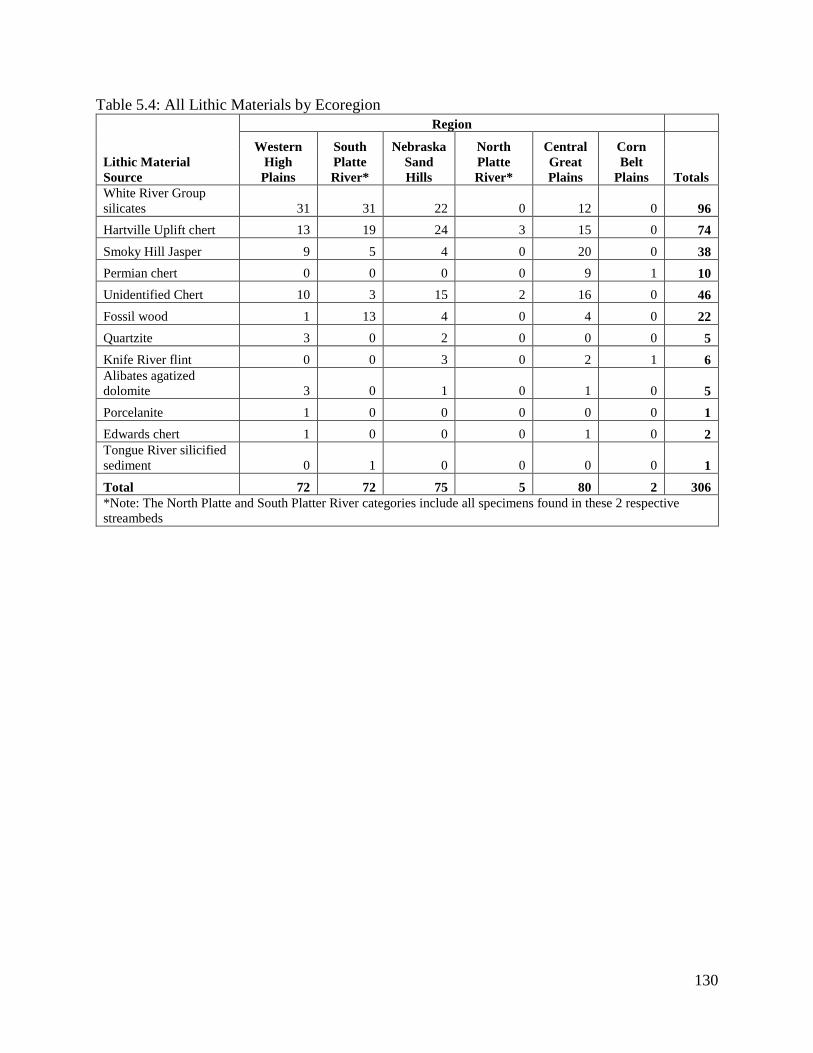
130
Table 5.4: All Lithic Materials by Ecoregion
Lithic Material
Source
Region
Western
High
Plains
South
Platte
River*
Nebraska
Sand
Hills
North
Platte
River*
Central
Great
Plains
Corn
Belt
Plains Totals
White River Group
silicates 31 31 22 0 12 0 96
Hartville Uplift chert 13 19 24 3 15 0 74
Smoky Hill Jasper 9 5 4 0 20 0 38
Permian chert 0 0 0 0 9 1 10
Unidentified Chert 10 3 15 2 16 0 46
Fossil wood 1 13 4 0 4 0 22
Quartzite 3 0 2 0 0 0 5
Knife River flint 0 0 3 0 2 1 6
Alibates agatized
dolomite 3 0 1 0 1 0 5
Porcelanite 1 0 0 0 0 0 1
Edwards chert 1 0 0 0 1 0 2
Tongue River silicified
sediment 0 1 0 0 0 0 1
Total 72 72 75 5 80 2 306
*Note: The North Platte and South Platter River categories include all specimens found in these 2 respective
streambeds
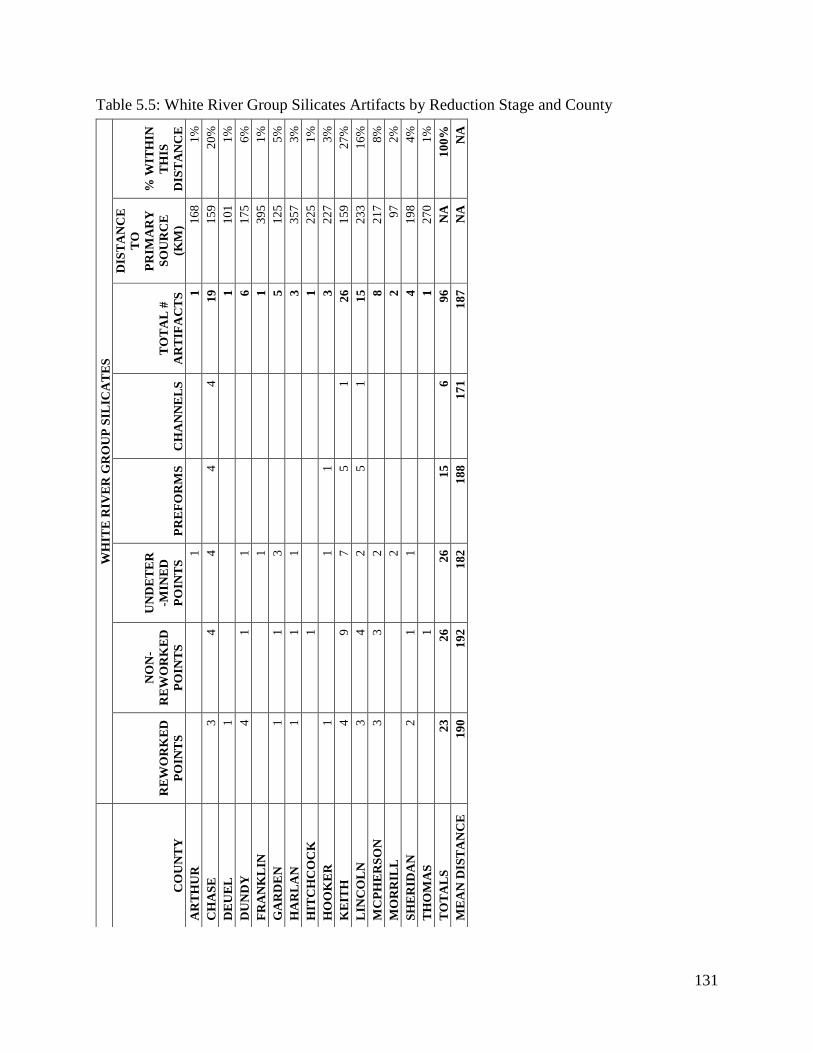
131
Table 5.5: White River Group Silicates Artifacts by Reduction Stage and County
W
HIT
E R
IVE
R G
RO
UP
SIL
ICA
TE
S
CO
UN
TY
RE
WO
RK
ED
PO
INT
S
NO
N-
RE
WO
RK
ED
PO
INT
S
UN
DE
TE
R
-MIN
ED
PO
INT
S
PR
EF
OR
MS
C
HA
NN
EL
S
TO
TA
L #
AR
TIF
AC
TS
DIS
TA
NC
E
TO
PR
IMA
RY
SO
UR
CE
(KM
)
% W
ITH
IN
TH
IS
DIS
TA
NC
E
AR
TH
UR
1
1
1
68
1%
CH
AS
E
3
4
4
4
4
19
15
9
20
%
DE
UE
L
1
1
10
1
1%
DU
ND
Y
4
1
1
6
17
5
6%
FR
AN
KL
IN
1
1
39
5
1%
GA
RD
EN
1
1
3
5
1
25
5%
HA
RL
AN
1
1
1
3
3
57
3%
HIT
CH
CO
CK
1
1
2
25
1%
HO
OK
ER
1
1
1
3
2
27
3%
KE
ITH
4
9
7
5
1
2
6
15
9
27
%
LIN
CO
LN
3
4
2
5
1
1
5
23
3
16
%
MC
PH
ER
SO
N
3
3
2
8
21
7
8%
MO
RR
ILL
2
2
9
7
2%
SH
ER
IDA
N
2
1
1
4
19
8
4%
TH
OM
AS
1
1
2
70
1%
TO
TA
LS
2
3
26
26
15
6
96
NA
1
00
%
ME
AN
DIS
TA
NC
E
19
0
19
2
18
2
18
8
17
1
18
7
NA
N
A
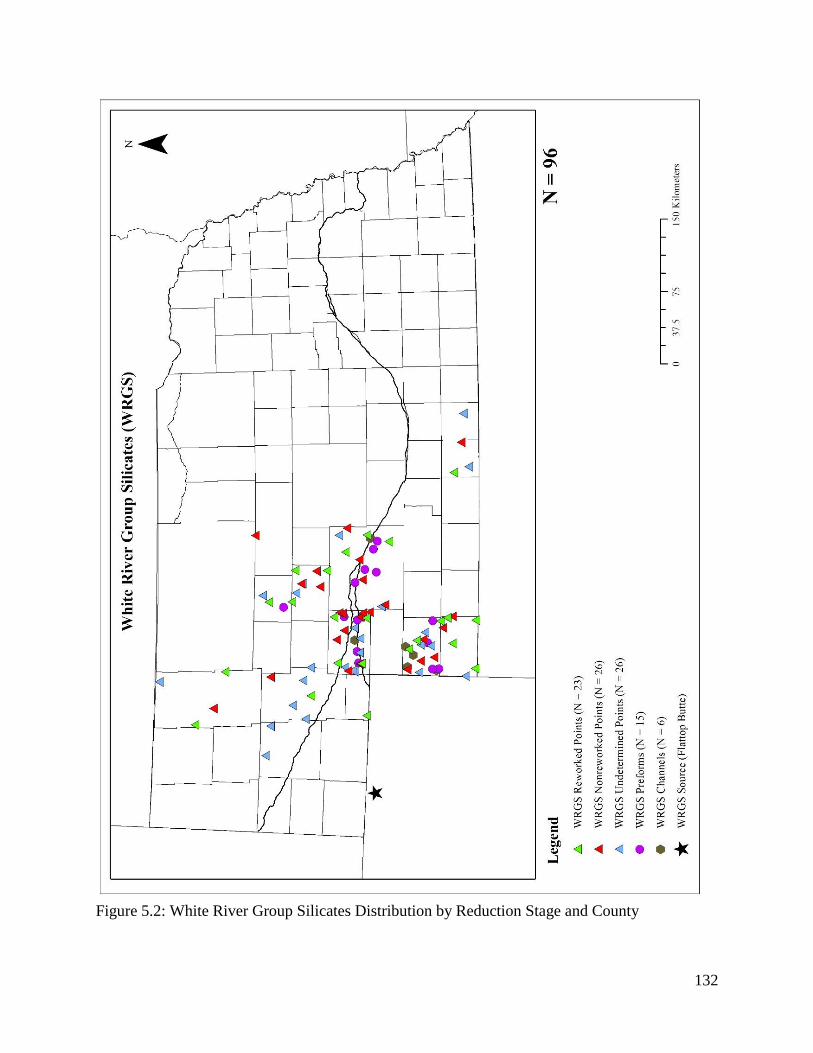
132
Figure 5.2: White River Group Silicates Distribution by Reduction Stage and County
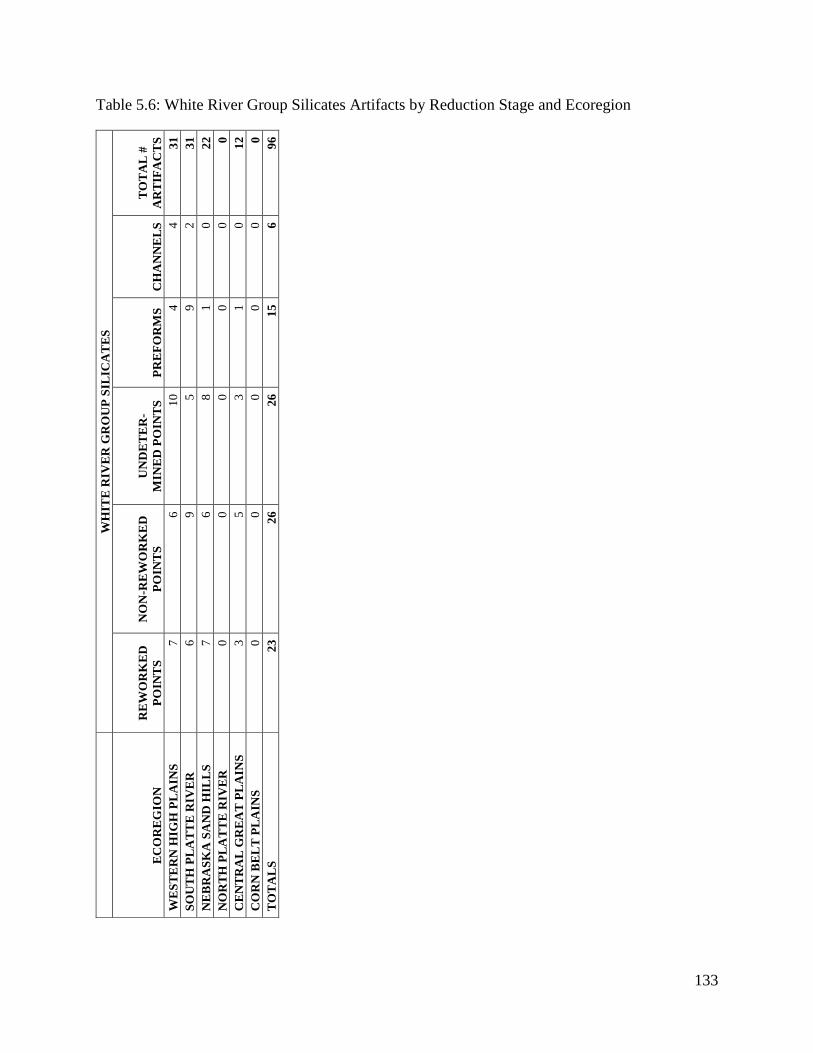
133
Table 5.6: White River Group Silicates Artifacts by Reduction Stage and Ecoregion
W
HIT
E R
IVE
R G
RO
UP
SIL
ICA
TE
S
EC
OR
EG
ION
RE
WO
RK
ED
PO
INT
S
NO
N-R
EW
OR
KE
D
PO
INT
S
UN
DE
TE
R-
MIN
ED
PO
INT
S
PR
EF
OR
MS
C
HA
NN
EL
S
TO
TA
L #
AR
TIF
AC
TS
WE
ST
ER
N H
IGH
PL
AIN
S
7
6
10
4
4
31
SO
UT
H P
LA
TT
E R
IVE
R
6
9
5
9
2
31
NE
BR
AS
KA
SA
ND
HIL
LS
7
6
8
1
0
2
2
NO
RT
H P
LA
TT
E R
IVE
R
0
0
0
0
0
0
CE
NT
RA
L G
RE
AT
PL
AIN
S
3
5
3
1
0
12
CO
RN
BE
LT
PL
AIN
S
0
0
0
0
0
0
TO
TA
LS
2
3
26
26
15
6
96
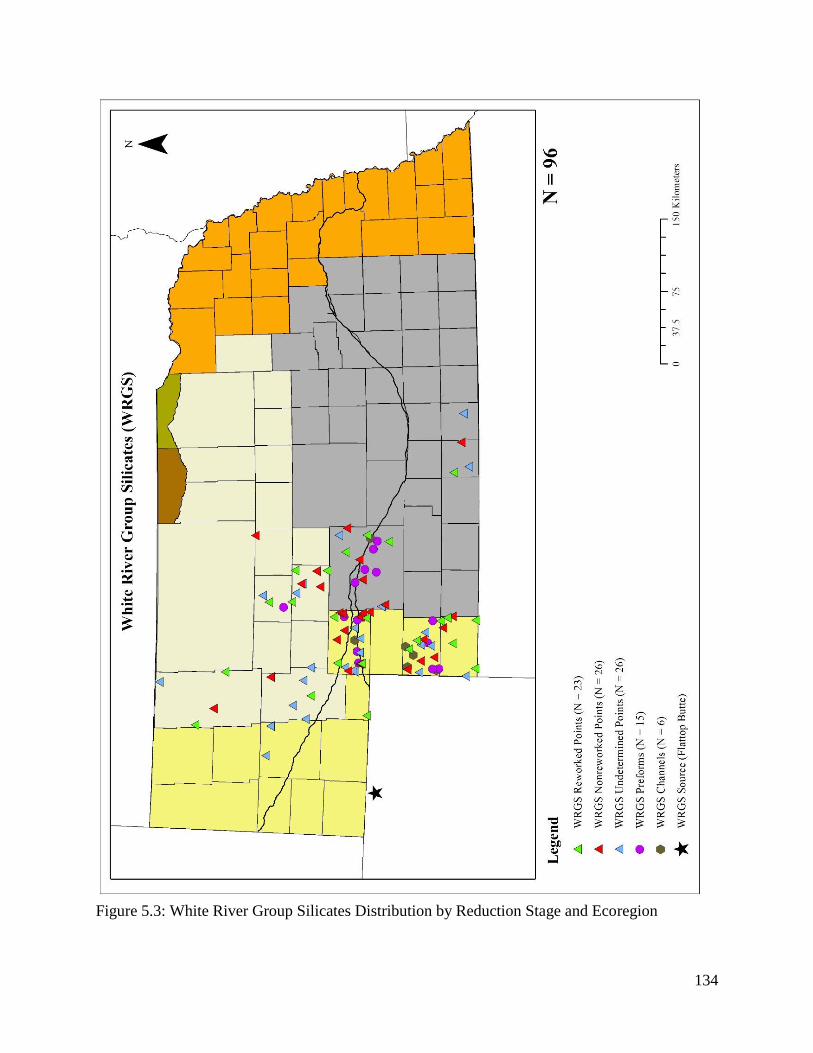
134
Figure 5.3: White River Group Silicates Distribution by Reduction Stage and Ecoregion
135
Hartville Uplift Chert: Overall Patterns
The Hartville Uplift chert source is in east-central Wyoming’s Hartville Uplift, west of
the Nebraska panhandle, and is also represented in secondary gravel deposits in the western
Nebraska panhandle. The sample contains a total of 74 Hartville Uplift chert artifacts, or 24.2%
of the total Nebraska Folsom sample (Figure 5.1). The maximum distance Hartville was moved
from the source to the center of the county where the artifact was found was 540 km in Franklin
County in south-central Nebraska, while the shortest distance was 82 km in far northwestern
Sioux County (Table 5.7, Figure 5.4). The mean distance was 307 km (Table 5.7). Distances
were calculated from the material source to the center of the county where the artifacts were
found. The artifact types for the Hartville sample include 54 Folsom points, 7 Midland points, 11
preforms, and 2 channel flakes (Table 5.1). The total number of Folsom and Midland points is 61
and includes the following fragment types: 26 complete points, 22 point bases, 6 tips, 6 blades,
and 1 edge (Table 5.2).
Table 5.3 and Figure 5.4 show the largest concentration of Hartville artifacts occurs in the
North and South Platte River confluence in Keith (17 specimens) and Lincoln (11 specimens)
Counties. All of the Hartville artifacts occur in the western half of Nebraska (Figure 5.4). The
second largest frequency for Hartville artifacts is found in Hooker County with 7 specimens,
followed by in Deuel with 4, 4 in Blaine, and 4 in Garden. Hartville artifacts are found in 18
other counties in western Nebraska and the number of specimens in these range from one to
three. The eastern, southeastern, and northeastern parts of Nebraska are void of Hartville Folsom
evidence.
Hartville Uplift artifacts are found in three ecoregions in western Nebraska and the South
Platte River (Table 5.4, Figure 5.5). The distribution among the western ecoregions is fairly even
136
with the Nebraska Sand Hills having 24 Hartville artifacts, Western High Plains has 13, and
Central Great Plains has 15. Hartville artifacts are well represented in the South Platte River with
19 artifacts. No Hartville artifacts were found in the eastern and northeastern ecoregions of the
Corn Belt Plains, Northwestern Great Plains, and the Northwestern Glaciated Plains (Figure 5.5).
Comparison of the Overall Distribution and Frequency of Hartville to White River Group
Silicates. When we compare the overall distribution and frequency of Hartville Uplift chert to
White River Groups Silicates (WRGS) we see that although the overall frequency of WRGS is
greater than for Hartville artifacts, Hartville has a larger spatial distribution. The number of
WRGS artifacts in the Central Plains Folsom dataset is 96 (Table 5.1). Hartville artifacts are
well-represented in the dataset, but the frequency of this lithic material is less than WRGS with
74 artifacts. WRGS make up 31.4% of the sample whereas Hartville comprised 24.2% of the
sample (Figure 5.1). Table 5.1 shows that the Central Plain Folsom dataset has slightly more
WRGS than Hartville artifacts across every artifact type (i.e., points, preforms, and channel
flakes).
Hartville artifacts are more widely distributed in Nebraska than are WRGS artifacts
(Figures 5.2 and 5.4). While Hartville artifacts were found in 24 counties, WRGS artifacts were
found in only 15 (Table 5.3). The counties located at the confluence of the North and South
Platter Rivers (i.e., Keith and Lincoln) had the greatest concentration of both WRGS and
Hartville artifacts (Table 5.3; Figures 5.2 and 5.4). Both WRGS and Hartville artifacts were
concentrated in the western half of Nebraska with no evidence for either of these material types
in either the southeastern or northeastern parts of the state. Hartville artifacts are better
represented in the northwestern and central portions of Nebraska than are WRGS artifacts.
WRGS and Hartville had similar frequencies in both the Nebraska Sand Hills and Central Great
137
Plains (Table 5.6 and 5.8; Figures 5.3 and 5.5). However, WRGS was found in greater frequency
in both the Western High Plains and South Platte River streambed. No WRGS artifacts were
found in the North Platte River streambed, while three Hartville artifacts were found there.
Neither WRGS or Hartville artifacts were found in the eastern and northeastern ecoregions of the
Corn Belt Plains, Northwestern Great Plains, and Northwestern Glaciated Plains (Figures 5.3 and
5.5).
Hartville Uplift Chert: Patterns in Reduction Stages
Hartville Preforms. The sample contains 11 Hartville preforms. The preforms occur in
six counties (Table 5.7, Figure 5.4). The counties with the most Hartville preform evidence are in
North and South Platte River confluence in Keith (with three Hartville preforms) and Lincoln
(with four Hartville preforms) Counties. The counties with evidence for Hartville preforms have
one specimen each. The remaining counties are: Cherry (in the northwest portion of Nebraska,
bordering South Dakota), Hooker (located just below Cherry), Deuel (in the Nebraska
panhandle), and Scotts Bluff (located in the far western portion of the state and bordering
Wyoming). The distance from the source to each preform ranged between 100 and 361 km with
a mean distance of 294 km (Table 5.7). Table 5.8 and Figure 5.5 show Hartville preforms occur
in two ecoregions and the North and South Platte Rivers. The South Platte River had the most
Hartville preform evidence with six specimens, while the North Platte River had two preforms.
The Nebraska Sand Hills and the Central Great Plains had two and one Hartville preforms
respectively.
Hartville Channel Flakes. Table 5.7 and Figure 5.4 show the sample contains two
Hartville channel flakes, and these are from two counties—Chase (with one specimen and
located in the Nebraska Panhandle) and Keith (with one specimen and located in the North and
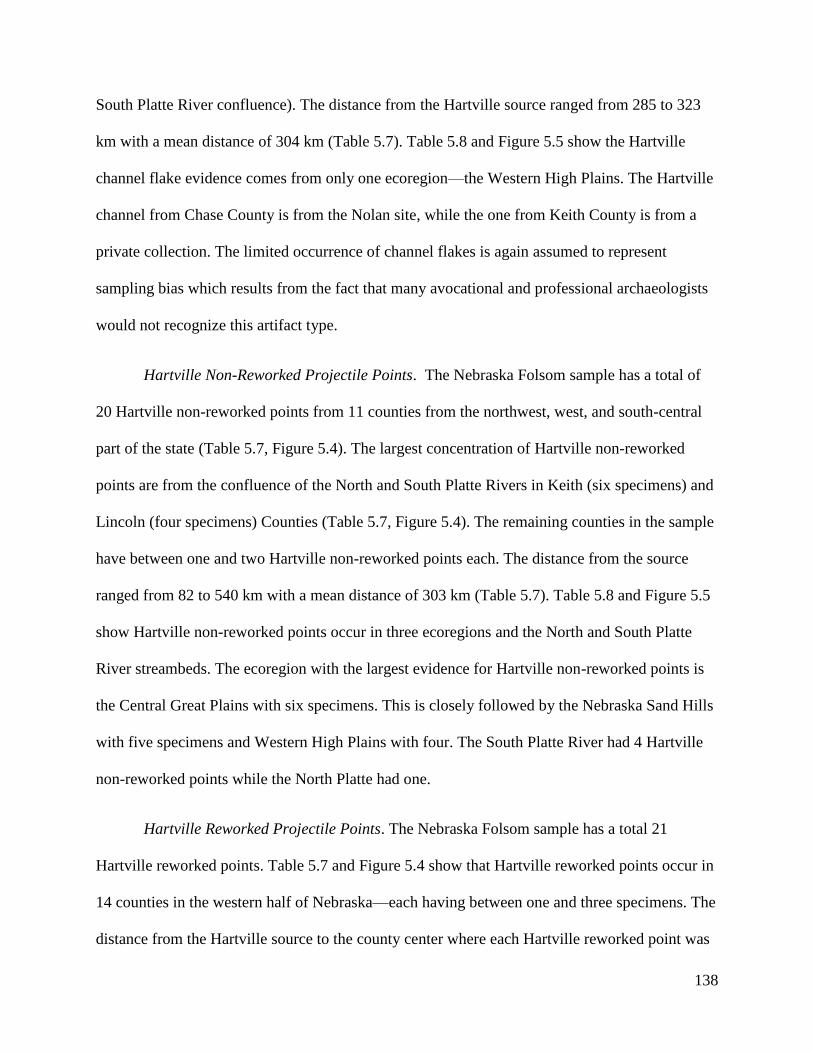
138
South Platte River confluence). The distance from the Hartville source ranged from 285 to 323
km with a mean distance of 304 km (Table 5.7). Table 5.8 and Figure 5.5 show the Hartville
channel flake evidence comes from only one ecoregion—the Western High Plains. The Hartville
channel from Chase County is from the Nolan site, while the one from Keith County is from a
private collection. The limited occurrence of channel flakes is again assumed to represent
sampling bias which results from the fact that many avocational and professional archaeologists
would not recognize this artifact type.
Hartville Non-Reworked Projectile Points. The Nebraska Folsom sample has a total of
20 Hartville non-reworked points from 11 counties from the northwest, west, and south-central
part of the state (Table 5.7, Figure 5.4). The largest concentration of Hartville non-reworked
points are from the confluence of the North and South Platte Rivers in Keith (six specimens) and
Lincoln (four specimens) Counties (Table 5.7, Figure 5.4). The remaining counties in the sample
have between one and two Hartville non-reworked points each. The distance from the source
ranged from 82 to 540 km with a mean distance of 303 km (Table 5.7). Table 5.8 and Figure 5.5
show Hartville non-reworked points occur in three ecoregions and the North and South Platte
River streambeds. The ecoregion with the largest evidence for Hartville non-reworked points is
the Central Great Plains with six specimens. This is closely followed by the Nebraska Sand Hills
with five specimens and Western High Plains with four. The South Platte River had 4 Hartville
non-reworked points while the North Platte had one.
Hartville Reworked Projectile Points. The Nebraska Folsom sample has a total 21
Hartville reworked points. Table 5.7 and Figure 5.4 show that Hartville reworked points occur in
14 counties in the western half of Nebraska—each having between one and three specimens. The
distance from the Hartville source to the county center where each Hartville reworked point was
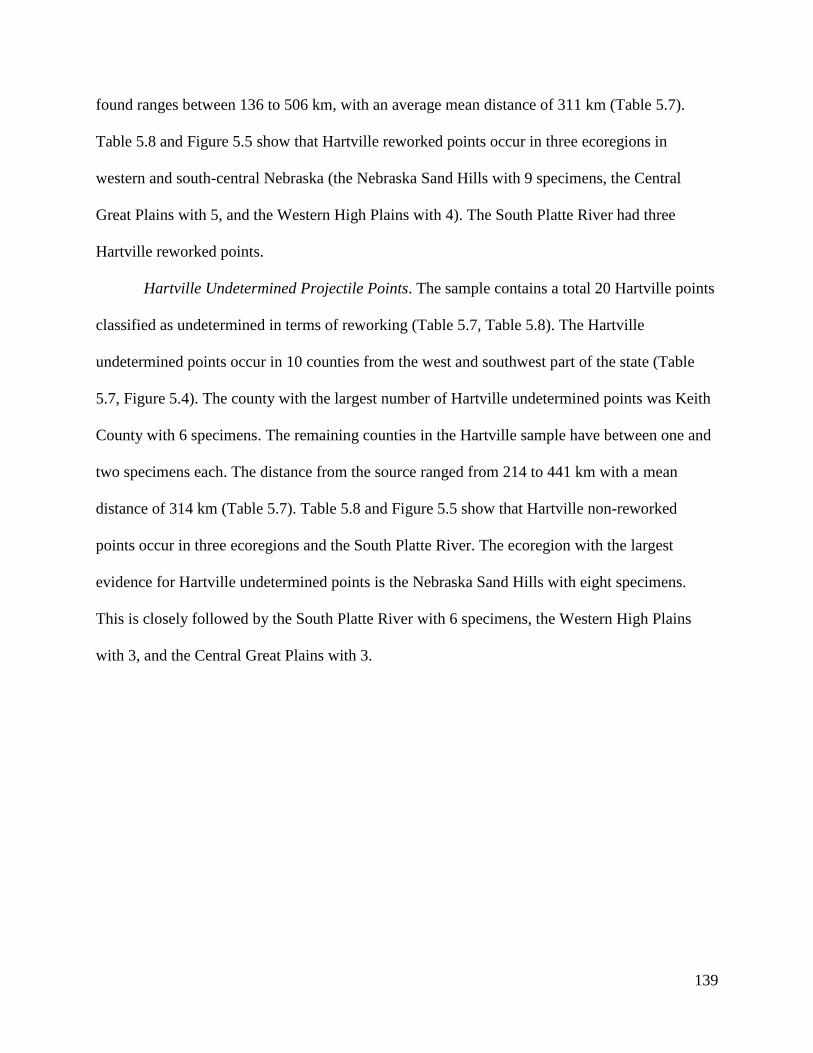
139
found ranges between 136 to 506 km, with an average mean distance of 311 km (Table 5.7).
Table 5.8 and Figure 5.5 show that Hartville reworked points occur in three ecoregions in
western and south-central Nebraska (the Nebraska Sand Hills with 9 specimens, the Central
Great Plains with 5, and the Western High Plains with 4). The South Platte River had three
Hartville reworked points.
Hartville Undetermined Projectile Points. The sample contains a total 20 Hartville points
classified as undetermined in terms of reworking (Table 5.7, Table 5.8). The Hartville
undetermined points occur in 10 counties from the west and southwest part of the state (Table
5.7, Figure 5.4). The county with the largest number of Hartville undetermined points was Keith
County with 6 specimens. The remaining counties in the Hartville sample have between one and
two specimens each. The distance from the source ranged from 214 to 441 km with a mean
distance of 314 km (Table 5.7). Table 5.8 and Figure 5.5 show that Hartville non-reworked
points occur in three ecoregions and the South Platte River. The ecoregion with the largest
evidence for Hartville undetermined points is the Nebraska Sand Hills with eight specimens.
This is closely followed by the South Platte River with 6 specimens, the Western High Plains
with 3, and the Central Great Plains with 3.
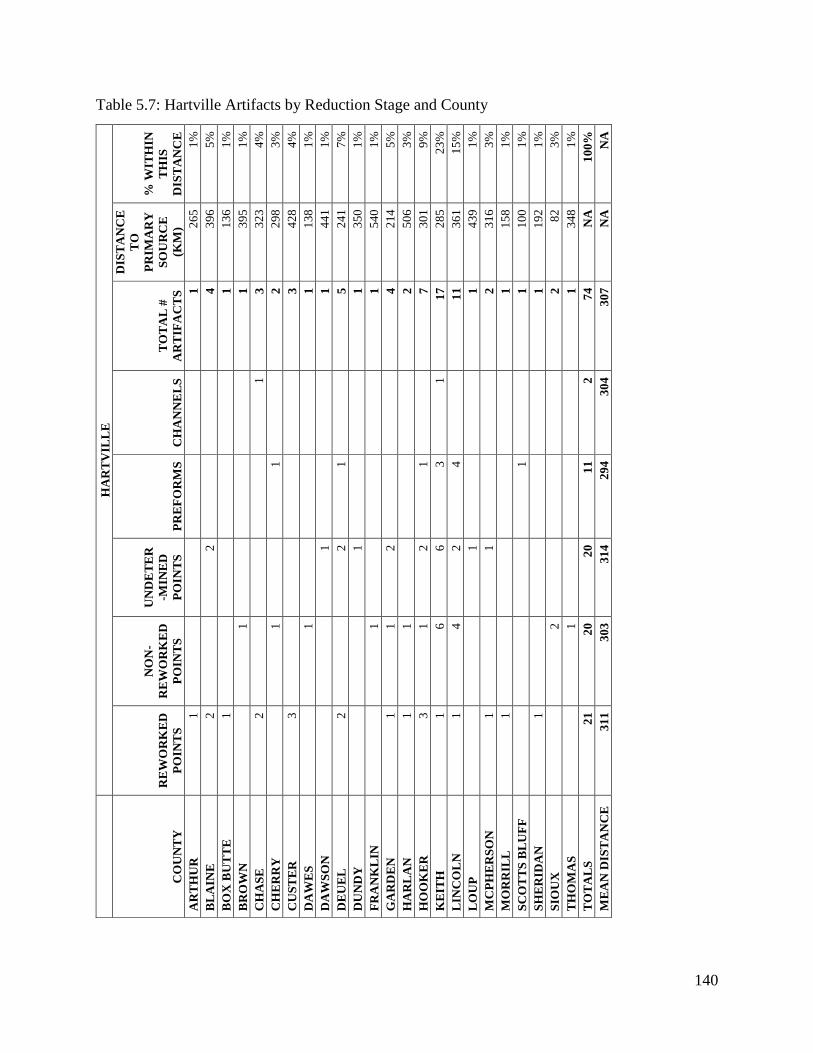
140
Table 5.7: Hartville Artifacts by Reduction Stage and County
H
AR
TV
ILL
E
CO
UN
TY
RE
WO
RK
ED
PO
INT
S
NO
N-
RE
WO
RK
ED
PO
INT
S
UN
DE
TE
R
-MIN
ED
PO
INT
S
PR
EF
OR
MS
C
HA
NN
EL
S
TO
TA
L #
AR
TIF
AC
TS
DIS
TA
NC
E
TO
PR
IMA
RY
SO
UR
CE
(KM
)
% W
ITH
IN
TH
IS
DIS
TA
NC
E
AR
TH
UR
1
1
2
65
1%
BL
AIN
E
2
2
4
3
96
5%
BO
X B
UT
TE
1
1
1
36
1%
BR
OW
N
1
1
39
5
1%
CH
AS
E
2
1
3
3
23
4%
CH
ER
RY
1
1
2
29
8
3%
CU
ST
ER
3
3
4
28
4%
DA
WE
S
1
1
13
8
1%
DA
WS
ON
1
1
4
41
1%
DE
UE
L
2
2
1
5
24
1
7%
DU
ND
Y
1
1
35
0
1%
FR
AN
KL
IN
1
1
54
0
1%
GA
RD
EN
1
1
2
4
2
14
5%
HA
RL
AN
1
1
2
50
6
3%
HO
OK
ER
3
1
2
1
7
30
1
9%
KE
ITH
1
6
6
3
1
1
7
28
5
23
%
LIN
CO
LN
1
4
2
4
11
36
1
15
%
LO
UP
1
1
4
39
1%
MC
PH
ER
SO
N
1
1
2
3
16
3%
MO
RR
ILL
1
1
1
58
1%
SC
OT
TS
BL
UF
F
1
1
10
0
1%
SH
ER
IDA
N
1
1
19
2
1%
SIO
UX
2
2
8
2
3%
TH
OM
AS
1
1
3
48
1%
TO
TA
LS
2
1
20
20
11
2
74
NA
1
00
%
ME
AN
DIS
TA
NC
E
31
1
30
3
31
4
29
4
30
4
30
7
NA
N
A
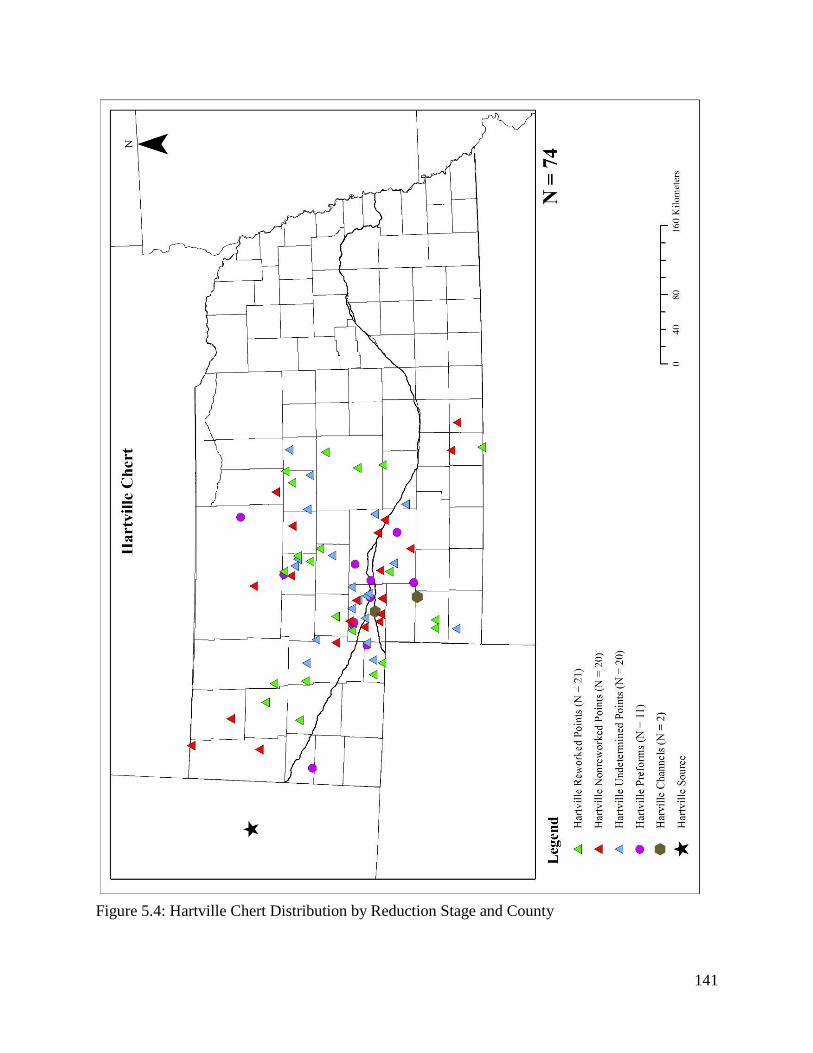
141
Figure 5.4: Hartville Chert Distribution by Reduction Stage and County
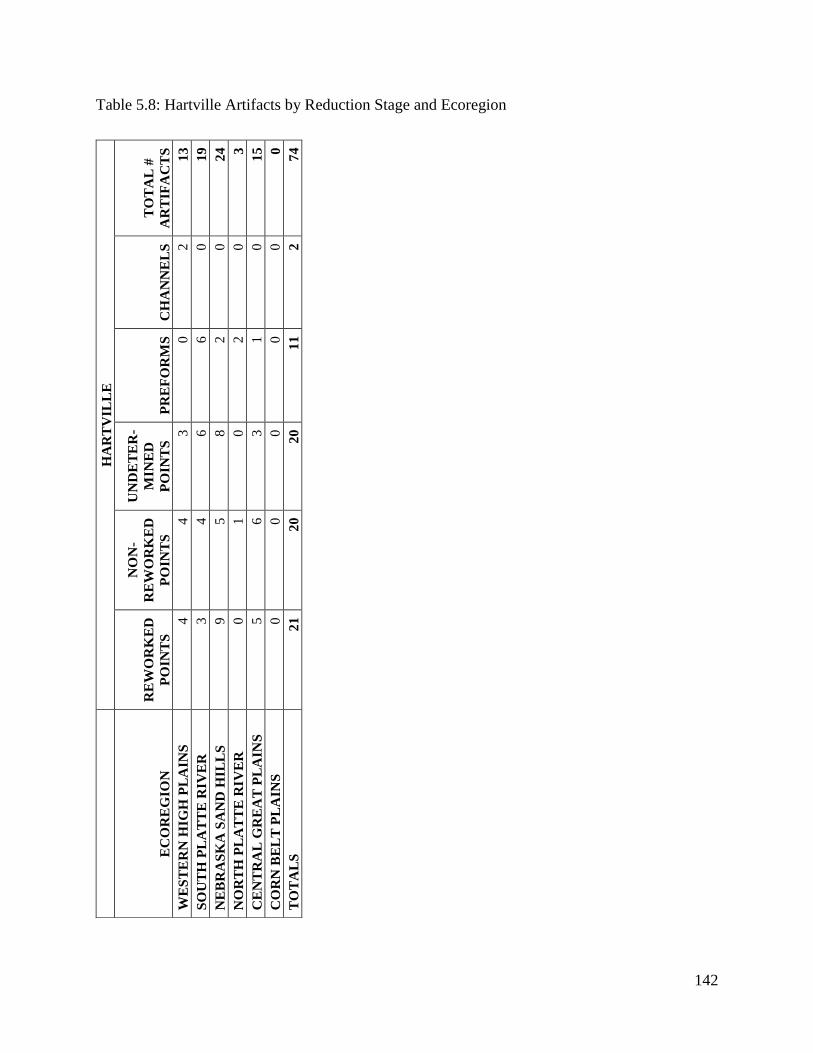
142
Table 5.8: Hartville Artifacts by Reduction Stage and Ecoregion
H
AR
TV
ILL
E
EC
OR
EG
ION
RE
WO
RK
ED
PO
INT
S
NO
N-
RE
WO
RK
ED
PO
INT
S
UN
DE
TE
R-
MIN
ED
PO
INT
S
PR
EF
OR
MS
C
HA
NN
EL
S
TO
TA
L #
AR
TIF
AC
TS
WE
ST
ER
N H
IGH
PL
AIN
S
4
4
3
0
2
13
SO
UT
H P
LA
TT
E R
IVE
R
3
4
6
6
0
19
NE
BR
AS
KA
SA
ND
HIL
LS
9
5
8
2
0
2
4
NO
RT
H P
LA
TT
E R
IVE
R
0
1
0
2
0
3
CE
NT
RA
L G
RE
AT
PL
AIN
S
5
6
3
1
0
15
CO
RN
BE
LT
PL
AIN
S
0
0
0
0
0
0
TO
TA
LS
2
1
20
20
11
2
74
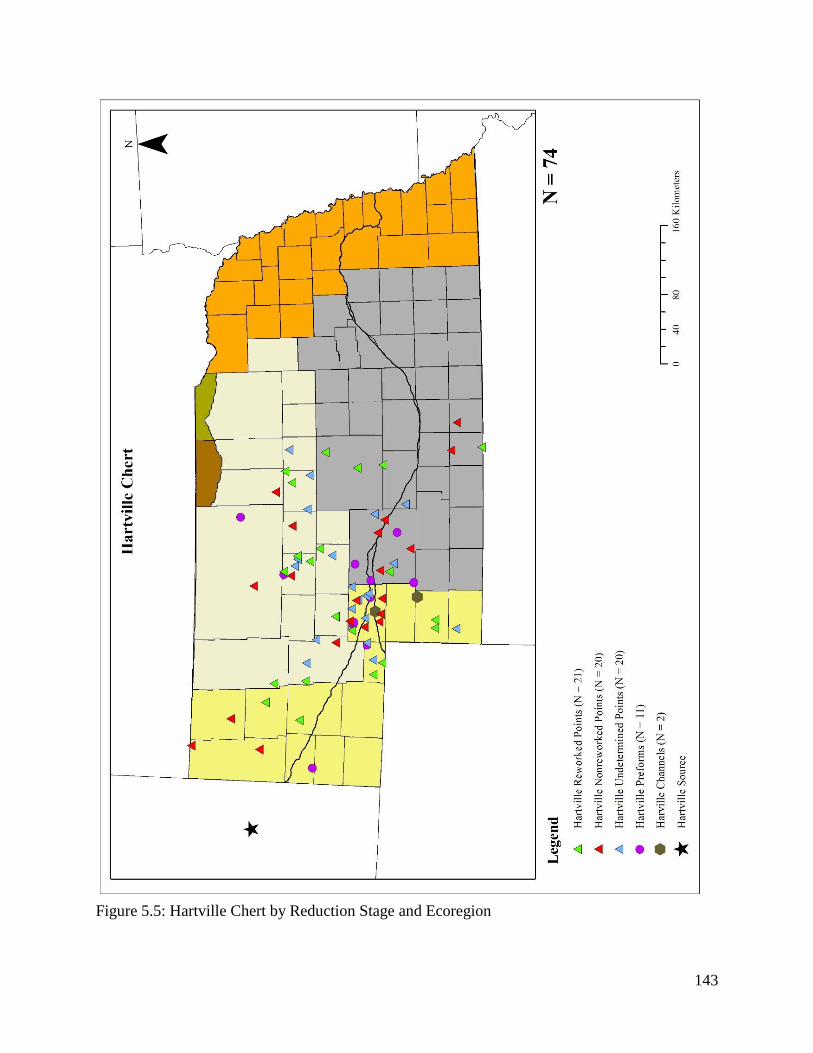
143
Figure 5.5: Hartville Chert by Reduction Stage and Ecoregion
144
Smoky Hill Jasper (SHJ): Overall Patterns
The primary sources of Smoky Hill Jasper (SHJ) are in the Republican River drainage in
south-central Nebraska and northern Kansas. The Nebraska Folsom sample contains a total 38
artifacts made of SHJ, comprising 12.4% of the total sample (Figure 5.1). Medicine Creek
Reservoir in Frontier County, Nebraska is the closest source for SHJ so this source was used to
determine distances. SHJ was moved into Nebraska from the west, northwest, north and
southeast direction from the source. This movement to the north and west could not have been by
alluvial transport. The maximum distance from the source area was 375 km in Sioux County in
the far northwest corner of Nebraska, while the minimum distance was 75 km to Harlan County
located in south-central Nebraska along the Kansas state border (Table 5.9, Figure 5.6). The
mean distance from the source to the center of the county was 141 km (Table 5.9).
The artifact types for the SHJ sample include 24 Folsom points, 4 Midland points, and 10
preforms. No evidence for SHJ channel flakes was documented (Table 5.1). The total number of
SHJ projectile points (Folsom and Midland) is 28 and breaks down into the following point
fragment types: 8 complete points, 12 point bases, 5 tips, and 3 blades (Table 5.2).
Table 5.3 and Figure 5.6 show that Harlan County has the most SHJ artifacts with 10
specimens. Other counties with evidence are Lincoln with 6 specimens, Chase with 5, Keith with
3, Nuckolls with 3, and Thayer with 3. Lincoln and Keith Counties are in the confluence of the
North and South Platte Rivers. Chase County is located in southwestern Nebraska. Harlan
County is located in the southern tier of Nebraska counties bordering Kansas and lies near
Franklin County, where the Medicine Creek Reservoir SHJ source area is located. Nuckolls and
Thayer Counties are also located in the southern tier of Nebraska counties but further to the east.
Seven other Nebraska counties have SHJ Folsom artifacts and contain between one and two
specimens each. Most of these are located in western Nebraska. One is located in the far
145
northwest corner of Nebraska in Sioux County and one in the north-centrally located Loup
County.
SHJ Folsom artifacts are found in 3 ecoregions and the South Platte River (Table 5.4 and
Figure 5.7). The Central Great Plains of Nebraska has the most evidence for SHJ artifacts with
20 specimens. The next highest frequency comes from the Western High Plains with nine SHJ
artifacts. The Nebraska Sand Hills and the South Platte River have four and five SHJ artifacts
respectively. The eastern and northeastern Nebraska ecoregions (the Corn Belt Plains,
Northwestern Glaciated Plains, and Northwest Great Plains) are void of SHJ evidence, as is the
North Platte River.
Comparison of the Overall Distribution and Frequency of Smoky Hill Jasper to White
River Group Silicates and Hartville. When we compare the overall frequency of Smoky Hill
Jasper to White River Group Silicates (WRGS) and Hartville we see that the overall frequencies
of WRGS and Hartville are greater than for Smoky Hill Jasper. Smoky Hill Jasper makes up an
important minority of the Central Plains Folsom database with 38 specimens, while WRGS has
96 and Hartville has 74 (Figure 5.1, Table 5.1). Table 5.1 shows that Smoky Hill Jasper
comprises 12.4% of the total sample, while WRGS comprises 31.4% and Hartville comprises
24.2%. Table 5.1 shows that Smoky Hill Jasper has fewer artifacts than WRGS and Hartville
across every artifact category (Folsom points, Midland points, preforms, and channel flakes).
A comparison of the spatial distributions shows that Smoky Hill Jasper artifacts in the
Central Plains Folsom dataset are found in 13 counties as opposed to 15 counties for WRGS and
24 counties for Hartville (Table 5.3). The counties with the greatest concentration of both WRGS
and Hartville artifacts were Keith and Lincoln—both located at the confluence of the North and
South Platte Rivers (Table 5.3; Figures 5.2 and 5.4). However, Smoky Hill Jasper showed a
146
different pattern. Smoky Hill Jasper artifacts were found in Keith and Lincoln counties, but the
greatest frequency and concentration for Smoky Hill Jasper artifacts was in Harlan County
located in south-central Nebraska along the southern tier of counties bordering Kansas (Table
5.3; Figure 5.6). While WRGS and Hartville artifacts were concentrated in the western half of
Nebraska, Smoky Hill Jasper also showed this pattern, but with an important number of artifacts
in the southern tier of counties along the Nebraska-Kansas border (i.e., Harlan, Nuckolls, and
Thayer Counties) (Figure 5.6). Hartville is better represented in the central and northwestern
parts of Nebraska than Smoky Hill Jasper and WRGS (Figures 5.2, 5.4, and 5.6).
Smoky Hill Jasper artifacts are better represented in the Central Great Plains ecoregion
than are WRGS and Hartville artifacts (Tables 5.6, 5.8, and 5.10; Figures 5.3, 5.5, and 5.7).
Smoky Hill Jasper has fewer artifacts in the Western High Plains, South Platte River, and
Nebraska Sand Hills than Hartville and WRGS. The North Platte River has no Smoky Hill Jasper
or WRGS artifacts. No Smoky Hill Jasper, WRGS, or Hartville artifacts were found in the
eastern and northeastern ecoregions of the Corn Belt Plains, Northwestern Great Plains, and the
Northwestern Glaciated Plains.
Smoky Hill Jasper (SHJ): Patterns in Reduction Stages
Smoky Hill Jasper Preforms. Table 5.9 and Figure 5.6 show the sample contains 10 SHJ
preforms from six counties. The largest evidence comes from Harlan County with three SHJ
preforms. The remaining counties (Chase, Lincoln, Loup, Nuckolls, and Thayer) have between
one and two SHJ preforms. The distance from the primary SHJ source ranged from 75 to 226 km
with a mean distance of 134 km (Table 5.9). The evidence for SHJ preforms comes from three
ecoregions and the South Platte River streambed (Table 5.10 and Figure 5.7). The Central Great
147
Plains had the most evidence with six, while the Western High Plains and Nebraska Sand Hills
contained one SHJ preform each. The South Platte River had two SHJ preforms.
Smoky Hill Jasper Channel Flakes. The sample contained no SHJ channel flakes (Tables
5.9 and 5.10). This lack of SHJ channel evidence is presumably a reflection of the limited
sample.
Smoky Hill Jasper Non-Reworked Projectile Points. The Nebraska Folsom sample has a
total of seven SHJ non-reworked points and these are found in five counties (Chase, Dundy,
Lincoln, Harlan and Thayer) all containing between one and two specimens each (Table 5.9 and
Figure 5.6). The distance from the source ranged between 75 and 226 km, with a mean distance
of 119 km (Table 5.9). Table 5.10 and Figure 5.7 show SHJ non-reworked points were found in
two ecoregions—the Western High Plains with three and the Central Great Plains with four.
Smoky Hill Jasper Reworked Projectile Points. Table 5.9 and Figure 5.6 show the
Nebraska Folsom sample has only 3 SHJ reworked points and these are found in three counties
(Harlan, Nuckolls, and Keith) each containing one specimen each. The maximum distance from
the source for SHJ reworked points was 188 km, while the shortest distance was 75 km and the
mean distance was 137 km (Table 5.9). SHJ reworked points were found in one ecoregion (the
Central Great Plains with two specimens) and the South Platte River had one specimen (Table
5.10 and Figure 5.7).
Smoky Hill Jasper Undetermined Projectile Points. The sample contains 18 SHJ points
that were classified as undetermined in terms of reworking (Table 5.9, Figure 5.6). The evidence
for undetermined points is scattered across 10 counties. The greatest evidence for SHJ
undetermined points was found in Harlan (four specimens) and Lincoln (three specimens)
Counties. The remaining counties had one to two specimens each (Banner, Chase, Deuel,
148
Garden, Hooker, Keith, Nuckolls, and Sioux). The distance to the primary SHJ source ranged
between 75 and 375 km with a mean distance of 154 km (Table 5.9). Undetermined SHJ points
are found in three ecoregions and the South Platte River (Table 5.10, Figure 5.7). The Central
Great Plains had the most evidence with eight SHJ undetermined points. The Western High
Plains had five and the Nebraska Sand Hills had three. The South Platte River had two
specimens. The eastern and northeastern Nebraska ecoregions (the Corn Belt Plains,
Northwestern Glaciated Plains, and Northwest Great Plains) as well as the North Platte River had
no SHJ undetermined points.
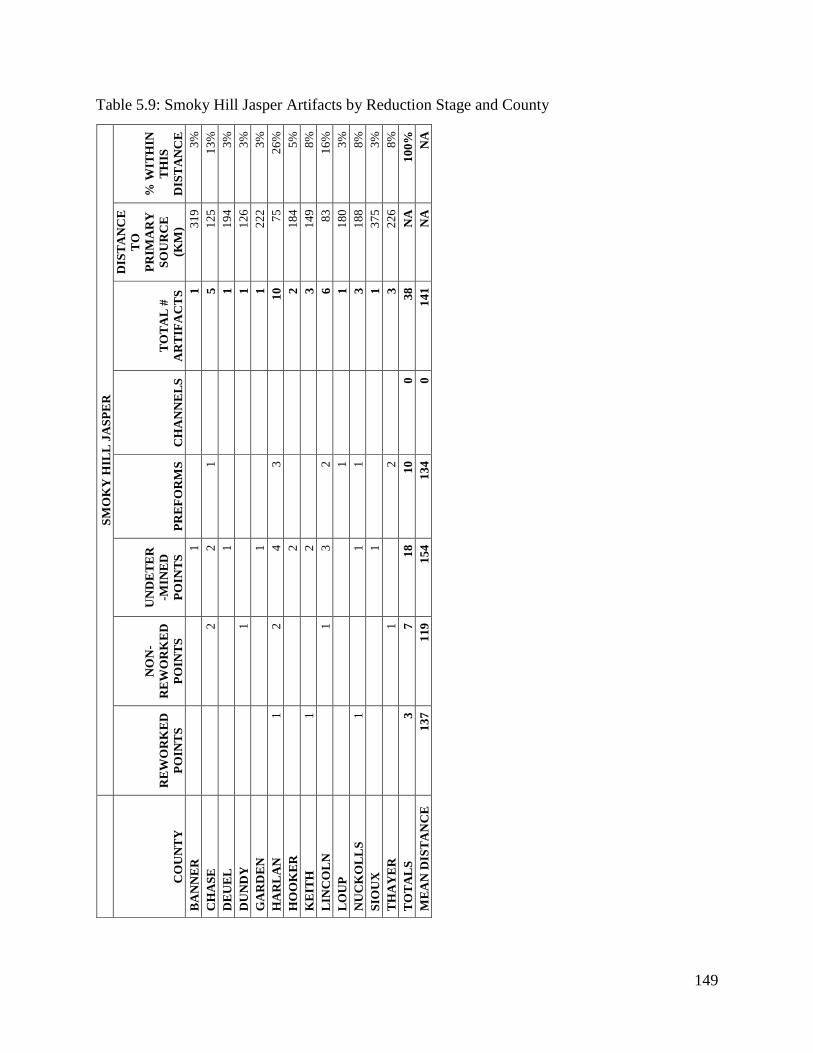
149
Table 5.9: Smoky Hill Jasper Artifacts by Reduction Stage and County
S
MO
KY
HIL
L J
AS
PE
R
CO
UN
TY
RE
WO
RK
ED
PO
INT
S
NO
N-
RE
WO
RK
ED
PO
INT
S
UN
DE
TE
R
-MIN
ED
PO
INT
S
PR
EF
OR
MS
C
HA
NN
EL
S
TO
TA
L #
AR
TIF
AC
TS
DIS
TA
NC
E
TO
PR
IMA
RY
SO
UR
CE
(KM
)
% W
ITH
IN
TH
IS
DIS
TA
NC
E
BA
NN
ER
1
1
3
19
3%
CH
AS
E
2
2
1
5
12
5
13
%
DE
UE
L
1
1
19
4
3%
DU
ND
Y
1
1
12
6
3%
GA
RD
EN
1
1
2
22
3%
HA
RL
AN
1
2
4
3
10
75
26
%
HO
OK
ER
2
2
1
84
5%
KE
ITH
1
2
3
14
9
8%
LIN
CO
LN
1
3
2
6
8
3
16
%
LO
UP
1
1
1
80
3%
NU
CK
OL
LS
1
1
1
3
1
88
8%
SIO
UX
1
1
3
75
3%
TH
AY
ER
1
2
3
22
6
8%
TO
TA
LS
3
7
1
8
10
0
38
NA
1
00
%
ME
AN
DIS
TA
NC
E
13
7
11
9
15
4
13
4
0
14
1
NA
N
A
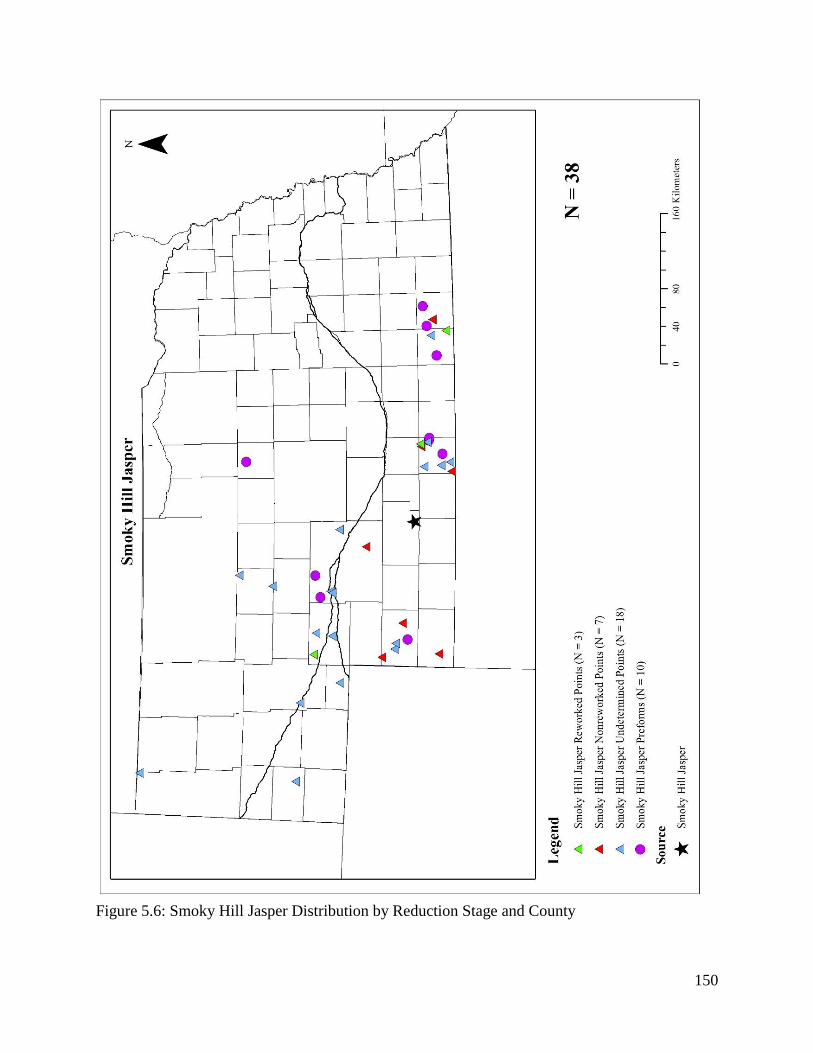
150
Figure 5.6: Smoky Hill Jasper Distribution by Reduction Stage and County
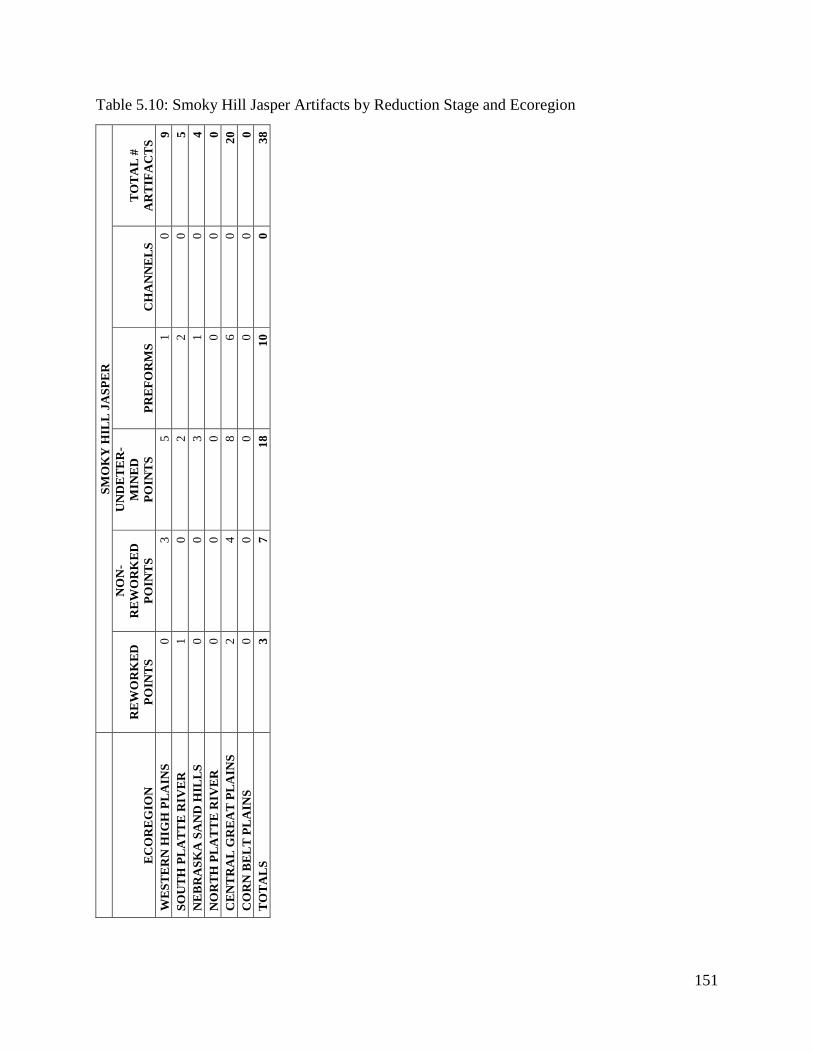
151
Table 5.10: Smoky Hill Jasper Artifacts by Reduction Stage and Ecoregion
S
MO
KY
HIL
L J
AS
PE
R
EC
OR
EG
ION
RE
WO
RK
ED
PO
INT
S
NO
N-
RE
WO
RK
ED
PO
INT
S
UN
DE
TE
R-
MIN
ED
PO
INT
S
PR
EF
OR
MS
C
HA
NN
EL
S
TO
TA
L #
AR
TIF
AC
TS
WE
ST
ER
N H
IGH
PL
AIN
S
0
3
5
1
0
9
SO
UT
H P
LA
TT
E R
IVE
R
1
0
2
2
0
5
NE
BR
AS
KA
SA
ND
HIL
LS
0
0
3
1
0
4
NO
RT
H P
LA
TT
E R
IVE
R
0
0
0
0
0
0
CE
NT
RA
L G
RE
AT
PL
AIN
S
2
4
8
6
0
20
CO
RN
BE
LT
PL
AIN
S
0
0
0
0
0
0
TO
TA
LS
3
7
1
8
10
0
38
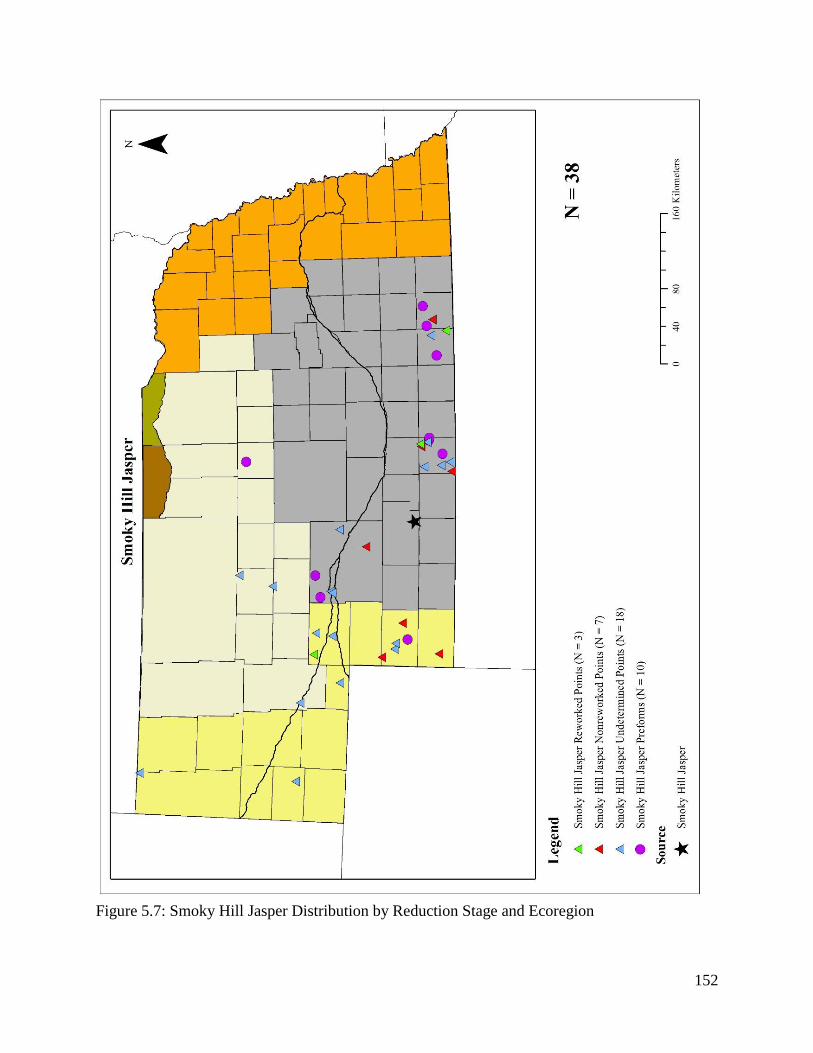
152
Figure 5.7: Smoky Hill Jasper Distribution by Reduction Stage and Ecoregion
153
Patterns in White River Group Silicates (WRGS), Hartville, and Smoky Hill Jasper (SHJ)
Preforms
Figures 5.8 and 5.9 show the distributions for preforms of the three main lithic materials
and their respective source areas—White River Group Silicates (WRGS), Hartville, and Smoky
Hill Jasper (SHJ). The figures show a small overlap between the Hartville and WRGS preform
spatial distributions. A small overlap between SHJ and WRGS preform distributions also exists.
The only overlap between Harville and SHJ preforms is in Keith County.
The importance of the preform distributions is that preforms capture an intermediate
stage of production that finished points do not. Preforms being found away from the source
indicate that not all production happens at the source (Figures 5.8 and 5.9). They are a clear
indication that points are produced as needed during movement across the landscape. Preforms
being found at a distance from the source is an indication that bifaces or flake blank preforms are
being transported for potential use and reflect the scale of transporting that lithic material as
staged material, not as finished implements.
The Nebraska Folsom sample has 15 WRGS preforms found at a distance of 159 to 233
km from the source with a mean distance of 188 km (Table 5.5). The majority of the WRGS
preform evidence, nine preforms, were found 159 km from the source (those from Chase and
Keith Counties). Five WRGS preforms were found in Lincoln County at a distance of 233 km
and one was found at similar distance of 227 km in Hooker County. The sample had 11 Hartville
preforms found between 100 and 361 km from the source with a mean of 294 km (Table 5.7).
The majority of the Hartville preforms, seven preforms, were found in Lincoln and Keith
Counties at a distance of 361 and 285 km respectively. Two Hartville preforms were found in
Cherry and Deuel Counties at a distance of 298 and 241 km respectively. One Hartville preform
was found 100 km from the source in Scotts Bluff County. The Nebraska Folsom sample had 10
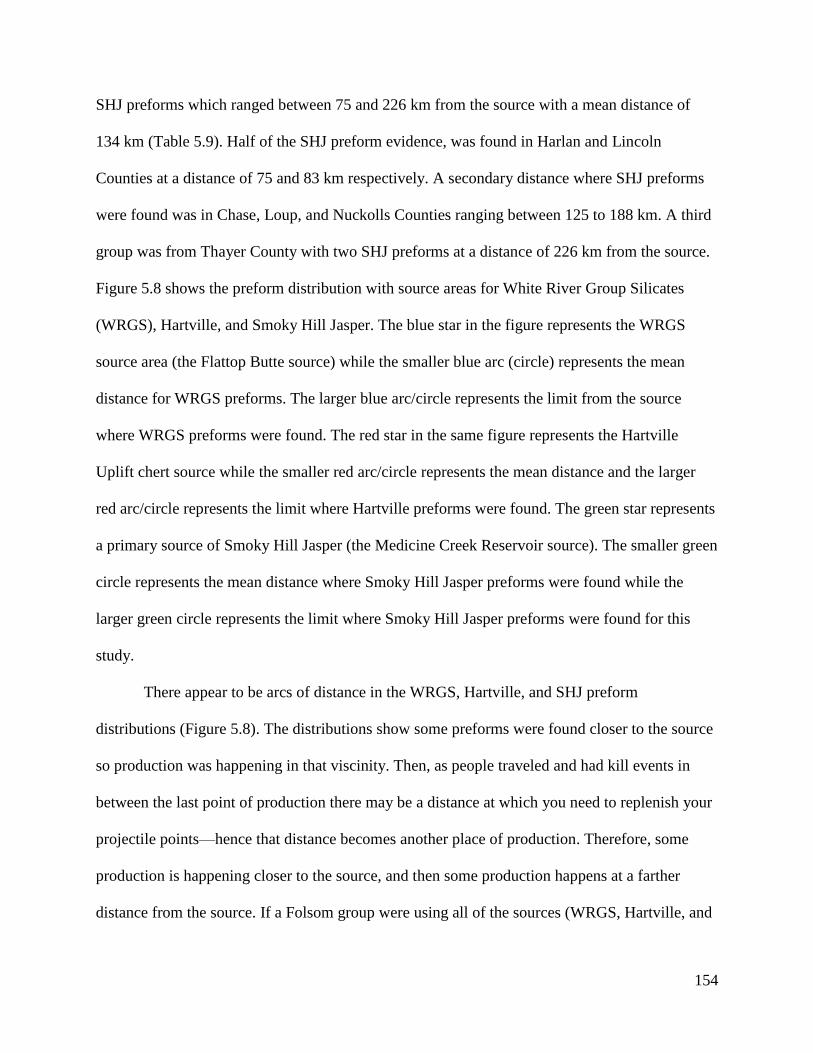
154
SHJ preforms which ranged between 75 and 226 km from the source with a mean distance of
134 km (Table 5.9). Half of the SHJ preform evidence, was found in Harlan and Lincoln
Counties at a distance of 75 and 83 km respectively. A secondary distance where SHJ preforms
were found was in Chase, Loup, and Nuckolls Counties ranging between 125 to 188 km. A third
group was from Thayer County with two SHJ preforms at a distance of 226 km from the source.
Figure 5.8 shows the preform distribution with source areas for White River Group Silicates
(WRGS), Hartville, and Smoky Hill Jasper. The blue star in the figure represents the WRGS
source area (the Flattop Butte source) while the smaller blue arc (circle) represents the mean
distance for WRGS preforms. The larger blue arc/circle represents the limit from the source
where WRGS preforms were found. The red star in the same figure represents the Hartville
Uplift chert source while the smaller red arc/circle represents the mean distance and the larger
red arc/circle represents the limit where Hartville preforms were found. The green star represents
a primary source of Smoky Hill Jasper (the Medicine Creek Reservoir source). The smaller green
circle represents the mean distance where Smoky Hill Jasper preforms were found while the
larger green circle represents the limit where Smoky Hill Jasper preforms were found for this
study.
There appear to be arcs of distance in the WRGS, Hartville, and SHJ preform
distributions (Figure 5.8). The distributions show some preforms were found closer to the source
so production was happening in that viscinity. Then, as people traveled and had kill events in
between the last point of production there may be a distance at which you need to replenish your
projectile points—hence that distance becomes another place of production. Therefore, some
production is happening closer to the source, and then some production happens at a farther
distance from the source. If a Folsom group were using all of the sources (WRGS, Hartville, and
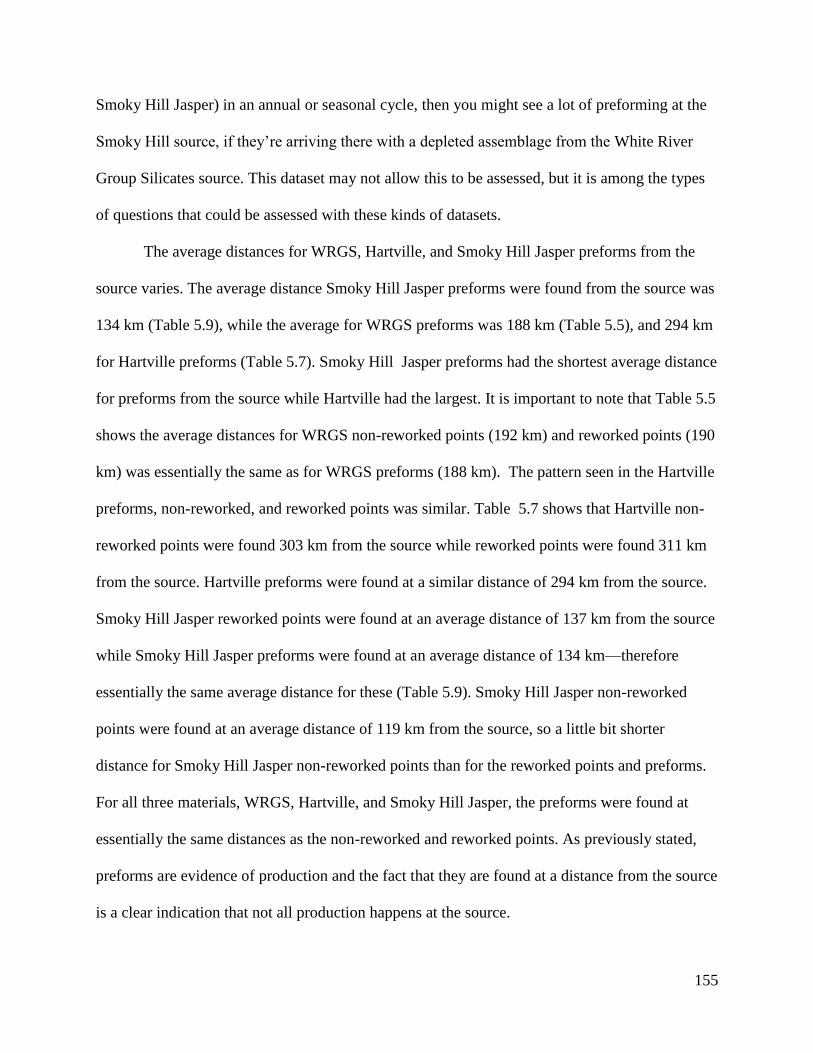
155
Smoky Hill Jasper) in an annual or seasonal cycle, then you might see a lot of preforming at the
Smoky Hill source, if they’re arriving there with a depleted assemblage from the White River
Group Silicates source. This dataset may not allow this to be assessed, but it is among the types
of questions that could be assessed with these kinds of datasets.
The average distances for WRGS, Hartville, and Smoky Hill Jasper preforms from the
source varies. The average distance Smoky Hill Jasper preforms were found from the source was
134 km (Table 5.9), while the average for WRGS preforms was 188 km (Table 5.5), and 294 km
for Hartville preforms (Table 5.7). Smoky Hill Jasper preforms had the shortest average distance
for preforms from the source while Hartville had the largest. It is important to note that Table 5.5
shows the average distances for WRGS non-reworked points (192 km) and reworked points (190
km) was essentially the same as for WRGS preforms (188 km). The pattern seen in the Hartville
preforms, non-reworked, and reworked points was similar. Table 5.7 shows that Hartville non-
reworked points were found 303 km from the source while reworked points were found 311 km
from the source. Hartville preforms were found at a similar distance of 294 km from the source.
Smoky Hill Jasper reworked points were found at an average distance of 137 km from the source
while Smoky Hill Jasper preforms were found at an average distance of 134 km—therefore
essentially the same average distance for these (Table 5.9). Smoky Hill Jasper non-reworked
points were found at an average distance of 119 km from the source, so a little bit shorter
distance for Smoky Hill Jasper non-reworked points than for the reworked points and preforms.
For all three materials, WRGS, Hartville, and Smoky Hill Jasper, the preforms were found at
essentially the same distances as the non-reworked and reworked points. As previously stated,
preforms are evidence of production and the fact that they are found at a distance from the source
is a clear indication that not all production happens at the source.
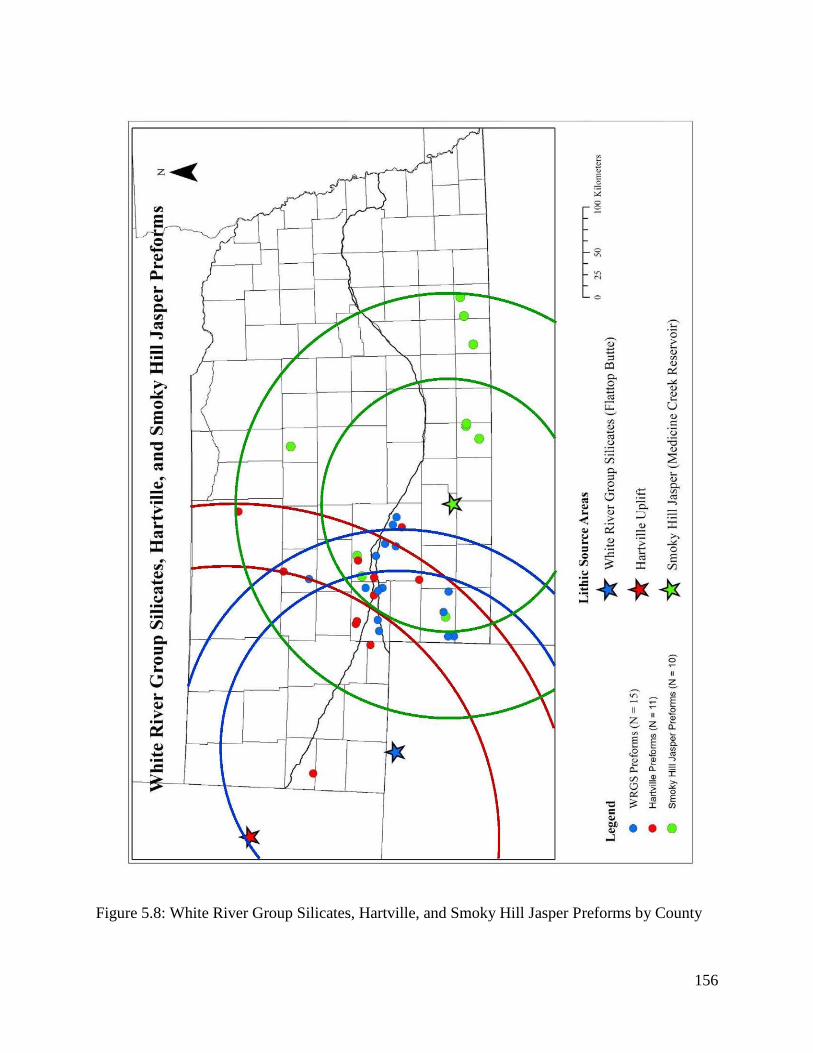
156
Figure 5.8: White River Group Silicates, Hartville, and Smoky Hill Jasper Preforms by County
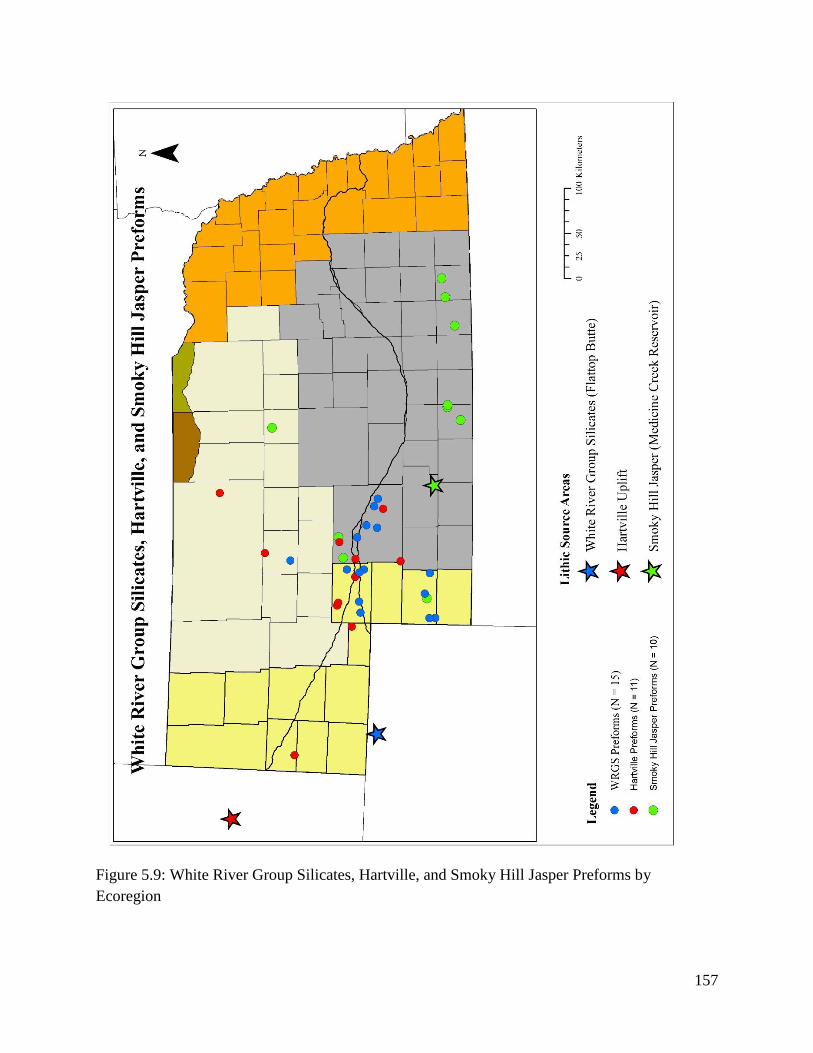
157
Figure 5.9: White River Group Silicates, Hartville, and Smoky Hill Jasper Preforms by
Ecoregion
158
Permian Chert Patterns
Permian cherts have outcrops in southeastern Nebraska and the Flint Hills of Kansas.
Figure 5.10 shows the primary Permian source (used to conservatively determine distances from
source for this study) was the Florence “B” source at the north end of the Flint Hills, just east of
Beatrice, Nebraska in Gage County. Permian chert was moved in a western, northwestern, and
eastern direction from this source (and from other potential source areas further south). The
Nebraska Folsom sample contains 10 Permian chert artifacts making up 3.3% of the total sample
(Figure 5.1). The maximum distance from the source was 363 km to Lincoln County while the
minimum was 32 km to Pawnee County (Table 5.11).
The artifact types for the Permian sample include 7 Folsom points and three preforms
(Table 5.1). No Permian chert Midland points or channel flakes were documented. The Permian
Folsom points are represented in the following fragment types: 1 complete point, 4 bases, and 2
blades (Table 5.2).
Tables 5.3 and 5.11, and Figure 5.10 show that Permian artifacts occurred in five
Nebraska counties. The county with the most Permian chert artifacts was Jefferson which is near
primary Permian sources in Gage County in southeastern Nebraska. Jefferson County contains
half of the Permian sample with 5 artifacts (Figure 10). Two other counties in southeastern
Nebraska had Permian artifacts—Pawnee and Nuckolls. The other two counties with Permian
specimens are Harlan County in south-central Nebraska and Lincoln County which includes the
confluence of the North and South Platte River. It is interesting to note that Permian chert seems
to follow a different pattern from other material types in this study in that little evidence for
Permian chert Folsom artifacts was found in the North and South Platte Confluence.
159
Permian artifacts are documented in two ecoregions (Table 5.12 and Figure 5.11). The south-
centrally located Central Great Plains had the most Permian chert evidence with nine artifacts.
The eastern Nebraska ecoregion, the Corn Belt Plains, had one Permian artifact.
Permian Chert: Patterns in Reduction Stages
Permian Chert Preforms. The sample has three Permian chert preforms (Table 5.11 and
5.12). Two of these were found in Jefferson County located 48 km from the source (Table 5.11
and Figure 5.10). One was found in Nuckolls County some 124 km from the source. Both
Jefferson and Nuckolls Counties are located in southeastern Nebraska and neighbor Gage County
where a primary Permian chert source is located. Table 5.12 and Figure 5.11 show that all three
Permian chert preforms are from the Central Great Plains ecoregion in south-central Nebraska.
Permian Chert Channel Flakes. No evidence for Permian chert channel flakes was documented
in this study (Tables 5.11 and 5.12).
Permian Chert Non-Reworked Projectile Points. The Nebraska Folsom sample has a total
of three non-reworked points (Tables 5.11 and 5.12). Table 5.11 and Figure 5.10 show the
Permian chert non-reworked points occur in Lincoln County at the North and South Platte River
confluence, Harlan County in south-central Nebraska, and Pawnee County in southeast
Nebraska. The Permian non-reworked points lie between 32 and 363 km from the source (Table
5.11). Permian non-reworked points are found in two Nebraska ecoregions. The south-centrally
located Central Great Plains has two while the Corn Belt Plains located in the eastern quarter of
Nebraska has 1 (Table 5.12, Figure 5.11).
Permian Chert Reworked Projectile Points. The Nebraska Folsom sample does not
include documented evidence of Permian reworked points (Tables 5.11 and 5.12).
160
Permian Chert Undetermined Projectile Points. The sample contains four Permian chert
points with undetermined reworking (Tables 5.11 and 5.12). Three Permian undetermined points
were found in Jefferson County while Nuckolls County had one (Table 5.11, Figure 5.10). Both
of these counties are in the southern tier of Nebraska counties near the Nebraska-Kansas border
and lie between 48 and 124 km from Permian chert sources near Beatrice, Nebraska (Table
5.11). All four Permian undetermined points are from one ecoregion—the south-centrally located
Central Great Plains (Table 5.12 and Figure 5.11).
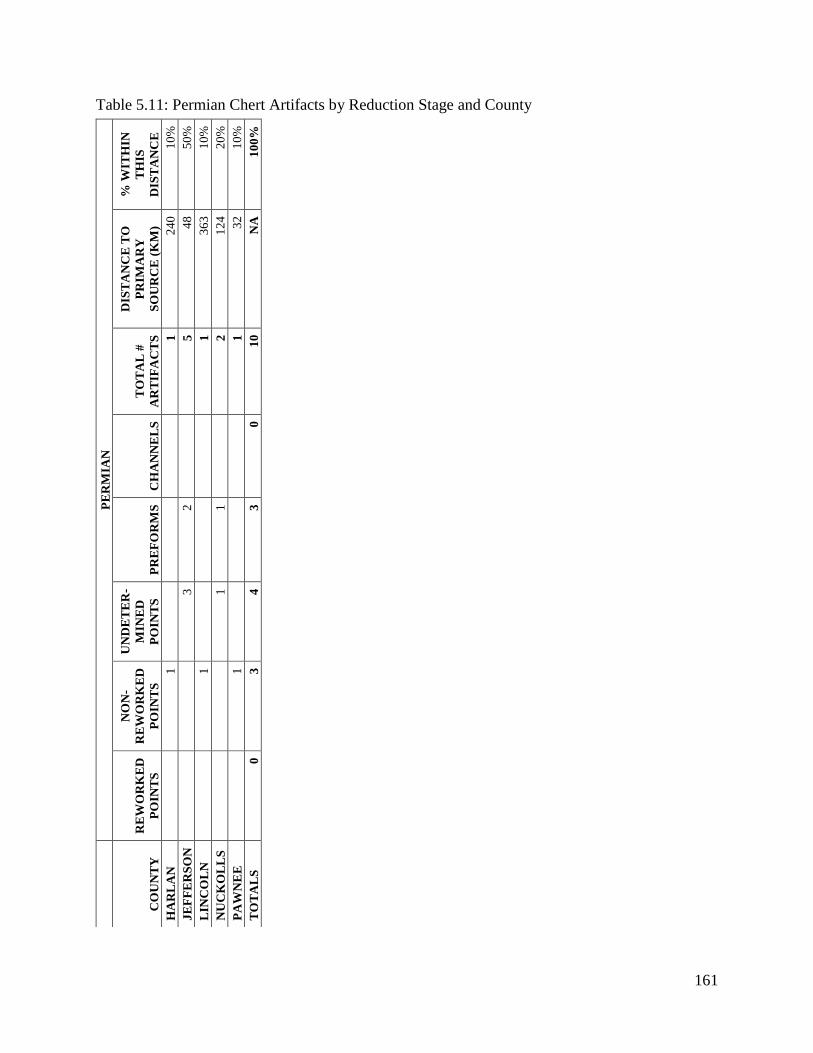
161
Table 5.11: Permian Chert Artifacts by Reduction Stage and County
P
ER
MIA
N
CO
UN
TY
RE
WO
RK
ED
PO
INT
S
NO
N-
RE
WO
RK
ED
PO
INT
S
UN
DE
TE
R-
MIN
ED
PO
INT
S
PR
EF
OR
MS
C
HA
NN
EL
S
TO
TA
L #
AR
TIF
AC
TS
DIS
TA
NC
E T
O
PR
IMA
RY
SO
UR
CE
(K
M)
% W
ITH
IN
TH
IS
DIS
TA
NC
E
HA
RL
AN
1
1
2
40
10
%
JE
FF
ER
SO
N
3
2
5
4
8
50
%
LIN
CO
LN
1
1
3
63
10
%
NU
CK
OL
LS
1
1
2
12
4
20
%
PA
WN
EE
1
1
3
2
10
%
TO
TA
LS
0
3
4
3
0
1
0
NA
1
00
%
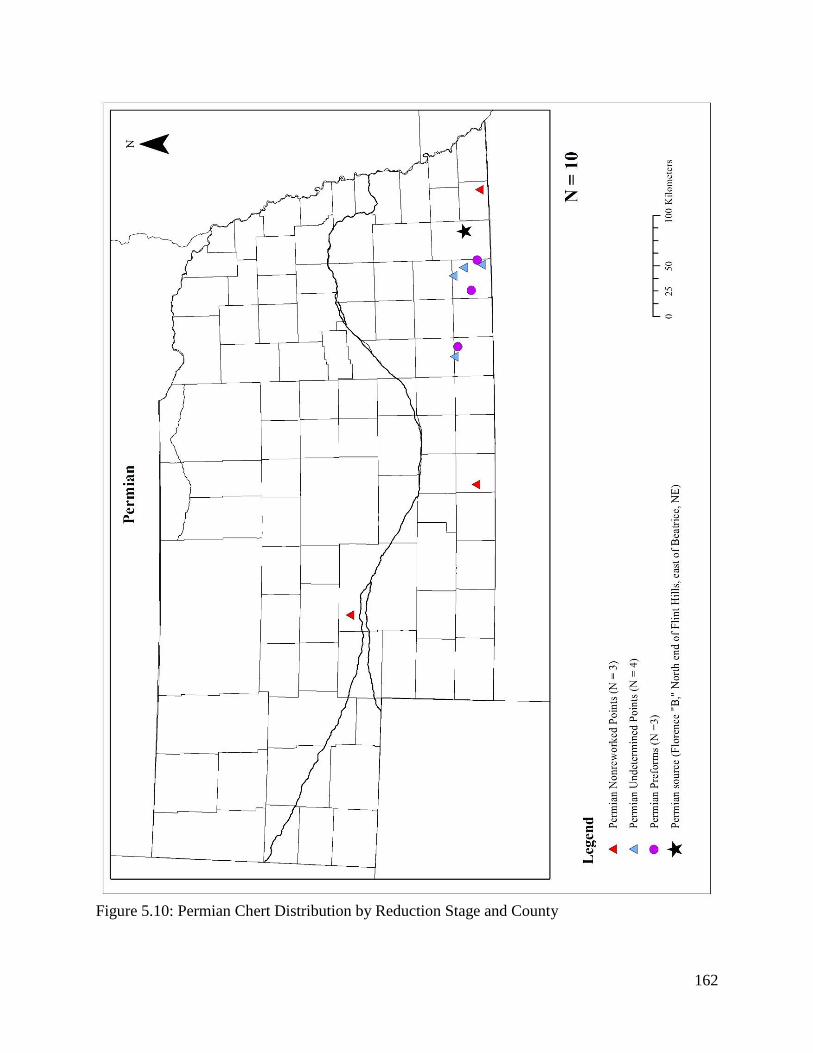
162
Figure 5.10: Permian Chert Distribution by Reduction Stage and County
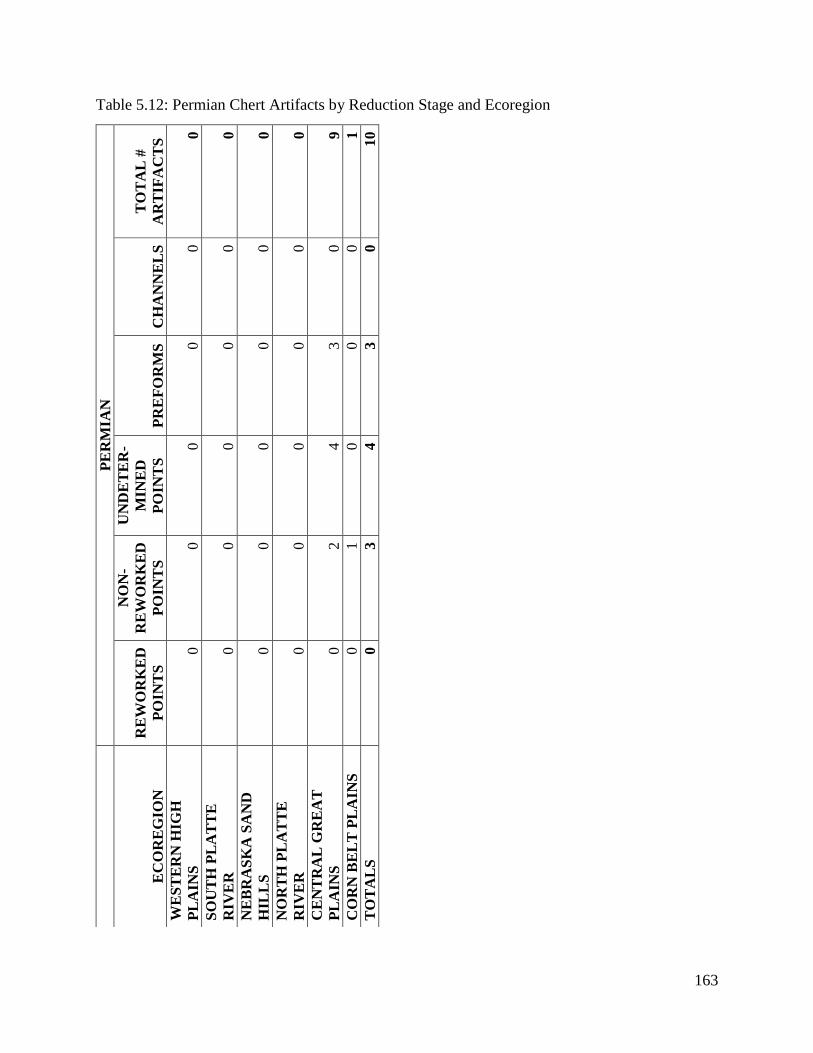
163
Table 5.12: Permian Chert Artifacts by Reduction Stage and Ecoregion
P
ER
MIA
N
EC
OR
EG
ION
RE
WO
RK
ED
PO
INT
S
NO
N-
RE
WO
RK
ED
PO
INT
S
UN
DE
TE
R-
MIN
ED
PO
INT
S
PR
EF
OR
MS
C
HA
NN
EL
S
TO
TA
L #
AR
TIF
AC
TS
WE
ST
ER
N H
IGH
PL
AIN
S
0
0
0
0
0
0
SO
UT
H P
LA
TT
E
RIV
ER
0
0
0
0
0
0
NE
BR
AS
KA
SA
ND
HIL
LS
0
0
0
0
0
0
NO
RT
H P
LA
TT
E
RIV
ER
0
0
0
0
0
0
CE
NT
RA
L G
RE
AT
PL
AIN
S
0
2
4
3
0
9
CO
RN
BE
LT
PL
AIN
S
0
1
0
0
0
1
TO
TA
LS
0
3
4
3
0
1
0
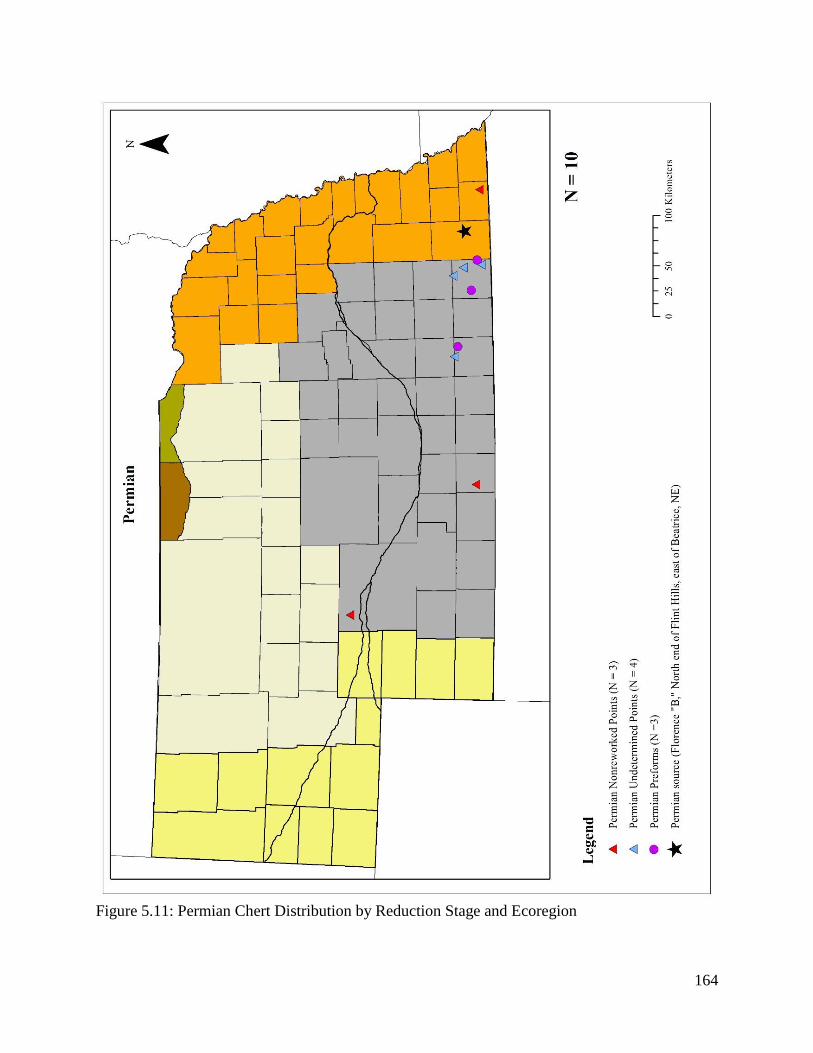
164
Figure 5.11: Permian Chert Distribution by Reduction Stage and Ecoregion
165
Fossil Wood Patterns
Sources of Fossil Wood are found in central Colorado and from residual secondary
sources outwashed from the west. This study assumed the Westfall Folsom site in east-central
Colorado as a primary Fossil Wood source area (Figure 5.12). The Westfall Folsom site is near a
good source of Black Forest petrified wood hence using this site as the source provided a
reasonable proxy source for determination of distances to source for Fossil Wood artifacts in this
sample. However, the majority of the Fossil Wood artifacts in the Central Plains Folsom
database are probably coming out of the Platte River Basin.
Twenty-two Fossil Wood artifacts are in the Nebraska Folsom sample making up 7.2% of
the total sample (Figure 5.1). The artifacts types represented in the Fossil Wood sample are 14
Folsom points, 3 Midland points, 4 preforms, and 1 channel flake (Table 5.1). The total number
of Fossil Wood projectile points (Folsom and Midland) is 17 and includes the following
fragment types: 6 complete points, 8 point bases, 2 tips, and 1 blade (Table 5.2).
All Fossil Wood artifacts were found in the western half of Nebraska with the exception
of one found in southeast Nebraska, in Nuckolls County (Figure 5.12). The largest concentration
of Fossil Wood artifacts is from the North and South Platte River confluence in Keith (with 11
artifacts) and Lincoln (with 4 artifacts) counties (Table 5.13, Figure 5.12). The other Fossil
Wood artifacts from western Nebraska were found in the following counties with one to two
specimens each: Dawson, Deuel, Garden, Hooker, and McPherson. The northeastern part of
Nebraska has no documented evidence of Folsom Fossil Wood artifacts (Figure 5.12).
Fossil Wood artifacts were found in three ecoregions in the western, north-central, and
south-central parts of the state (Tables 5.4 and 5.15, Figure 5.13). But, most Fossil Wood Folsom
artifacts were found in the South Platte River with 13 artifacts. The Western High Plains,
Nebraska Sand Hills, and Central Great Plains had 1, 4, and 4 Fossil Wood artifacts respectively.
166
The North Platte River and eastern and northeastern ecoregions (Corn Belt Plains, Northwestern
Great Plains, and Northwestern Glaciated Plains) had no documented evidence for Fossil Wood
Folsom artifacts.
Fossil Wood: Patterns in Reduction Stages
Fossil Wood Preforms. The sample has a total of four Fossil Wood preforms from two
counties. Keith County, at the heart of the confluence of the North and South Platte River
confluence, has the majority of the Fossil Wood preform evidence with three preforms. One was
found in Deuel County located in the western Nebraska panhandle next to Keith County (Table
5.14, Figure 5.12). Fossil Wood preforms were found 275 and 320 km from the Westfall site
source. All four Fossil Wood preforms were found in the South Platte River streambed (Table
5.15, Figure 5.13).
Fossil Wood Channel Flakes. Table 5.14 and Figure 5.12 show the sample has one Fossil
Wood channel flake found in Keith County found 320 km from the primary source. This channel
flake was found in the South Platte River streambed (Table 5.15, Figure 5.13).
Fossil Wood Non-Reworked Projectile Points. The sample has six Fossil Wood non-
reworked points (Table 5.14, Figure 5.12). Four of these were found in the North and South
Platte River confluence with Keith County having three and Lincoln with one. The other two
Fossil Wood non-reworked points were found in Garden and McPherson Counties located in
western Nebraska above the North Platte River. Fossil Wood non-reworked points were found
between 320 and 385 km from the source (Table 5.14). Fossil Wood non-reworked points were
found in the South Platte River and in one ecoregion. The majority of the Fossil Wood non-
reworked points were found in the South Platte River (with four artifacts), while the Nebraska
Sand Hills had two Fossil Wood non-reworked points (Table 5.15, Figure 5.13).
167
Fossil Wood Reworked Projectile Points. The Fossil Wood sample had three reworked
points, all of these were found in Keith and Lincoln Counties, in the heart of the North and South
Platte Rivers confluence (Table 5.14, Figure 5.12). The Fossil Wood artifacts were found
between 320 and 370 km from the Westfall site source area (Table 5.14). Table 5.15 and Figure
5.13 show the Fossil Wood reworked points were found in the South Platte River streambed (two
artifacts) and the Central Great Plains ecoregion (one artifact).
Fossil Wood Undetermined Projectile Points. Eight Fossil Wood points were classified as
undetermined in terms of reworking (Table 5.14, Figure 5.12). Half of these were found in the
North and South Platte River confluence in Keith and Lincoln Counties. The other Fossil Wood
undetermined points were found in western Nebraska (in Dawson, Hooker, and Garden
Counties), while one was from south-central Nebraska in Nuckolls County. Fossil Wood
undetermined points were found between 320 and 549 km from the Westfall site source area
(Table 5.14). Undetermined points made of Fossil Wood were found in three ecoregions
(Western High Plains, Nebraska Sand Hills, and Central Great Plains) and the South Platte River
each having one to three specimens each (Table 5.15, Figure 5.13).
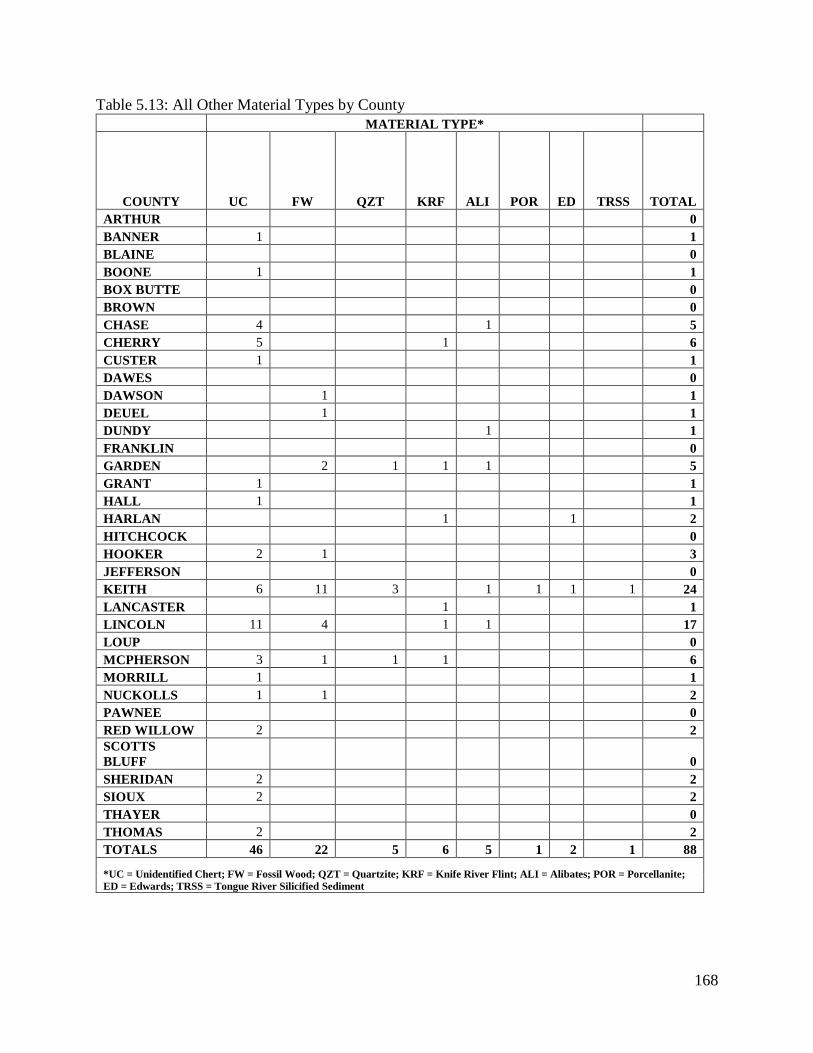
168
Table 5.13: All Other Material Types by County
MATERIAL TYPE*
COUNTY UC FW QZT KRF ALI POR ED TRSS TOTAL
ARTHUR 0
BANNER 1 1
BLAINE 0
BOONE 1 1
BOX BUTTE 0
BROWN 0
CHASE 4 1 5
CHERRY 5 1 6
CUSTER 1 1
DAWES 0
DAWSON 1 1
DEUEL 1 1
DUNDY 1 1
FRANKLIN 0
GARDEN 2 1 1 1 5
GRANT 1 1
HALL 1 1
HARLAN 1 1 2
HITCHCOCK 0
HOOKER 2 1 3
JEFFERSON 0
KEITH 6 11 3 1 1 1 1 24
LANCASTER 1 1
LINCOLN 11 4 1 1 17
LOUP 0
MCPHERSON 3 1 1 1 6
MORRILL 1 1
NUCKOLLS 1 1 2
PAWNEE 0
RED WILLOW 2 2
SCOTTS
BLUFF 0
SHERIDAN 2 2
SIOUX 2 2
THAYER 0
THOMAS 2 2
TOTALS 46 22 5 6 5 1 2 1 88
*UC = Unidentified Chert; FW = Fossil Wood; QZT = Quartzite; KRF = Knife River Flint; ALI = Alibates; POR = Porcellanite;
ED = Edwards; TRSS = Tongue River Silicified Sediment
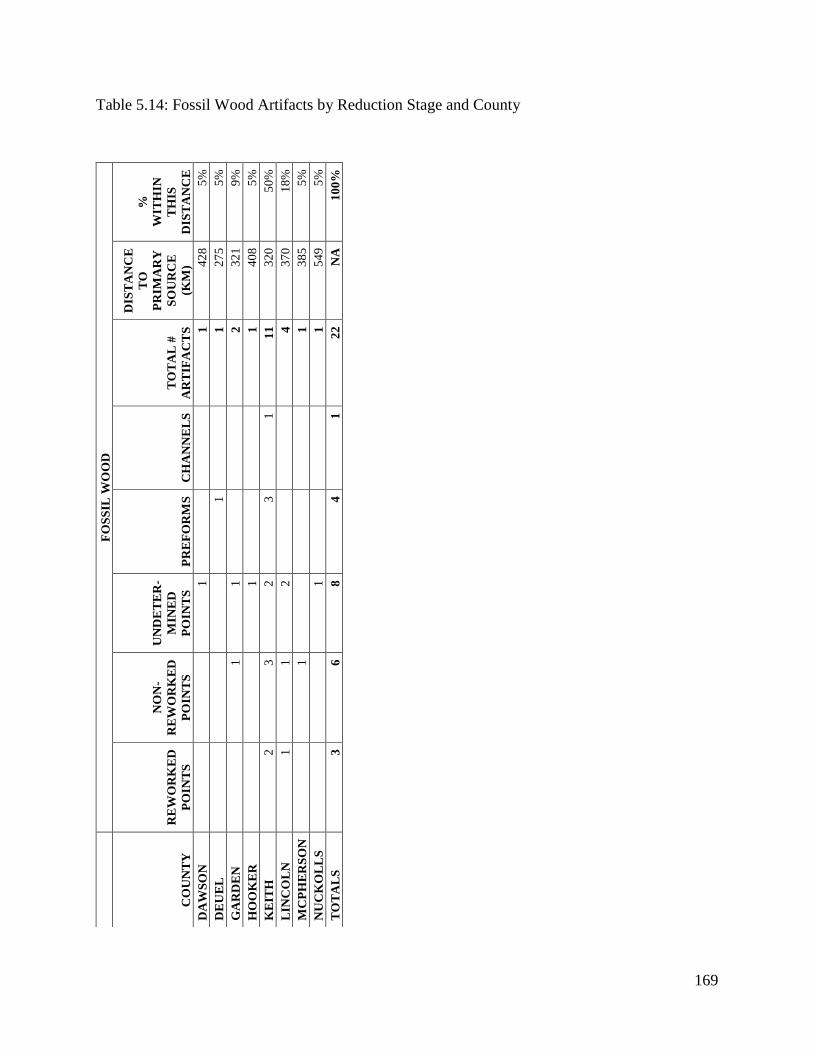
169
Table 5.14: Fossil Wood Artifacts by Reduction Stage and County
F
OS
SIL
WO
OD
CO
UN
TY
RE
WO
RK
ED
PO
INT
S
NO
N-
RE
WO
RK
ED
PO
INT
S
UN
DE
TE
R-
MIN
ED
PO
INT
S
PR
EF
OR
MS
C
HA
NN
EL
S
TO
TA
L #
AR
TIF
AC
TS
DIS
TA
NC
E
TO
PR
IMA
RY
SO
UR
CE
(KM
)
%
WIT
HIN
TH
IS
DIS
TA
NC
E
DA
WS
ON
1
1
4
28
5%
DE
UE
L
1
1
27
5
5%
GA
RD
EN
1
1
2
32
1
9%
HO
OK
ER
1
1
4
08
5%
KE
ITH
2
3
2
3
1
1
1
32
0
50
%
LIN
CO
LN
1
1
2
4
3
70
18
%
MC
PH
ER
SO
N
1
1
38
5
5%
NU
CK
OL
LS
1
1
5
49
5%
TO
TA
LS
3
6
8
4
1
2
2
NA
1
00
%
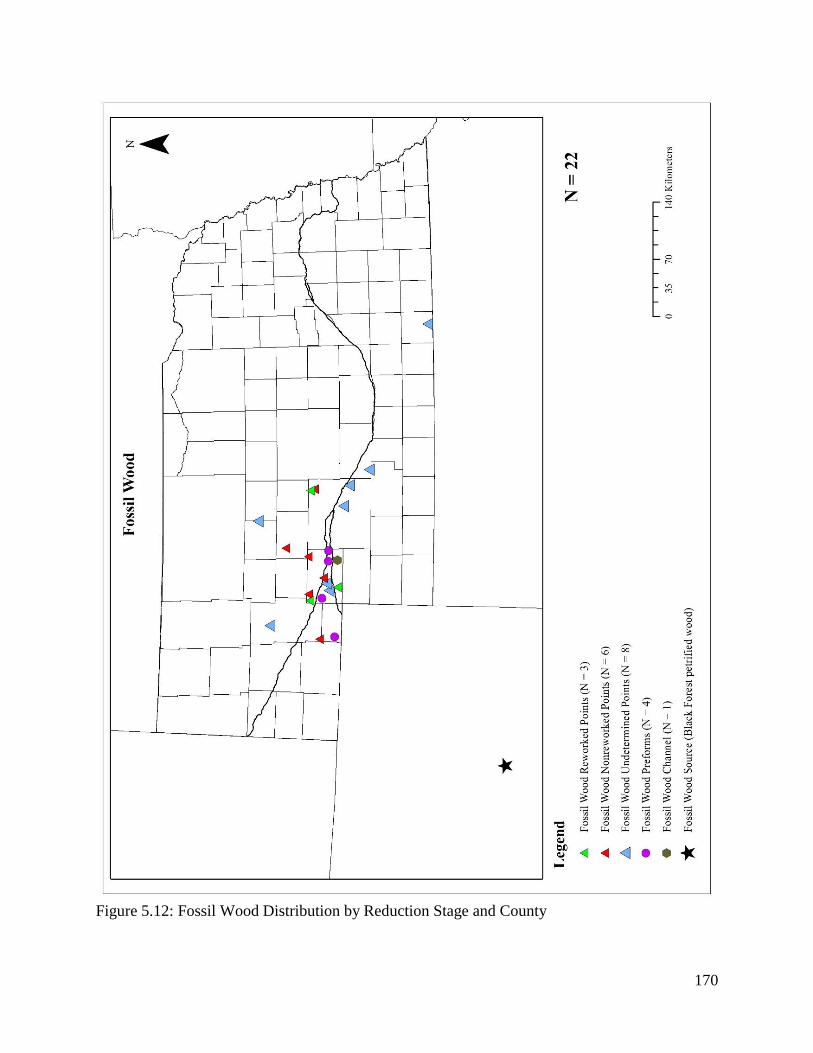
170
Figure 5.12: Fossil Wood Distribution by Reduction Stage and County
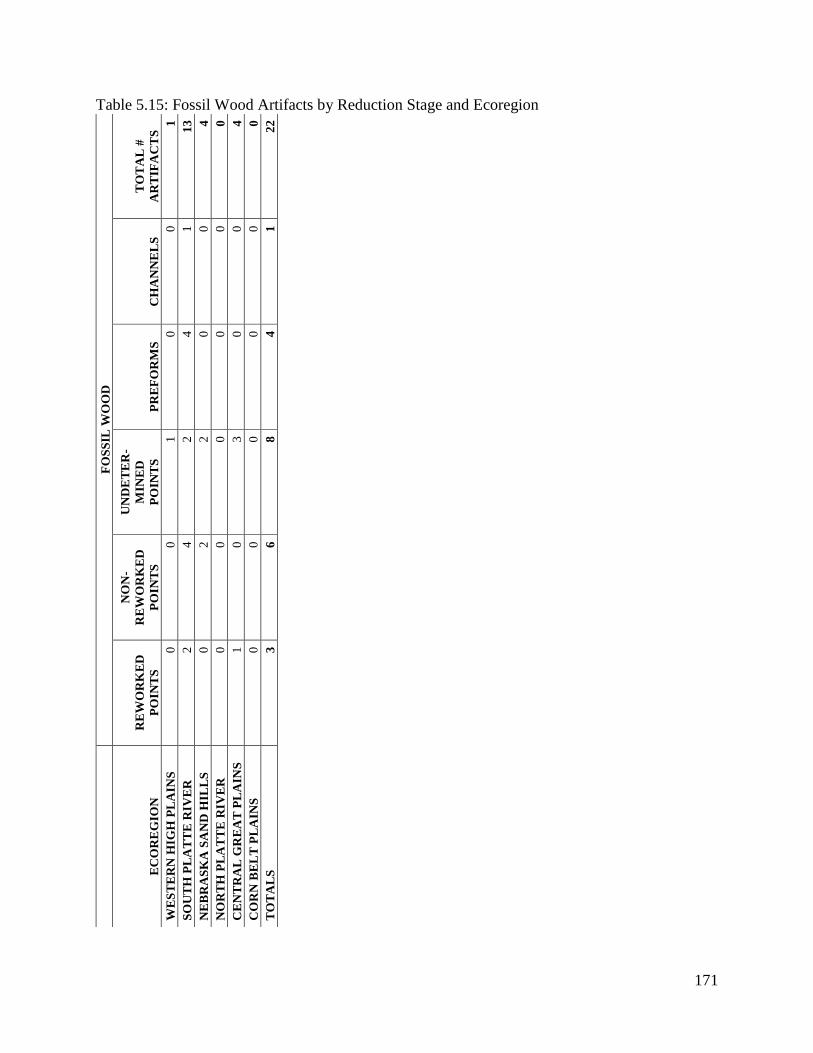
171
Table 5.15: Fossil Wood Artifacts by Reduction Stage and Ecoregion
F
OS
SIL
WO
OD
EC
OR
EG
ION
RE
WO
RK
ED
PO
INT
S
NO
N-
RE
WO
RK
ED
PO
INT
S
UN
DE
TE
R-
MIN
ED
PO
INT
S
PR
EF
OR
MS
C
HA
NN
EL
S
TO
TA
L #
AR
TIF
AC
TS
WE
ST
ER
N H
IGH
PL
AIN
S
0
0
1
0
0
1
SO
UT
H P
LA
TT
E R
IVE
R
2
4
2
4
1
13
NE
BR
AS
KA
SA
ND
HIL
LS
0
2
2
0
0
4
NO
RT
H P
LA
TT
E R
IVE
R
0
0
0
0
0
0
CE
NT
RA
L G
RE
AT
PL
AIN
S
1
0
3
0
0
4
CO
RN
BE
LT
PL
AIN
S
0
0
0
0
0
0
TO
TA
LS
3
6
8
4
1
2
2
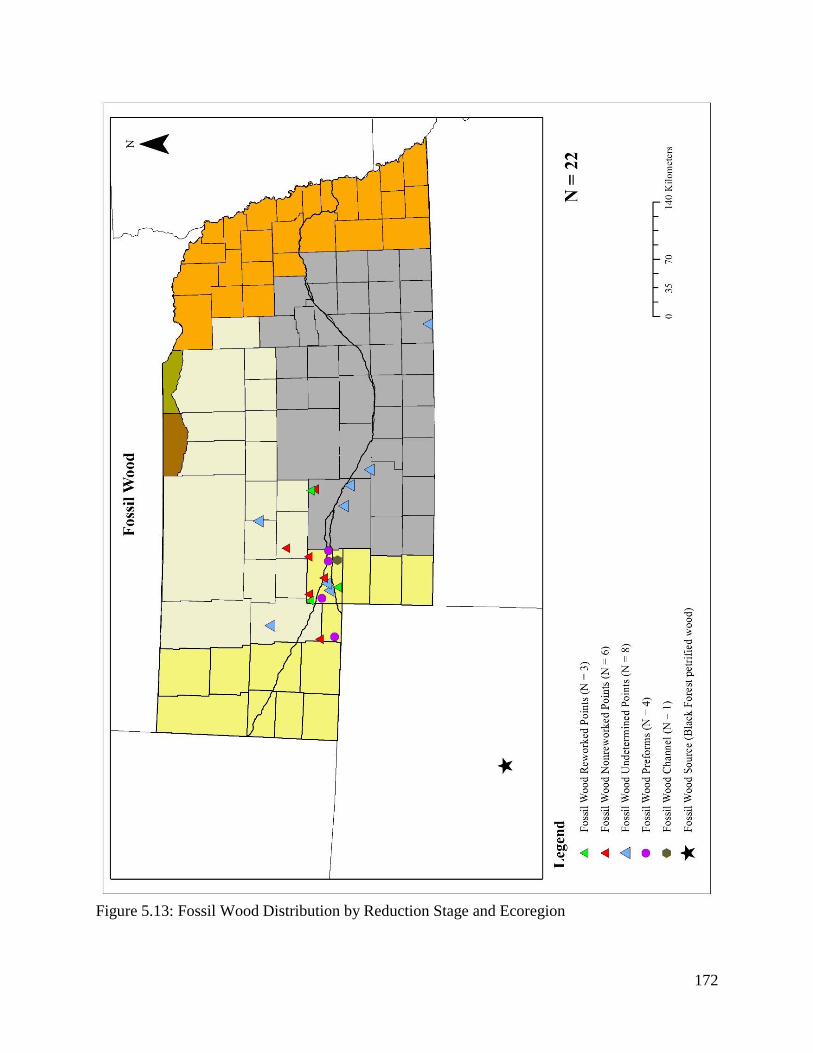
172
Figure 5.13: Fossil Wood Distribution by Reduction Stage and Ecoregion
173
Unidentified Lithic Materials Patterns
Forty-six of the artifacts in the Nebraska Folsom sample could not be identified as to
lithic source (Figure 5.1). Some of these specimens were not seen other than in photographs or
drawings and others simply could not be confidently identified to a specific lithic material.
Unidentified lithic materials make up 15% of the total Nebraska Folsom sample. The artifacts
made of unidentified lithic materials breakdown into the following artifact types: 39 Folsom
points, 4 Midland points, and 3 preforms (Table 5.1). The total number of Folsom and Midland
projectile points made of unidentified lithic materials is 43 and are classified into the following
fragment types: 14 complete points, 12 point bases, 7 tips, and 7 blades, and 3 points where
information was not available on fragment type (Table 5.2).
Artifacts made of unidentified lithic materials were found in 17 counties (Table 5.13,
Figure 5.14). Most of these counties lie in the western half of Nebraska (Sioux, Sheridan, Cherry,
Banner, Morrill, Grant, Hooker, Thomas, McPherson, Keith, Lincoln, Chase, and Red Willow).
The other counties with artifacts made of unidentified lithic materials are in central (Custer
County), south-central (Hall and Nuckolls Counties), and northeastern Nebraska (Boone
County). The counties with the largest number of Folsom artifacts made of unidentified materials
are Keith and Lincoln Counties at the confluence of the North and South Platte Rivers (Table
5.13, Figure 5.14).
Artifacts made of unidentified lithic materials are found in three ecoregions and the North
and South Platte Rivers (Table 5.17, Figure 5.15). The ecoregions with the greatest evidence for
artifacts made of unidentified lithic materials are the Nebraska Sand Hills and Central Great
Plains with 15 and 16 specimens respectively. The Western High Plains had 10 specimens. The
South Platte River streambed had three artifacts made of unidentified lithic materials and the
North Platte had two. No Folsom artifacts made of unidentified lithic materials were found in the
174
eastern (Corn Belt Plains) and the northeastern (Northwestern Great Plains and Northwestern
Glaciated Plains) ecoregions.
Unidentified Chert: Patterns in Reduction Stages
In general, the unidentified chert artifacts in the Central Plains Folsom database tend to
pattern like the overall pattern, with the exception that there are fewer unidentified chert artifacts
coming out of the South Platte River than for White River Group Silicates and Hartville artifact
samples. Also, two counties are represented in the unidentified chert artifacts—Boone and Hall.
These counties are in eastern Nebraska, but they are in the Central Great Plains ecoregion. These
two counties are not represented in the White River Group Silicates, Hartville, and Smoky Hill
Jasper samples.
Unidentified Chert Preforms. The sample has three preforms made of unidentified lithic
materials. Table 5.16 and Figure 5.14 show that of these came from the counties that lie in the
confluence of the North and South Platte Rivers (Keith and Lincoln Counties). The preforms
made of unidentified lithic materials came from the Western High Plains and the South Platte
River streambed (Table 5.17, Figure 5.15). The Nebraska Sand Hills, Central Great Plains, Corn
Belt Plains, Northwestern Glaciated Plains, Northwestern Great Plains, and North Platte River all
had no evidence for preforms made of unidentified lithic materials.
Unidentified Channel Flakes. The sample had no evidence for channel flakes made of
unidentified lithic materials (Tables 5.16 and 5.17).
Unidentified Chert Non-Reworked Projectile Points. The sample contains nine non-
reworked points made of unidentified lithic materials from seven Nebraska counties (Table 5.16,
Figure 5.14). The non-reworked points made of unidentified chert are distributed evenly between
the northwest (Sioux), west (Hooker, Thomas, McPherson, Keith, and Lincoln) and central
175
(Custer) parts of the state. The unidentified chert non-reworked points are from three ecoregions
and the North Platte River (Table 5.17, Figure 5.15). The Nebraska Sand Hills with four non-
reworked points had the most evidence, while the Western High Plains and Central Great Plains
had two each. The North Platte River had one non-reworked point. No evidence for non-
reworked points made of unidentified lithic materials were found in the South Platte,
Northwestern Glaciated Plains, Northwestern Great Plains, or Corn Belt Plains.
Unidentified Chert Reworked Projectile Points. Table 5.16 and Figure 5.14 show the
sample has nine reworked points made of unidentified lithic material and these occur in seven
Nebraska counties. The reworked points made of unidentified lithic materials were found in the
northwest (Sheridan, Cherry, McPherson Counties), southwest (Red Willow), south-central (Hall
and Nuckolls), and northeast (Boone) parts of the state. The reworked points made of
unidentified lithic materials occur in two ecoregions—the Central Great Plains with five of these
and the Nebraska Sand Hills with four (Table 5.17, Figure 5.15). The Western High Plains, Corn
Belt Plains, Northwestern Glaciated Plains, Northwestern Great Plains, and the North and South
Platte River had no evidence of reworked points made of unidentified materials.
Unidentified Chert Undetermined Projectile Points. Twenty-five points made of
unidentified lithic materials were classified as undetermined in terms of reworking. Table 5.16
and Figure 5.14 show these came from 11 counties in the northwestern (Sioux, Banner, Morrill,
Sheridan, Cherry, Grant, Hooker, and McPherson) and southwestern (Chase) parts of the state,
and the North and South Platte River confluence (Keith and Lincoln). Lincoln County had the
most evidence with nine undetermined points made of unidentified lithic materials. The
undetermined points made of unidentified lithic materials were found in three ecoregions and the
North and South Platte Rivers. The Nebraska Sand Hills, Western High Plains, and Central Great
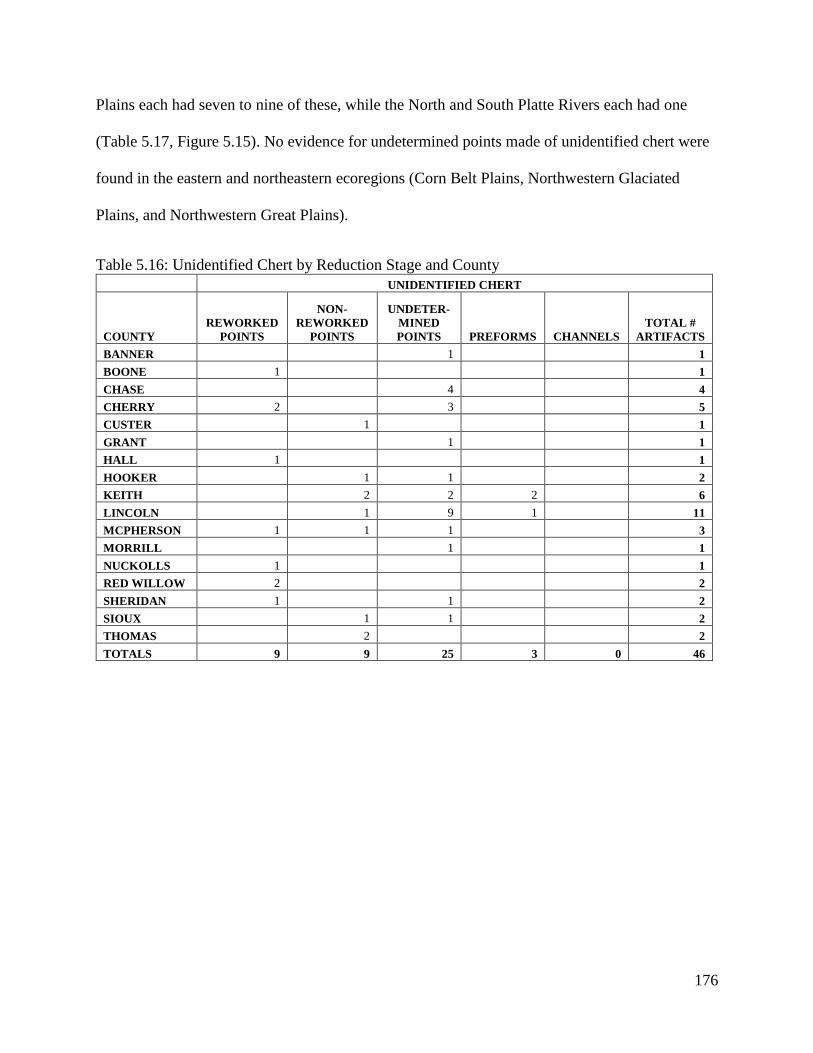
176
Plains each had seven to nine of these, while the North and South Platte Rivers each had one
(Table 5.17, Figure 5.15). No evidence for undetermined points made of unidentified chert were
found in the eastern and northeastern ecoregions (Corn Belt Plains, Northwestern Glaciated
Plains, and Northwestern Great Plains).
Table 5.16: Unidentified Chert by Reduction Stage and County
UNIDENTIFIED CHERT
COUNTY
REWORKED
POINTS
NON-
REWORKED
POINTS
UNDETER-
MINED
POINTS PREFORMS CHANNELS
TOTAL #
ARTIFACTS
BANNER 1 1
BOONE 1 1
CHASE 4 4
CHERRY 2 3 5
CUSTER 1 1
GRANT 1 1
HALL 1 1
HOOKER 1 1 2
KEITH 2 2 2 6
LINCOLN 1 9 1 11
MCPHERSON 1 1 1 3
MORRILL 1 1
NUCKOLLS 1 1
RED WILLOW 2 2
SHERIDAN 1 1 2
SIOUX 1 1 2
THOMAS 2 2
TOTALS 9 9 25 3 0 46
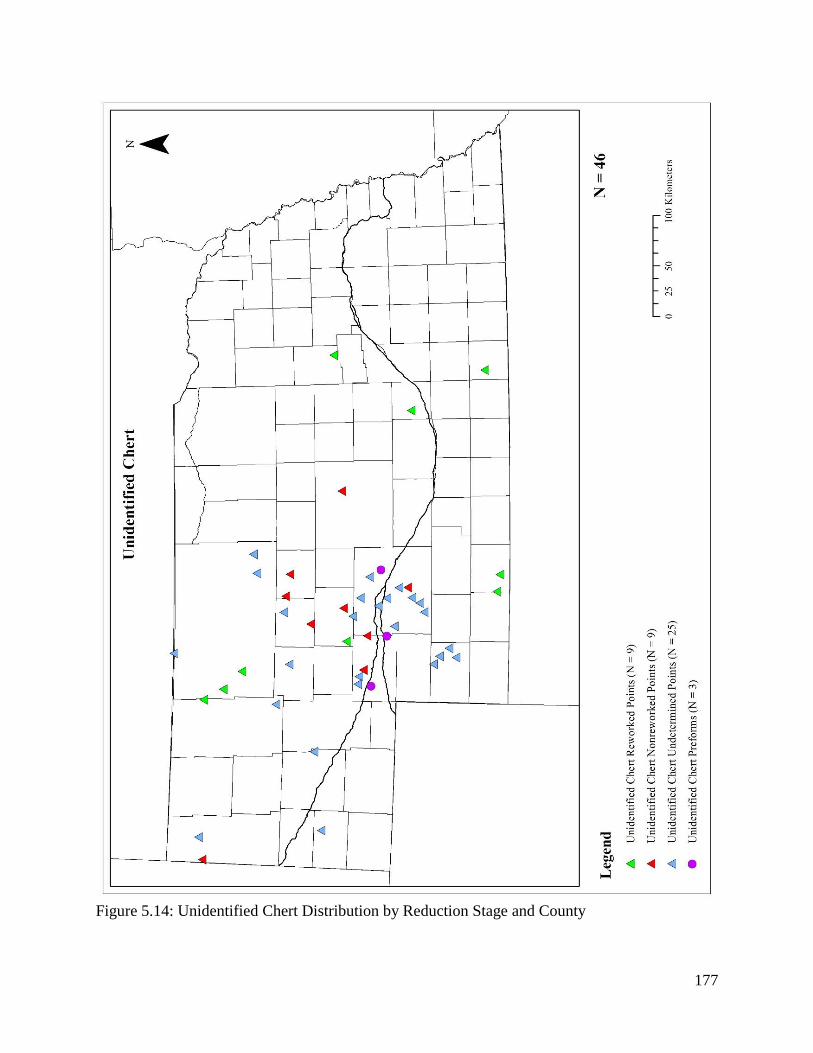
177
Figure 5.14: Unidentified Chert Distribution by Reduction Stage and County
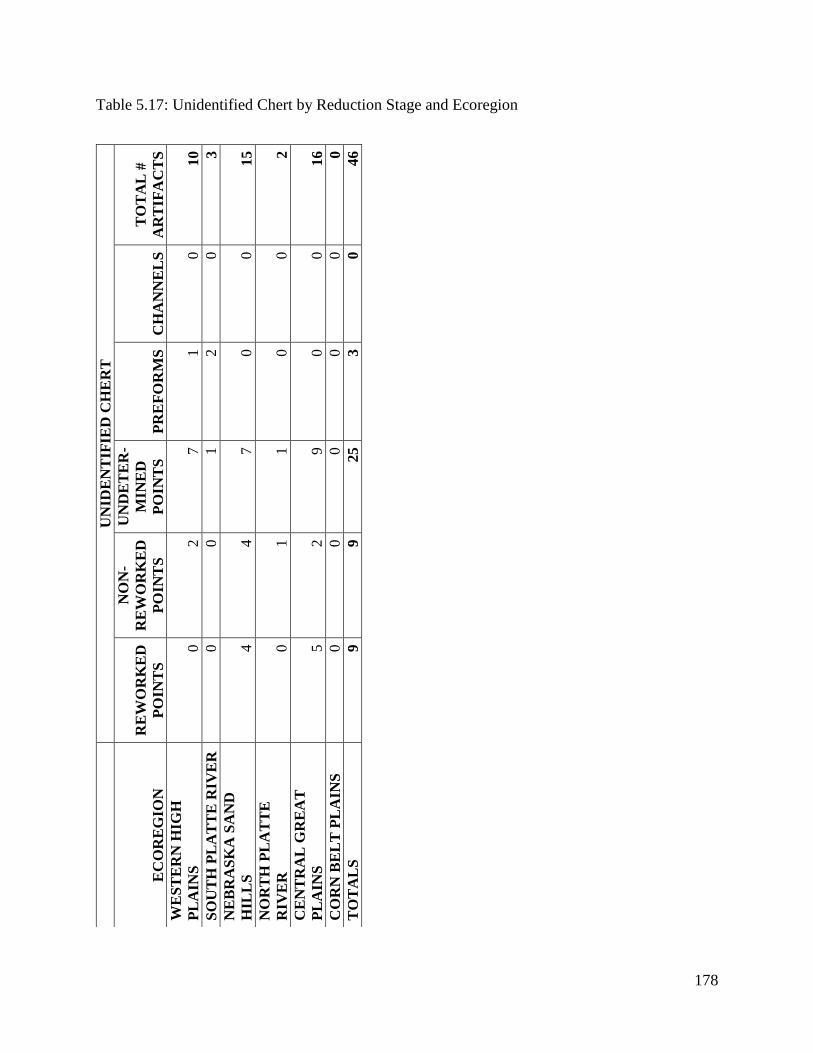
178
Table 5.17: Unidentified Chert by Reduction Stage and Ecoregion
U
NID
EN
TIF
IED
CH
ER
T
EC
OR
EG
ION
RE
WO
RK
ED
PO
INT
S
NO
N-
RE
WO
RK
ED
PO
INT
S
UN
DE
TE
R-
MIN
ED
PO
INT
S
PR
EF
OR
MS
C
HA
NN
EL
S
TO
TA
L #
AR
TIF
AC
TS
WE
ST
ER
N H
IGH
PL
AIN
S
0
2
7
1
0
10
SO
UT
H P
LA
TT
E R
IVE
R
0
0
1
2
0
3
NE
BR
AS
KA
SA
ND
HIL
LS
4
4
7
0
0
1
5
NO
RT
H P
LA
TT
E
RIV
ER
0
1
1
0
0
2
CE
NT
RA
L G
RE
AT
PL
AIN
S
5
2
9
0
0
16
CO
RN
BE
LT
PL
AIN
S
0
0
0
0
0
0
TO
TA
LS
9
9
2
5
3
0
46
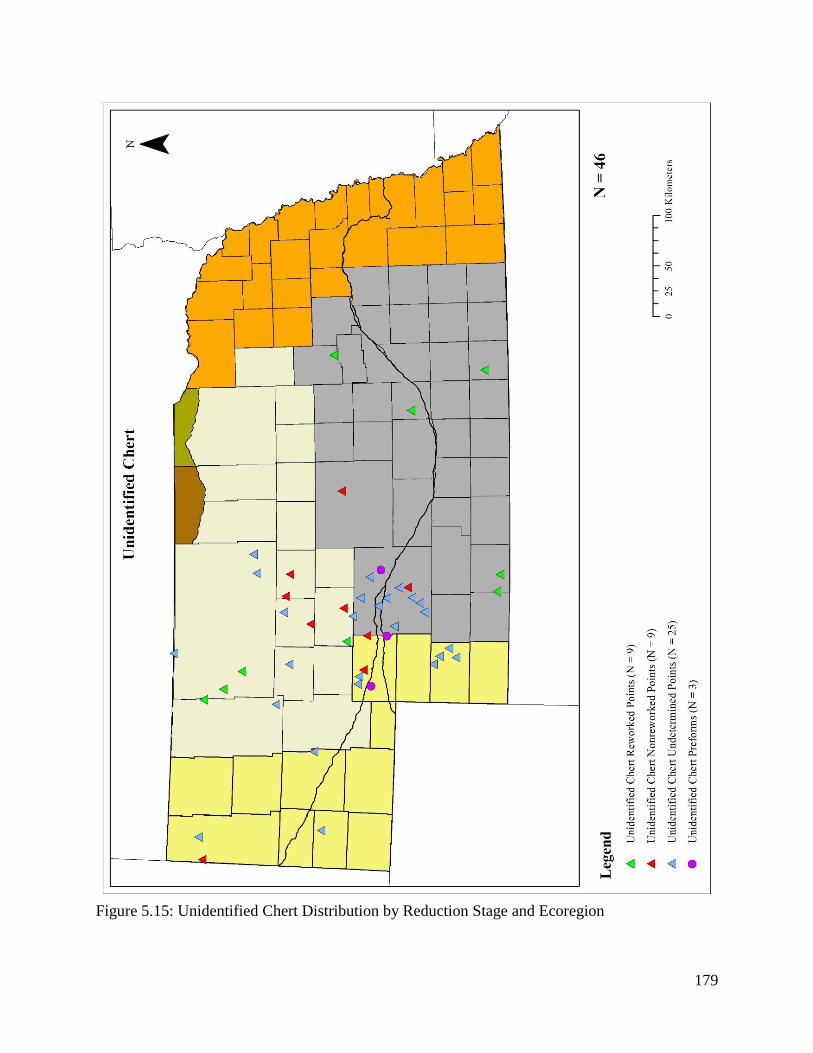
179
Figure 5.15: Unidentified Chert Distribution by Reduction Stage and Ecoregion
180
Quartzite Patterns
Quartzite was moved in an eastward direction from the likely sources of Spanish
Diggings or Cloverly quartzite found in the Hartville Uplift of east central Wyoming and Dakota
quartzite from the Dakota Formation in the southeast Colorado area (distances from these
sources were not calculated). The Nebraska Folsom sample contains five artifacts made of
quartzite, making up only 1.6% of the total sample (Figure 5.1). Table 5.1 shows all five
quartzite artifacts in the sample are Folsom points. These points include the following fragment
types: 1 complete point, 2 point bases, 1 tip, and 1 blade (Table 5.2).
Table 5.13 and Figures 5.16 and 5.17 show quartzite projectile points were found in three
counties (Garden, McPherson, and Keith). The largest evidence was in Keith County with three
quartzite points. Garden and McPherson Counties are in northwest Nebraska and had one
quartzite point each. Tables 5.4 and 5.19 and Figures 5.18 and 5.19 show quartzite projectile
points were found in two ecoregions (the Nebraska Sand Hills with two and the Western High
Plains with three). No quartzite points were found in the North or South Platte Rivers nor in the
Central Great Plains or eastern and northeastern ecoregions (the Corn Belt Plains, Northwestern
Glaciated Plains, and Northwestern Great Plains).
Quartzite: Patterns in Reduction Stages
Quartzite Preforms and Channel Flakes. No evidence for quartzite preforms or channel
flakes was documented in the Nebraska Folsom sample (Tables 5.18 and 5.19, Figures 5.16,
5.17, 5.18, and 5.19).
Quartzite Non-Reworked Projectile Points. The sample has one quartzite non-reworked
point from Keith County (Table 5.18, Figures 5.16 and 5.17). This point was found in the
Western High Plains ecoregion (Table 5.19, Figures 5.18 and 5.19).
181
Quartzite Reworked Projectile Points. The sample has no quartzite reworked points
(Tables 5.18 and 5.19, Figures 5.16, 5.17, 5.18, and 5.19).
Quartzite Undetermined Projectile Points. The sample has four quartzite undetermined
(in terms of reworking) points. One of these is from Garden County, two from Keith County, and
one from McPherson (Table 5.18, Figures 5.16 and 5.17). The quartzite undetermined points
came from two ecoregions—the Nebraska Sand Hills had two and the Western High Plains had
two (Table 5.19, Figures 5.18 and 5.19).
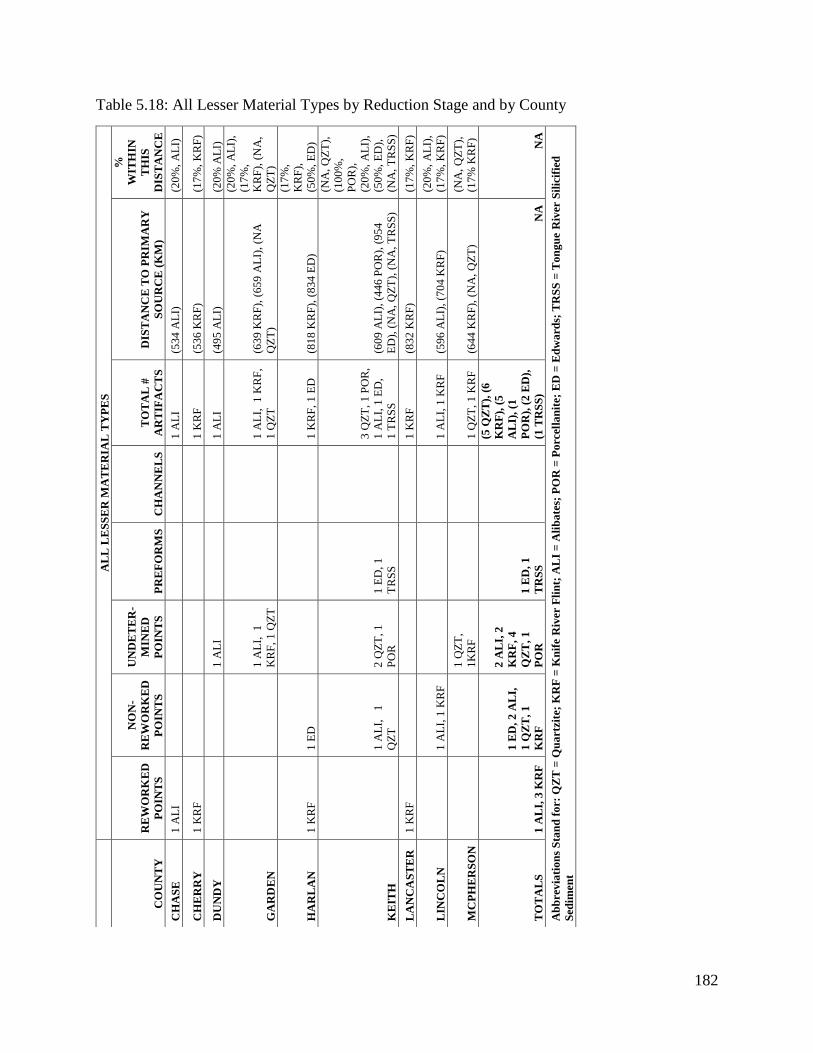
182
Table 5.18: All Lesser Material Types by Reduction Stage and by County
A
LL
LE
SS
ER
MA
TE
RIA
L T
YP
ES
CO
UN
TY
RE
WO
RK
ED
PO
INT
S
NO
N-
RE
WO
RK
ED
PO
INT
S
UN
DE
TE
R-
MIN
ED
PO
INT
S
PR
EF
OR
MS
C
HA
NN
EL
S
TO
TA
L #
AR
TIF
AC
TS
DIS
TA
NC
E T
O P
RIM
AR
Y
SO
UR
CE
(K
M)
%
WIT
HIN
TH
IS
DIS
TA
NC
E
CH
AS
E
1 A
LI
1 A
LI
(53
4 A
LI)
(2
0%
, A
LI)
CH
ER
RY
1
KR
F
1 K
RF
(5
36
KR
F)
(17
%,
KR
F)
DU
ND
Y
1 A
LI
1 A
LI
(49
5 A
LI)
(2
0%
AL
I)
GA
RD
EN
1 A
LI,
1
KR
F,
1 Q
ZT
1 A
LI,
1
KR
F,
1 Q
ZT
(63
9 K
RF
), (
65
9 A
LI)
, (N
A
QZ
T)
(20
%,
AL
I),
(17
%,
KR
F),
(N
A,
QZ
T)
HA
RL
AN
1
KR
F
1 E
D
1
KR
F,
1 E
D
(81
8 K
RF
), (
83
4 E
D)
(17
%,
KR
F),
(50
%,
ED
)
KE
ITH
1 A
LI,
1
QZ
T
2 Q
ZT
, 1
PO
R
1 E
D,
1
TR
SS
3 Q
ZT
, 1
PO
R,
1 A
LI,
1 E
D,
1 T
RS
S
(60
9 A
LI)
, (4
46 P
OR
), (
95
4
ED
), (
NA
, Q
ZT
), (
NA
, T
RS
S)
(NA
, Q
ZT
),
(10
0%
,
PO
R),
(20
%,
AL
I),
(50
%,
ED
),
(NA
, T
RS
S)
LA
NC
AS
TE
R
1 K
RF
1
KR
F
(83
2 K
RF
) (1
7%
, K
RF
)
LIN
CO
LN
1 A
LI,
1 K
RF
1 A
LI,
1 K
RF
(5
96
AL
I),
(70
4 K
RF
)
(20
%,
AL
I),
(17
%,
KR
F)
MC
PH
ER
SO
N
1 Q
ZT
,
1K
RF
1
QZ
T,
1 K
RF
(6
44
KR
F),
(N
A,
QZ
T)
(NA
, Q
ZT
),
(17
% K
RF
)
TO
TA
LS
1
AL
I, 3
KR
F
1 E
D,
2 A
LI,
1 Q
ZT
, 1
KR
F
2 A
LI,
2
KR
F,
4
QZ
T,
1
PO
R
1 E
D,
1
TR
SS
(5 Q
ZT
), (
6
KR
F),
(5
AL
I),
(1
PO
R),
(2
ED
),
(1 T
RS
S)
NA
N
A
Ab
bre
via
tio
ns
Sta
nd
fo
r: Q
ZT
= Q
ua
rtzi
te;
KR
F =
Kn
ife R
iver
Fli
nt;
AL
I =
Ali
ba
tes;
PO
R =
Po
rcel
lan
ite;
ED
= E
dw
ard
s; T
RS
S =
To
ng
ue
Riv
er S
ilic
ifie
d
Sed
imen
t
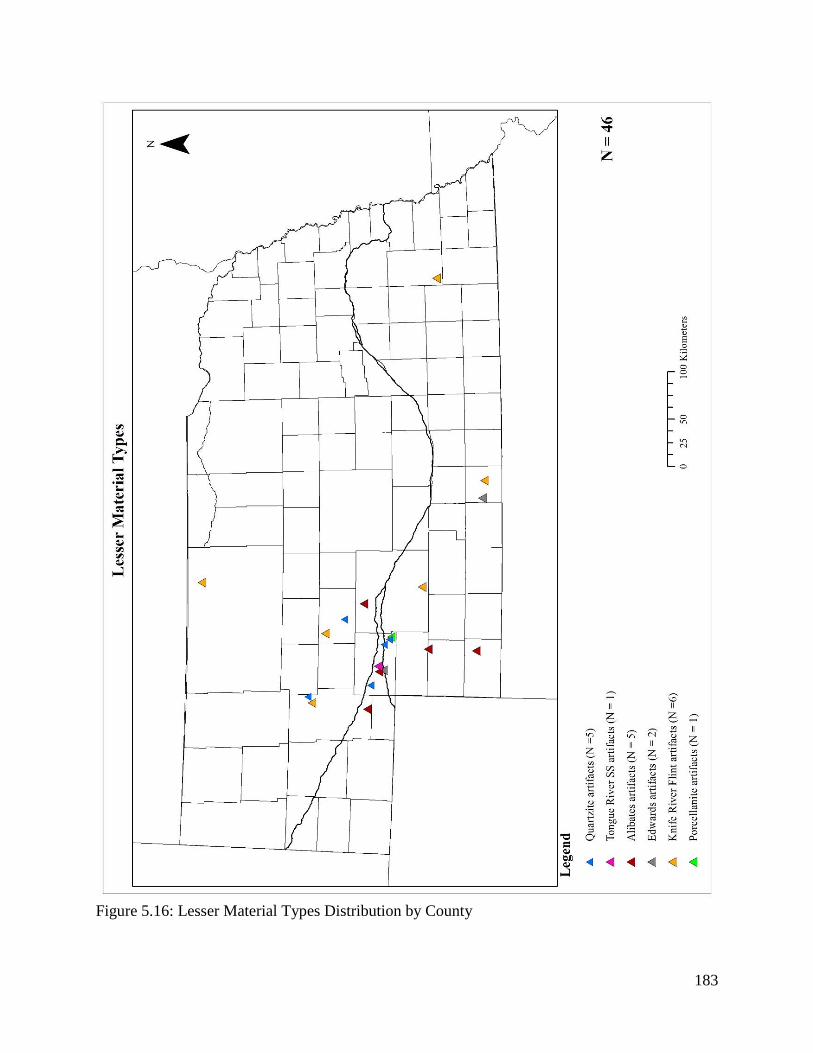
183
Figure 5.16: Lesser Material Types Distribution by County
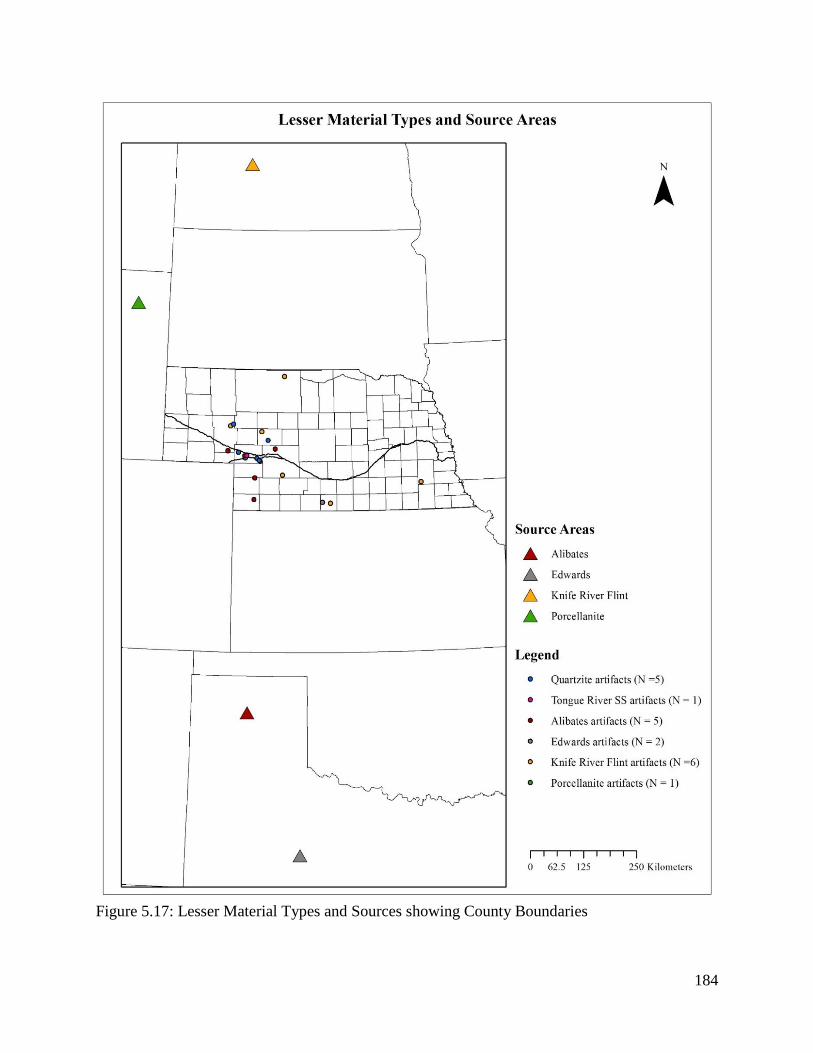
184
Figure 5.17: Lesser Material Types and Sources showing County Boundaries
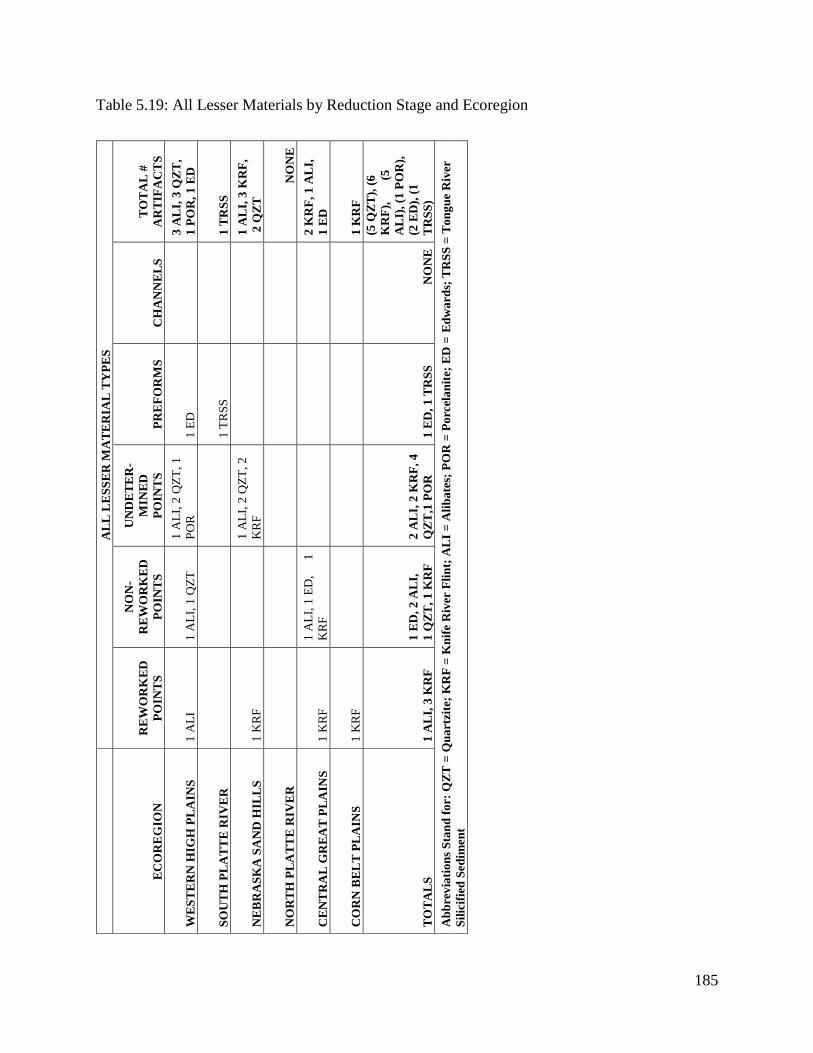
185
Table 5.19: All Lesser Materials by Reduction Stage and Ecoregion
A
LL
LE
SS
ER
MA
TE
RIA
L T
YP
ES
EC
OR
EG
ION
RE
WO
RK
ED
PO
INT
S
NO
N-
RE
WO
RK
ED
PO
INT
S
UN
DE
TE
R-
MIN
ED
PO
INT
S
PR
EF
OR
MS
C
HA
NN
EL
S
TO
TA
L #
AR
TIF
AC
TS
WE
ST
ER
N H
IGH
PL
AIN
S
1 A
LI
1 A
LI,
1 Q
ZT
1 A
LI,
2 Q
ZT
, 1
PO
R
1 E
D
3
AL
I, 3
QZ
T,
1 P
OR
, 1
ED
SO
UT
H P
LA
TT
E R
IVE
R
1
TR
SS
1 T
RS
S
NE
BR
AS
KA
SA
ND
HIL
LS
1
KR
F
1 A
LI,
2 Q
ZT
, 2
KR
F
1 A
LI,
3 K
RF
,
2 Q
ZT
NO
RT
H P
LA
TT
E R
IVE
R
N
ON
E
CE
NT
RA
L G
RE
AT
PL
AIN
S
1 K
RF
1 A
LI,
1 E
D,
1
KR
F
2
KR
F,
1 A
LI,
1 E
D
CO
RN
BE
LT
PL
AIN
S
1 K
RF
1
KR
F
TO
TA
LS
1
AL
I, 3
KR
F
1 E
D,
2 A
LI,
1 Q
ZT
, 1
KR
F
2 A
LI,
2 K
RF
, 4
QZ
T,1
PO
R
1 E
D,
1 T
RS
S
NO
NE
(5 Q
ZT
), (
6
KR
F),
(
5
AL
I),
(1 P
OR
),
(2 E
D),
(1
TR
SS
)
Ab
bre
via
tio
ns
Sta
nd
fo
r: Q
ZT
= Q
ua
rtzi
te;
KR
F =
Kn
ife R
iver
Fli
nt;
AL
I =
Ali
ba
tes;
PO
R =
Po
rcel
an
ite;
ED
= E
dw
ard
s; T
RS
S =
To
ng
ue
Riv
er
Sil
icif
ied
Sed
imen
t
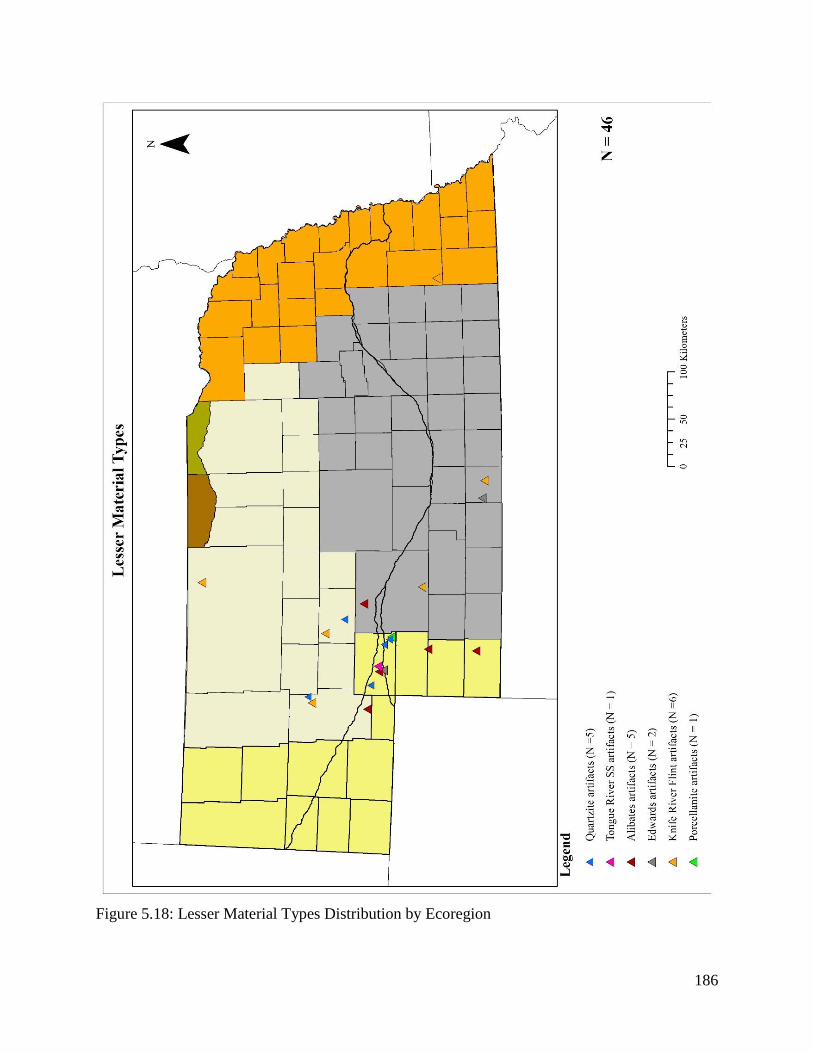
186
Figure 5.18: Lesser Material Types Distribution by Ecoregion
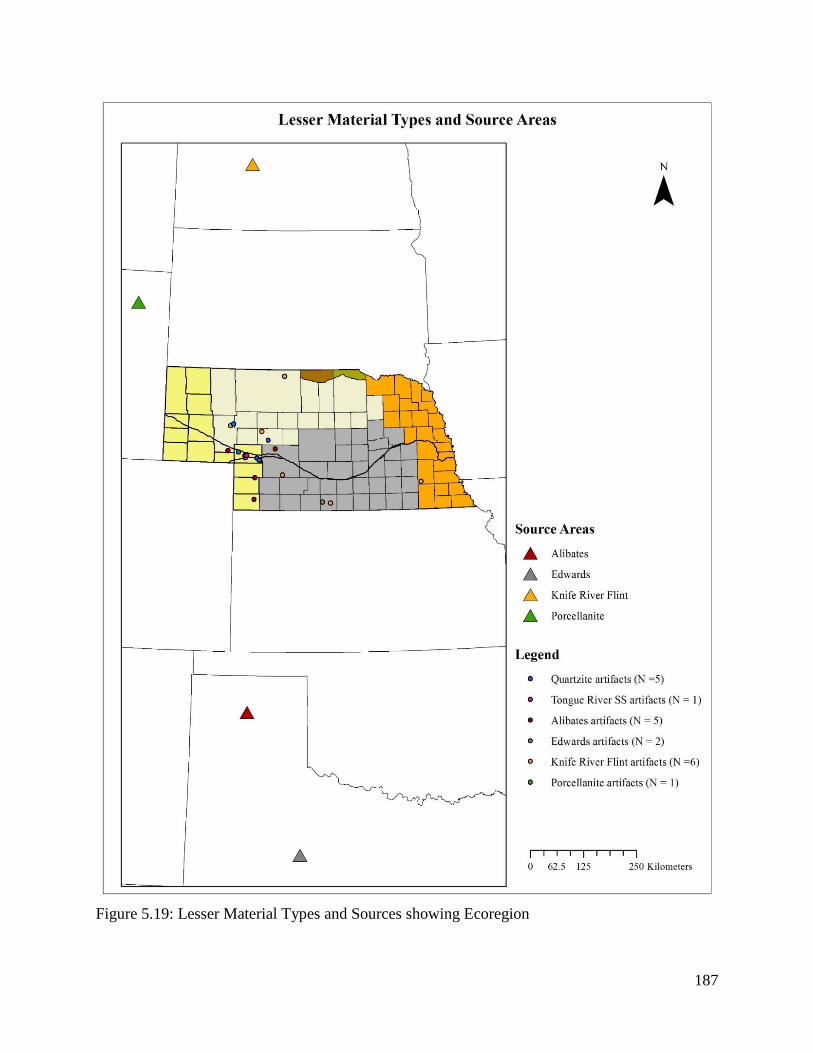
187
Figure 5.19: Lesser Material Types and Sources showing Ecoregion
188
Knife River Flint Patterns
The Knife River Flint source is in west-central North Dakota (Figure 5.17). The Nebraska
Folsom sample has six artifacts made of this material, making up 2% of the total sample (Figure
5.1). The maximum distance it was moved from the source was 832 km to Lancaster County
located in southeastern Nebraska (Table 5.18, Figure 5.16). The shortest distance from the source
was 536 km to Cherry County located in north-central Nebraska near the border with South
Dakota. The artifact types for the Knife River Flint sample include five Folsom points and one
Midland point (Table 5.1). The Knife River Flint Folsom and Midland point fragment types
include: three complete points, two point bases, and one tip (Table 5.2).
Knife River Flint occurs in six Nebraska counties (Tables 5.13 and 5.18, Figure 5.16).
Table 5.18 and Figure 5.16 shows four Knife River Flint Folsom artifacts are found in the
western half of Nebraska (in Cherry County located in northwest Nebraska, Garden and
McPherson Counties in west-central Nebraska, and Lincoln County in the confluence of the
North and South Platte Rivers). Knife River Flint Folsom artifacts are also found in south-
centrally located Harlan County and Lancaster County in southeastern Nebraska. The
northeastern part of Nebraska has no Knife River Flint Folsom artifacts.
Knife River Flint Folsom artifacts are found in three ecoregions (Tables 5.4 and 5.19,
Figures 5.18 and 5.19). The ecoregions with Knife River Flint artifacts are the Nebraska Sand
Hills, south-centrally located Central Great Plains, and Corn Belt Plains located in eastern
Nebraska. No Knife River Flint artifacts were found in the northeastern ecoregions (the
Northwestern Glaciated Plains and Northwestern Great Plains).
189
Knife River Flint: Patterns in Reduction Stages
Knife River Flint Preforms and Channel Flakes. No evidence for Knife River Flint
Preforms or Channel Flakes was documented in the sample (Tables 5.18 and 5.19).
Knife River Flint Non-Reworked Projectile Points. The sample contained one Knife River
Flint non-reworked points from Lincoln County in the confluence of the North and South Platte
Rivers at a distance of 704 km (Table 5.18, Figures 5.16 and 5.17). This Knife River Flint non-
reworked point was found in the Central Great Plains (Table 5.19 and Figures 5.18 and 5.19).
Knife River Flint Reworked Projectile Points. The sample had three Knife River Flint
reworked projectile points found in Cherry (in northwest Nebraska), Harlan (in south-central
Nebraska) and Lancaster (in southeastern Nebraska) Counties (Table 5.18, Figures 5.16 and
5.17). The distance to source ranged from 536 km in Cherry County to 832 km in Lancaster
County (Table 5.18). Table 5.19 and Figures 5.18 and 5.19 show that Knife River Flint reworked
points were found in three ecoregions (the Nebraska Sand Hills, Central Great Plains and Corn
Belt Plains).
Knife River Flint Undetermined Projectile Points. Table 5.18 and Figures 5.16 and 5.17
show the sample contains two Knife River Flint undetermined points from Garden and
McPherson Counties. The one from Garden County was found 639 km from the source while the
one from McPherson was 644 km (Table 5.18). Table 5.19 and Figures 5.18 and 5.19 show that
Knife River Flint undetermined points were found in the Nebraska Sand Hills.
Alibates Agatized Dolomite Patterns
The Alibates source area is in the central Texas Panhandle (Figure 5.17). The Nebraska
Folsom sample has five Alibates artifacts making up 1.6% of the total sample (Figure 5.1). The
maximum distance from the source to where it was found was 659 km to Garden County while
190
the minimum distance was 495 km to Dundy County (Table 5.18, Figures 5.16 and 5.17). The
artifact types for the Alibates sample include three Folsom points and two Midland points (Table
5.1). The Alibates Folsom and Midland point fragment types include: two complete points, two
point bases, and one blade (Table 5.2).
Alibates Folsom and Midland points occur in five Nebraska counties—Chase, Dundy,
Garden, Keith, and Lincoln (Table 5.13, Figure 5.16). All of these counties are located in
western Nebraska with Keith and Lincoln at the confluence of the North and South Platte Rivers,
Garden is in west-central Nebraska, and Chase and Dundy in the southwestern Nebraska
Panhandle (Figure 5.16). The Nebraska Folsom Alibates artifacts are found in three ecoregions
(Tables 5.4 and 5.19, Figures 5.18 and 5.19). Three Alibates artifacts were from the Western
High Plains, one from the Nebraska Sand Hills, and one from the Central Great Plains. No
evidence was documented for Alibates in the eastern and northeastern ecoregions (the Corn Belt
Plains, Northwestern Glaciated Plains, and Northwestern Great Plains) nor in the North and
South Platte River streambeds.
Alibates Agatized Dolomite: Patterns in Reduction Stages
Alibates Preforms and Channel Flakes. The Nebraska Folsom sample had no
documented evidence of Alibates preforms or channel flakes (Tables 5.18 and 5.19).
Alibates Non-Reworked Projectile Points. The Alibates sample contained two non-
reworked points and these were found in the confluence of the North and South Platte Rivers in
Keith and Lincoln Counties at a distance of 609 and 596 km from the source respectively (Table
5.18, Figures 5.16 and 5.17). The Alibates point from Keith County is in the Western High
Plains ecoregion while the one from Lincoln County is in the Central Great Plains (Table 5.19,
Figures 5.18 and 5.19).
191
Alibates Reworked Projectile Points. The sample had one Alibates reworked point. This
points was found in Chase County in the southwestern Nebraska Panhandle at a distance of 534
km from the source (Table 5.18, Figures 5.16 and 5.17). The Alibates reworked point was found
in the Western High Plains (Table 5.19, Figures 5.18 and 5.19).
Alibates Undetermined Projectile Points. The sample contains two Alibates
undetermined points in terms of reworking from Dundy and Garden Counties (Table 5.18,
Figures 5.16 and 5.17). The one from Garden County was found 659 km from the source while
the one from Dundy County was found 495 km from the source (Table 5.18). The Alibates
undetermined points were found in the Nebraska Sand Hills and Western High Plains ecoregions
(Table 5.19, Figures 5.18 and 5.19).
Edwards Chert Patterns
The source for Edwards chert is found in central Texas (Figures 5.17 and 5.19). Figure
5.1 shows that the Nebraska Folsom sample contains two artifacts made of Edwards chert
making up 0.7% of the total sample. The maximum distance it was moved was 954 km to Keith
County, while the other Edwards chert artifact was found 834 km from the source in Harlan
County (Table 5.18, Figures 5.16 and 5.17). The artifact types for the Edwards chert artifacts are
one Folsom point and one preform (Table 5.1). The Edwards Folsom point is a projectile point
base (Table 5.2).
Edwards chert occurs in two Nebraska counties—Keith County near the confluence of
the North and South Platte Rivers has one Edwards chert Folsom artifact and Harlan County
located in south-central Nebraska also has one (Tables 5.13 and 5.18, Figures 5.16 and 5.17).
The Edwards chert sample is found in two ecoregions—the Western High Plains and Central
Great Plains (Tables 5.4 and 5.19, Figures 5.18 and 5.19).
192
Edwards Chert: Patterns in Reduction Stages
Edwards Chert Preform. The single Edwards chert preform was found in Keith County at
a distance of 954 km from the source (Table 5.18, Figures 5.16 and 5.17). This preform was
found in the Western High Plains ecoregion (Table 5.19, Figures 5.18 and 5.19).
Edwards Chert Non-Reworked Projectile Point. The sample had one Edwards non-
reworked point from Harlan County located in south-central Nebraska (Table 5.18, Figures 5.16
and 5.17). This non-reworked point was found 834 km from the source (Table 5.18). The
Edwards non-reworked point was found in the Central Great Plains (Table 5.19, Figures 5.18 and
5.19).
Edwards Chert Reworked Projectile Points, Undetermined Projectile Points, and
Channel Flakes. No evidence for Edwards chert reworked points, undetermined points, or
channel flakes was documented in the Nebraska Folsom sample (Tables 5.18 and 5.19).
Porcellanite Patterns
Figures 5.17 and 5.19 show the closest source of Porcellanite is in the Fort Union
Formation in the Powder River Basin in Wyoming thus this was used to determine distance from
source (Fredlund 1976). Porcellanite also outcrops in the Fort Union Formation in south-central
Montana. The Nebraska Folsom sample has one artifact made of Porcellanite and this makes up
0.3% of the total sample (Figure 5.1). The Porcellanite artifact was moved 446 km (Table 5.18,
Figures 5.16 and 5.17). The Porcellanite artifact is a Midland projectile point base (Tables 5.1
and 5.2). Figure 5.16 and Table 5.18 show that the Porcellanite Midland artifact was found in
Keith County which is near the confluence of the North and South Platte Rivers. This artifact
was found in the Western High Plains (Tables 5.4 and 5.19, Figures 5.18 and 5.19).
Porcellanite: Patterns in Reduction Stages
193
Porcellanite Reworked Projectile Points, Non-Reworked Points, Preforms, Channel
Flakes. The sample has no documented evidence for Porcellanite reworked and non-reworked
points, preforms, or channel flakes.
Porcellanite Undetermined Projectile Points. The sample has one Porcellanite
undetermined point (in terms of reworking). It was found in Keith County which is in the
Western High Plains 446 km from the source (Tables 5.18 and 5.19, Figures 5.16, 5.17, 5.18, and
5.19).
Tongue River Silicified Sediment (TRSS) Patterns
Tongue River Silicified Sediment (TRSS) occurs from the Moreau River in northeastern
South Dakota to the Heart River in southwestern North Dakota (Ahler 1977; Keyser and Fagan
1987). TRSS is also found in cobble form in northeast Colorado (Holen 2001). But, material that
is indistinguishable from TRSS occurs as gravels in Nebraska. The Nebraska Folsom sample has
one TRSS artifact making up 0.3% of the sample (Figure 5.1). This single TRSS artifact is a
preform (Table 5.1). It was found in Keith County in the South Platte River streambed (Tables
5.13, 5.18, and 5.19, Figures 5.16 and 5.17).
Tongue River Silicified Sediment (TRSS): Patterns in Reduction Stages
TRSS Preforms. As previously stated, the TRSS preform was found in Keith County in
the South Platte River streambed (Tables 5.18 and 5.19, Figures 5.16 and 5.17).
TRSS Non-Reworked, Reworked, and Undetermined Projectile Points, and Channel
Flakes. The Nebraska Folsom sample has no documented evidence of TRSS reworked, non-
reworked, and undetermined projectile points, or channel flakes (Tables 5.18 and 5.19, and
Figures 5.16, 5.17, 5.18, and 5.19).
194
Chapter 6: Folsom Land Use and Technological Organization in the Central Plains: What
Do the Patterns Mean?
This chapter investigates the relevance of the Central Plains Folsom dataset to addressing
models that have been offered about Folsom technological organization and land use by Amick
(1994, 1996), Sellet (2013), and Hofman (2003). The chapter provides a description of these
models and then gives their possible scenarios for the Central Plains. In addition, a description is
given of the Central Plains Folsom dataset and what it represents along with a consideration of
how this study’s dataset, given previous models of Folsom land use and technological
organization—Amick (1994, 1996), Sellet (2013), and Hofman (2003)—supports, enhances, or
varies from the expectations of the models. Finally, it ends with a brief summary of how this
study contributes to our understanding of Folsom land use.
Some Previous Folsom Technological Organization and Land Use Models and Scenarios
for Those Models for the Central Plains Folsom Dataset
Amick’s (1994; 1996) Model. A previous model for Folsom land use in the Southwest
and Southern Plains is Amick’s (1994; 1996) model. In it he proposes that Folsom occupation
was focused on the margins, as opposed to the heart of the Plains grasslands (Amick 1994:426).
In the model, Folsom occupation in the Southern Plains was largely logistical. They were using
the Southern High Plains mainly for hunting, and the Basin and Range of the Southwest was
characterized by a residential land use strategy. Amick’s (1996:415) model estimated a seasonal
round for Folsom groups in the American Southwest where Folsom hunters geared up at
Edwards chert sources before heading out to exploit the Southern Plains and then returned to the
Tularosa Basin (an intermontane basin of the Rio Grande Valley in the Basin and Range). A
caveat to this model is that Folsom groups used the High Plains from both directions, but had
very little western source lithic material on the Southern High Plains.
195
Amick’s model suggests that overall the Folsom settlement system and mobility is
“forager-based,” but it also has a logistical hunting strategy (Amick 1996:423). He argues that
the Basin and Range may have been used in a collector-style manner; whereas the Southern
Plains may have been used seasonally (possibly during the summer to fall) in a forager style
manner. Amick (1994:430) argues that Folsom residential camps are mostly associated with
wetlands (on the Plains) and grassland-forest margins (such as in the Basin and Range where
patches of grasslands lie next to forested mountains). The reasons for this may be that these areas
buffer the risk of a subsistence strategy which incorporates hunting large animals such as bison
(in cases of a failed hunt). Also, wetlands and grassland-forest margins are plentiful in small
game and plant resources.
Amick’s (1994; 1996) model suggests that high projectile point to preform ratios are
indicative of a logistical land use strategy on the Southern Plains, whereas low point to preform
ratios (where a higher proportion of preforms exist) is more indicative of a residential land use
strategy in the Basin and Range area of the Southwest. In contrast, Hofman (1999:403) interprets
Folsom technology as doing logistical and residential moves everywhere they went and these
movements were “relatively constant” in the Southern Plains—especially when the entire period
of Folsom occupation is taken into account. Hofman argues that they are doing residential and
logistical moves even across different regions, although he acknowledges that it is reasonable to
expect logistical and residential pattern variation across different environments and landscapes.
Hofman states, regarding Folsom movement on the Southern Plains, that it is unclear whether it
was characterized by “logistical task groups or residential units” (Hofman 1999b:404).
Sellet’s (2013) Model. Sellet (2013) built a model for interpreting Folsom technological
organization and strategies of weaponry production and replacement/repair (Sellet 2013: 384).
196
Sellet’s (2013) model is relevant to interpreting where you are in the organization, repair, and
production of Folsom technology. According to this model, the archaeological variability we see
at a site resulted from how the prehistoric hunter-gatherers addressed future as well as immediate
needs. Sellet argues that in order to untangle the strategies that played into technological
organization one must first be able to recognize the archaeological signatures of two different
strategies for Folsom hunters to manufacture their projectile points—which are ‘gearing up’
versus ‘replacement/repair/retooling’. Folsom hunters needed not only to replace worn out,
broken, and lost points, but sometimes they were making new points for future requirements
(referred to as ‘gearing up’). Sellet’s (2013) model outlined the archaeological signatures for
gearing up versus retooling or replacement. These strategies are described below. In addition,
Figure 6.1 depicts a hypothetical cycle for the production and maintenance of Folsom
technology.
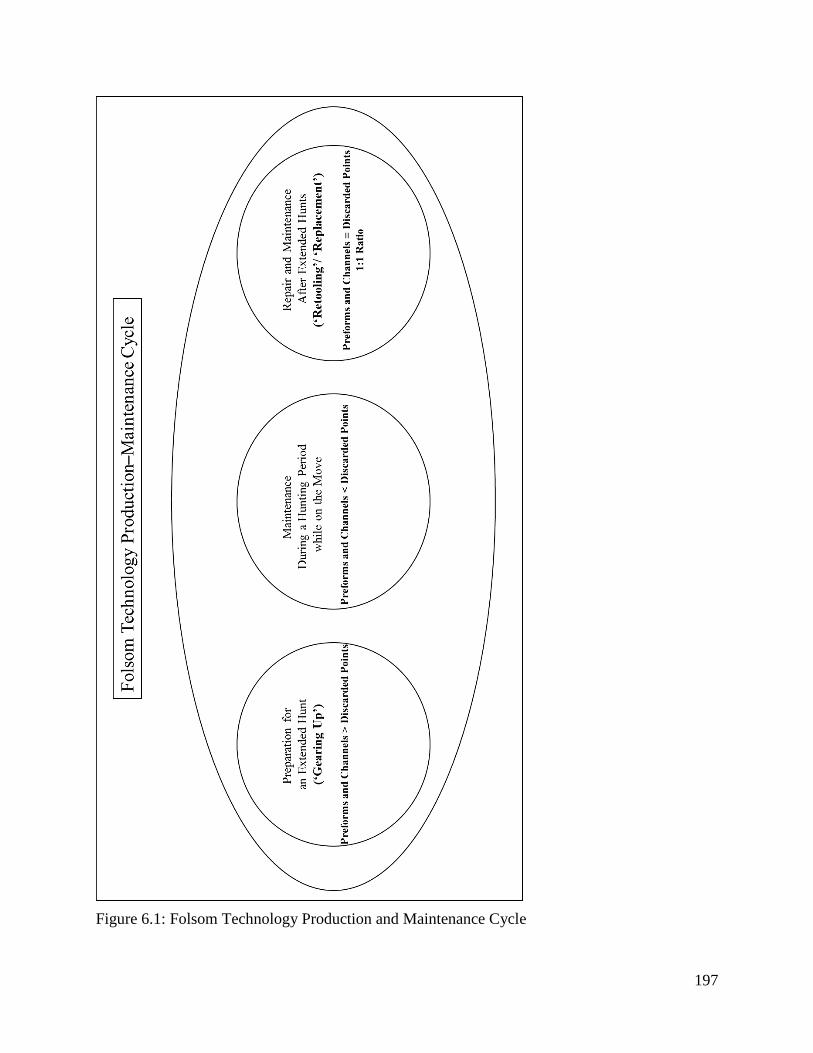
197
Figure 6.1: Folsom Technology Production and Maintenance Cycle
198
Gearing up. Binford (1977 and 1978b) uses the term ‘gearing up’ to reflect circumstances
in which, in anticipation of forthcoming hunts, people will make tools in surplus of their
immediate requirements. Gearing up behavior occurs under conditions of reduced mobility, but
technologically speaking it is a reaction to a highly mobile way of life (Sellet 2004:1563). Based
on Sellet’s (2013) model, in a situation where Folsom hunters are gearing up, we would expect
that the proportion of preforms and channels to lost, broken, and worn out projectile points
would show a large imbalance favoring the number of preforms and channels (evidence for point
production) in relation to finished discarded (broken or expended) projectile points. In a gearing
up situation, the emphasis is on the production end of technology. Under the strategy of gearing
up, Folsom hunters produced projectile points in large quantities in preparation for a future hunt.
Sellet’s (2013) study of the Lindenmeier site revealed that a gearing up strategy of point
production was seen in Area II of the site. In this area, Folsom hunters were manufacturing
projectile points in excess of their immediate needs in anticipation of a future hunt. Lindenmeier
II had a large number of preforms and channels in relation to discarded (broken and worn out)
projectile points. We might expect that at places where Folsom hunters were camping longer
(possibly close to lithic source areas and other resources) that a gearing up strategy might be
expected. They may gear up at such sites, in preparation for hunting somewhere else.
Replacement or Retooling. In Sellet’s (2013) model, he describes another strategy for
Folsom hunters to manufacture their projectile points called ‘replacement’ or ‘retooling.’ Under
a replacement or retooling strategy, they manufacture new projectile points to replace those that
are worn out, lost, or broken. In this type of strategy, the ratio of preforms and channel flakes to
discarded projectile points is approximately 1 to 1. That is, in a replacement or retooling type of
strategy, the archaeological signature revealed a nearly equal proportion of broken and discarded
199
projectile points in relation to preforms and channels. Sellet (2013) performed an analysis at the
site-scale and at a larger-scale using many Folsom campsites. In the large-scale analysis, the
majority of Folsom campsites exhibited a replacement or retooling strategy, with a ratio of 1 to 1
for manufactured points (as exhibited by preforms and channels) to discarded points. In other
words, Folsom hunters were manufacturing new points to replace those that were broken, worn
out, or lost. We might expect that Folsom hunters would use the strategy of replacement or
retooling while in route or during an extended hunt.
Maintenance of an Equipment Set During a Hunt (While on the Move). While on an
extended hunt, or during a hunting period, Folsom hunters may have used a strategy of
maintenance when they were on the move. If Folsom hunters are just maintaining their
equipment set while they are on the move, the archaeological signature may show a light mix of
preforms and channel flakes (evidence for point production) versus a fair number of finished,
discarded points (lost, worn out, or broken points). Thus, in this phase of the technological
organization, the archaeological signature would show a greater number of discarded projectile
points in relation to manufactured points (preforms and channels).
Hofman’s (2003) Model. Another model of Folsom land use and technological
organization that has regional scale implications is Hofman’s (2003) study. In this study Hofman
discusses long term land use patterns and directions of movement for regional-scale Folsom
artifact distributions. This study focuses in part on an individual site, the Nolan site in Chase
County, in western Nebraska. Hofman found a strong directional pattern for the movement of
White River Group Silicates from the Flattop Butte source area (located in northeastern
Colorado) southeastward and eastward into southwestern Nebraska and northeastern Colorado.
This pattern stands in contrast to Smoky Hill Jasper, located closer to the Nolan site in
200
southwestern Nebraska. Smoky Hill Jasper was rarely moved westward from primary sources of
this material found in the Saline and Republican River Basins. Hofman’s (2003) model interprets
these patterns as the repeated movements of Folsom groups from lithic source areas to areas
where they would hunt bison. According to Hofman’s (2003) model, Folsom groups are
operating out of an area with lithics and repeatedly going out and hunting and coming back. He
interprets these to be long term land use patterns in the region. Hofman’s model showed a strong
pattern where Folsom hunters were repeatedly carrying White River Group Silicates eastward
from the Flattop Butte source area into southwestern Nebraska and northeastern Colorado. In
contrast, Smoky Hill Jasper was carried west from the source area into southwestern Nebraska
only occasionally. This pattern is comparable to what Amick (1994; 1996) found in the Southern
High Plains and Southwest, and fits with Sellet’s (2013) model of gearing up near source areas
for extended hunts.
Possible Scenarios for the Central Plains Dataset:
Scenario 1. One scenario for Folsom land use and technological organization is that the
Central High Plains is used primarily as a hunting ground by Folsom people who lived some part
of the year somewhere else—logically in the foothills of the Rocky Mountains (e.g., sites like
Lindenmeier, Hell Gap, Cattle Guard, Westfall, etc.). This scenario proposes that Folsom people
are not living in the Central Plains all the time—but instead they were coming in to the Central
Plains seasonally to hunt. If this is the case, then we would expect that Folsom groups are
gearing up to hunt before they move onto the Central High Plains; and that these same groups are
mostly repairing and replacing worn out, broken, and lost points during the hunt. After hunting in
the Central High Plains, groups would have returned to lithic source areas and the Plains margins
(with varied resources) to gear up for future hunts. While on the move, during hunting in the
201
Central High Plains, they were mostly maintaining their hunting equipment. In this type of
scenario we would not expect to see an archaeological signature for ‘gearing up’ or ‘replacement
or retooling’ in Nebraska. While on the move, during the hunt in the Central Plains, we would
see Folsom people maintaining a hunting equipment set—therefore the archaeological signature
would show a pretty light mix of preforms and a fair number of discarded points. This scenario is
analogous to Amick’s (1994; 1996) Folsom land use model where he found a difference between
the Southern High Plains and Basin and Range in the American Southwest in terms of the
proportions of preforms to finished projectile points. The Basin and Range had more preforms
than the Southern High Plains. He found that the Southern High Plains was used primarily for
hunting, while the Basin and Range was primarily habitation area for Folsom people in the
Southwest.
Scenario 2. Another option for Folsom technological organization and land use in the
Central Plains is that Folsom people were full-time residents of Nebraska. Under this scenario,
full-time Central Plains residents were using a variety of lithic sources (e.g., gravel sources of
Hartville Uplift Chert and Smoky Hill Jasper) where they lived. In this scenario, there are
Folsom people who live in the Central Plains year-round, and thus they are not coming into the
area to hunt—but instead they are hunting within the general area where they live. Under this
type of scenario, areas with diverse resources (such as between the North and South Platte
Rivers) could have enabled year-round residence for groups of Folsom people. In this case, the
residents are going to be gearing up for hunting sometimes and repairing and replacing
equipment at other times. In this option, the Central Plains, or specific areas within it, ought to
reflect both archaeological signatures—‘gearing up’ and ‘replacing or retooling’ signatures—as
suggested in Sellet’s (2013) model.
202
Scenario 3. A third scenario for the Central Plains dataset is that Folsom residents lived
in Nebraska all the time, but they were doing logistical moves for lithics and other resources.
They were living in the Central Plains—not the foothills of the Rockies—and they would make
logistical trips to the foothills for lithics and possibly other resources such as special woods, and
then return to the Central Plains to reside and hunt. In this scenario, Folsom people are living in
Nebraska all the time and making logistical trips to Flattop, Hartville Uplift, and other sources—
there they would do their production and then come back to the Central Plains. Because Folsom
people would typically not finish fluting all their point preforms at the lithic source, under this
scenario they would go to Hartville Uplift and Flattop sources and come back to the Central
Plains carrying preforms and bifaces, as well as finished projectile points. Under this scenario we
would also expect to see common preforms in the Central Plains Folsom dataset.
Patterns in the Central Plains Folsom Dataset:
The patterns in the Central Plains Folsom dataset can now be discussed in relation to the
above models (i.e., Sellet 2013; Amick 1994, 1996; and Hofman 2003). This provides a step in
evaluating Folsom land use and technological organization among the Central Plains Folsom
groups.
Patterns in the Ratio of Preforms and Channel Flakes to Discarded Points for the
Central Plains Dataset. Table 6.1 provides the number of preforms and channel flakes to
discarded points for all ecoregions which contained artifact samples and the artifacts found in the
North and South Platte area for the Central Plains Folsom sample.
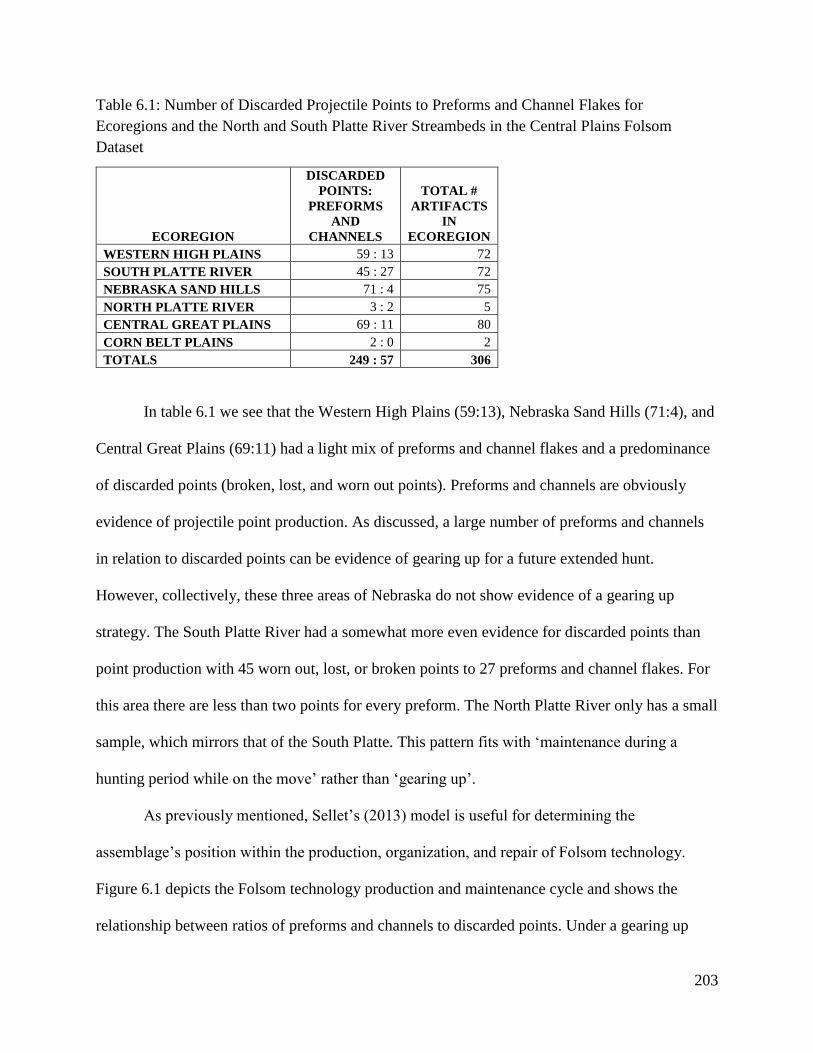
203
Table 6.1: Number of Discarded Projectile Points to Preforms and Channel Flakes for
Ecoregions and the North and South Platte River Streambeds in the Central Plains Folsom
Dataset
ECOREGION
DISCARDED
POINTS:
PREFORMS
AND
CHANNELS
TOTAL #
ARTIFACTS
IN
ECOREGION
WESTERN HIGH PLAINS 59 : 13 72
SOUTH PLATTE RIVER 45 : 27 72
NEBRASKA SAND HILLS 71 : 4 75
NORTH PLATTE RIVER 3 : 2 5
CENTRAL GREAT PLAINS 69 : 11 80
CORN BELT PLAINS 2 : 0 2
TOTALS 249 : 57 306
In table 6.1 we see that the Western High Plains (59:13), Nebraska Sand Hills (71:4), and
Central Great Plains (69:11) had a light mix of preforms and channel flakes and a predominance
of discarded points (broken, lost, and worn out points). Preforms and channels are obviously
evidence of projectile point production. As discussed, a large number of preforms and channels
in relation to discarded points can be evidence of gearing up for a future extended hunt.
However, collectively, these three areas of Nebraska do not show evidence of a gearing up
strategy. The South Platte River had a somewhat more even evidence for discarded points than
point production with 45 worn out, lost, or broken points to 27 preforms and channel flakes. For
this area there are less than two points for every preform. The North Platte River only has a small
sample, which mirrors that of the South Platte. This pattern fits with ‘maintenance during a
hunting period while on the move’ rather than ‘gearing up’.
As previously mentioned, Sellet’s (2013) model is useful for determining the
assemblage’s position within the production, organization, and repair of Folsom technology.
Figure 6.1 depicts the Folsom technology production and maintenance cycle and shows the
relationship between ratios of preforms and channels to discarded points. Under a gearing up
204
strategy, the emphasis is in on point production to prepare for a future extended hunt. In this
strategy, we would expect more preforms and channels flakes than discarded points. In contrast,
when Folsom hunters were using a strategy of retooling/replacement (maintenance) they would
do repair and maintenance after a hunting event and we would expect the relationship between
discarded points to preforms and channels to change to about a 1:1 ratio. However, when Folsom
hunters were maintaining an equipment set during a hunting period, while on the move, we
would expect the relationship between point production and discarded points to again shift—
perhaps to reveal a relationship where the number of discarded points (because of lost projectiles
and other factors) was greater than the number of preforms and channel flakes.
When we examine the patterns in the Central Plains Folsom sample it reveals that for
four ecoregions and one river streambed in Nebraska the evidence showed a ratio where fewer
preforms and channel flakes were found than discarded points. These areas are the South Platte
River (45:27), Western High Plains (59:13), Nebraska Sand Hills (71:4), and Central Great
Plains (69:11). The archaeological pattern seen in the Central Plains dataset points to
‘maintenance during a hunting period while on the move’ (see Figure 6.1). Fewer preforms and
channel flakes than discarded points (worn out, broken, or lost) existed for three areas (i.e., the
Western High Plains, Nebraska Sand Hills, and Central Great Plains regions). The South Platte
River streambed is somewhat different with proportionately many more preforms represented
than in the other areas—but still less than the 1:1 ratio anticipated by the repair and maintenance
(‘retooling’/ ‘replacement’) model. The patterns seen in the Central Plains dataset, in terms of the
ratio of preforms and channel flakes to discarded points, is an archaeological signature for
‘maintenance of an equipment set during a hunting period while on the move’. The weight given
to these results depends in part on the factor of recognition and reporting of preforms and its
205
potential impact on these numbers. However, if we take into account that the biases of preform
recognition and reporting are minimal, then in general these results support Sellet’s (2013)
maintenance during a hunt.
This pattern can be argued to support an argument that the Central Plains Folsom dataset
falls under Scenario 1. This scenario is that the Central Plains was used primarily as a hunting
ground by Folsom people who lived elsewhere (probably in the foothills of the Rocky
Mountains). This pattern reveals that Folsom people are just coming into the Central Plains to
hunt probably seasonally—they do not live in the region all the time. The Central Plains Folsom
pattern of preforms and channels to discarded points does not show an archaeological signature
for ‘gearing up’ or ‘replacement/retooling’. The pattern seen in the Central Plains dataset is one
with a light mix of preforms and a fair number of discards. This pattern might imply that Folsom
groups were maintaining an equipment set during a hunt and while on the move. Folsom groups
would gear up for an extended hunt before heading out onto the Central Plains and would do
their replacement, repair, and maintenance after they came back from the Central Plains. They
were not living in the Central Plains year-round. The patterns seen in the preforms and channel
flakes to discarded points for the Central Plains reveal that the area was used primarily as a
hunting ground by Folsom groups and they lived elsewhere, logically in the foothills of the
Rockies.
Alternatively, this pattern might also be expected if logistical moves were made from the
Central Plains to lithic sources such as Flattop, and preforms from these sources were carried and
occasionally broken in final production stages. In this model, Scenario 3, retooling logistical
camps should occur near lithic source areas where there would be an abundance of discarded
preforms and channel flakes in relation to discarded points. Preforms would then be under-
206
represented in the residential region of the Central Plains because only the failed preforms would
be found.
Any discussion of regional-scale patterns where the data is not from excavated and well-
documented sites and mostly from private collections must acknowledge the possible biases in
the Central Plains Folsom sample in that the dataset probably has an under-representation of
preforms, and certainly has an under-representation of channel flakes. However, if the collection
biases of preform identification and collection are somewhat minimal, then the results of this
measurement could be interpreted as revealing a larger number of discarded points in relation to
fewer preforms and channels flakes. This might point to a strategy where Folsom hunters in the
Western High Plains, Central Great Plains, Nebraska Sand Hills, and South Platte River of
Nebraska were maintaining an equipment set while on the move during an extended hunting
period.
Patterns in the Projectile Points to Preform Ratios for the Central Plains Dataset. The
ratios of completed/finished projectile points to preforms was calculated for each ecoregion.
When the ratio of projectile points to preforms is low (less than 5:1) this may indicate reduced
mobility and a residential pattern of land use for an ecoregion. When the ratio of projectile points
to preforms is low, this is indicative of the when the manufacturing of projectile points is
relatively high and when broken points are frequently replaced. Amick’s (1994; 1996) model
argues that this represents residential activities, under reduced mobility, with a pattern of land
use that is residential. The replacement of weaponry is anticipated to be more constant while land
use is not typified by logistical movement (Amick 1996:416). Therefore, Amick argues that low
projectile point to preform ratios may indicate reduced mobility under a more residential pattern
of land use.
207
When the ratio of projectile points to preforms is high (greater than 5:1) this may indicate
high mobility under a more logistical pattern of land use for an ecoregion. At camps there will be
more preforms and at kills there will be more projectile points. Areas or ecoregions used for
hunting will have more finished points than those primarily used for camping. High projectile
point to preform ratios indicate high rates of discarded points, and also indicate that the
manufacture of projectile point replacements on-site is low. Amick’s model (1996:414-416)
argues that high point to preform ratios are expected when hunting bison, a resource that is
somewhat unpredictable and mobile, and using high logistical mobility because the access to
lithic material sources for replacement of projectile points may be decreased. Therefore, high
point to preform ratios may indicate high mobility under a more logistical pattern of land use in
terms of their hunting strategy and possibly in relation to lithics.
This current study used the ratio of 5.00 to distinguish between high and low projectile
point to preform ratios because this allowed for direct interregional comparison, for this
particular measurement of Folsom land use in Nebraska, with Amick’s (1996:416-417) ratios of
projectile points to preforms and the inferences of this measurement for Folsom land use for the
American Southwest and Southern Plains. There are few Folsom datasets that are similar to the
Central Plains Folsom dataset, and Amick’s (1994; 1996) study is one of the few. His data is
composed of mostly isolated artifact occurrences and includes only weaponry-related artifacts
(projectile points, preforms, and channel flakes). Therefore, by using the ratio of 5.00 to
distinguish between high and low projectile point to preform ratios, a direct intraregional
comparison is possible between the Central Plains Folsom and the Southwest and Southern
Plains.
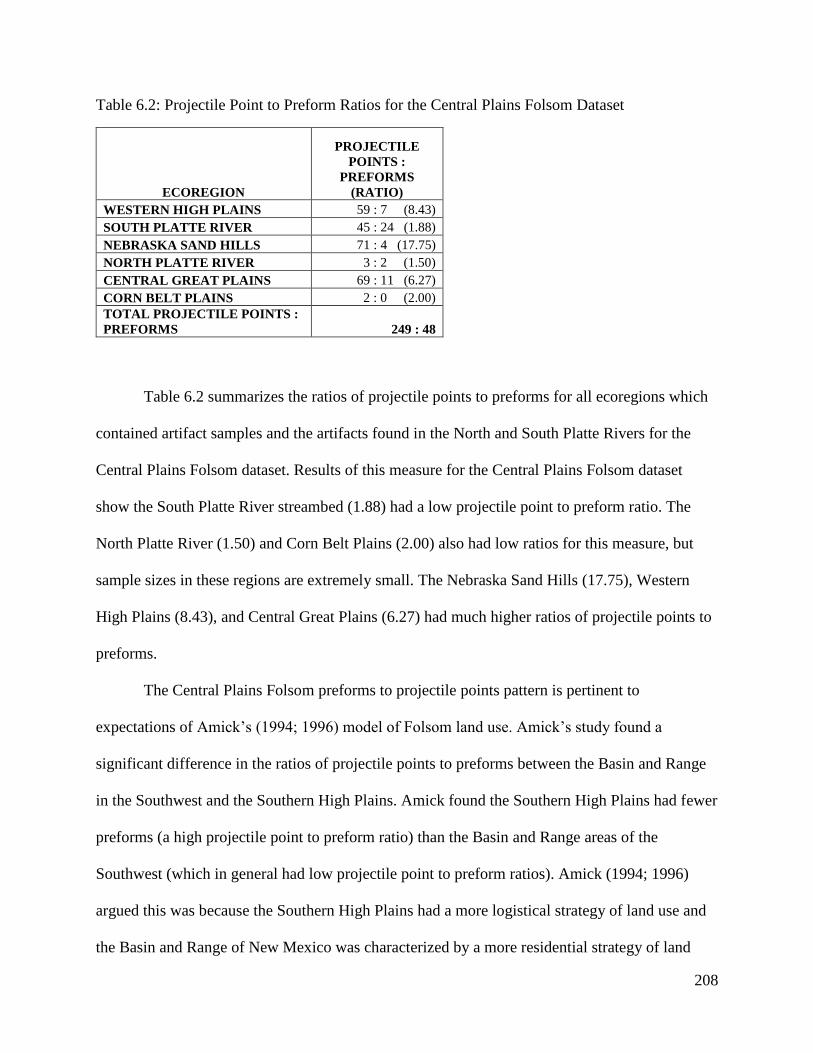
208
Table 6.2: Projectile Point to Preform Ratios for the Central Plains Folsom Dataset
ECOREGION
PROJECTILE
POINTS :
PREFORMS
(RATIO)
WESTERN HIGH PLAINS 59 : 7 (8.43)
SOUTH PLATTE RIVER 45 : 24 (1.88)
NEBRASKA SAND HILLS 71 : 4 (17.75)
NORTH PLATTE RIVER 3 : 2 (1.50)
CENTRAL GREAT PLAINS 69 : 11 (6.27)
CORN BELT PLAINS 2 : 0 (2.00)
TOTAL PROJECTILE POINTS :
PREFORMS 249 : 48
Table 6.2 summarizes the ratios of projectile points to preforms for all ecoregions which
contained artifact samples and the artifacts found in the North and South Platte Rivers for the
Central Plains Folsom dataset. Results of this measure for the Central Plains Folsom dataset
show the South Platte River streambed (1.88) had a low projectile point to preform ratio. The
North Platte River (1.50) and Corn Belt Plains (2.00) also had low ratios for this measure, but
sample sizes in these regions are extremely small. The Nebraska Sand Hills (17.75), Western
High Plains (8.43), and Central Great Plains (6.27) had much higher ratios of projectile points to
preforms.
The Central Plains Folsom preforms to projectile points pattern is pertinent to
expectations of Amick’s (1994; 1996) model of Folsom land use. Amick’s study found a
significant difference in the ratios of projectile points to preforms between the Basin and Range
in the Southwest and the Southern High Plains. Amick found the Southern High Plains had fewer
preforms (a high projectile point to preform ratio) than the Basin and Range areas of the
Southwest (which in general had low projectile point to preform ratios). Amick (1994; 1996)
argued this was because the Southern High Plains had a more logistical strategy of land use and
the Basin and Range of New Mexico was characterized by a more residential strategy of land
209
use. This model proposed that low projectile point to preform ratios indicated a reduced mobility
pattern with land use that was residentially mobile. An emphasis exists on manufacturing
replacements of broken points at residential locations. In contrast, the model also argued that
high projectile point to preform ratios indicated high rates of discard of broken points and
minimal manufacture of point replacements. Such a pattern occurs under conditions of high
mobility such as occurs when hunting bison (Amick 1996:417).
The Central Plains Folsom sample has projectile point to preform ratios which show the
Nebraska Sand Hills (17.75), Western High Plains (8.43), and Central Great Plains (6.27) had
relatively high projectile point to preform ratios. These regions of Nebraska had relatively few
preforms as compared to the number of projectile points. The evidence in the Nebraska Sand
Hills, Western High Plains, and Central Great Plains reveals a large number of projectile point
discards, with little evidence for projectile point manufacturing—this is the type of pattern we
would expect if these areas of Nebraska were primarily used for hunting. The South Platte River
streambed (1.88) had a low projectile point to preform ratio. Forty-five projectile points and 24
preforms came from the South Platte River area. This pattern could be interpreted as evidence
that they are camping longer in the area and it may have served as a habitation area (at least
seasonally). Whereas the other parts of the Central Plains may have been places where Folsom
groups were primarily hunting and moving logistically.
The pattern seen in the South Platte River streambed may indicate that the floodplain, and
perhaps gravel bars in the river channel, were good places to camp. Thus, Folsom people
probably regularly used the South Platte flood plain and river channel for camping because of
shelter and the wide variety of resources it offered. They would have lost or discarded artifacts in
the channel. They may have also hunted bison as they crossed the river. Therefore, it should not
210
be assumed that all Folsom artifacts found in the river channel came from elsewhere. The
artifacts may have come from upstream in the river channel—they may have also come from
eroded terraces deposits. Also, the reasons to use and camp in a river channel are many. River
channels have water, lithics, wood, animals, and offer protection. So, the gravel bars and the
flood plains are going to be targets for seasonal (or perhaps year round) occupation. When the
river is flooded, one would not want to be in the channel. But, in the summer, fall, and winter the
river channel would be a good place to camp. Therefore, it should not be assumed that the
artifacts in the South Platte River channel necessarily came out of terrace deposits. Many
artifacts recovered from the South Platte River channel probably started out some unknown
distance upstream in the river channel. Folsom people may well have been using the South Platte
River channel and low terraces on at least a seasonal basis for camping.
The Central Plains Folsom artifact patterns of ratios of points to preforms supports
Scenario 1 and possibly Scenario 3 as well. The patterns seen in the Nebraska Sand Hills,
Western High Plains, and Central Great Plains show high point to preform ratios which is
characteristic of an area primarily used for hunting. In contrast, the low ratio of points to
preforms in the South Platte River channel shows more of a habitation pattern. This makes sense
when we think of the reasons Folsom groups would want to be along a river channel (water,
wood, lithics, protection, animals). Folsom groups may not have lived year round in the South
Platte River channel—but instead might have used it seasonally when they were hunting in the
Central Plains. Scenario 1 points to the Central Plains being used primarily for hunting by
Folsom groups who did not live there year round. Instead, based on lithic material sources, they
likely lived in the foothills of the Rockies. In this scenario they geared up at lithic sources before
moving out onto the Central Plains to hunt and then did most of their repairing and replacement
211
of equipment after they returned from the hunt. The Central Plains ratios of points to preforms
pattern supports and is analogous to Amick’s (1994; 1996) model for the Southern High Plains
and Basin and Range of the Southwest.
The Central Plains Folsom sample can be used to argue for and support Scenario 3. This
scenario is one where Folsom residents lived in Nebraska all the time, but had logistical moves
to the foothills of the Rockies for lithics and other resources. Then, they would return to the
Central Plains to reside and hunt. In this scenario, they would make logistical trips to Flattop and
Hartville sources and come back to the Central Plains carrying bifaces, preforms, and finished
points. In this scenario, broken preforms would be common. In Scenario 3, the area between the
North and South Platte Rivers would be a good place to live year round and would provide
resources such as water, wood, shelter, and animals. Under this scenario, living in Nebraska
year-round would involve logistical moves to the foothills for lithics.
Lithic Material Patterns in the Central Plains Folsom Dataset. The three main
identifiable lithic materials represented in the Central Plains Folsom dataset are White River
Group Silicates (31.4% of the total sample), Hartville Uplift chert (24% of the total sample), and
Smoky Hill Jasper (12.4% of the sample). A small number of Folsom artifacts in the Central
Plains Folsom database are from more distant sources and these include Fossil Wood, Permian
Florence “B” chert, Knife River Flint, Spanish Diggings Quartzite, Alibates, Edwards chert,
Porcelanite, and Tongue River silicified sediment (Figure 5.1). Obviously White River Group
Silicates and Hartville Uplift chert dominate the Central Plains Folsom dataset. Smoky Hill
Jasper is significant, however, as its source areas are from a different direction and overlap with
the study area.
212
The closest source for White River Group Silicates (WRGS) is Flattop Butte in Logan
County in northeastern Colorado. Other sources are Horse Creek, South Dakota and Table
Mountain, Wyoming. In addition WRGS washes out in residual gravels (Ahler 1977). Since
Flattop Butte is the closest source, it was assumed to be the source for the majority of artifacts in
the Central Plains Folsom dataset. WRGS Folsom artifacts were moved anywhere from 97 km
into Morrill County (located in the western Nebraska panhandle) up to 395 km into Franklin
County (located in south-central Nebraska) (see Table 5.5; Figure 5.2). WRGS Folsom artifacts
were moved from the Flattop Butte source in a northeastern, eastern, and southeastern direction
into western and southern Nebraska. Based on this evidence, there appears to be repeated
movements of WRGS coming from the west. One way to distinguish logistical collection of
WRGS from seasonal habitation at the source area would be if they were living at the source area
seasonally, then we would expect to find more preforms at the source area than if they were
performing logistical moves to the source area for lithics. If they are logistically collecting
WRGS then they would come back to the area they reside carrying preforms, bifaces, and
projectile points made of WRGS.
Hartville Uplift chert is the second most common lithic material in the Central Plains
Folsom dataset. Sources for Hartville Uplift chert are in east-central Wyoming’s Hartville Uplift
and it is also found in secondary gravel deposits in the western Nebraska panhandle. Hartville
Uplift chert was moved a minimum distance of 82 km to Sioux County (located in the northwest
corner of Nebraska) to 540 km in Franklin County located in south-central Nebraska (Table 5.7;
Figure 5.4). Hartville Folsom artifacts were moved from the source in east-central Wyoming in a
northeastern, eastern, and southeastern direction into the western half of Nebraska. Based on
evidence from the two most common lithic material types in the Central Plains Folsom
213
database—WRGS and Hartville—there appears to be repeated movements of lithic materials into
the Central Plains from the west.
Smoky Hill Jasper makes up an important minority of the Central Plains Folsom sample
(38 artifacts, or 12.4% of the total). Primary sources for this lithic material are in the Republican
and Saline River drainages in south-central Nebraska and northwestern Kansas and include the
Medicine Creek Reservoir area in the Republican River Drainage in Frontier County, Nebraska.
Smoky Hill Jasper was moved from the Medicine Creek area (the closest source) into Nebraska
from the west, northwest, north, and southeast directions (Table 5.9, Figure 5.6). The distance
from the Medicine Creek source to where the Folsom artifacts were found was between 75 km in
Harlan County (located in south-central Nebraska along the southern tier of counties bordering
Kansas) to 375 km in Sioux County (located in the far northwest corner of Nebraska). Hofman
(2003: 239) reported that Folsom groups used Smoky Hill Jasper less frequently than did later
Paleoindian complexes. Out of 306 artifacts in the Central Plains Folsom dataset, only 38 were
made out of Smoky Hill Jasper. In general, the pattern seen in the Central Plains Folsom dataset
for the Smoky Hill Jasper artifacts, is that despite the fact that sources of Smoky Hill Jasper are
located closer, the dataset is dominated by White River Group Silicates and Hartville Uplift
chert.
The patterns seen in the Central Plains dataset, in terms of the use of White River Group
Silicates, Hartville Uplift, and Smoky Hill Jasper supports the patterns seen in Hofman’s (2003)
model. The pattern Hofman (2003) found at the Nolan site (in Chase County, Nebraska) and in
the counties in southwest Nebraska and northeastern Colorado mirrors that seen in the Central
Plains Folsom dataset. That is, Folsom artifacts made of White River Group Silicates were being
transported to the east at a much greater rate than Smoky Hill Jasper artifacts were being
214
transported to the west during Folsom times. The only way in which the Central Plains Folsom
dataset varies from Hofman’s (2003) model is that Hartville Uplift was also carried to the east at
a higher rate than Smoky Hill Jasper was carried to the west during Folsom times. The patterns
seen in the lithic materials of the Central Plains Folsom dataset appear to reflect repeated
movements of lithic materials from the west (i.e., White River Group Silicates and Hartville
Uplift chert), and movement of lithic materials to the east happens at only a fraction of the time
(i.e., Smoky Hill Jasper). Smoky Hill Jasper does not seem to go west with the frequency that
White River Group Silicates and Hartville Uplift chert move east. It is notable that Smoky Hill
Jasper moves east with nearly as much frequency as it moves west. Folsom people were carrying
Smoky Hill Jasper from the source to the east into the Republican and Blue River Valleys.
The lithic material patterns seen in the Central Plains Folsom dataset might support
Scenario 1. Under this scenario, Folsom groups would gear up at lithic sources before they move
onto the Central Plains, using the Central Plains primarily as a hunting ground. Folsom people
would not live all year-round in the Central Plains, but instead would use the area seasonally or
to hunt. Folsom groups would live some part of the year elsewhere—perhaps in the foothills of
the Rockies. The Central Plains lithic material patterns support the hypothesis that Folsom
groups would gear up at lithic sources (i.e., White River Group Silicates and Hartville Uplift)
before moving onto the Central Plains to hunt, and then these same Folsom groups would mostly
repair and replace broken, lost, and worn out points from the hunt after they returned from the
Central Plains.
The lithic materials patterns in the Central Plains Folsom dataset do not appear to support
Scenario 3, where Folsom groups were living in the Central Plains all the time, and performing
logistical moves to the foothills of the Rockies for lithics. If Folsom groups were living in
215
Nebraska year round then we would expect that Smoky Hill Jasper would have been used in a
higher frequency that what the data shows. The evidence seems to support seasonal moves
(Scenario 1) to Flattop and Hartville rather than logistical moves (Scenario 3) to these sources.
Conclusion
This chapter addresses some questions about Folsom behavior in the Central Plains.
These questions are as follows: Were Folsom people living in the area continuously—or instead
were they exploiting specific areas in Nebraska on a seasonal basis? How would the Folsom
archaeological record differ if they were living in the region year round versus only seasonally? Are
Folsom people settling in the foothills and then using the High Plains for hunting (c.f. Amick 1994)?
Is the direction of resource use (from lithic material source areas) proportionately equal to the
directions of Folsom movement into the area from the west, east, north, and south (in proportion to
the availability of lithic materials)?
The patterns in the ratios of preforms and channel flakes to discarded points, ratios of
projectile points to preforms, and lithic materials in the Central Plains Folsom dataset point to a
scenario where Folsom groups were not using the Central Plains all year round, but instead were
exploiting the Western High Plains, Nebraska Sand Hills, Central Great Plains and South Platte
River channel on a seasonal basis. The archaeological signature of the Central Plains Folsom dataset
shows neither a ‘gearing up’ nor a ‘replacement or retooling’ strategy (c.f., Sellet 2013). Instead, a
signature shows a strategy of ‘maintaining an equipment set during a hunt while on the move’. The
patterns in the Central Plains Folsom dataset point to Scenario 1 where there were repeated
movements where Folsom groups were living in the foothills and gearing up at sources of White
River Group Silicates and Hartville Uplift chert sources and heading out onto the Central Plains to
hunt. The patterns in lithic materials show repeated (possibly seasonal) movement of lithic materials
coming eastward into the Central Plains from the west, while Smoky Hill Jasper was moved
216
westward only a fraction of the time (c.f., Hofman 2003). The patterns in the projectile points to
preforms ratios for the Central Plains Folsom dataset could also possibly support Scenario 3, where
they were living in the Central Plains year round and performing logistical moves to White River
Group Silicates and Hartville Uplift sources. In general, the patterns in the Central Plains Folsom
dataset enhance and support previous models of Folsom technological organization and landuse (i.e.,
Sellet 2013; Amick 1994, 1996; and Hofman 2003).
217
Chapter 7: Summary
The Central Plains Folsom study of land use and technological organization addressed
several research questions including the following: Can the concentration of Folsom evidence
near the confluence of the North and South Platte Rivers be attributed entirely to factors other
than the behavior of Folsom people (such as geomorphic processes, modern population, land
under cultivation, or archaeological research intensity)? Does the concentration of Folsom
artifacts near the confluence of the North and South Platte Rivers reflect specific kinds of
Folsom activity? Were Folsom groups living in the area continuously—or instead were they
exploiting specific areas and resources in the Central Plains on a seasonal basis? How would the
Folsom archaeological record differ if they were living in the region year round versus
seasonally? Are Folsom people who live in the foothills of the Rocky Mountains simply using
the High Plains for hunting (c.f., Amick 1994, 1996)? Is the direction of resource use (from lithic
material source areas) proportionately equal to the directions of Folsom movement into the area
from the west, east, north, and south (in proportion to the availability of lithic materials)? This
dissertation began by posing these research questions and gave a background to the study area.
Goals of this study were to demonstrate the usefulness of using regional datasets to study
land use at the regional scale of the Central Plains, and to evaluate the relevance of patterns in
the Central Plains Folsom dataset in relation to some previous models of Folsom technological
organization and land use. This chapter gives a brief summary of the high points of this
dissertation.
In chapter 2, “Method and Theory for Regional Non-Site Archaeology and Folsom
Period Research” the theory of regional ‘off-site’ archaeology is presented. Prior regional scale
218
studies of Folsom, Clovis, and Paleoindian evidence, theories about land use of mobile hunters,
and the limitations and possibilities of projectile-point based studies are reviewed.
Although we cannot assume that the Folsom culture had a land use system like the
Nunamiut, Binford’s (1983a, 1983b) ethnoarchaeological study demonstrated that hunter-
gatherers can be expected to use a vast amount of space—much larger than archaeologists
traditionally consider. Regional-scale studies must acknowledge limitations of relying mainly on
hunting equipment. In addition, the ethical issues associated with using private collections are
discussed and the limitations of inferring patterns of mobility from lithic raw material
distributions are discussed.
In the third chapter, the overall spatial patterns of Folsom diagnostics is explored,
including distributions of reduction stages, and projectile point fragment types. These patterns
have the potential to inform us about elements of Folsom peoples’ activities and their
organization on the landscape.
Most Folsom artifacts in the sample were found in western Nebraska (Figure 3.1), with a
secondary concentration in the southern tier of Nebraska counties. The absence of documented
Folsom artifacts in the northeastern portion of the state is notable.
Broken preforms can indicate places where manufacturing and retooling of projectile
points occurred. The Folsom preforms are concentrated in western Nebraska, with approximately
half of them found in Keith and Lincoln counties which is at the confluence of the North and
South Platte Rivers with another concentration in the southern and east-southern counties. The
South Platte River had almost half of the preform sample.
Complete and nearly complete points may have been lost during hunting at kills or
elsewhere. Blade and edge fragments probably also represent hunting activities. These fragments
219
presumably are from projectile points broken during use while hunting. Most projectile point
blade and edge fragments were found in the western half of the state. Projectile point bases may
have been discarded intentionally and could indicate camps or retooling sites. Projectile point
bases occur in the western half of Nebraska with another concentration in the southern and east-
southern counties. The projectile point bases distribution is much more widespread than for
projectile point tips.
Projectile point tips may be lost and left in animal carcasses and could indicate kill sites.
Their distribution is less widespread than for projectile point bases. The primary concentration
for projectile point tips is highest at the confluence of the North and South Platte Rivers.
Chapter 4 investigates the potential sampling biases in the sample. These include modern
population, modern land use, archaeological research, and geomorphic factors. No correlation
exists between modern population density and Folsom artifact density for any ecoregions in
Nebraska.
Modern landuse (cultivation) was evaluated and revealed a small but insignificant
negative correlation in both the Western High Plains and Central Great Plains regions. A
significant negative correlation was found in the Nebraska Sand Hills and the Corn Belt Plains.
There was a significant negative correlation between the percentage of cultivated land and
Folsom artifact density. Land with more cultivation was less likely to yield Folsom artifacts in
these regions. Because cropland is commonly on low terraces and these terraces are too young to
have Folsom-age artifacts on their surfaces (cf. Mandel 2008). Folsom-aged cultural deposits are
expected to occur in the T2 and higher terraces.
Archaeological research intensity was evaluated as a sampling bias. Pearson’s product-
moment correlations were used to evaluate the potential relationship between Folsom artifact
220
density and the intensity of archaeological research and revealed a small positive correlation for
the Central Plains ecoregion, but the Western High Plains, Nebraska Sand Hills, and Corn Belt
Plains had no correlation. None of these correlations were statistically significant.
Geomorphic factors can influence artifact patterning. Geomorphic factors considered
included alluvial systems, sand hills, loess deposition, and climatic and vegetative changes that
led to Holocene erosion and deposition. We need more systematic documentation in the Sand
Hills because the current Clovis and Folsom distributions suggest there are exposures of Folsom-
age deposits in the region. A high rate of erosion on uplands resulted in sediments being
transported to streams “where it was deposited on alluvial fans and floodplains resulting in deep
burial of Paleoindian-age landscapes” (Mandel 2008:359).
Loess deposition and re-deposition in the uplands of south-central, eastern, and
northeastern areas of Nebraska could have buried Folsom artifacts. But, many of the uplands
have exposures due to the considerable water and wind erosion that has occurred in these
settings. Clovis surface artifacts have been found in eastern Nebraska (Holen 2003) so if Folsom
people were active in eastern Nebraska we should expect that Folsom age artifacts would be
exposed in this region.
The Clovis and Folsom distributions are distinctive. The Folsom artifact count was
greater than for Clovis in each ecoregion with artifacts. This difference was statistically
significant. The northeastern part of Nebraska has little Folsom evidence. This is not due to a
lack of documentation of collections because Clovis are well-represented in northeastern
Nebraska.
221
This investigation reveals that geomorphic factors such as alluvial valleys potentially bias
Folsom artifact occurrences, while other factors (such as loess deposition, Holocene erosion, and
sand dunes) are probably not biasing the Folsom distribution.
Chapter 5 examines patterns in lithic materials and reduction stages in the Folsom
sample. White River Group Silicates (WRGS) are most common at the confluence of the North
and South Platte Rivers. The majority are in western Nebraska with few in south-central
Nebraska. Fifteen WRGS preforms were found in western Nebraska in the Western High Plains,
Nebraska Sand Hills, and Central Great Plains ecoregions. WRGS channel flakes are from the
Western High Plains and the South Platte River.
The overall distribution of Hartville Uplift artifacts (24.2% of the sample) reveals a
concentration at the confluence of the North and South Platte Rivers. All of these artifacts
occurred in the western half of Nebraska in the South Platte River, Nebraska Sand Hills, Western
High Plains, and Central Great Plains ecoregions.
Hartville Uplift Folsom artifacts have a larger spatial distribution than WRGS artifacts.
Both materials are concentrated in the Western half of the state, but Hartville is better
represented in the central and northwestern portions than are WRGS artifacts. In the Western
High Plains and South Platte River WRGS has a greater frequency. No WRGS or Hartville
artifacts were found in the eastern and northeastern ecoregions of Nebraska.
The sample has eleven Folsom preforms of Hartville and all were found in the western
half of the state. The greatest frequency was at the confluence of the North and South Platte
Rivers. The South Platte River had the most Hartville preforms followed by the North Platte
River, Nebraska Sand Hills, and Central Great Plains.
222
The Folsom artifacts made of Smoky Hill Jasper (SHJ) make up 12.4% of the total. The
southern tier of Nebraska counties has the most SHJ artifacts. Harlan County in this area has the
most SHJ artifacts and is located near a source of SHJ. The Central Great Plains ecoregion had
the most SHJ artifacts, followed by the Western High Plains, South Platte River, and Nebraska
Sand Hills.
Comparing the overall distribution and frequency of SHJ to WRGS and Hartville reveals
that in every artifact category (Folsom points, Midland points, preforms, and channel flakes),
WRGS and Hartville artifacts occur in higher frequencies than SHJ. In terms of the overall
distribution, SHJ was found in 13 counties, WRGS was found in 15, and Hartville was found in
24. For both WRGS and Hartville, the greatest frequency was found at the confluence of the
North and South Platte Rivers. Although SHJ artifacts were also found there, the greatest
frequency of SHJ artifacts is found in the southern Nebraska counties. In the central and
northwestern parts of Nebraska, Hartville is better represented than SHJ and WRGS. In the
Central Great Plains, SHJ is better represented than WRGS and Hartville. However, in the
Western High Plains, Nebraska Sand Hills, and South Platte River, both WRGS and Hartville
have higher frequencies than SHJ. The SHJ sample had ten preforms from six counties, with the
most from southern Nebraska.
There is a small overlap in the WRGS, Hartville, and SHJ Folsom preform distributions.
Preforms capture an intermediate reduction stage not represented by finished points. WRGS,
SHJ, and Hartville preforms were found distant from their sources which indicates that not all
production occurred at the lithic material sources and when groups moved across the landscape
they produced projectile points as needed.
223
The sample has 15 WRGS preforms found at an average distance of 188 km from the
source (Table 5.5). The majority of the WRGS preforms were found at the confluence of the
North and South Platte Rivers
Eleven Hartville preforms were found at an average distance of 294 km from the source
area (Table 5.7). The majority of the Hartville preforms were found at the confluence of the
North and South Platte Rivers. Ten SHJ preforms were found at a mean distance of 134 km from
the source area (Table 5.9). Smoky Hill Jasper preforms were primarily found in the southern tier
of counties.
Examination of WRGS, Hartville, and SHJ preforms revealed that some production was
happening close to the source, and as Folsom groups moved and had kill events, there was a need
to replenish their projectile points. Therefore other places on the landscape were point production
places. The average distances that preforms were found from the source varied—with the
shortest average distance being SHJ at 134 km (Table 5.9), the next shortest was WRGS
preforms at 188 km from the source (Table 5.5), and finally, Hartville preforms at 294 km (Table
5.7).
Chapter 6 examined the Central Plains Folsom sample in relation to some previous
models of Folsom land use and technological organization (Amick 1994, 1996; Sellet 2013; and
Hofman 2003). Three possible scenarios for Folsom land use and technological organization for
the Central Plains dataset were evaluated. In scenario 1, Folsom groups are not living in the
Central Plains year-round, but instead lived elsewhere—likely in the foothills of the Rocky
Mountains—and only came into the Central Plains to hunt. In this scenario, the archaeological
signature would be one of ‘maintaining an equipment set during a hunt (while on the move).’
This signature would show a light mix of preforms and a greater number of discarded points and
224
is analogous to Amick’s (1994, 1996) model. In scenario 2, Folsom groups were living in
Nebraska full-time and thus are hunting in an area where they live. The archaeological signature
in this type of scenario would show ‘gearing up’ sometimes and
‘replacement/repairing/retooling’ at other times as outlined in Sellet’s (2013) model. In scenario
3, Folsom groups were living in Nebraska year-round, but they made logistical trips to the
foothills for lithics (i.e., White River Group Silicates at Flattop Butte, and Hartville Uplift chert)
and probably other resources like special woods. They would then return to the Central Plains to
live and hunt and would carry non-local preforms, bifaces, and finished points. In this third
scenario we would expect to commonly see preforms in the Central Plains Folsom sample.
Patterns in the Central Plains Folsom dataset were examined in relation to previous
models of Folsom land use and technological organization. The ratio of preforms and channel
flakes to discarded points pattern fits with a ‘maintenance during a hunting period while on the
move’ type of strategy rather than a ‘gearing up’ or ‘replacement/retooling’ strategy for
projectile point production and maintenance (see Figure 6.1). The credibility of this result is
dependent upon how much weight is given to the possible sampling bias of preform recognition
and reporting by archaeologists and collectors. This pattern can be argued to support that the
Central Plains was used primarily as a hunting area by Folsom groups who did not live in the
Central Plains year round, but instead lived elsewhere, probably in the foothills of the Rockies
(Scenario 1). In this scenario, Folsom groups would ‘gear up’ before heading out onto the
Central Plains and then would do their ‘replacement/repair/retooling’ after returning from an
extended hunt in the Central Plains. While hunting in the Central Plains, they used a
‘maintaining an equipment set while on the move’ strategy for projectile point production and
maintenance.
225
An argument can also be made that the patterns in the ratio of discarded points to
preforms and channel flakes in the Central Plains Folsom sample represent Scenario 3. In this
scenario, Folsom groups lived in the Central Plains all the time, but made logistical trips to lithic
sources. They would have returned from the lithic sources carrying preforms made of Flattop and
Hartville Uplift chert. In this scenario, logistical camps should be located near the source areas.
At these camps there would be a large number of discarded preforms in relation to discarded
points (‘gearing up’). In this scenario, only failed preforms would be found in the Central Plains
(the habitation area). Under this scenario, preforms would be underrepresented in the Central
Plains, which is the case for most regions in the Central Plains.
The patterns in the projectile points to preforms ratios for the Central Plains Folsom
sample were examined and revealed that the Western High Plains (8.43), Nebraska Sand Hills
(17.75), and Central Great Plains (6.27) all had high ratios of projectile points to preforms (i.e.,
ratios that were greater than 5:1). All these regions had relatively high numbers of finished
projectile points compared to the number of preforms. These regions had evidence for a high
number of projectile point discards in comparison to relatively little evidence for the
manufacturing of projectile points. This type of pattern would be expected if these areas were
used primarily for hunting. In contrast, the South Platte River (1.88), North Platte River (1.50),
and Corn Belt Plains (2.00) had low projectile point to preform ratios (however, the North Platte
River and Corn Belt Plains had very small sample sizes). The South Platte River had 45
projectile points and 24 preforms. This is the type of pattern we would expect if they were
camping longer in this area and it could have served as a habitation area. The gravel bars in the
river are good places to camp as they offer a wide variety of resources (e.g., wood, water, lithics,
226
shelter, and animals). They also could have hunted bison when they were watering or crossing in
the river channel.
The pattern in the projectile points to preforms ratios for the Central Plains sample could
be argued to support Scenario 1 and possibly Scenario 3. Scenario 1 is that the Central Plains
was not used year round, but instead was primarily a hunting ground used by Folsom groups that
lived outside the Central Plains (most logically in the foothills of the Rocky Mountains). This
scenario is analogous to Amick’s (1994,1996) model for the Southern High Plains and Basin and
Range—where Folsom groups were using the High Plains for hunting and the Basin and Range
area primarily as a habitation area. The patterns in the ratio of projectile points to preforms for
the South Platte River show that they may have been using the river channel or confluence area
for habitation on a seasonal basis while they were hunting in the Central Plains.
The pattern in the ratios of projectile points to preforms could also point to Scenario 3. In
this scenario, Folsom groups were living in Nebraska all the time, and were making logistical
trips to the foothills for resources such as special woods and lithics (i.e., Flattop and Hartville
Uplift chert). In this scenario Folsom groups are hunting in the Central Plains, an area in which
they lived. Under Scenario 3, the space between the North and South Platte Rivers would have
been good places to live as the rivers provided shelter, animals, wood, lithics, and water.
Patterns in the lithic materials for the Folsom dataset were examined. White River Group
Silicates (WRGS), Hartville Uplift chert, and Smoky Hill Jasper (SHJ) are the three main lithic
materials. More than 31% of the total sample is made of WRGS, 24 % is Hartville, and 12.4% is
SHJ. Other materials, mostly from further distant sources (i.e., Fossil Wood, Permian chert,
Knife River Flint, Quartzite, Alibates, Edwards chert, Porcelanite, and Tongue River Silicified
Sediment) are in the sample, but these materials make up a small proportion of the sample and
227
could reflect trade or incidental usage. WRGS and Hartville dominate the sample, but SHJ makes
up a significant minority and is interesting because the source areas for this material are from a
different direction and occur differently with the study area than WRGS and SHJ.
Since Flattop Butte is the closest source to the study area for WRGS, it was assumed to
be the source for the majority of the artifacts in the Central Plains Folsom sample. Based on the
WRGS evidence in the sample, this material appears to be repeatedly moved from the west into
the study area. If Folsom groups were living at the WRGS source area seasonally, we would
expect to find a lot of preforms near the source area. If they were performing logistical moves to
the source area for lithics, they would come back into Nebraska carrying WRGS preforms,
bifaces, and finished points.
Hartville Uplift chert sources are found in the Hartville Uplift in east-central Wyoming.
Hartville is also found in the western Nebraska panhandle in secondary gravel deposits. Folsom
artifacts made of Hartville were moved from the Hartville source area into Nebraska in a
northeastern, eastern, and southeastern direction. Based on the WRGS and Hartville evidence in
the Central Plains Folsom sample, apparently lithic materials were moved repeatedly into
Nebraska from the west.
The sample has 38 artifacts made of SHJ, making up a significant minority of the total
sample. Primary sources for SHJ are in the Saline and Republican River drainages in
northwestern Kansas and south-central Nebraska and include the Medicine Creek Reservoir area
which lies in the Republican River Drainage in Frontier County. Smoky Hill Jasper was moved
from the Republican River Drainage into Nebraska from southeastern, western, northwestern,
and northern directions. The Central Plains Folsom sample for the SHJ artifacts is a pattern
228
where we see that even though primary sources for SHJ are located closer, the sample is
dominated by Hartville Uplift chert and WRGS.
The lithic material patterns seen in the three primary materials in the Central Plains
Folsom sample support Hofman’s (2003) model. This model found that WRGS Folsom artifacts
were carried from the west to counties in southwest Nebraska, counties in northeastern Colorado,
and the Nolan site which is located in Chase County in southwestern Nebraska. Folsom groups
were moving WRGS eastward into southwestern Nebraska and northeastern Colorado at a much
higher rate than SHJ artifacts were being carried westward into these same areas. The patterns
seen in the lithic materials for the Central Plains Folsom sample enhance Hofman’s (2003)
model in that the present study found that, like the patterns seen for WRGS, Folsom groups were
carrying Hartville Uplift chert to the east at a higher rate than SHJ was carried to the west, even
though sources for SHJ were closer. Average distances for all Hartville, WRGS, and SHJ
artifacts (from the source to the center of the county where the artifact was found) were 307 km
for Hartville, 187 km for WRGS, and 141 km for SHJ.
The patterns in the lithic materials of the Central Plains Folsom sample would support
Scenario 1. In this scenario, Folsom groups did not live in the Central Plains year round, but
instead likely lived in the foothills of the Rockies. They would gear up at sources of WRGS or
Hartville Uplift chert before heading into the Central Plains. They would use the Central Plains
seasonally, or to hunt. They would repair and replace broken, lost, and worn out points after they
returned from the Central Plains.
The patterns seen in the lithic materials of the Central Plains Folsom sample do not
support Scenario 3. In Scenario 3, Folsom groups lived in the Central Plains year-round, but
performed logistical moves to lithic sources in the foothills (i.e., WRGS and Hartville). If
229
Folsom groups were living in the Central Plains, then the patterns would show a much higher use
of Smoky Hill Jasper than the data in the present study reveals.
In conclusion, the patterns in the Central Plains dataset support and enhance previous
models of Folsom technological organization and land use (Amick 1994; 1996; Sellet 2013; and
Hofman 2003). The patterns seen in the discarded points to preforms and channel flakes, ratios
of projectile points to preforms, and lithic materials for the Central Plains Folsom dataset point to
Scenario 1 where Folsom groups did not live in the Central Plains year-round. Instead, Folsom
groups were gearing up at sources of WRGS and Hartville Uplift chert and then heading out onto
the Central Plains to hunt (probably on a seasonal basis) in the Western High Plains, Central
Great Plains, Nebraska Sand Hills, and South Platte River of Nebraska. They likely lived in the
foothills of the Rocky Mountains instead of the Central Plains and used the Central Plains to
hunt. This scenario is analogous to Amick’s (1994, 1996) model for the Southern High Plains
and Basin and Range. The Central Plains Folsom dataset has an archaeological signature that
shows a ‘maintaining an equipment set while on the move’ type of strategy for the production
and maintenance of their projectile points. The strategies of ‘gearing up’ and ‘replacement or
retooling’ were not seen in the Central Plains Folsom sample (c.f., Sellet 2013). The lithic
material patterns in the Central Plains Folsom dataset appear to reveal repeated movements of
lithic materials from the west (i.e., White River Group Silicates and Hartville) coming eastward
into the Central Plains. In contrast Smoky Hill Jasper was moved westward only a small portion
of the time (c.f., Hofman 2003).
230
References Cited
Ahler, S. A.
1977 Lithic Resource Utilization Patterns in the Middle Missouri Subarea. Memoir 13:
Trends in Middle Missouri Prehistory: A Festschrift Honoring the Contributions of
Donald J. Lehmer. Plains Anthropologist 22: 132-150.
Ahler, S. A. and P. R. Geib
2000 Why flute? Folsom point design and adaptation. Journal of Archaeological Science
27:799-820.
Albanese, J.
2000 Resume of geoarchaeological research on the Northwestern Plains. In
Geoarchaeology in the Great Plains, ed. by R. D. Mandel, pp. 199-249. University of
Oklahoma Press, Norman.
Amick, D. S.
1994 Folsom diet breadth and land use in the American Southwest. PhD dissertation,
University of New Mexico.
1996 Regional patterns of Folsom mobility and land use in the American Southwest.
World Archaeology 27:411-426.
Andrews, B. N., J. M. LaBelle, and J. D. Seebach
2008 Spatial variability in the Folsom archaeological record: A multi-scalar approach.
American Antiquity 73: 464-490.
Anderson, D. C. and H. A. Semken, Jr. (editors)
1980 The Cherokee Excavations: Holocene Ecology and Human Adaptations in Northwestern
Iowa. Academic Press, New York.
Antevs, E.
1955 Geologic-Climatic Dating in the West. American Antiquity 20:317-335.
Bamforth, D. B.
2002 High-tech foragers? Folsom and later Paleoindian technology on the Great Plains.
Journal of World Prehistory 16: 55–98.
2009 Projectile points, people, and Plains Paleoindian perambulations. Journal of
Anthropological Archaeology 28:142-157.
Balakrishnan, M., C. Yapp, D. J. Meltzer, J. Theler
2005 Paleoenvironment of the Folsom site ~10,500 14C years B.P. as inferred from the stable
isotope composition of fossil land snails. Quaternary Research 63:31-44.
Bement, L. C., and B. J. Carter
2008 A Younger Dryas signature on the Southern Plains. Current Research in the Pleistocene
25:193-194.
231
Bement, L. C., B. J. Carter, R. A. Varney, L. S. Cummings, and J. B. Sudbury.
2007 Paleoenvironmental reconstruction and bio-stratigraphy, Oklahoma Panhandle, USA.
Quaternary International 169-170:39-50.
Bettis, E. A. III, J. P. Mason, J. B. Swinehart, X. Miao, P. R. Hanson, R. J. Goble, D. B. Loope,
P. M. Jacobs, H. M. Roberts
2003 Cenozoic Eolian Sedimentary Systems of the USA Midcontinent. In: Quaternary
Geology of the United States, INQUA 2003 Guide Volume. Ed. by: D. J. Easterbrook.
Desert Research Institute, Reno, NV, p. 195-218.
Binford, L. R.
1977 Forty seven trips. A case study in the character of archaeological formation
processes. In R. V. Wright (ed.), Stone Tools as Cultural Markers: Change,
Evolution, and Complexity, 24-36. Australian Institute of Aboriginal Studies,
Canberra.
1978a Evidence for differences between residential and special-purpose sites. In
Nunamiut Ethnoarchaeology, 488-497. Academic Press, New York.
1980 Willow smoke and dogs' tails: hunter-gatherer settlement systems and archaeological
formation processes. American Antiquity, 45: 4-20.
1983a Long term land use patterns: some implications for archaeology. In Lulu Linear
Punctated: Essays in Honor of George Irving Quimby (eds R. Dunnell and D. Grayson).
Ann Arbor: University of Michigan, Museum of Anthropology, Anthropological Papers
No. 72, pp. 27-53.
1983b Hunters in a Landscape. In In Pursuit of the Past. By L. R. Binford. New York: Thames
& Hudson, pp. 109-143.
1991 When the going gets tough, the tough get going: Nunamiut local groups, camping
patterns and economic organizations. In Ethnoarchaeological Approaches to Mobile
Campsites (eds C. Gamble and W. Boismier). Ann Arbor, Mich.: International
Monographs in Prehistory, Ethnoarchaeological Series No. 1, pp. 25-137.
Blackmar, J. M.
2001 Regional variability in Clovis, Folsom, and Cody land use. Plains
Anthropologist 46:65-86.
Blackmar, J. M. and J. L. Hofman
2006 The Paleoarchaic of Kansas. In Kansas Archaeology, ed. by R. J. Hoard and W. E.
Banks, pp. 46-75. University of Kansas Press, Lawrence.
Boldurian, A.T. and J.L. Cotter
1999 Clovis Revisited: New Perspectives on Paleoindian Adaptations from Blackwater Draw,
New Mexico. University Museum Monographs, University of Pennsylvania, PA.
Bozell, J. R.
1994 Big game hunters. In The Cellars of Time: Paleontology and Archaeology in
Nebraska. Nebraska History 4:84-93.
232
Brantingham, P. J.
2006 Measuring forager mobility. Current Anthropology 47:435-459.
Bryson, R. A., D. A. Baerreis, and W. M. Wendland
1970 The Character of Late-Glacial and Post-Glacial Climatic Changes. In Pleistocene and
Recent Environments of the Central Great Plains, Edited by Wakefield Dort, Jr. and J.
Knox Jones, Jr., pp. 53-76. University Press of Kansas, Lawrence.
Cordova, C. E., W. C. Johnson, R. D. Mandel, M. W. Palmer
2010 Late Quaternary environmental change inferred from phytoliths and other soil-related
proxies: Case studies from the Central and Southern Great Plains, USA. Catena 85: 87-
108.
Crabtree, D.
1972 An Introduction to Flintworking. Occasional Papers of the Idaho State Museum, No.
28.
Craig, C.
1983 Lithic source analysis and interpretation in Northeastern Wyoming and
Southeastern Montana. M.A. thesis, University of Wyoming, Laramie.
Deevy, E. S., and R. F. Flint
1957 Postglacial Hypsithermal Interval. Science 125:182-184.
Dunnell, R. C., and W. S. Dancey
1983 The siteless survey: A regional scale data collection strategy. In Schiffer, M. B. (ed),
Advances in Archaeological Method and Theory, Academic Press, New York, pp. 267
-287.
Ebert, J. I.
1992 Distributional Archaeology, University of New Mexico Press, Albuquerque.
Foley, Robert
1981a A Model of Regional Archaeological Structure. Proceedings of the Prehistoric
Society, Vol. 47: 1–17.
1981b Off-Site Archaeology: An Alternative Approach for the Short-Sited. In: Patterns of
the Past: Studies in Honour of David Clarke, edited by Ian Hodder, Glynn Isaac, and
Norman Hammond, pp. 157-183. Cambridge University Press.
1981c Off-Site Archaeology and Human Adaptation in Eastern Africa: An Analysis of
Regional Artefact Density in the Amboseli, Southern Kenya. Cambridge Monographs in
African Archaeology 3. BAR International Series 97.
Forman, S.L. and J. Pierson
2002 Late Pleistocene Luminescence Chronology of Loess Deoposition in the Missouri and
Mississippi River Valleys. United States. Paleogeography, Paleoclimatology,
Paleoecology 186:25-46.
233
Fredlund, D. E.
1976 Fort Union Porcellanite and Fused Glass: Distinctive Lithic Materials of Coal Burn
Origin on the Northern Plains. Plains Anthropologist 21:73, 207-211.
Frison, G. C. and D. J. Stanford
1982 The Agate Basin Site: A Record of the Paleoindian Occupation of the
Northwestern High Plains, Academic Press, New York.
Greiser, S. T.
1985 Predictive Models of Hunter-Gatherer Subsistence and Settlement Strategies on the
Central High Plains. Plains Anthropologists Memoir 20. Vol. 3, No. 110, Pt. 2, pp. v
-134.
Grimm, E. C.
2001 Trends and paleoecological problems in the vegetation and climate history of
the Northern Great Plains, U.S.A. In Biology and Environment: Proceedings of
the Royal Irish Academy 101B:47-64.
Hannus, L. A.
1985 The Lange/Ferguson Site—an Event of Clovis Mammoth Butchery with the Associated
Bone Tool Technology: The Mammoth and its Tracks. Ph.D. Dissertation, University of
Utah Department of Anthropology. University Microfilms International, Ann Arbor,
Michigan.
Haynes, C. V., Jr.
1993 Clovis-Folsom geochronology and climate change. In From Kostenki to Clovis: Upper
Paleolithic-Paleo-Indian Adaptations. Eds. O. Soffer and N. D. Praslov. New York:
Plenum Press, pp. 219-236.
Haynes, C. V., Jr., r. P. Beukens, A. J. T. Jull, and O. K. Davis
1992 New radiocarbon dates for some old Folsom sites: Accelerator technology.
In Ice Age Hunters of the Rockies, ed. By D. J. Stanford and J. S. Day, pp. 83
-100. Denver Museum of Natural History, Denver.
Hill, M. E., Jr.
2007 A moveable feast: Variations in faunal resource use among Central and Western North
American Paleoindian sites. American Antiquity 72:417-438.
Hill, M. E., Jr., J. L. Hofman, and K. Kinsey
1996 A history of archeological research on the Central Plains. In Archeology and
Paleoecology of the Central Great Plains, ed. by J. L. Hofman, pp. 29-40. Arkansas
Archeological Survey Research Series No. 48.
Hoard, R. J., S. R. Holen, M. D. Glascock, H. Neff, and J. M. Elam
1991 Neutron Activation Analysis of Stone from the Chadron Formation and Clovis Site on
the Central Plains. Journal of Archaeological Science 19:655-665.
234
Hofman, J.L.
1991 Folsom land use: Projectile point variability as a key to mobility. In Raw
Material Economies among Prehistoric Hunter-Gatherers, ed. A.
Montet-White and S. Holen, 285-303. Lawrence: University of Kansas.
1992a Recognition and interpretation of Folsom technological variability on the Southern
Plains. In: Stanford, D.J., Day, J.S. (Eds.), Ice Age Hunters of the Rockies. Denver
Museum of Natural History and the University Press of Colorado, Denver, pp. 193–
224.
1992b An Ode to Collections Lost. In: Guide to the Identification of certain American Indian
Projectile Points. By Robert E. Bell. Special Bulletin No. 1 of the Oklahoma
Anthropological Society. Oklahoma Geological Survey. Norman, Oklahoma.
1994 Paleoindian aggregations on the Great Plains. Journal of Anthropological Archaeology,
13:341 ̶ 70.
1996 Early hunter-gatherers of the Central Great Plains: Paleo-Indians and Mesoindian
(Archaic) cultures. In Archaeology and Paleoecology of the Central Great Plains.
Research Series No. 48, ed. by J. L. Hofman, pp. 41-100. Arkansas Archaeological
Survey, Fayetteville.
1999a Folsom fragments, site types, and assemblage formation. In: Amick, D.S. (Ed.), Folsom
Lithic Technology. International Monographs in Prehistory, Ann Arbor, pp. 122–143.
1999b Unbounded hunters: Folsom bison hunting on the Southern Plains circa 10,500 B.P.,
the lithic evidence. In, Bison Subsistence Through Time: From Paleolithic to
Paleoindian Times, edited by J. Ph. Brugal, F. David, J. G. Enloe, and J. Jaubert, pp.
383-415. Editions APDCA, Antibes, France.
2003 Tethered to stone or freedom to move: Folsom biface technology
in a regional perspective. In: Marie, S., Dibble, H.L. (Eds.), Multiple Approaches
to the Study of Bifacial Technologies. University of Pennsylvania Museum of
Archaeology and Anthropology, Philadelphia, pp. 229–249.
Hofman, J. L., D. S. Amick, and R. O. Rose
1990 Shifting Sands: A Folsom-Midland assemblage from a campsite in Western
Texas. Plains Anthropologist 35:221-253.
Hofman, J. L. and I. S. Hesse
2002 Clovis in Kansas. TER-QUA Symposium Series, Vol. 3, edited by W. Dort, Jr., pp. 15
-36. Institute for Tertiary-Quaternary Studies.
Hofman, J. L. and R. W. Graham
1998 Paleoindian Cultures of the Great Plains. In Archaeology on the Great Plains, ed. by
W. R. Wood, pp. 87-139. University of Kansas Press, Lawrence.
Holen, S. R.
2001 Clovis mobility and lithic procurement on the Central Great Plains of North America.
Ph.D. dissertation. University of Kansas, Lawrence.
2003 Clovis Projectile Points and Preforms in Nebraska: Distribution and Lithic Sources.
Current Research in the Pleistocene 20:31-33.
235
Holen, S. R. and D. W. May
2002 The La Sena and Shaffert Mammoth Sites: History of Investigations. In, D. Roper,
editor, Medicine Creek: Seventy Years of Archaeological Investigations, pp. 20-36.
University of Alabama Press, Tuscaloosa.
Holen, S. R. and J. L. Hofman
1999 Folsom Evidence from the Nebraska Sand Hills: The Elfgren Site. Current Research in
the Pleistocene 16:38-40.
Holliday, V. T.
1995 Stratigraphy and paleoenvironments of Late Quaternary valley fills on the Southern
High Plains. In Memoir 186. Geological Society of America Memoir, Boulder,
Colorado.
2000 The evolution of Paleoindian geochronology and typology on the Great Plains.
Geoarchaeology 15:227-290.
Holliday, V. T., D. J. Meltzer, and R. Mandel
2011 Stratigraphy of the Younger Dryas Chronozone and paleoenvironmental implications:
Central and Southern Great Plains. Quaternary International 242:520-533.
Holliday, V. T., J. H. Mayer, G. G. Fredlund
2008 Late Quaternary sedimentology and geochronology of small playas on the Southern
High Plains, Texas and New Mexico, U.S.A. Quaternary Research 70:11-25.
Hoyer, B. E.
1980 Geology of the Cherokee Sewer site. In: Anderson, D. C. and Semken, Jr., H. A. (Eds.)
The Cherokee Excavations: Holocene Ecology and Human Adaptations in
Northwestern Iowa. Academic Press, New York, pp. 21-66.
Humphrey, J. D. and C. R. Ferring
1994 Stable isotope evidence for latest Pleistocene and Holocene climatic change in north-
central Texas. Quaternary Research 41:200-213.
Ingbar, E. E.
1992 The Hanson site and Folsom on the Northwestern Plains. In Ice Age Hunters of
the Rockies, ed. D. J. Stanford and J. S. Day, 169-192. Denver Museum of
Nature and Science and University Press of Colorado, Boulder.
1994 Lithic material selection and technological organization. In The Organization of
North American Prehistoric Chipped Stone Tool Technologies, ed. P. Carr, 45
-56. International Monographs in Prehistory, Archaeological Series 7, Ann Arbor.
Ingbar, E. E. and J. L. Hofman
1999 Folsom fluting fallacies. In Folsom Lithic Technology, ed. D. S. Amick, 98-110.
International Monographs in Prehistory, Archaeological Series 12, Ann Arbor.
236
Johnson, E.
1986 Late Pleistocene and early Holocene vertebrates and paleoenvironments on Southern
High Plains, U.S.A. Géographie physique et Quaternaire 40:249-261.
1987a Vertebrate remains. In, Lubbock Lake: Late Quaternary Studies on the Southern High
Plains. Edited by E. Johnson. Texas A&M University Press, College Station, pp. 49-89.
1987b Paleoenvironmental overview. In, Lubbock Lake: Late Quaternary Studies on the
Southern High Plains. Edited by E. Johnson. Texas A&M University Press, College
Station, pp. 90-99.
Johnson, G. A.
1977 Aspects of Regional Analysis in Archaeology. Annual Review of Anthropology 6:479
-508.
Johnson, W. C. and K. L. Willey
2000 Isotopic and rock magnetic expression of environmental change at the
Pleistocene-Holocene transition in the Central Great Plains. Quaternary
International 67:89-106.
Jones, G. T., C. Beck, E. E. Jones, and R. E. Hughes
2003 Lithic Source Use and Paleoarchaic Foraging Territories in the Great Basin. American
Antiquity 68:5-38.
Kantner, J.
2008 The archaeology of regions: From discrete analytical toolkit to ubiquitous spatial
perspective. Journal of Archaeological Research 16:37-81.
Kelly, R. L., and Todd, L.C.
1988 Coming into the country: early Paleoindian hunting and mobility. American Antiquity
53:231 ̶ 234.
Keyer, James D. and John L. Fagan
1987 East Shore Pines Porcurement and Processing of Tongue River Silicified Sediment.
Plains Anthropologist 32:233-256.
Knox, J. C.
1983 Responses of river systems to Holocene climates. In: Wright Jr., H. E. (Ed.), Late
Quaternary Environments of the United States – the Holocene. University of Minnesota
Press, Minneapolis, pp. 26-41.
Koch, A. and J. Miller
1996 Geoarchaeological Investigations at the Lyman Site (25SF53) and Other Cultural
Resource Related to Table Mounatin Quarry Near the Nebraska/Wyoming Border.
Nebraska State Historical Society, Lincoln.
237
Kutzbach, J. E.
1987 Model simulations of the climatic patterns during the deglaciation of North America.
In: Ruddiman, W. F., Wright Jr., H. E. (Eds.), The Geology of North America, vol. K-3.
The Geological Society of America, Boulder, Colorado. pp. 425-446.
Lepper, B. T.
1983 Fluted Point Distributional Patterns in the Eastern United States: A Contemporary
Phenomena. Midcontinental Journal of Archaeology 8:269-285.
LeTourneau, P. D.
2000 Folsom toolstone procurement in the southwest and southern Plains. PhD dissertation,
University of New Mexico, Albuquerque.
Loebel, T. J.
2005 The organization of Early Paleoindian economies in the Western Great Lakes. Ph.D.
Dissertation. University of Illinois, Chicago. UMI Dissertation Services, Ann Arbor,
MI.
2012 Pattern or bias? A critical evaluation of Midwestern fluted point distributions using
raster based GIS. Journal of Archaeological Science 39:1205-1217.
Lynott, M. A., and A. Wylie
1995 Ethics in American Archaeology: Challenges for the 1990s. Washington, D. C.: Society
for American Archaeology.
Maat, P. B. and W. C. Johnson
1996 Thermoluminescence and 14C age Estimates for Late Quaternary Loesses in
Southwestern Nebraska. Geomorphology 17:115-128.
Mandel, R. D.
1995 Geomorphic controls of the Archaic record in the Central Plains of the United States.
In: Archaeological Geology of the Archaic Period in North America, Special Paper
297, ed. by E. A. Bettis, pp. 37-66. The Geological Society of America, Boulder,
Colorado, pp. 37-66.
2006 Late Quaternary and modern environments in Kansas. In: Kansas Archaeology, ed. by
R. J. Hoard and W. E. Banks, pp. 10-27. University of Kansas Press, Lawrence.
2008 Buried Paleoindian-age landscapes in stream valleys of the Central Plains, USA.
Geomorphology 101:342-361.
Martin, C. W.
1993 Radiocarbon Ages on Late Pleistocene Loess Stratigraphy of Nebraska and Kansas,
Central Great Plains. Quaternary Science Reviews 12:179-188.
Martin, L.D.
2010 Personal communication. Biodiversity Institute, University of Kansas
238
Mason, J. A. and M. S. Kuzila
2000 Episodic Holocene Loess Deposition in Central Nebraska. Quaternary International.
67:119-131.
Mason, J. A. P.M. Jacobs, P. R. Hanson, X. Miao, and R. J. Goble
2002 Bignell Loess in the Central Great Plains Provides a Continuous Record of Holocene
Dune Activity and Climate Change. American Quaternary Association Program and
Abstracts of the 17th Annual Meeting. p. 90.
May, D. W.
1990 The potential for buried archaeological sites along the Fullerton and Elba canals,
North Loup and Loup river valleys, Nebraska. Report submitted to the Bureau of
Reclamation. U.S. Department of Interior, Grand Island, Nebraska
May, D. W. and S. R. Holen
1993 Radiocarbon Ages of Soils and Charcoal in Late-Wisconsinan Loess in South-Central
Nebraska. Quaternary Research 39(1):55-58.
2003 Eolian Stratigraphy and Landform Evolution at a Paleoindian site along the South Platte
River Valley, Nebraska, U.S.A. Geoarchaeology 18(1):145-159.
2005 Stratigraphy at the Jensen Mammoth Site in the Central Platte River Valley, Dawson
County, Nebraska. Current Research in the Pleistocene 22:87-89.
Meltzer, D. J.
2006 Folsom: New Archaeological Investigations of a Classic Paleoindian Bison Kill.
University of California Press, Berkeley.
Meltzer, D. J. and V. T. Holliday
2010 Would North American Paleoindians have noticed Younger Dryas Age climate
changes? Journal of World Prehistory 23:1-41.
Muhs, D. R., J. N. Aleinikoff, T.W. Stafford, R. Kihl, Jr., S. A. Mahan, and S. D. Coward
1999 Late Quaternary Loess in Northcentral Colorado I: Age and Paleoclimatic Significance.
Geological Society of America Bulletin 111:1861-1875.
Nelson, T.
2015 Personal communication on March 3, 2015. Curator, Archaeology Collections,
Nebraska State Historical Society, Lincoln, Nebraska.
No Author
2002 Science and Technology: Can You Dig It?; Ethics and Archaeology. The Growing
Importance of Ethical Considerations in Transforming Archaeology. The Economist
362 (8266): 69-72. March 30, 2002.
Prasciunas, M. M.
2008 Clovis projectile point distribution: Separating behavior from sample bias. In Clovis
First? An Analysis of Space, Time, and Technology. Ph.D. Dissertation. University of
Wyoming, Laramie.
239
Pye, K., N.R. Winspear, and L.P. Zhou
1995 Thermoluninescence Ages of Loess and Associated Sediments in Central Nebraska,
U.S.A. Paleogeography, Paleoecology, Paleoclimatology 118:73-87.
Schultz, C. B., G. C. Lueninghoener, and W. D. Frankforter
1951 A graphic resume of the Pleistocene of Nebraska (with notes on the fossil mammalian
remains). Bulletin of the University of Nebraska State Museum 3, no. 6:1-41. Lincoln.
Sellet, F.
1993 Chaîne opératoire: The concept and its applications. Lithic Technology 18(1):106-112.
2004 Beyond the point: projectile manufacture and behavioral inference. Journal of
Archaeological Science 31:1553-1566.
2006 Two steps forward, one step back: The inference of mobility patterns from
stone tools. In Archaeology and Ethnoarchaeology of Mobility, edited by F.
Sellet, R. Greaves, and P. Yu, pp. 221-239. University Press of Florida,
Gainesville.
2013 Anticipated mobility and its archaeological signature: A case study of Folsom retooling
strategies. Journal of Anthropological Archaeology 32:383-396.
Speth, J. D., K. Newlander, A. A. White, A. K. Lemke, and L. E. Anderson
2010 Early Paleoindian big-game hunting in North America: Provisioning or politics?
Quaternary International, In Press, 1-29.
Stanford, D. J.
1999 Paleoindian archaeology and late Pleistocene environments in the Plains and
Southwestern United States. In Ice Age Peoples of North America, ed. R.
Bonnichsen. Center for the Study of the First Americans, Corvallis. Taylor, R.
Taylor, R.E., C. V. Haynes, Jr., and M. Stuiver
1996 Clovis and Folsom age estimates: Stratigraphic context and radiocarbon
calibration. Antiquity 70(269):515-525.
Tunnell, C.
1977 Fluted point production as revealed by lithic specimens from the Adair-
Steadman site in Northwest Texas. In Paleoindian Lifeways, ed. E. Johnson,
pp. 140-168. The Museum Journal No. 17, Lubbock, Texas.
Webb, T., III, and R. A. Bryson
1972 Late- and Post-Glacial Climatic Changes in the Northern Midwest, U.S.A.: Quantitative
Estimates Derived from Fossil Pollen Spectra by Multi-Variate Analysis. Quaternary
Research 2:358-380.
Widga, C. C.
2006 Bison Bogs, and Big Bluestem: The Subsistence Ecology of Middle Holocene Hunter
-Gatherers in the Eastern Great Plains. Unpublished Ph.D. Dissertation, Department of
Anthropology, University of Kansas.

240
2010 Personal communication. Assistant Curator of Geology, Illinois State Museum
Research and Collections Center.
Williams, E. G. and J. L. Hofman
2010 Folsom evidence in Nebraska. Current Research in the Pleistocene 27:145-147.
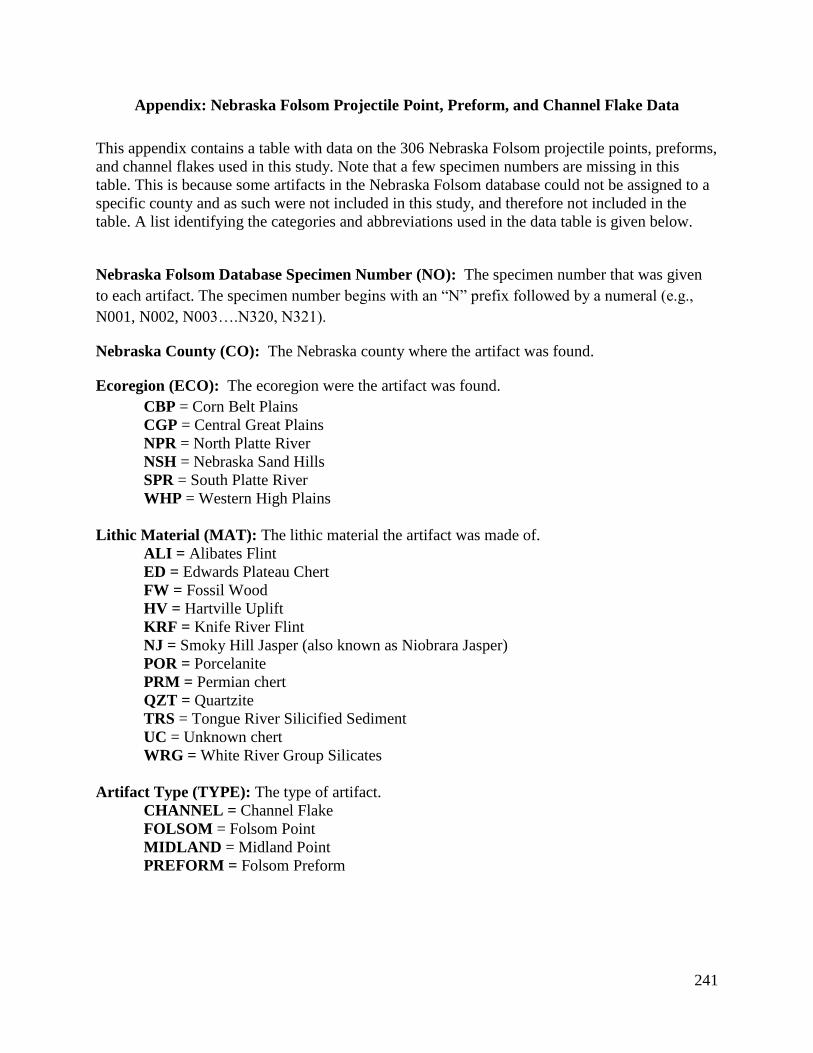
241
Appendix: Nebraska Folsom Projectile Point, Preform, and Channel Flake Data
This appendix contains a table with data on the 306 Nebraska Folsom projectile points, preforms,
and channel flakes used in this study. Note that a few specimen numbers are missing in this
table. This is because some artifacts in the Nebraska Folsom database could not be assigned to a
specific county and as such were not included in this study, and therefore not included in the
table. A list identifying the categories and abbreviations used in the data table is given below.
Nebraska Folsom Database Specimen Number (NO): The specimen number that was given
to each artifact. The specimen number begins with an “N” prefix followed by a numeral (e.g.,
N001, N002, N003….N320, N321).
Nebraska County (CO): The Nebraska county where the artifact was found.
Ecoregion (ECO): The ecoregion were the artifact was found.
CBP = Corn Belt Plains
CGP = Central Great Plains
NPR = North Platte River
NSH = Nebraska Sand Hills
SPR = South Platte River
WHP = Western High Plains
Lithic Material (MAT): The lithic material the artifact was made of.
ALI = Alibates Flint
ED = Edwards Plateau Chert
FW = Fossil Wood
HV = Hartville Uplift
KRF = Knife River Flint
NJ = Smoky Hill Jasper (also known as Niobrara Jasper)
POR = Porcelanite
PRM = Permian chert
QZT = Quartzite
TRS = Tongue River Silicified Sediment
UC = Unknown chert
WRG = White River Group Silicates
Artifact Type (TYPE): The type of artifact.
CHANNEL = Channel Flake
FOLSOM = Folsom Point
MIDLAND = Midland Point
PREFORM = Folsom Preform
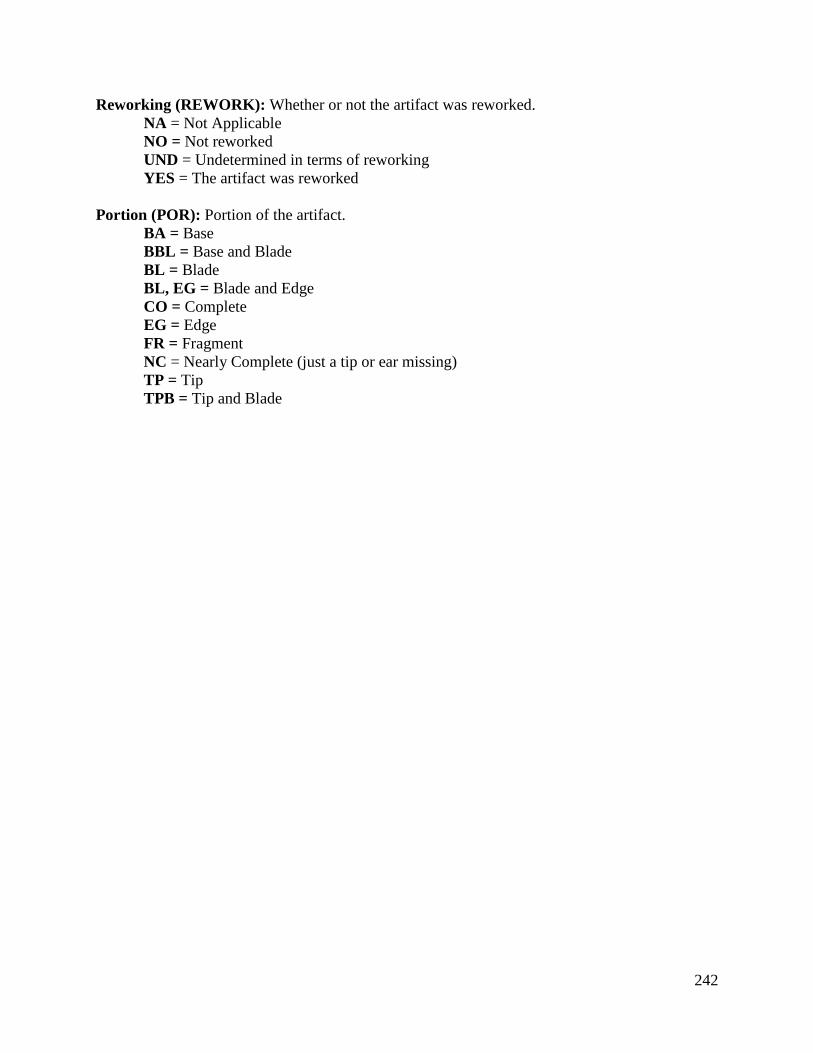
242
Reworking (REWORK): Whether or not the artifact was reworked.
NA = Not Applicable
NO = Not reworked
UND = Undetermined in terms of reworking
YES = The artifact was reworked
Portion (POR): Portion of the artifact.
BA = Base
BBL = Base and Blade
BL = Blade
BL, EG = Blade and Edge
CO = Complete
EG = Edge
FR = Fragment
NC = Nearly Complete (just a tip or ear missing)
TP = Tip
TPB = Tip and Blade
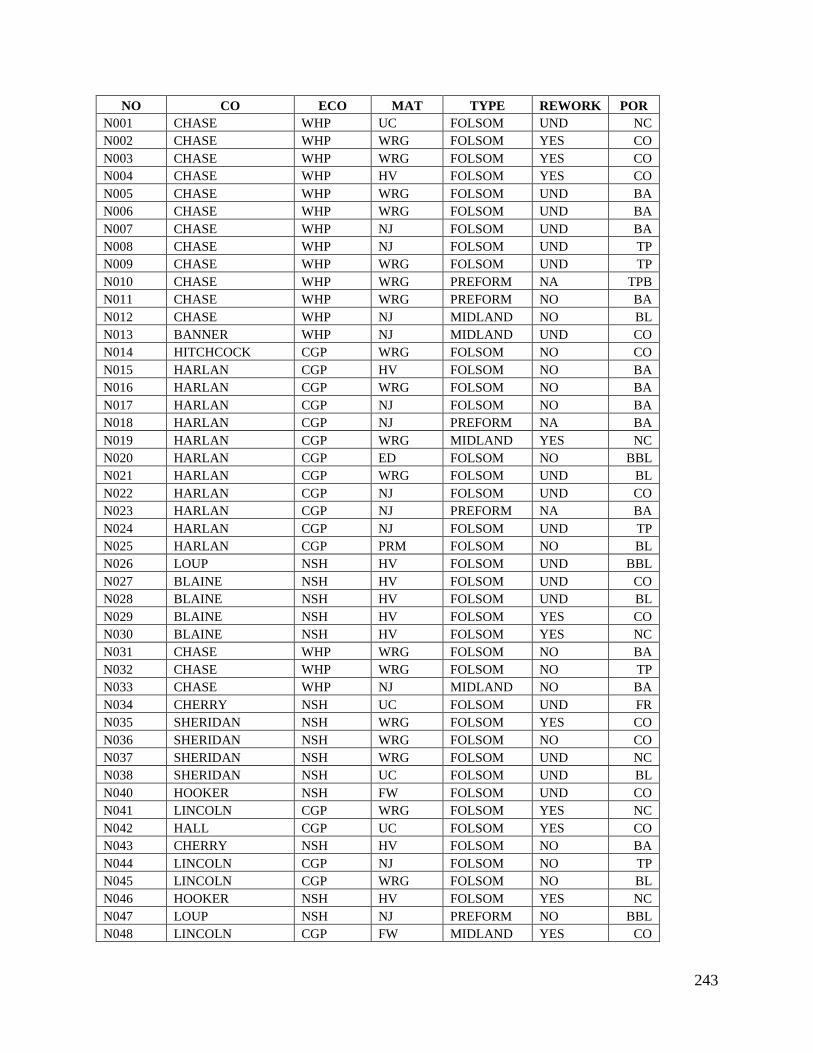
243
NO CO ECO MAT TYPE REWORK POR
N001 CHASE WHP UC FOLSOM UND NC
N002 CHASE WHP WRG FOLSOM YES CO
N003 CHASE WHP WRG FOLSOM YES CO
N004 CHASE WHP HV FOLSOM YES CO
N005 CHASE WHP WRG FOLSOM UND BA
N006 CHASE WHP WRG FOLSOM UND BA
N007 CHASE WHP NJ FOLSOM UND BA
N008 CHASE WHP NJ FOLSOM UND TP
N009 CHASE WHP WRG FOLSOM UND TP
N010 CHASE WHP WRG PREFORM NA TPB
N011 CHASE WHP WRG PREFORM NO BA
N012 CHASE WHP NJ MIDLAND NO BL
N013 BANNER WHP NJ MIDLAND UND CO
N014 HITCHCOCK CGP WRG FOLSOM NO CO
N015 HARLAN CGP HV FOLSOM NO BA
N016 HARLAN CGP WRG FOLSOM NO BA
N017 HARLAN CGP NJ FOLSOM NO BA
N018 HARLAN CGP NJ PREFORM NA BA
N019 HARLAN CGP WRG MIDLAND YES NC
N020 HARLAN CGP ED FOLSOM NO BBL
N021 HARLAN CGP WRG FOLSOM UND BL
N022 HARLAN CGP NJ FOLSOM UND CO
N023 HARLAN CGP NJ PREFORM NA BA
N024 HARLAN CGP NJ FOLSOM UND TP
N025 HARLAN CGP PRM FOLSOM NO BL
N026 LOUP NSH HV FOLSOM UND BBL
N027 BLAINE NSH HV FOLSOM UND CO
N028 BLAINE NSH HV FOLSOM UND BL
N029 BLAINE NSH HV FOLSOM YES CO
N030 BLAINE NSH HV FOLSOM YES NC
N031 CHASE WHP WRG FOLSOM NO BA
N032 CHASE WHP WRG FOLSOM NO TP
N033 CHASE WHP NJ MIDLAND NO BA
N034 CHERRY NSH UC FOLSOM UND FR
N035 SHERIDAN NSH WRG FOLSOM YES CO
N036 SHERIDAN NSH WRG FOLSOM NO CO
N037 SHERIDAN NSH WRG FOLSOM UND NC
N038 SHERIDAN NSH UC FOLSOM UND BL
N040 HOOKER NSH FW FOLSOM UND CO
N041 LINCOLN CGP WRG FOLSOM YES NC
N042 HALL CGP UC FOLSOM YES CO
N043 CHERRY NSH HV FOLSOM NO BA
N044 LINCOLN CGP NJ FOLSOM NO TP
N045 LINCOLN CGP WRG FOLSOM NO BL
N046 HOOKER NSH HV FOLSOM YES NC
N047 LOUP NSH NJ PREFORM NO BBL
N048 LINCOLN CGP FW MIDLAND YES CO
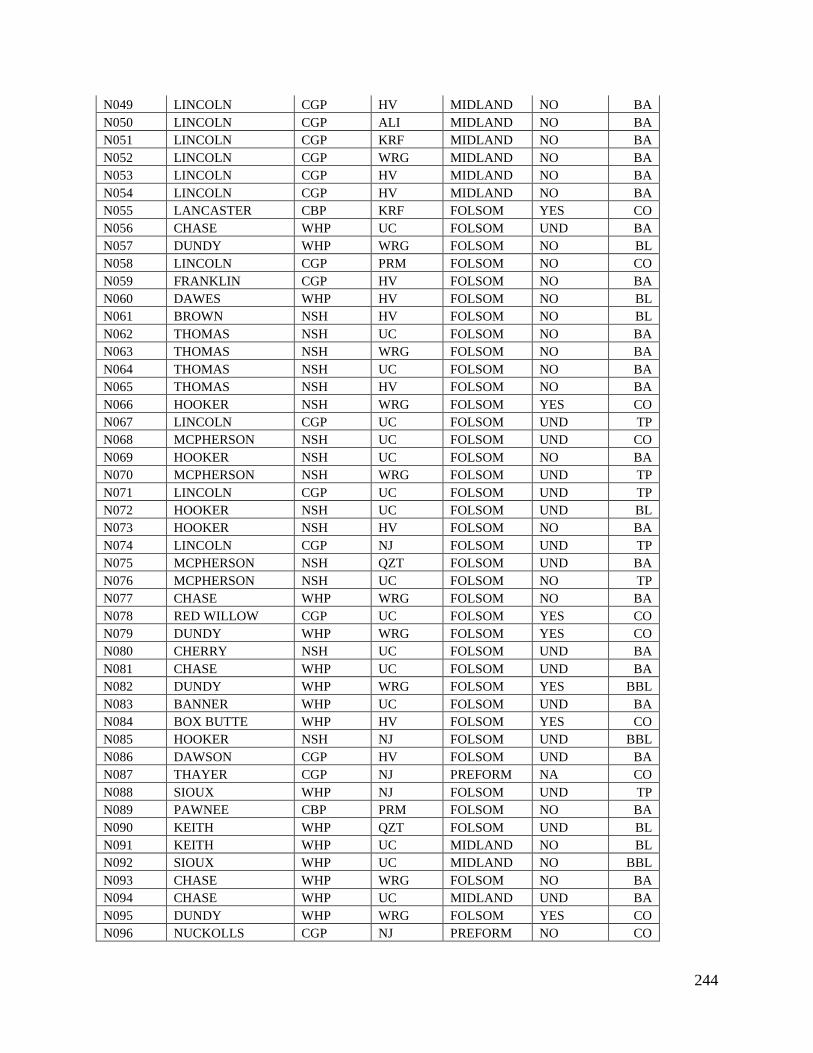
244
N049 LINCOLN CGP HV MIDLAND NO BA
N050 LINCOLN CGP ALI MIDLAND NO BA
N051 LINCOLN CGP KRF MIDLAND NO BA
N052 LINCOLN CGP WRG MIDLAND NO BA
N053 LINCOLN CGP HV MIDLAND NO BA
N054 LINCOLN CGP HV MIDLAND NO BA
N055 LANCASTER CBP KRF FOLSOM YES CO
N056 CHASE WHP UC FOLSOM UND BA
N057 DUNDY WHP WRG FOLSOM NO BL
N058 LINCOLN CGP PRM FOLSOM NO CO
N059 FRANKLIN CGP HV FOLSOM NO BA
N060 DAWES WHP HV FOLSOM NO BL
N061 BROWN NSH HV FOLSOM NO BL
N062 THOMAS NSH UC FOLSOM NO BA
N063 THOMAS NSH WRG FOLSOM NO BA
N064 THOMAS NSH UC FOLSOM NO BA
N065 THOMAS NSH HV FOLSOM NO BA
N066 HOOKER NSH WRG FOLSOM YES CO
N067 LINCOLN CGP UC FOLSOM UND TP
N068 MCPHERSON NSH UC FOLSOM UND CO
N069 HOOKER NSH UC FOLSOM NO BA
N070 MCPHERSON NSH WRG FOLSOM UND TP
N071 LINCOLN CGP UC FOLSOM UND TP
N072 HOOKER NSH UC FOLSOM UND BL
N073 HOOKER NSH HV FOLSOM NO BA
N074 LINCOLN CGP NJ FOLSOM UND TP
N075 MCPHERSON NSH QZT FOLSOM UND BA
N076 MCPHERSON NSH UC FOLSOM NO TP
N077 CHASE WHP WRG FOLSOM NO BA
N078 RED WILLOW CGP UC FOLSOM YES CO
N079 DUNDY WHP WRG FOLSOM YES CO
N080 CHERRY NSH UC FOLSOM UND BA
N081 CHASE WHP UC FOLSOM UND BA
N082 DUNDY WHP WRG FOLSOM YES BBL
N083 BANNER WHP UC FOLSOM UND BA
N084 BOX BUTTE WHP HV FOLSOM YES CO
N085 HOOKER NSH NJ FOLSOM UND BBL
N086 DAWSON CGP HV FOLSOM UND BA
N087 THAYER CGP NJ PREFORM NA CO
N088 SIOUX WHP NJ FOLSOM UND TP
N089 PAWNEE CBP PRM FOLSOM NO BA
N090 KEITH WHP QZT FOLSOM UND BL
N091 KEITH WHP UC MIDLAND NO BL
N092 SIOUX WHP UC MIDLAND NO BBL
N093 CHASE WHP WRG FOLSOM NO BA
N094 CHASE WHP UC MIDLAND UND BA
N095 DUNDY WHP WRG FOLSOM YES CO
N096 NUCKOLLS CGP NJ PREFORM NO CO
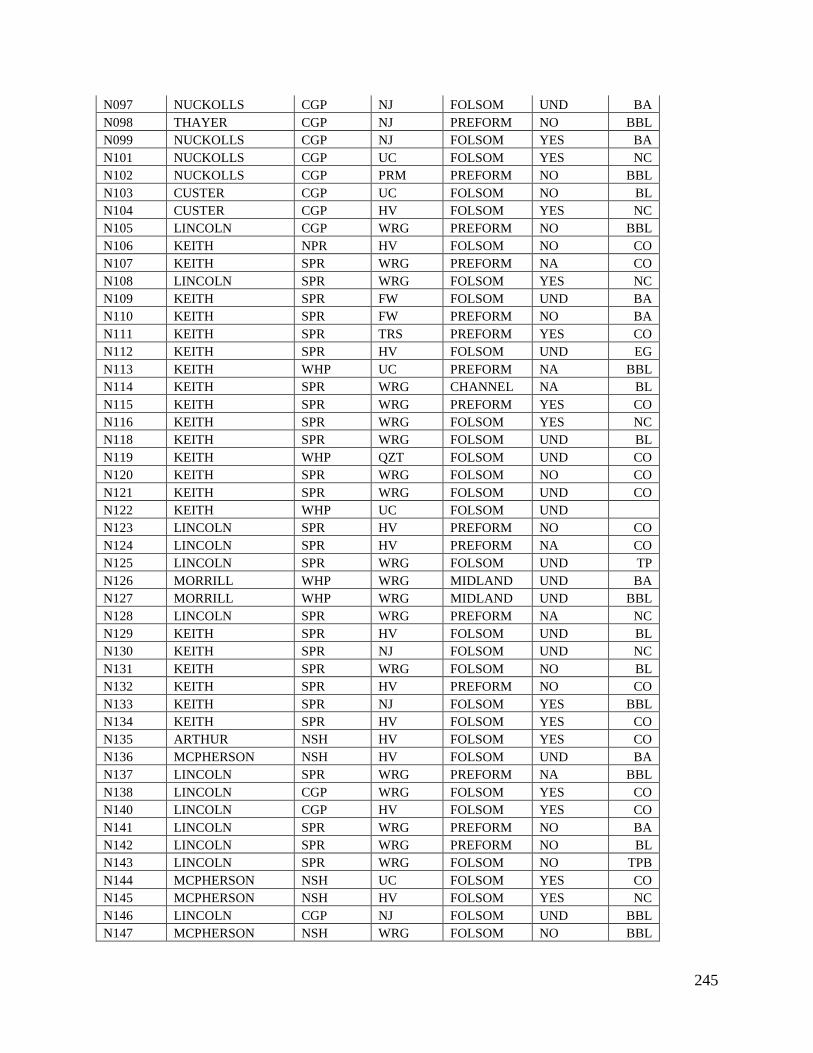
245
N097 NUCKOLLS CGP NJ FOLSOM UND BA
N098 THAYER CGP NJ PREFORM NO BBL
N099 NUCKOLLS CGP NJ FOLSOM YES BA
N101 NUCKOLLS CGP UC FOLSOM YES NC
N102 NUCKOLLS CGP PRM PREFORM NO BBL
N103 CUSTER CGP UC FOLSOM NO BL
N104 CUSTER CGP HV FOLSOM YES NC
N105 LINCOLN CGP WRG PREFORM NO BBL
N106 KEITH NPR HV FOLSOM NO CO
N107 KEITH SPR WRG PREFORM NA CO
N108 LINCOLN SPR WRG FOLSOM YES NC
N109 KEITH SPR FW FOLSOM UND BA
N110 KEITH SPR FW PREFORM NO BA
N111 KEITH SPR TRS PREFORM YES CO
N112 KEITH SPR HV FOLSOM UND EG
N113 KEITH WHP UC PREFORM NA BBL
N114 KEITH SPR WRG CHANNEL NA BL
N115 KEITH SPR WRG PREFORM YES CO
N116 KEITH SPR WRG FOLSOM YES NC
N118 KEITH SPR WRG FOLSOM UND BL
N119 KEITH WHP QZT FOLSOM UND CO
N120 KEITH SPR WRG FOLSOM NO CO
N121 KEITH SPR WRG FOLSOM UND CO
N122 KEITH WHP UC FOLSOM UND
N123 LINCOLN SPR HV PREFORM NO CO
N124 LINCOLN SPR HV PREFORM NA CO
N125 LINCOLN SPR WRG FOLSOM UND TP
N126 MORRILL WHP WRG MIDLAND UND BA
N127 MORRILL WHP WRG MIDLAND UND BBL
N128 LINCOLN SPR WRG PREFORM NA NC
N129 KEITH SPR HV FOLSOM UND BL
N130 KEITH SPR NJ FOLSOM UND NC
N131 KEITH SPR WRG FOLSOM NO BL
N132 KEITH SPR HV PREFORM NO CO
N133 KEITH SPR NJ FOLSOM YES BBL
N134 KEITH SPR HV FOLSOM YES CO
N135 ARTHUR NSH HV FOLSOM YES CO
N136 MCPHERSON NSH HV FOLSOM UND BA
N137 LINCOLN SPR WRG PREFORM NA BBL
N138 LINCOLN CGP WRG FOLSOM YES CO
N140 LINCOLN CGP HV FOLSOM YES CO
N141 LINCOLN SPR WRG PREFORM NO BA
N142 LINCOLN SPR WRG PREFORM NO BL
N143 LINCOLN SPR WRG FOLSOM NO TPB
N144 MCPHERSON NSH UC FOLSOM YES CO
N145 MCPHERSON NSH HV FOLSOM YES NC
N146 LINCOLN CGP NJ FOLSOM UND BBL
N147 MCPHERSON NSH WRG FOLSOM NO BBL
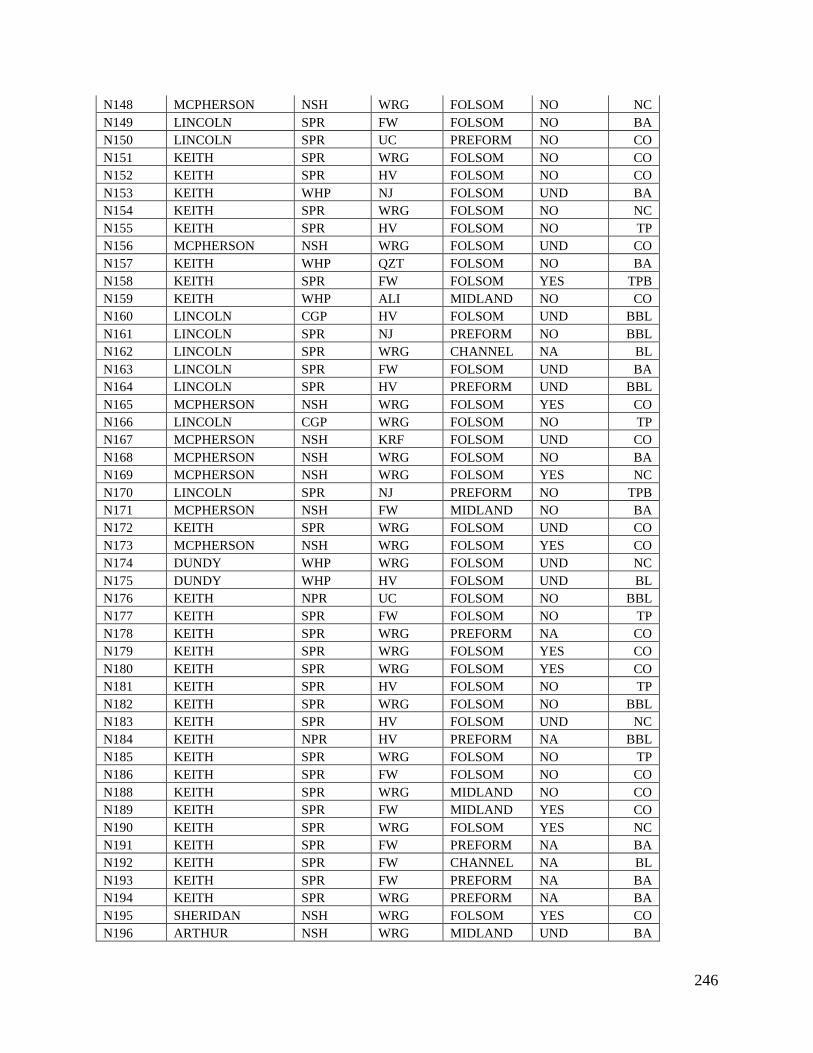
246
N148 MCPHERSON NSH WRG FOLSOM NO NC
N149 LINCOLN SPR FW FOLSOM NO BA
N150 LINCOLN SPR UC PREFORM NO CO
N151 KEITH SPR WRG FOLSOM NO CO
N152 KEITH SPR HV FOLSOM NO CO
N153 KEITH WHP NJ FOLSOM UND BA
N154 KEITH SPR WRG FOLSOM NO NC
N155 KEITH SPR HV FOLSOM NO TP
N156 MCPHERSON NSH WRG FOLSOM UND CO
N157 KEITH WHP QZT FOLSOM NO BA
N158 KEITH SPR FW FOLSOM YES TPB
N159 KEITH WHP ALI MIDLAND NO CO
N160 LINCOLN CGP HV FOLSOM UND BBL
N161 LINCOLN SPR NJ PREFORM NO BBL
N162 LINCOLN SPR WRG CHANNEL NA BL
N163 LINCOLN SPR FW FOLSOM UND BA
N164 LINCOLN SPR HV PREFORM UND BBL
N165 MCPHERSON NSH WRG FOLSOM YES CO
N166 LINCOLN CGP WRG FOLSOM NO TP
N167 MCPHERSON NSH KRF FOLSOM UND CO
N168 MCPHERSON NSH WRG FOLSOM NO BA
N169 MCPHERSON NSH WRG FOLSOM YES NC
N170 LINCOLN SPR NJ PREFORM NO TPB
N171 MCPHERSON NSH FW MIDLAND NO BA
N172 KEITH SPR WRG FOLSOM UND CO
N173 MCPHERSON NSH WRG FOLSOM YES CO
N174 DUNDY WHP WRG FOLSOM UND NC
N175 DUNDY WHP HV FOLSOM UND BL
N176 KEITH NPR UC FOLSOM NO BBL
N177 KEITH SPR FW FOLSOM NO TP
N178 KEITH SPR WRG PREFORM NA CO
N179 KEITH SPR WRG FOLSOM YES CO
N180 KEITH SPR WRG FOLSOM YES CO
N181 KEITH SPR HV FOLSOM NO TP
N182 KEITH SPR WRG FOLSOM NO BBL
N183 KEITH SPR HV FOLSOM UND NC
N184 KEITH NPR HV PREFORM NA BBL
N185 KEITH SPR WRG FOLSOM NO TP
N186 KEITH SPR FW FOLSOM NO CO
N188 KEITH SPR WRG MIDLAND NO CO
N189 KEITH SPR FW MIDLAND YES CO
N190 KEITH SPR WRG FOLSOM YES NC
N191 KEITH SPR FW PREFORM NA BA
N192 KEITH SPR FW CHANNEL NA BL
N193 KEITH SPR FW PREFORM NA BA
N194 KEITH SPR WRG PREFORM NA BA
N195 SHERIDAN NSH WRG FOLSOM YES CO
N196 ARTHUR NSH WRG MIDLAND UND BA
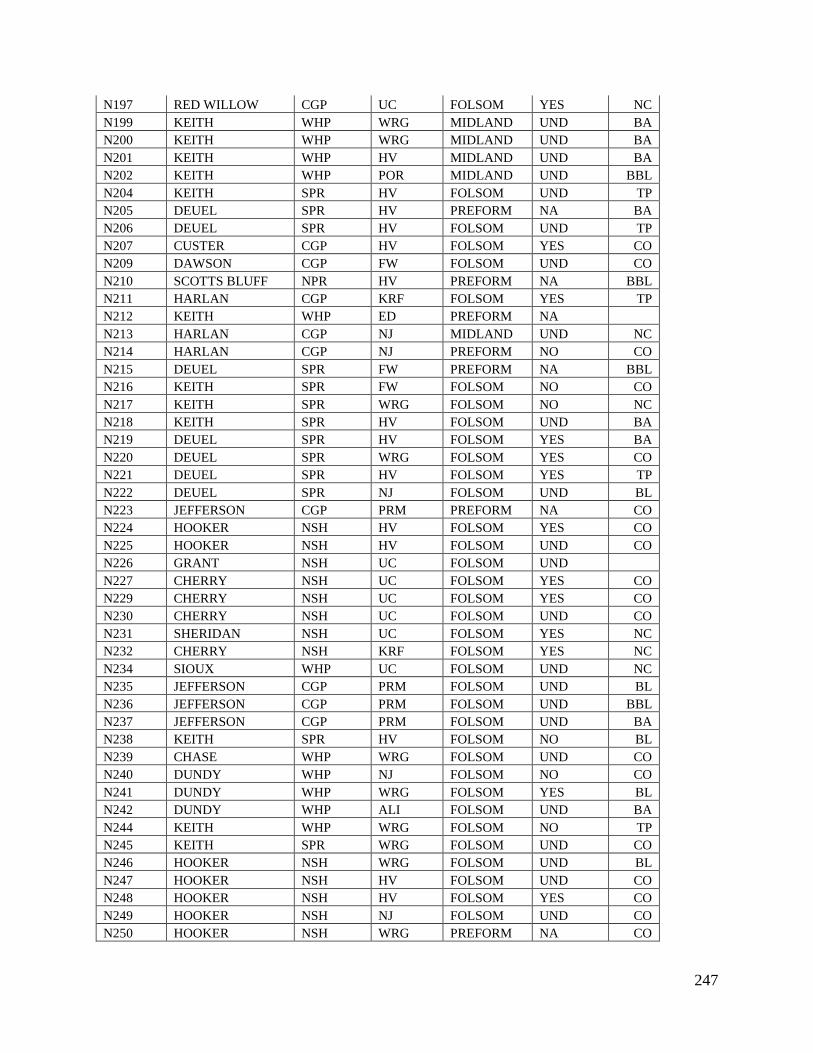
247
N197 RED WILLOW CGP UC FOLSOM YES NC
N199 KEITH WHP WRG MIDLAND UND BA
N200 KEITH WHP WRG MIDLAND UND BA
N201 KEITH WHP HV MIDLAND UND BA
N202 KEITH WHP POR MIDLAND UND BBL
N204 KEITH SPR HV FOLSOM UND TP
N205 DEUEL SPR HV PREFORM NA BA
N206 DEUEL SPR HV FOLSOM UND TP
N207 CUSTER CGP HV FOLSOM YES CO
N209 DAWSON CGP FW FOLSOM UND CO
N210 SCOTTS BLUFF NPR HV PREFORM NA BBL
N211 HARLAN CGP KRF FOLSOM YES TP
N212 KEITH WHP ED PREFORM NA
N213 HARLAN CGP NJ MIDLAND UND NC
N214 HARLAN CGP NJ PREFORM NO CO
N215 DEUEL SPR FW PREFORM NA BBL
N216 KEITH SPR FW FOLSOM NO CO
N217 KEITH SPR WRG FOLSOM NO NC
N218 KEITH SPR HV FOLSOM UND BA
N219 DEUEL SPR HV FOLSOM YES BA
N220 DEUEL SPR WRG FOLSOM YES CO
N221 DEUEL SPR HV FOLSOM YES TP
N222 DEUEL SPR NJ FOLSOM UND BL
N223 JEFFERSON CGP PRM PREFORM NA CO
N224 HOOKER NSH HV FOLSOM YES CO
N225 HOOKER NSH HV FOLSOM UND CO
N226 GRANT NSH UC FOLSOM UND
N227 CHERRY NSH UC FOLSOM YES CO
N229 CHERRY NSH UC FOLSOM YES CO
N230 CHERRY NSH UC FOLSOM UND CO
N231 SHERIDAN NSH UC FOLSOM YES NC
N232 CHERRY NSH KRF FOLSOM YES NC
N234 SIOUX WHP UC FOLSOM UND NC
N235 JEFFERSON CGP PRM FOLSOM UND BL
N236 JEFFERSON CGP PRM FOLSOM UND BBL
N237 JEFFERSON CGP PRM FOLSOM UND BA
N238 KEITH SPR HV FOLSOM NO BL
N239 CHASE WHP WRG FOLSOM UND CO
N240 DUNDY WHP NJ FOLSOM NO CO
N241 DUNDY WHP WRG FOLSOM YES BL
N242 DUNDY WHP ALI FOLSOM UND BA
N244 KEITH WHP WRG FOLSOM NO TP
N245 KEITH SPR WRG FOLSOM UND CO
N246 HOOKER NSH WRG FOLSOM UND BL
N247 HOOKER NSH HV FOLSOM UND CO
N248 HOOKER NSH HV FOLSOM YES CO
N249 HOOKER NSH NJ FOLSOM UND CO
N250 HOOKER NSH WRG PREFORM NA CO
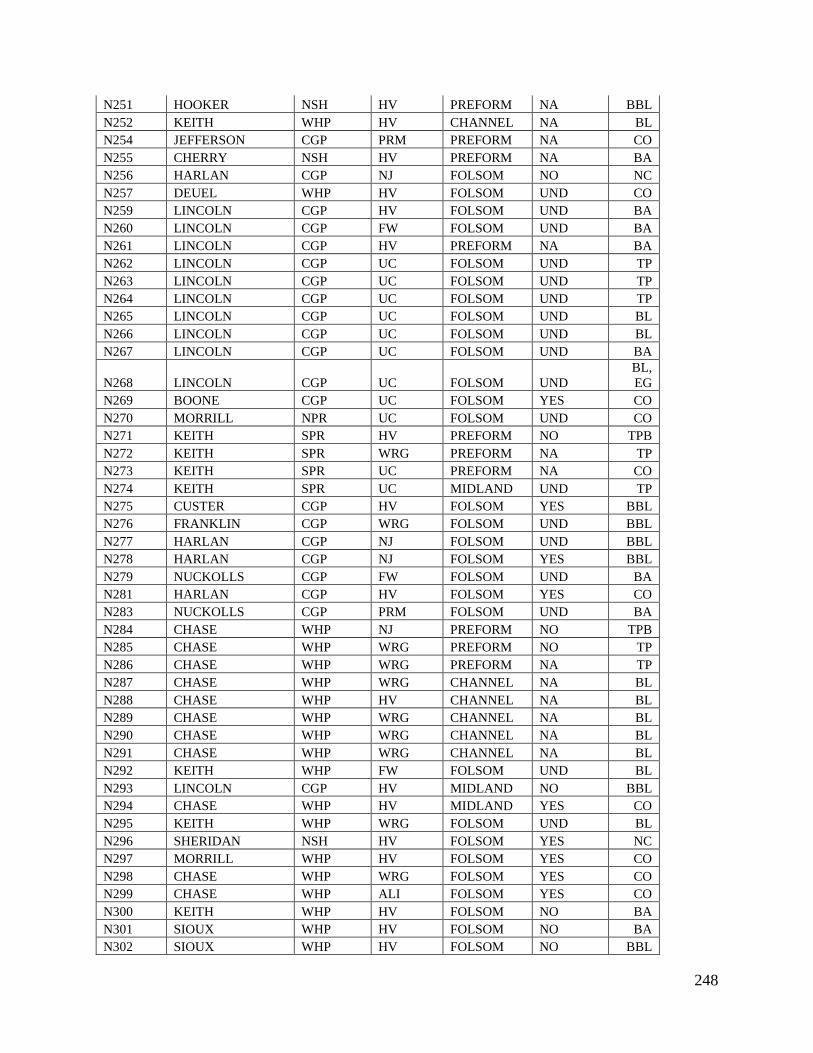
248
N251 HOOKER NSH HV PREFORM NA BBL
N252 KEITH WHP HV CHANNEL NA BL
N254 JEFFERSON CGP PRM PREFORM NA CO
N255 CHERRY NSH HV PREFORM NA BA
N256 HARLAN CGP NJ FOLSOM NO NC
N257 DEUEL WHP HV FOLSOM UND CO
N259 LINCOLN CGP HV FOLSOM UND BA
N260 LINCOLN CGP FW FOLSOM UND BA
N261 LINCOLN CGP HV PREFORM NA BA
N262 LINCOLN CGP UC FOLSOM UND TP
N263 LINCOLN CGP UC FOLSOM UND TP
N264 LINCOLN CGP UC FOLSOM UND TP
N265 LINCOLN CGP UC FOLSOM UND BL
N266 LINCOLN CGP UC FOLSOM UND BL
N267 LINCOLN CGP UC FOLSOM UND BA
N268 LINCOLN CGP UC FOLSOM UND
BL,
EG
N269 BOONE CGP UC FOLSOM YES CO
N270 MORRILL NPR UC FOLSOM UND CO
N271 KEITH SPR HV PREFORM NO TPB
N272 KEITH SPR WRG PREFORM NA TP
N273 KEITH SPR UC PREFORM NA CO
N274 KEITH SPR UC MIDLAND UND TP
N275 CUSTER CGP HV FOLSOM YES BBL
N276 FRANKLIN CGP WRG FOLSOM UND BBL
N277 HARLAN CGP NJ FOLSOM UND BBL
N278 HARLAN CGP NJ FOLSOM YES BBL
N279 NUCKOLLS CGP FW FOLSOM UND BA
N281 HARLAN CGP HV FOLSOM YES CO
N283 NUCKOLLS CGP PRM FOLSOM UND BA
N284 CHASE WHP NJ PREFORM NO TPB
N285 CHASE WHP WRG PREFORM NO TP
N286 CHASE WHP WRG PREFORM NA TP
N287 CHASE WHP WRG CHANNEL NA BL
N288 CHASE WHP HV CHANNEL NA BL
N289 CHASE WHP WRG CHANNEL NA BL
N290 CHASE WHP WRG CHANNEL NA BL
N291 CHASE WHP WRG CHANNEL NA BL
N292 KEITH WHP FW FOLSOM UND BL
N293 LINCOLN CGP HV MIDLAND NO BBL
N294 CHASE WHP HV MIDLAND YES CO
N295 KEITH WHP WRG FOLSOM UND BL
N296 SHERIDAN NSH HV FOLSOM YES NC
N297 MORRILL WHP HV FOLSOM YES CO
N298 CHASE WHP WRG FOLSOM YES CO
N299 CHASE WHP ALI FOLSOM YES CO
N300 KEITH WHP HV FOLSOM NO BA
N301 SIOUX WHP HV FOLSOM NO BA
N302 SIOUX WHP HV FOLSOM NO BBL
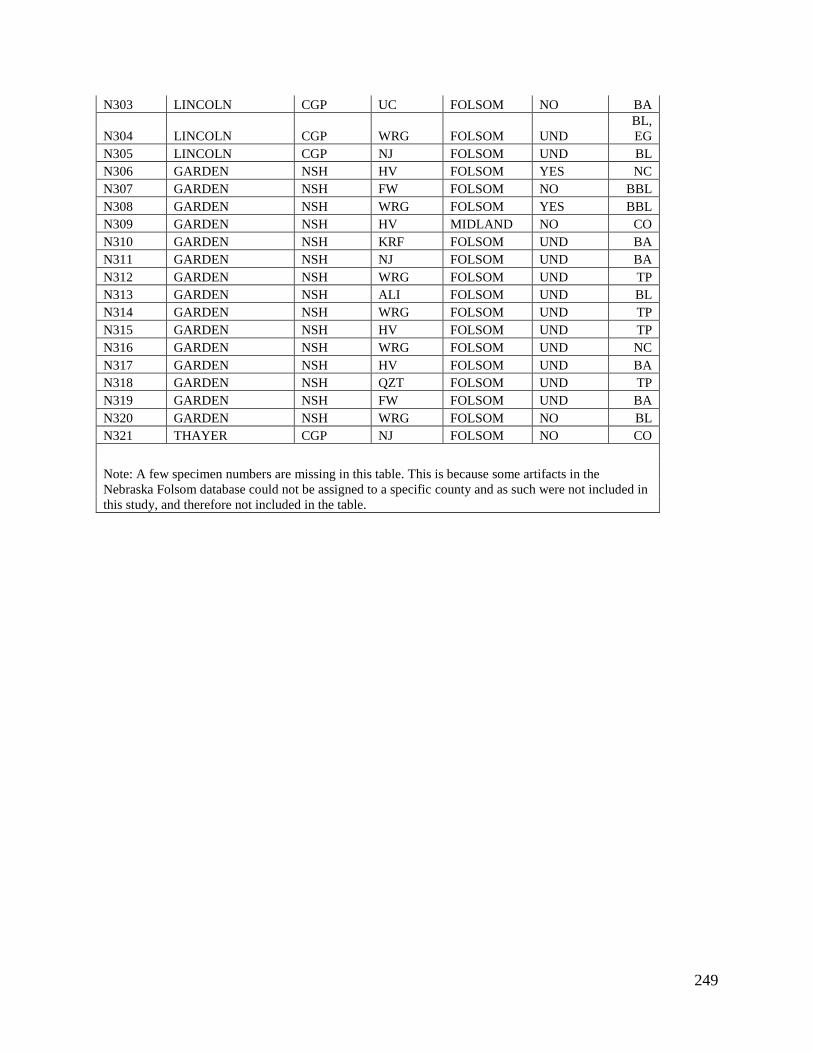
249
N303 LINCOLN CGP UC FOLSOM NO BA
N304 LINCOLN CGP WRG FOLSOM UND
BL,
EG
N305 LINCOLN CGP NJ FOLSOM UND BL
N306 GARDEN NSH HV FOLSOM YES NC
N307 GARDEN NSH FW FOLSOM NO BBL
N308 GARDEN NSH WRG FOLSOM YES BBL
N309 GARDEN NSH HV MIDLAND NO CO
N310 GARDEN NSH KRF FOLSOM UND BA
N311 GARDEN NSH NJ FOLSOM UND BA
N312 GARDEN NSH WRG FOLSOM UND TP
N313 GARDEN NSH ALI FOLSOM UND BL
N314 GARDEN NSH WRG FOLSOM UND TP
N315 GARDEN NSH HV FOLSOM UND TP
N316 GARDEN NSH WRG FOLSOM UND NC
N317 GARDEN NSH HV FOLSOM UND BA
N318 GARDEN NSH QZT FOLSOM UND TP
N319 GARDEN NSH FW FOLSOM UND BA
N320 GARDEN NSH WRG FOLSOM NO BL
N321 THAYER CGP NJ FOLSOM NO CO
Note: A few specimen numbers are missing in this table. This is because some artifacts in the
Nebraska Folsom database could not be assigned to a specific county and as such were not included in
this study, and therefore not included in the table.