Embed Size (px)
Citation preview

Prefatory Note The attached document represents the most complete and accurate version available based on original copies culled from the files of the FOMC Secretariat at the Board of Governors of the Federal Reserve System. This electronic document was created through a comprehensive digitization process which included identifying the best-preserved paper copies, scanning those copies,1
and then making the scanned versions text-searchable.2
Though a stringent quality assurance process was employed, some imperfections may remain. Please note that some material may have been redacted from this document if that material was received on a confidential basis. Redacted material is indicated by occasional gaps in the text or by gray boxes around non-text content. All redacted passages are exempt from disclosure under applicable provisions of the Freedom of Information Act. 1 In some cases, original copies needed to be photocopied before being scanned into electronic format. All scanned images were deskewed (to remove the effects of printer- and scanner-introduced tilting) and lightly cleaned (to remove dark spots caused by staple holes, hole punches, and other blemishes caused after initial printing). 2 A two-step process was used. An advanced optical character recognition computer program (OCR) first created electronic text from the document image. Where the OCR results were inconclusive, staff checked and corrected the text as necessary. Please note that the numbers and text in charts and tables were not reliably recognized by the OCR process and were not checked or corrected by staff.
Content last modified 6/05/2009.

CONFIDENTIAL (FR)
November 10, 1976
CURRENT ECONOMIC AND FINANCIAL CONDITIONS
By the StaffBoard of Governors
of the Federal Reserve System

TABLE OF CONTENTS
Section Page
DOMESTIC NONFINANCIAL DEVELOPMENTS II
Industrial production........................................ 1
Materials capacity utilization............................... 2Nonfarm payroll employmente.. ...... ..................... 2
Unemployment rate.......................................... . 2
Personal income............. ..... ............................ 4
Retail sales..................... ........... ................. 7
Auto sales ......... .... ........ ... .... ............. . 7Conference Board consumer survey...................... ........... 7Accumulation of manufacturers' inventories................... 9McGraw-Hill survey.......................... ............. 9
Private housing starts...................................... 12
Federal spending............................................. 16
State and local governments................................... 19
Average hourly earnings index................................. 20
Nonfarm business productivity................................ 20
Consumer price.................... ........................... . 20
Wholesale price .................... ....... ............... 22
TABLES:
Changes in employment... ......................... ........ 3Selected unemployment rates................................... 3
Personal income................................. ....... 6
Retail sales.............8......................Auto sales........... * ... ************* *** 8
Business inventories... ................... ... .. a ............ 10
Inventory ratios.. 0..# .... *.......... ... *......... . 10Private capital spending surveys............................. 11Commitments data for business fixed investment................ 14
New private housing units........... ....................... • 15
Growth in Federal outlays during firstthree calendar quarters.................................. 17
Shortfall in Federal budget estimates.......................... 18
Hourly earnings index.......... ............................ 21
Productivity and costs................................... 21
Consumer prices.......................... 23
Wholesale prices................. ............ ..... ..... 23

TABLE OF CONTENTS
Section Page
DOMESTIC NONFINANCIAL DEVELOPMENTS II
CHARTS:
Real personal income............... ......... ............... 5Real wage and salary disbursements....................... ... 5Producers' durable equipment........ ........... . .... ... 13Nonresidential structures ... ..... .... ........ .......... 13
DOMESTIC FINANCIAL DEVELOPMENTS III
Monetary aggregates and bank credit................... ........Business credit... .................... ................ 6Municipal and U.S. government securities markets............. 12Mortgage and consumer credit markets.... .............. .... 15
TABLES:
Selected financial market quotations........ .................. 2Monetary aggregates...... .................................... 4Commercial bank credit... ................ ................... 7Security offerings............ ... ................. ....... 9Changes in Treasury debt outstanding in 1976 by maturity...... 14Interest rates and supply of funds for conventional home
mortgage at selected S&Ls ..................... .. ... . 16Secondary hom mortgage market activity ....................... 16
Consumer instalment credit................................... 17
CHART:
Liquidity measures of nonfinancial corporations.... .. ....... 11
INTERNATIONAL DEVELOPMENTS IV
Foreign exchange markets............ ..... ............. ..... 1OPEC investment flows..................... ..... ......... .. 3U.S. international transactions.. ................ .... ..... 7Bank reported private capital transactions ....... ........... 9New issues of foreign bonds..... ...... ................ .... 10Foreign official assets. ..... . .. ...................... 11Economic activity in foreign industrial countries.. .......... 12
TABLES:
Estimated disposition of OPEC surpluses. ..................... 4U.S. merchandise trade ... .............. . ..................... 7Industrial production in major industrial countries... ....... 13
Real GNP and components in major foreign countries ............ 14

November 10, 1976
II - T - 1
SELECTED DOMESTIC NONFINANCIAL DATAAVAILABLE SINCE PRECEDING GREENBOOK
(Seasonally adjusted)
Latest Data Per Cent Change FromThree
Release Preceding Periods YearPeriod Date Data Period Earlier Earlier
(At Annual Rate)
Civilian labor force
Unemployment rate (per cent)
Insured unemployment rate (%)
Nonfarm employment, payroll (mil.)
Manufacturing
Nonmanufacturing
Private nonfarm:
Average weekly hours (hours)
Hourly earnings ($)Manufacturing:
Average weekly hours (hours)
Unit labor cost (1967=100)
Industrial production (1967=100)
Consumer goods
Business equipment
Defense & space equipment
Material
Consumer prices (1967=100)Food
Commodities except food
Services
sale prices (1976=100)
ndustrial commodities
Farm products & foods & feeds
2/Personal income ($ billion)-
Mfrs. new orders dur. goods ($ bil.)Capital goods industriesNondefenseDefense
Inventories to sales ratio:Manufacturing and trade, total
Manufacturing
Trade
Ratio: Mfrs.' durable goods inven-tories to unfilled orders
Retail sales, total ($ bil.)GAF
2/Auto sales, total (mil. units)-Domestic models
Foreign models
2/Housing starts, private (thous.)-
Leading indicators (1967=100)
Oct.Oct.Oct.Oct.Oct.Oct.
11-5-7611-5-7611-5-7611-5-7611-5-7611-5-76
95.37.95.079.519.060.5
1.87.8-
5.0--. 8
-9.21.8
07.81
4.7-/1.7
.92.0
2.38 1/
8.66.-2.52.62.5
1/ 1/ 1/Oct. 11-5-76 36.2 3 6. 0i 36.2-/ 36. 2zOct. 11-5-76 4.94 4.92- 4.87-' 4.63;-
1/ 1/ 1/Oct. 11-5-76 39.8 39.71 40.2- 39.8-Sept. 10-29-76 144.5 5.0 3.6 2.9
Sept.Sept.Sept.Sept.Sept.
Sept.Sept.Sept.Sept.
10-15-7610-15-7610-15-7610-15-7610-15-76
10-21-7610-21-7610-21-7610-21-76
Oct. 11-4-76Oct. 11-4-76Oct. 11-4-76
131.3137.3136.979.1
133.1
172.5181.8158.5183.0
185.6186.6180.4
Sept. 10-15-76 1392.2
Sept.Sept.
Sept.Sept.
Aug.
Sept.Aug.
11-3-7611-3-7611-3-7611-3-76
10-15-7611-3-7610-15-76
.0-8.7
3.51.5
.9
4.9.0
4.66.6
6.912.3
-11.2
5.8
(Not
46.8 -2.513.6 -1.212.1 3.01.4 -26.3
1/1.48 1.48-1/1.65 1.62-1
1.35 1.3411
1/Sept. 11-3-76 .850 .842-1
Sept. 10-12-76 54.6 .1Sept. 10-12-76 13.5 .0
Oct. 11-8-76 9.5Oct. 11-8-76 7.6Oct. 11-8-76 1.9
Sept. 10-19-76 1,814Sept. 10-29-76 107.9
-5.7-7.4
2.3
17.6-. 7
3.7-1.5
5.64.16.1
5.61.86.46.9
5.610.6
-11.4
6.4
at Annual
-6.2-5.42.5
-42.5
1/1.46-1.60-1.341/134-
7.56.46.0
-2.610.0
5.52.14.88.3
3.46.6-5.9
9.0
Rates)
10.911.218.8
-27.3
1.541.701.36
.838/ 1/.838- .819-
1.12.3
-6.7-12.629.1
20.1-1.2
10.08.0
3.2-1.729.5
39.15.3
ctual data. 2/ At Annual rate.

II - 1
DOMESTIC NONFINANCIAL DEVELOPMENTS
A significant pickup in the pace of consumer spending
occurred in the past two months, while industrial output and total
hours worked rose more in November than can be accounted for by the
ending of strikes. With the pick-up in retail sales, some progress
may have been made in working off excess inventories especially in
nondurable goods lines. However, the near term outlook remains clouded
by continued large inventories of durable goods. In addition, the
recent Commerce survey of plant and equipment spending plans shows
disappointingly little strength in the first half of 1977.
Industrial production is estimated to have increased by
1-1/4 per cent in November. More than half of this rise was due to
resumption of production following settlements of labor disputes,
but moderate increases were widespread among non-affected industries.
Consumer goods production increased about 1-3/4 per cent, mainly
reflecting renewed production of autos and utility vehicles. Auto
assemblies increased 14 per cent to an 8.8 million unit annual rate
in November, close to their pre-strike levels. December output
schedules call for a 9.2 million unit annual rate, with heavy con-
centration of production in models that have been in short supply.
Production of farm equipment and business vehicles also recovered
from strike reduced levels. In addition, there were moderate advances
in the consumer durable goods and business equipment sectors not
affected by strike activity. Production of consumer nondurables,

II - 2
notably apparel, also advanced. Output of materials also increased
with gains throughout the durables group and advances in the paper
and chemical industries.
The rise in industrial production in November generated
an increase in the level of the newly re-estimated FR series of
capacity utilization in manufacturing to 80.5 per cent up from a
strike-reduced figure of 79.8 per cent in October. This compares to
peacetime cyclical peak rates to 88 to 89 per cent. Thus, there
appears to be sufficient capacity presently for appreciable near-term
expansion in both advanced and primary processing industries. For
industrial materials, the November rate of capacity utilization was
nearly 81 per cent, about the average level maintained since May;
however, in recent months the utilization rates for textiles and basic
metal materials have declined from levels reached earlier in the year.
Stocks continued to accumulate rapidly at the factory
level in October, despite a decline in industrial production during
that and the preceding month, as shipments of goods slipped further.
Book value of manufacturing inventories rose at a $17-1/2 billion
annual rate, somewhat slower than the $22 billion September rate, but
above the $15 billion monthly average of the third quarter. Durable
manufacturers inventories rose even faster in October than in
September. Those stocks have been rising for six months, but the
September and October rates exceeded those in the previous four months.
On the other hand, nondurable stocks rose in October at less than half

II - 3
BUSINESS INVENTORIES
(Change at annual rates in seasonallyadjusted book values, $ billions)
1975 1976II III IV I II III Sept. Oct.
Manufacturing and trade -15.4 6.2 -.4 21.9 28.3 29.0 39.5 18.4Manufacturing -12.5 -6.6 .6 6.3 11.0 14.8 22.1 17.6Durable -4.3 -8.6 -3.5 1.8 5.7 6.4 13.3 14.1Nondurable -8.2 2.0 4.2 4.5 5.4 8.4 8.8 3.5
Trade, total -2.8 12.8 -1.0 15.6 17.3 14.2 17.4 .9Wholesale -2.7 3.1 -2.0 5.1 9.0 4.3 8.6 3.2Retail -.1 9.7 1.0 10.5 8.3 9.9 8.8 -2.3
Auto .0 5.9 -.9 1.1 .1 4.8 -.9 -5.6
INVENTORY RATIOS
1974 1975 1976IV IV I II III Sept. Oct.
Inventory to salesManufacturing and trade 1.62 1.52 1.49 1.49 1.51 1.51 1.52Manufacturing 1.79 1.68 1.63 1.60 1.64 1.65 1.67
Durable 2.25 2.22 2.09 2.03 2.08 2.11 2.14Nondurable 1.29 1.16 1.15 1.16 1.19 1.18 1.19
Trade, total 1.45 1.36 1.36 1.37 1.38 1.38 1.38Wholesale 1.24 1.21 1.20 1.22 1.22 1.20 1.22Retail 1.63 1.48 1.47 1.48 1.51 1.51 1.49
Inventories to unfilled orders:Durable manufacturing .734 .829 .846 .838 .854 .854 .859

II - 4
the September and third quarter rates. This drop in the rate of
accumulation of nondurable inventories was widespread. The total
manufacturing inventory-sales ratio rose to about its level at the
end of last year. Total trade inventories were essentially unchanged
in October as auto stocks declined during the strike and growth of
nonauto stocks moderated substantially from the September pace.
Retail sales are estimated to have moved up briskly at
almost all major types of stores last month, following a strong (up-
ward revised) October increase. Excluding autos and mainly noncon-
sumer items, sales in November are estimated to be 1.4 per cent above
October with a large gain reported for sales of furniture and appliances
as well as another rise in general merchandise. The strike against
United Parcel Service in 15 eastern states appears to have had
relatively little impact on total sales in November. Compared to the
third quarter, sales in November excluding autos and nonconsumer items
were up 3.4 per cent--distinctly stronger than gains in the preceding
two quarters. Higher spending at general merchandise and apparel
stores and at gasoline stations were important sources of strength over
this longer period.
The demand for cars as reflected in unit auto sales appears
to have about returned to pre-strike levels. Domestic auto sales were
at an 8.0 million unit annual rate in November--up from a 7.6 million
unit rate in October--and rose further to an 8.7 million annual rate
in the first ten days of December. This is close to the average rate

II - 5
RETAIL SALES(Per cent change from previousbased on seasonally adjusted
period;data)
1976 1976I-II II-III III-Nov. Sept. Oct. Nov.a
Total sales 1.9 1.2 2.6 -1.0 1.1 1.7
(Real*) 1.0 .2 n.a. -1.9 -.1 n.a.
Total, less auto andnonconsumption items 1.3 1.6 3.4 .3 1.4 1.4
GAF -.2 2.9 4.7 -1.4 3.3 1.5
Durable 3.4 .2 1.3 -4.0 .6 2.5Auto 4.5 -. 7 .4 -6.2 -. 2 3.5Furniture andappliances 2.7 -.2 3.3 -2.2 2.6 1.9
Nondurable 1.2 1.7 3.3 .5 1.3 1.3Apparel -3.2 5.7 1.5 -1.1 2.6 -.7Food 1.2 1.0 2.1 -.3 1.0 .7General merchandise -.1 3.0 5.9 -1.2 3.6 2.0Gasoline .0 2.3 2.9 .7 1.4 .9
aAdvance, partial sample estimate.
Deflated by an unpublished Bureau of Economic Affairs price measure.
AUTO SALES(Seasonally adjusted, millions of dollars)
1976 1977
I III II July Aug. Sept. Oct. Nov.
Total 10.0 10.3 10.2 10.2 10.5 10.0 9.5 9.5
Imports 1.3 1.4 1.6 1.4 1.6 1.8 1.9 1.5
Domestic 8.7 8.9 8.6 8.7 8.9 8.2 7.6 8.0

II - 6
earlier in the year. Strike-related inventory shortages at Ford have
held down the sales rate, and sales of General Motors cars were also
affected by shortages of some popular intermediate and standard units.
Sales in late November and in early December clearly benefited from the
newly-authorized cash rebates on subcompacts.
Sales of imported units in November were at a 1.5 million
unit annual rate, down from the more than 1.8 million pace of the pre-
vious two months. This decline reflects, in part, the conclusion of
dealer incentive programs by two producers undertaken during the fall
in the face of a heavy inventory hangover at model changeover time.
Inventories of imported models remain high, however.
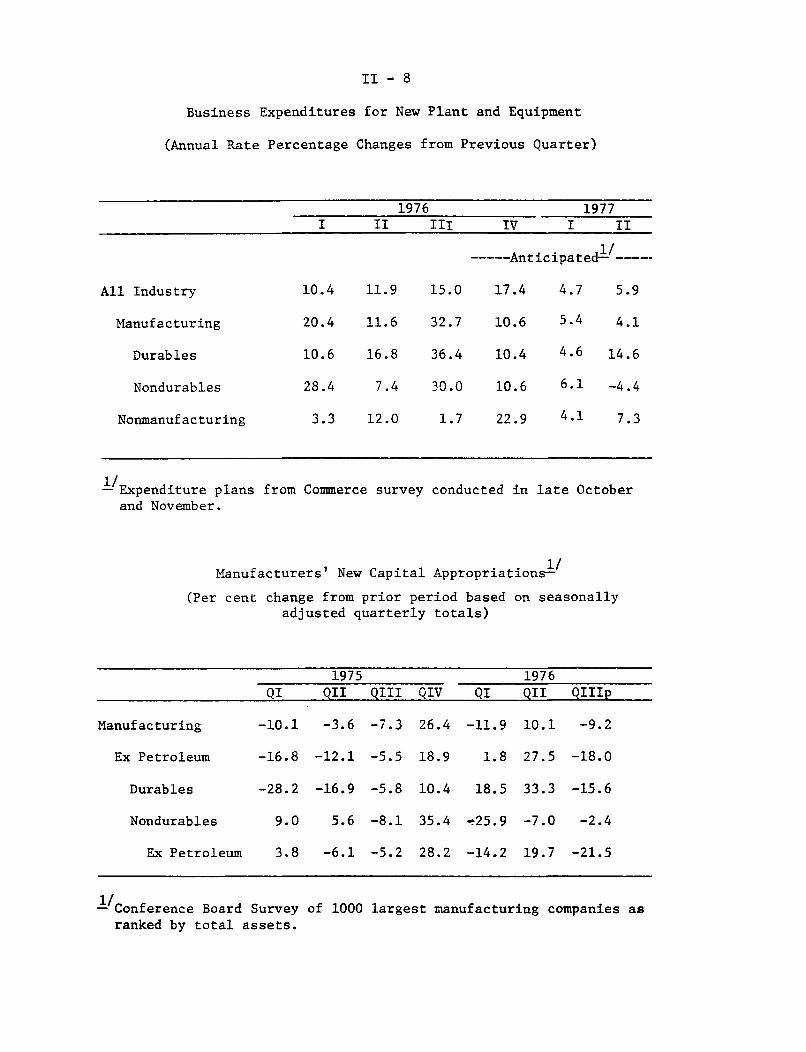
The most recent survey of business capital spending plans
for early 1977 shows surprising weakness. The Commerce Department's
latest survey of anticipated plant and equipment expenditures--conducted
in late October and November--shows business planning to increase
capital spending at an annual rate of 17.4 per cent in the fourth
quarter of 1976, but only at a 5 to 6 per cent annual rate in the
first two quarters of 1977. On the basis of flow data for October,
however, it seems likely that there will be another shortfall of actual
plant and equipment expenditures from expectations in the current
quarter with the shortfall likely to be carried over into the first
half of 1977. This pattern has occurred repeatedly in the recent past.
Overall, the Commerce survey suggests a weaker outlook for
capital spending than the McGraw-Hill survey, which showed a 13 per

II - 7
BUSINESS EXPENDITURES FOR PLANT AND EQUIPMENT
Per cent change from previous quarter __ _ Per cent
Seasonally adjusted, annual rate
- 28
-- 24
I iS I , " - 20
Anticipated
Expenditures* I
iS 12-S12
, - I I
- 7Actual - 4
, ,Expenditures
-- ! - 8SI
S1- 12
'74 1975 1976
Current quarter anticipations.
II - 8
Business Expenditures for New Plant and Equipment
(Annual Rate Percentage Changes from Previous Quarter)
1976 1977I II III IV I II
----- Anticipated- ----
All Industry 10.4 11.9 15.0 17.4 4.7 5.9
Manufacturing 20.4 11.6 32.7 10.6 5.4 4.1
Durables 10.6 16.8 36.4 10.4 4.6 14.6
Nondurables 28.4 7.4 30.0 10.6 6.1 -4.4
Nonmanufacturing 3.3 12.0 1.7 22.9 4.1 7.3
- Expenditure plans from Commerce survey conducted in late Octoberand November.
1/Manufacturers' New Capital Appropriations-
(Per cent change from prior period based on seasonallyadjusted quarterly totals)
1975 1976
QI QII QIII QIV QI QII QIIIp
Manufacturing -10.1 -3.6 -7.3 26.4 -11.9 10.1 -9.2
Ex Petroleum -16.8 -12.1 -5.5 18.9 1.8 27.5 -18.0
Durables -28.2 -16.9 -5.8 10.4 18.5 33.3 -15.6
Nondurables 9.0 5.6 -8.1 35.4 -25.9 -7.0 -2.4
Ex Petroleum 3.8 -6.1 -5.2 28.2 -14.2 19.7 -21.5
-/Conference Board Surveyranked by total assets.
of 1000 largest manufacturing companies as

II - 9
COMMITMENTS DATA FOR BUSINESS FIXED INVESTMENT(Percentage change from preceding period; based on seasonally adjusted data)
Oct. 75
1976 to
QI QII QIII Aug. Sept. Oct. Oct. 76
New Orders Received by Manufacturers
Total Durable GoodsCurrent Dollars 7.0 8.3 -3.0 -.1 -2.9 2.1 12.6
1967 Dollars 1/ 5.5 7.5 -4.6 -.6 -3.9 .8 5.4
Nondefense Capital GoodsCurrent Dollars 1.6 9.3 4.2 -6.8 2.6 3.3 16.8
1967 Dollars 1/ .1 8.1 2.9 -7.1 1.7 2.6 10.1
Construction Contracts for Commercial
and Manufacturing Buildings 2/
Current Dollars 1.4 11.1 -7.1 -7.1 30.9 4.0 13.8
Square Feet of Floor Space -8.6 24.1 -3.8 -3.2 -9.5 11.1 1.4
Contracts and Orders for Plant & Equip.3/
Current Dollars 11.7 3.1 .0 -8.9 3.6 15.1 28.8
1967 Dollars 4/ 9.1 2.3 -. 5 -8.4 2.6 12.4 20.3
1/ FR deflation by appropriate WPI.
2/ Current Dollar series obtained from FR seasonals
adjusted by Census.
Floor space is seasonally
3/ Contracts and orders for plant and equipment (BCD Series No. 10) is constructed
by adding new orders for nondefense capital goods to the seasonally adjusted
sum of new contracts awarded for commercial and industrial buildings and new
contracts awarded for private nonbuilding (e.g. electric utilities, pipelines,
etc.).
4/ An experimental BCD series.

II - 10
cent rise for all of 1977. Moreover, newly approved capital appro-
priations of the 1,000 largest manufacturing companies--which decreased
9 per cent in the third quarter of 1976--also indicate less prospective
strength. Excluding the petroleum industry (where appropriations tend
to be particularly volatile), the total for manufacturing dropped 18
per cent after a cumulative increase of 54 per cent in the previous
three quarters.
Commitments data for business fixed investment remain
relatively more promising, but they, too, are showing less bouyancy
than earlier this year. New orders for nondefense capital goods rose
3.3 per cent in October to record their ninth increase in the last
ten months. While orders continue strong, the rate of increase has
been much less since mid-year than in the first half of 1976. The
volatile series on construction contracts for commercial and manu-
facturing buildings rose sharply in October, and in dollar terms
these contracts were 14 per cent above their level of a year earlier;
but measured in square feet of floor space, they were up only 1 per
cent.
Residential construction continues to show surprising
strength. Private housing starts in October were only slightly
below the strong rate recorded in September. The decline--to a
seasonally adjusted annual rate of 1.79 million units--reflected a drop
in multifamily starts, which had jumped sharply in September in response
to efforts by HUD to encourage activity in this sector.

II - 11
PRIVATE HOUSING STARTS--HUD ASSISTED PROGRAMS
Number of units Per cent of type
Type of unit (NSA)
Sept. Oct. Sept. Oct.
Multifamily
Total 44,200 38,700 100 100
HUD Programs 10,039 8,278 23 21
Sec. 8 1/ 6,552 5,128 15 13
Sec. 236 1 2,597 3,150 6 8
Rent supplement 162 0 - 0
Low rent public 728 0 2 0housing (turnkey)
Single-family
Total 108,900 108,600 100 100
HUD programs 760 600 1(Sec. 235 revised 2/)
NOTE: Details may not add to totals because of rounding. Sec. 8 calculated
from HUD cumulative monthly totals. Rent supplement excludes Sec. 236.
Sec. 235 estimated by HUD.
Section 8 and Section 236 programs provide rental assistance to low andmoderate income households.
2/The section 235 program provides mortgage payment subsidies to enable selectedlow and moderate income households to purchase homes.

II - 12
(Seasonally
NEW PRIVATE HOUSING UNITS
adjusted annual rates, millions of units)
Per cent change in1975 1976 Oct. from:QIV QI QII QIII(p) Sept.(r) Oct.(p) Month ago Year ago
All unitsPermits 1.11 1.17 1.13 1.34 1.50 1.44 - 4 +29Starts 1.37 1.40 1.43 1.59 1.86 1.79 - 4 +25Under construction 1/ 1.04 1.06 1.06 1.11 1.11 n.a. + 3* + 7*Completions 1.28 1.30 1.33 1.36 1.36 n.a. - 3* + 4*
Single-familyPermits .81 .87 .81 .89 .93 .99 + 7 +25Starts 1.03 1.12 1.09 1.19 1.29 1.33 + 3 +22Under construction 1/ .56 .59 .61 .64 .64 n.a. + 3* +22*Completions .91 .97 .99 1.05 1.01 n.a. - 8* + 4*
MultifamilyPermits .30 .30 .32 .45 .58 .45 -22 +41Starts .33 .28 .35 .40 .57 .46 -19 +37Under construction 1/ .48 .46 .46 .47 .47 n.a. + 3* - 8*Completions .37 .33 .34 .31 .36 n.a. +16* + 3*
MEMO:Mobile home shipments .23 .27 .24 .24 .26 .28 + 9 +18
* Per cent changes based on September data.1/ Seasonally adjusted, end of period.
NOTE: Per cent changes are based on unrounded data. A change of less
cent is indicated by --
than 1 per

II - 13
The pace of single-family starts continued to increase in
October, reaching a seasonally adjusted annual rate of 1.33 million
units. This rate was only 7 per cent below the January 1973 peak,
when support under federal subsidy programs was much larger. Mean-
while, sales of both new and existing homes in October, while down
from their exceptional pace of September, remained quite strong.
With the exception of the second quarter of 1976, state
and local government spending has risen quite modestly of late--up
only 0.8 per cent from a year ago in real terms, compared to a long-
run average rise of over 3 per cent. Most of the slowdown reflects
reduced investment in structures and low employment growth stemming
partly from fiscal constraints faced by many units. The latest indi-
cators of state and local government purchases show continued weakness
in investment. The value of construction put-in-place fell sharply
in October, according to preliminary data, to well below the average
for the third quarter. Although state and local employment increased
in November its level was only slightly above that in August. The
Federal sector (NIA basis), after having made up during the third
quarter some of its earlier shortfall in spending, appears to have
reverted to a more modest growth rate of spending in the fourth
quarter--when allowance is made for the recent Federal pay raise.
Total employment rose by 360,000 in November--more than
offsetting the declines recorded in September and October. However,
the civilian labor force, which was virtually unchanged from July to

II - 14
October, jumped 560,000 in November and the unemployment rate rose
0.2 percentage points to 8.1 per cent--its highest level since
December 1975. Over the past six months, household employment has
grown by only 430,000, well below the increase in the labor force,
and the unemployment rate has increased by 0.8 percentage point.
The rise in unemployment over the past half year has been widespread
among age-sex and occupation groups. This rise occurred not only
among reentrants and new entrants, but also among job losers.
Nonfarm payroll employment (establishment series) rose
150,000, strike adjusted, in November. Gains in employment occurred
in service-producing industries as well as in construction, and min-
ing. Manufacturing employment rose 100,000 in November, but on a
strike-adjusted basis factory jobs were about unchanged over the month.
The factory workweek rose 0.3 hour to 40.0 hours in November--reflecting
in part the end of strikes in autos and agriculture machinery. The
November figures leave manufacturing employment and hours virtually
unchanged from their levels of last spring before the tire and auto
strikes began.
Total personal income rose at a $10.2 billion annual rate
in October compared to a $6.2 billion rate in October; the Federal
government pay raise accounted for $2.0 billion of this increase,
while manufacturing payrolls were essentially unchanged in October.
In November, payrolls are likely to be up significantly, reflecting
the return of workers involved in labor disputes.

II - 15SELECTED UNEMPLOYMENT RATES
(Seasonally adjusted)
1975 1976
QII QIII QIV QI QII QIII Oct. Nov.
Total, 16 years and older
Men, 20 years and olderWomen, 20 years and olderTeenagers
Household headsMarried men
8.7 8.6 8.5 7.6 7.4 7.8 7.9 8.1
7.0 7.0 7.08.4 7.9 7.9
20.2 20.2 19.5
5.77.4
19.4
5.77.1
18.7
6.07.6
18.8
6.37.6
19.0
6.57.7
19.0
6.0 5.9 5.9 5.0 4.9 5.3 5.4 5.45.5 5.4 5.1 4.1 4.1 4.4 4.4 4.6
Total, Alternative SeasonalAdjustment Methods
All Additive Factors1975 Factors
8.7 8.5 8.3 7.9 7.3 7.7 7.7 7.88.7 8.6 8.5 7.8 7.5 7.6 7.9 7.9
CHANGES IN EMPLOYMENT(average monthly change in thousands;
on seasonally adjusted data)based
June 1975-* Apr. 1976- Oct. 1976-Apr. 1976 Nov. 1976 Nov. 1976
Nonfarm Payroll Series
Total 257 100 260
(Strike adjusted) 254 98 152
Construction 1 -5 29
Manufacturing 88 6 100
(Strike adjusted) 90 4 -6
Durable 48 19 121
Nondurable 40 -13 -21
Trade 58 18 -19
Services and Finance 70 62 75
Total Government 34 11 41
State and Local 34 11 37
Household Series
Total 290 104 357
* June 1975 was the specific cyclical low for payroll employment.

II - 16
Since last spring, however, the growth rate of personal
income has slowed considerably. The reduced pace reflects a weaker
rise of wage and salary disbursements and a sizeable decline in farm
income. The slower advance of wage and salary disbursements was due
in part to the auto strike but also reflected smaller increases in
employment, no growth in the length of the workweek, and smaller
increases in hourly earnings.
In real terms, wage and salary disbursements have risen
6.2 per cent since their trough in July 1975. This compares with a
10.9 per cent increase over the comparable 15 month period of the
1958-59 recovery. Real personal income has risen 4.9 per cent since
July 1975; in the first 15 months of the 1958-59 recovery, it increased
8.5 per cent. Furthermore, real personal income is only 1.5 per
cent above its previous peak in November 1973 compared to 6.4 per
cent at a similar stage in the 1958-59 recovery.
The rate of wage increase over the first 11 months of this
year has moderated significantly from the rapid pace experienced in
1974 and 1975. The average hourly earnings index for private nonfarm
workers has increased at an annual rate of 6.9 per cent since last
December compared with 7.9 per cent and 9.4 per cent for all of 1975
and 1974, respectively. The moderation has been widespread--occurring
in all major industries.

II - 17
CYCLICAL CHANGES IN REAL INCOME*(cumulative per cent change; based on seasonally
PersonalIncome**
A. Expansions--15 months after troughTrough = 6/49
6/544/5812/6011/707/75
11.310.48.57.47.5
adjusted data)
Wage and SalaryDisbursements**
12.410.510.97.87.46.2
B. 15 months afterPrevious Peak
12/48 -5/53 -3/57 -7/60 -10/69 -11/73 -
trough compared to previous peakTrough plus 15 months
9/509/557/593/622/7210/76
* November 1973 was the specific high and July 1975 was the specific lowfor the deflated wasge and salary component.
** Deflated by the CPI, seasonally adjusted.
PERSONAL INCOME(average monthly change , billion of dollars seasonally
adjusted at an annual rate)
July 75* July 76- Sept. 76-July 76 Oct. 76 Oct. 76
Total Personal Income
Labor and Nonfarm Proprietors' IncomeWage and Salary DisbursementsOther Labor IncomeNonfarm Proprietors' Income
Farm Proprietors' Income
Transfer Payments
Rents, Dividends, and PersonalInterest
10.7
8.87.5
.7
.7
-. 2
1.2
1.4
7.0
7.05.8
.7.5
-2.9
1.1
2.1
10.2
7.86.7
.7.4
-. 9
1.7
1.9
* July 1975 was the specific low for deflated wage and salary disbursements.
8.67.14.65.75.1
-0.3

II - 18
Revised figures for nonfarm business sector productivity
show a smaller third quarter increase (2.9 per cent annual rate) than
previously reported (3.6 per cent annual rate) reflecting a weaker
estimate of the output measure. Unit labor costs are now estimated
to have increased at a 3.9 per cent rate, compared to a 3.3 per cent
advance during the year ending in the second quarter of 1976.
The wholesale price index rose 0.6 per cent in November
primarily as a result of a further large advance in industrial commodit-
ies. The index of industrial commodities prices has accelerated from
a 3 per cent annual rate over the first five months of the year to a
nearly 10 per cent rate over the last six months. If fuels and power
are excluded, this divergence would narrow and the rates of increase
would be about 5 and 7 per cent, respectively. Apart from fuels,
higher prices for metals, machinery, transportation equipment, and
lumber and wood products have been the prime movers in the advance
since May.
The composition of increases in consumer prices appears
little changed from June through October, and is characterized by
modest advances for food and large increases for energy items. Declin-
ing meat prices--the result of abundant supplies--have been the major
factor in the favorable performance of food prices. However, consumer
food prices are likely to rise more in the next few months as a result

II - 20
RECENT PRICE CHANGE(Per cent changes at annual rates; based on seasonally adjusted data)-
Relativeimpor- Dec. 74 Dec. 75 Mar. 76 June 76 Sept. 76 Oct. 76tance to to to to to to
Dec. 75 Dec. 75 Mar. 76 June 76 Sept. 76 Oct. 76 Nov. 76
Wholesale Prices
All commodities 100.0 -1.8
Farm and food products
Industrial commoditiesExcluding fuels andrelated productsand power
Materials, crude andintermediate 2/
Finished goodsConsumer nonfoodsProducer goods
Memo:Consumer foods
22.8 -0.3 -15.8 18.0 -11.0 -11.2
77.2
66.8
48.1
18.711.9
11.1
12.3
8.9
2.3 10.13.3 5.7
11.7 10.9
8.817.2
-4.7-20.5 16.8 -12.2
Consumer Prices
All items
FoodCommodities (nonfood)Services
Memo:All items less food and
energy 2/3/Petroleum products 2/Gas and electricity
1/ Not compounded for one-month changes.2/ Estimated series.3/ Energy items excluded: gasoline and motor oil, fuel oil and coal, gas and electricity.
100.0
24.738.736.6
68.14.52.7
7.0
6.56.28.1
6.710.114.2
2.9
-7.92.9
10.6
7.715.7
6.4
6.1
7.25.66.2
5.59.3
12.1
5.8
1.86.67.1
6.715.613.6
4.2
3.34.56.6
3.613.615.5

III-T-1SELECTED DOMESTIC FINANCIAL DATA
(Dollar amounts in billions)
Indicator Latest data Net change fromPeriod Level Month Three Year
ago months ago ago
Monetary and credit aggregatesTotal reserves
Nonborrowed reservesMoney supply
MlM2M3
Time and savings deposits(Less CDs)
CDs (dollar change in billions)Savings flows (S&Ls + MSBs + CreditBank credit (end of month)
SAAR (per cent)November 34.89 14.2 4.3November 34.82 15.0 4.6
November
November
November
NovemberNovember
Unions)November
November
Market yields and stock pricesFederal funds wk. endg.Treasury bill (90 day) "
Commercial paper (90-119 day) "ew utility issue Aaa "
nicipal bonds (Bond Buyer) 1 dayauction yield (FHA/VA)
Dividends/price ratio (Commonstocks) wk. endg.
NYSE index (12/31/65=50) end of day
12/8/7612/8/7612/8/7612/10/7612/9/7612/13/76
12/8/7612/14/76
Credit demands
309.8731.9
1223.5
422.162.1
491.5770.1
0.010.111.7
17.60.114.1
9.4
4.411.913.9
17.5-2.316.9
9.2
Percentage or index points
4.67 -. 31 -. 584.40 -. 47 -.704.68 -.40 -. 70
7.93 -.38 -. 35
5.96 -.43 -. 568.51 -.16 -. 41
3.94 -. 1856.59 1.06
.231.02
4.810.512.6
15.2-19.7
15.85.9
-.59-1.22-1.25-1.44-1.38-.81
-. 2346.38
Net change or gross offeringsCurrent month Year to date
Business loans at commercialbanks November
Consumer instalment credit outstanding OctoberMortgage debt outst. (major holders) SeptemberCorporate bonds (public offerings). NovemberMunicipal long-term bonds (gross
offerings) NovemberFederally sponsored Agcy. (net borrowing) NovemberU.S. Treasury (net cash borrowing) December
Total of above credits
e - Estimated
1976
1.91.65.91.2e
3.2e-. 66.5
1975 1976
1.813.742.723.6e
2.4 32.2e.5 2.9
8.2 69.4
19.7 19.2 186.3
1975
-6.14.4
28.930.9
28.5
3.1
85.4
175.1

III - 1
DOMESTIC FINANCIAL DEVELOPMENTS
Domestic securities markets have staged a strong rally in
recent weeks. Since the November FOMC meeting, market interest rates
have fallen 25 to 60 basis points, dropping to their lowest levels in
more than two years. The rally was fueled in part by the further
easing of the Federal funds rate from 5 per cent to below 4-3/4 per
cent and the cut in the discount rate by one-quarter percentage point.
In addition, the weakness of incoming economic indicators--suggesting
that private credit demands may not increase markedly in the months
ahead--and the sluggish performance of M1 lent support to the widely-
held view that the Federal Reserve might soon lower still further its
operating target for the funds rate. An indication of the market's
expectation of further easing is that yields on most short-term market
securities remain below the Federal funds rate.
Declining interest rates contributed to sustained inflows
of time and savings deposits to depository institutions, although some
institutions reportedly have taken actions designed to slow deposit
growth. Credit flows in mortgage markets remained strong in November,
and business and real estate loans at commercial banks continued to
expand. Consumer instalment credit growth has remained moderate,
reflecting in part the lackluster pace of consumer expenditures for
automobiles and other durable goods and the utilization of other sources
of funds to make purchases traditionally financed by consumer credit.
III - 2
New Treasury and State and local government financing remained
large in November, but the volume of private domestic long-term bond
financing fell off to the smallest monthly total in more than two years.
However, the large volume of issues scheduled for December suggests
that some private and municipal borrowers have accelerated their
long-term borrowing plans to take advantage of the recent declines
in interest rates.
Monetary Aggregates and Bank Credit
The level of M1 was unchanged in November, after growing at
a 13-3/4 per cent annual rate in October. Because recent monthly
growth rates of M1 have been quite volatile, a more reliable indicator
of the short-run growth trend in this aggregate may be obtained by
averaging the rates of growth in the last few months. The average
annual rate for the three-month period from September through November,
for example, was about 4-1/2 per cent, near the 4-3/4 per cent average
for the year ending in November.
Although growth in M2 and M3 was somewhat weaker in November
than in the previous month, their expansion was in line with the aver-
age growth rates in these aggregates over the past year. All of the
moderation in the rate of expansion of M2--from a 15-3/4 per cent rate
in October to a 10 per cent rate in November--was due to the weakness
in M1. Growth in commercial bank time and savings deposits (excluding
negotiable CDs at weekly reporting banks) was slightly above the

III - 3
MONETARY AGGREGATES 1/(Seasonally adjusted changes)
1975 1976 Twe l v e
O--t months
HII HI QI QII QIII Oct Nov Nov endingNov 76
Per cent at annual rates
M1 (currency plusdemand deposits)
M2 (M plus time depositsa commercial banksother than large CDs) 8.3
M3 (M plus deposits atthrift institutions) 11.5
Adjusted bank creditproxy 3.7
Total time and savingsdeposits at CBs 7.3
a. Other than largenegotiable CDs 11.4
1. Savings deposits 17.02. Time deposits 7.4
a. Savings and loans 18.2
b. Mutual savings banks 11.9
c. Credit unions 18.6
4.7 5.6 2.7 8.4 4.1 13.7 0.0 6.9 4.8
10.4 9.7 10.8 9.2 15.7 10.1 13.0 10.5
11.8 11.2 12.0 11.6 16.5 11.7 14.2 12.6
2.4 2.3 2.4 3.8 11.7 13.2 12.5 3.9
6.3 7.2 5.3 7.1 14.0 15.6 14.9 8.0
14.1 15.3 12.5 13.2 17.3 17.6 17.6 15.2
25.8 28.3 21.7 13.4 30.0 26.2 28.4 24.75.4 5.6 5.1 12.7 7.0 10.2 8.6 8.0
15.5 15.0 15.4 16.5 18.8 14.9 17.0 17.3
9.7 9.1 10.1 12.2 12.6 10.8 11.7 11.4
16.6 16.8 15.8 16.0 19.1 1 6 .2e 1 7 .8e 17 .7e
Billions of dollars(Average monthly changes, seasonally adjusted)
Memoranda:
a. Total U.S. Governmentdeposits 0.3 0.4 1.1 -0.4 1.1 0.8 -0.4 0.1
b. Negotiable CDs
c. Nondeposit sourcesof funds
-0.2 -2.1 -3.2 -0.9 -2.7 -0.4 0.1 -0.2 -1.6
0.2 -- -0.1 0.1 -0.1 0.8 0.1 0.5 0.1
1/ Half-year and quarterly growth rates are based on quarterly average data.p--Preliminarye--Estimated
0.3

III - 4
17-1/2 per cent annual rate of the most recent three-month period.
The continued rapid inflows of these deposits may be attributable
to the low level of market yields relative to bank offering rates.
With the entire yield curve continuing to move downward since the
summer, yields on Treasury obligations (of comparable maturities)
are now well below the maximum allowable rates for deposits in all
maturity categories. However, according to an informal System sur-
vey of banks and thrift institutions taken in the first week of
December, a significant number of banks throughout the country have
either ceased offering longer-term consumer-type time deposits
or have reduced their offering rates.1/
Rate cutting by thrift institutions--whose ceiling rates
are higher--appears to be even more common than for commercial banks,
and deposit flows into these institutions abated somewhat in November
for the second consecutive month. On a seasonally adjusted basis,
the annual rate of growth of their deposits during November fell to
2/an estimated 13-3/4 per cent from October's 17 per cent rate.2/
1/ About 10 per cent of sampled commercial banks stopped offeringlonger-term deposits during the last six months, while a slightlyhigher percentage cut deposit rates on long and short-term depositsover this period. None of the sampled banks has yet reduced rateson savings deposits. A more detailed summary of the survey,conducted by staffs of the Board and the Reserve Banks, willappear in the Supplement.
2/ Problems in seasonal adjustment associated with the seasonalcoincidence of disintermediation cycles in 1973 and 1974 may alsohave resulted in overstating the extent to which deposit growthat thrifts has fallen since the summer.

III - 5
The weakness in the rate of increase of M , as well as the slower
deposit inflows at thrift institutions, contributed to a decelera-
tion in the rate of growth of M3 to a 12 per cent annual rate in
November, compared to 16-1/2 per cent in October.
Large negotiable CDs outstanding at weekly reporting banks
grew by $1 billion from late October to late November, after declin-
ing every month this year except June. This pickup was accompanied
by some lengthening in maturities of the certificates sold. In
early December, two major banks in New York City took the unusual
action of placing through underwriters significant amounts of CDs
in the four to five-year maturity range. It has been reported that
rates on intermediate-term CDs recently have been attractive in terms
of bankers' rate expectations, and that some banks have taken advantage
of opportunities to pin down profitable spreads on fixed-rate term
loans financed by CDs.
Total bank credit expanded at a 9-1/2 per cent annual rate
in November, somewhat lower than the 12 per cent rate in October but
still the second highest rate of growth in the last twelve months.
Bank holdings of U.S. Government securities increased moderately in
November, following two successive monthly declines, but other
securities in bank portfolios, mostly tax-exempts, registered a sharp
increase. Total loans rose at a 5-3/4 per cent annual rate in Novem-
ber, off substantially from the unusually rapid 18 per cent rate of

III - 6
growth in October. Nearly all of the expansion in loans in November
was concentrated in business and real estate loans.
Business Credit
Business loans at commercial banks advanced at a 13 per cent
annual rate in November, the third consecutive monthly increase, and
such loans are now slightly above the level outstanding at the beginn-
ing of the year. However, more than half of this increase (and a
smaller share of the October rise) was accounted for by acquisitions
of bankers acceptances, which some banks have been using to build up
their loan portfolios for year-end statement date and tax purposes.1/
Commercial paper issued by nonfinancial corporations rose
$200 million, seasonally adjusted, in November, after declining
during the previous two months. Despite little net growth in commercial
paper in October and November, the total of nonfinancial commercial
paper and business loans at banks grew at an annual rate of 14-3/4
per cent during this period. Even after excluding from the business
loan increases the unusually large acquisitions of bankers acceptances
during the past two months, the average monthly increase in the re-
maining short-term business credit for October and November is sub-
stantially larger than for any two-month period since mid-1974. (See
1/ For ten New York City banks, nearly all of the $1 billion growth(not seasonally adjusted) in business loans for the month was inbankers acceptances.

III - 7
COMMERCIAL BANK CREDIT(Seasonally adjusted changes at annual percentage rates)1/
1975 1976HII HI QI QII QIII Sep Oct Nov
Total loans andinvestments 2/ 4.5 4.9 5.5 4.3 7.0 5.9 12.2 9.4
Treasury securities 22.1 36.8 44.3 26.3 -- -12.6 -6.4 10.3
Other securities 2.9 -1.0 -4.1 2.2 8.3 8.2 3.3 22.0
2/Total loans2/ 2.3 1.6 2.1 1.0 8.0 8.7 18.2 5.7
Business loans2/ -1.2 -4.9 -7.4 -2.2 3.5 6.9 18.6 12.9Real estate loans 4.3 8.0 8.9 6.9 6.0 8.5 6.7 7.5Consumer loans 9.3 4.9 4.0 5.7 11.3 11.5 8.9 n.a.
MEMO: Business loans plusnonfinancial 3/commercial paper -3.1 -1.7 -5.3 1.9 .6 -2.6 16.7 12.7
Short-term businesscredit less 4/ -5.2 -. 3 -3.5 2.9 -2.2 -8.5 14.5 7.8bankers acceptances
1/ Last-Wednesday-of-month series except for Junewhich are adjusted to the last business day of
2/ Includes outstanding amounts of loans reportedto their own foreign branches, nonconsolidated
and December,the month.as sold outright by banksnonbank affiliates of the
bank holding companies (if not a bank), and nonconsolidated nonbank sub-sidiaries of holding companies.
3/ Nonfinancial commercial paper is measured from end-of-month to end-of-month./ Business loans at commercial banks, plus nonfinancial commercial paper, less
acquisitions of bankers acceptances by 155 large banks.n.a.--not available

III - 8
the last line of the Commercial Bank Credit table.) The composition
and timing of the expansion in short-term business credit is some-
what puzzling. Such growth, however, is consistent with inventory
accumulation--perhaps unintended--by business firms that have no
alternative source of financing except banks. It also may reflect
abatement of balance sheet restructuring by businesses or more
aggressive efforts by banks to add to their loan portfolios. Not
only has the prevailing prime rate been cut from 7 per cent to 6-1/4
per cent since late September--with one major bank going to 6 per
cent--but also there is evidence that banks have eased further their
nonprice terms of lending in recent months.1/2/
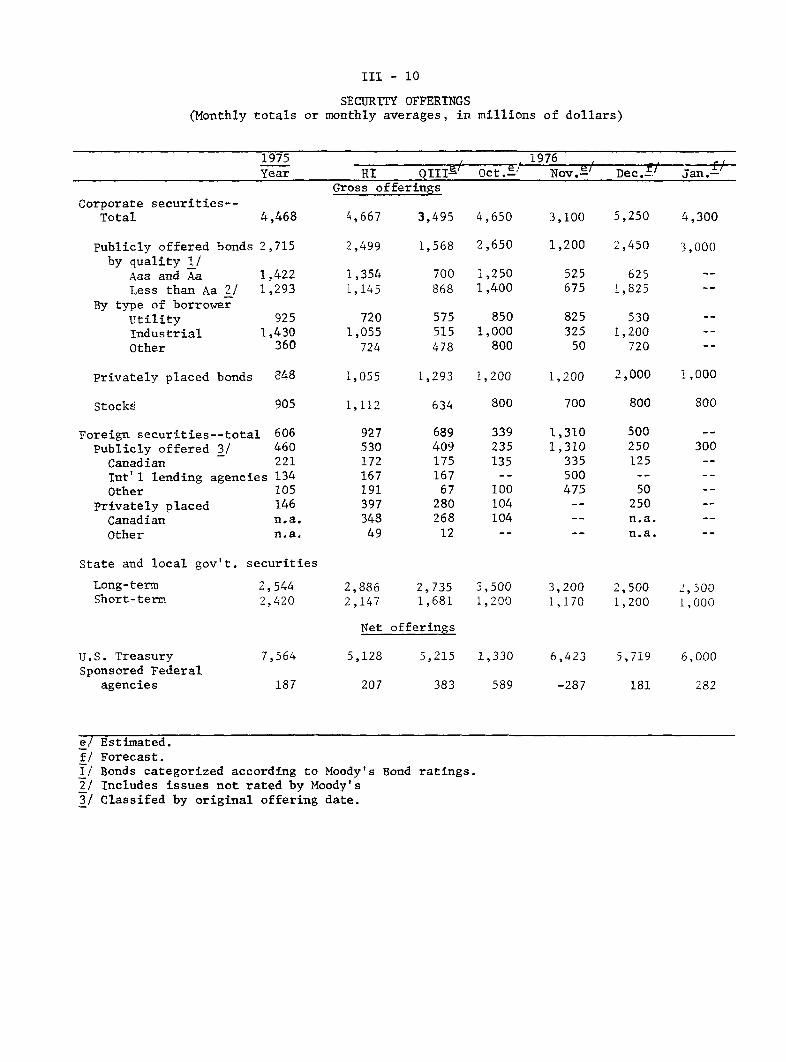
Gross issues of publicly offered bonds by domestic corpora-
tions totaled only $1.2 billion during November. This relatively
light calendar reflected the low levels of offerings by high-grade
industrial concerns and finance companies. (Finance companies had
been issuing record amounts of long-term debt throughout most of 1976.)
With bond yields at three-year lows, several corporations have accel-
erated the dates of their offerings or increased the amounts to
be borrowed. December's holiday-shortened calendar currently is
1/ A summary of the November 15, 1976 Survey of Changes in Bank
Lending Practices will appear in the Supplement.2/ There have been reports in the press that some banks are more
willing to make fixed rate and "cap" loans; at this writing,the Board staff has found no confirmation of these reports.
III - 9
projected at $2.4 billion, with less than $500 million of the issues
carrying ratings of Aaa or Aa. Private placements, normally heavy
at the end of the year, are projected to be especially large in
December, apparently because institutional investors are aggressively
seeking such placements.
The dearth of public offerings of domestic corporate bonds
in November was largely offset by a record volume ($1.3 billion) of
publicly offered foreign bonds, particularly from the World Bank and
several Canadian issuers who were attracted by the relatively favorable
interest rates in U.S. markets. Foreign bond offerings (public and
private) currently are expected to be a record $9.7 billion in 1976,
compared to the previous record of $7.3 billion in 1975.
Yields in private long-term securities markets have moved
downward with other market rates since the November FOMC meeting,
and are currently at their lowest levels in almost three years. The
Board's index of new, Aaa-rated utility bond yields has declined more
than 25 basis points since mid-November to just under 8 per cent.
Stock market prices have risen about 5 per cent (NYSE
Composite Index) on increased volume since the last FOMC meeting,
although most broad stock market indexes remain below levels reached
in late September. Utility stock prices have moved higher throughout
most of the year--as the industry reported markedly improved profits
III - 10
SECURITY OFFERINGSMonthly totals or monthly averages, in millions of dollars)
1975 1976Year HI QIIIe/ Oct.3/ Nov.e. Dec.f. Jan.f.
Gross offeringsCorporate securities--
Total
Publicly offered bonds 2,715by quality 1/
Aaa and AaLess than Aa 2/
By type of borrowerUtilityIndustrialOther
Privately placed bonds 848
Stocks
4,667 3,495 4,650 3,100 5,250 4,300
2,499
1,3541,145
7201,055
724
1,055
1,112
1,568 2,650 1,200 2,450 3,000
700 1,250868 1,400
575 850515 1,000478 800
1,293 1,200
525 625675 1,825
825 530325 1,20050 720
1,200 2,000 1,000
Foreign securities--totalPublicly offered 3/CanadianInt'l lending agenciesOther
Privately placedCanadianOther
606460221134105146n.a.n.a.
89 33909 23575 13567
67 10080 10468 10412
State and local gov't. securities
Long-termShort-term
U.S. TreasurySponsored Federal
agencies
2,5442,420
7,564
187
2,886 2,735 3,500 3,200 2,500 2,5002,147 1,681 1,200 1,170 1,200 1,000
Net offerings
5,128 5,215 1,330 6,423 5,719 6,000
-287 181 282
Estimated.Forecast.Bonds categorized according to Moody's Bond ratings.Includes issues not rated by Moody'sClassifed by original offering date.
4,468
1,4221,293
9251,430
360
1,3101,310
335500475
500250125
50250n.a.n.a.

III - 11
and as falling interest rates made dividend yields on these stocks
relatively attractive--and the NYSE's utility stock index reached its
1976 high in early December. Offerings of new common and preferred
stock totaled approximately $800 million in November, and public
utilities continued to account for most of the volume.
Other Securities Markets
During the recent rally, some of the largest yield declines
were in the intermediate-term Treasury security area--a pattern that
has prevailed since rates began their downtrend from the peaks of
this past spring. Since late May, for example, yields on three-month
Treasury bills and on 20-year issues have dropped around 100 basis
points, while the yield on five-year issues has fallen 180 basis
points (see yield curve chart). This relative easing of intermediate-
term yields may be a reflection of the market's less exuberant view
of the likely future course of the economy or of some downward revi-
sions in inflationary expectations. Also, since late May, commercial
bank acquisitions of Treasury securities have been concentrated in
the intermediate range. These institutions reportedly are feeling
considerable pressure to reduce their low-yielding short-term asset
positions, especially with year-end statement dates nearing.

III - 12
SELECTED FINANCIAL MARKET QUOTATIONS(One day quotes--in per cent)
Nov. '75 Sept. '76 Oct. '76 Nov. '76FOMC FOMC FOMC FOMC
Nov. 18 Sept. 21 Oct. 19 Nov. 16 Nov. 30 Dec. 7 Dec. 1
Short-term
Federal funds1/ 5.24 5.21 4.97 5.02 4.78 4.67 4.675/
Treasury bills3-month 5.47 5.03 4.84 4.83 4.42 4.40 4.346-month 5.80 5.23 4.95 4.95 4.57 4.51 4.511-year 6.12 5.38 5.10 5.07 4.69 4.64 4.66
Commercial paper1-month 5.38 5.00 4.75 4.88 4.63 4.50 4.503-month 5.75 5.25 5.00 5.13 4.75 4.63 4.63
2/Large neg. CD's2/
3-months 6.13 5.25 4.90 5.15 4.70 4.63 4.606-months 6.70 5.45 5.10 5.30 4.85 4.70 4.70
Federal agencies1-year 6.88 5.95 5.53 5.69 5.22 5.14 5 12
(12/10)Bank prime rate 7.50 7.00 6.75 6.50 6.50 6.50 6.25
(12/13)Long-term
Corporate,New AAA- 3/ 9.40 8.23 8.28 8.24 7.95 7.93p n.a.Recently offered- 9.24 8.30 8.20 8.28 8.04 7.97 7.95P
Municipal(Bond Buyer)- 7.43 6.50 6.25 6.39 6.16 6.03 5.96
U.S. Treasury(20-year constant
maturity) 8.36 7.71 7.69 7.67 7.44 7.31 7.33p
Stock prices
Dow-Jones Industrial 855.24 1014.79 949.97 935.34 947.22 960.69 980.63N.Y.S.E. Composite 48.15 57.51 54.18 53.52 54.80 55.63 56.59AMEX 85.40 104.15 98.56 98.23 98.94 101.42 103.73Keefe Bank Stock 494 589 569 574 587 600 632
Weekly average.Highest quoted newOne day quotes forOne day quotes for
issues.preceding Friday.preceding Thursday.
Average for first 6 days of statement week ending December 15.
n.a. - not available.p - preliminary.

III - 13
The Treasury has borrowed $5.6 billion of new cash in the
market since the mid-November refunding operation and Board staff
projections indicate that only a modest amount of new money will be
raised over the remainder of this month. About one-fourth of the
projected $17.8 billion Treasury borrowing from the public in the
fourth quarter is in non-marketable form, reflecting the continued
sale of savings bonds as well as significant purchases of special
issues by foreign governments and a surge in special issues to State
and local governments.1 /
Sales of municipal bonds in November were $3.2 billion,
bringing total long-term tax-exempt financing for the first eleven
months to $32.1 billion--already $1.6 billion over last year's 12-month
record total. As noted in previous Greenbooks, the heavy volume of
bond financing stems, in part, from funding of short-term obligations,
financing of nuclear power plants being constructed by State and local
government authorities, and the reactivation of borrowing plans disrupted
by the New York crisis in 1975.
1/ State and local units may purchase such securities as a temporaryinterest-bearing repository for their borrowing proceeds. The yieldson these special issues are tailored to meet Federal regulationsprohibiting State and local governments from realizing arbitrageprofits by investing funds obtained at tax-exempt rates in higheryielding Treasury securities.
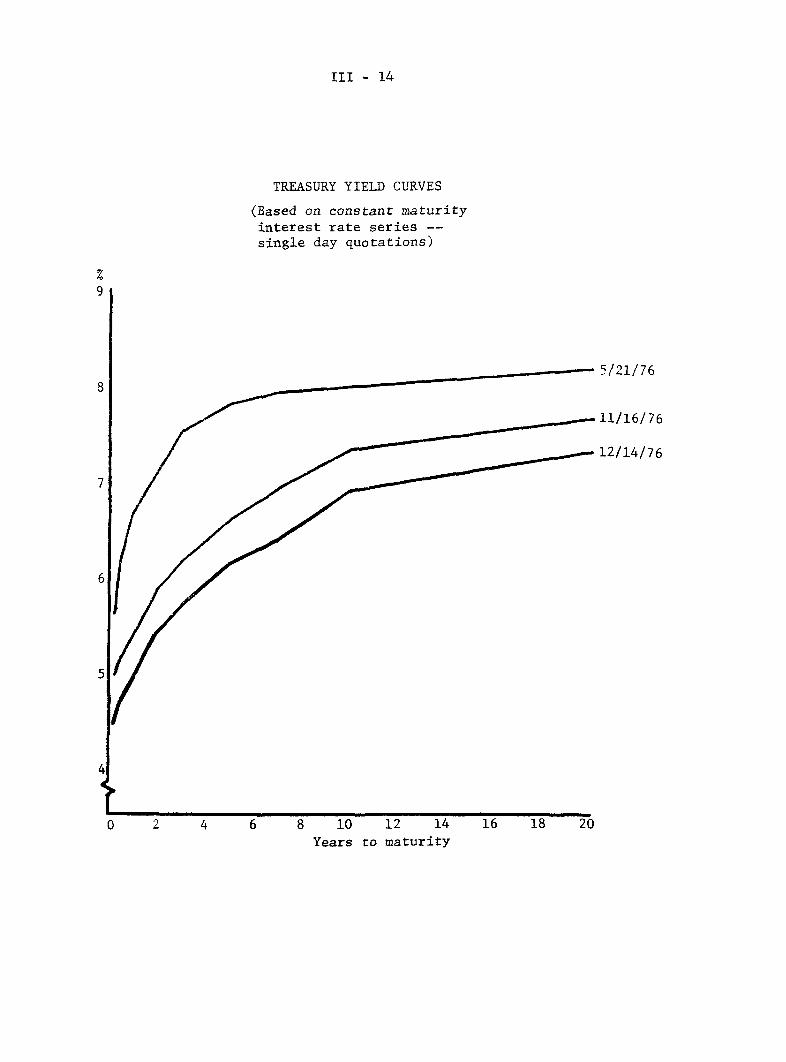
III - 14
TREASURY YIELD CURVES
(Based on constant maturityinterest rate series --single day quotations)
5/21/76
11/16/76
. 12/14/76
0 2 4 10 12 14
Years to maturity

III - 15
Yields on long-term tax-exempt securities have declined
appreciably since the last meeting of the FOMC; the Bond Buyer Index
now stands at 5.96 per cent, its lowest level since June 1974. The
pattern of declining yields in the face of a heavy volume of new issues
has existed since early summer and continues to prevail despite the
market's initial reaction to the recent decision overturning the 1975
New York Moratorium Act.1 / Renewed interest in the tax-exempt market
by property-casualty insurance companies--and in recent months by
commercial banks--has bolstered demand for these securities. New
buying support also has come from the recently authorized open-end
tax-exempt bond funds. Total assets of these funds have grown rapidly
over the last month, reaching about $400 million as of early December.
Mortgage and Consumer Credit
Activity in the mortgage market is estimated to have remained
at a high level in November. Despite slower deposit growth at savings
and loan associations, outstanding commitments at these institutions
continued to increase during October from their record level in
September. New issues of GNMA guaranteed mortgage-backed securities
1/ On Friday, November 19, the New York Moratorium Act was overturnedby the New York State Court of Appeals. Under the court order,holders of $1 billion of New York City notes can receive principaland interest payment as soon as a payment schedule can be worked outwith New York officials. The noteholders are believed to be largelyindividuals and small banks. The immediate market reaction waslimited to a sharp drop on Municipal Assistance Corporation bonds.Prices, however, rebounded quickly the following Monday as marketparticipants viewed the court decision as a reaffirmation of thesecurity behind general obligation bonds.

III - 16
also remained large in November. The expansion in mortgage credit has
continued to be dominated by loans for new and existing single family
homes; however, some strengthening in the multi-family sector has also
been apparent in recent months, reflecting increased momentum in existing
Federal subsidy programs.
Rates on conventional home mortgages in the primary market have
fallen less rapidly from their peak in late 1974 than yields on long-term
market securities, and downward pressures on mortgage rates have
intensified in recent weeks, particularly in the secondary mortgage
market. Since the November FOMC meeting, yields have dropped 17 basis
points further on government underwritten mortgages in the FNMA auction
and by as much as 40 basis points on GNMA guaranteed mortgage-backed
securities which compete directly in the bond market. Moreover, trade
reports suggest that rate cutting in the primary home mortgage market
has broadened significantly--a development which, however, has yet
to show up in the regularly published series.
Consumer instalment credit outstanding expanded at an 11 per
cent annual rate in October--up moderately from September and slightly
above the average of the past year. The commercial bank share of the
net expansion declined in October, owing partly to slower growth of
bank-card credit outstanding and partly to a pickup in credit expansion
by retailers and finance companies.

III - 17
The growth of total instalment credit outstanding during the
past year averaged just under 10 per cent, compared with nearly 15 per
cent in comparable periods of previous post-war recoveries. This
relatively sluggish expansion may be attributed in part to the slow
growth at this stage of the current cycle of purchases for which
instalment credit is most often used, particularly consumer durables.1/
Moreover, households appear to have been liquidating equity in existing
homes,2/ which may have permitted less intensive use of instalment credit
for consumer goods purchases.3/
1/ Sales of these goods have declined as a proportion of total retailsales during the recent recovery, in contrast to behavior duringearlier upswings.
2/ The robust growth in home mortgage credit in recent months hasconsiderably exceeded household net expenditures on homes. See theGreenbook of September 1976.
3/ Automobile credit expansion, in particular, has fallen in relationto automobile sales--in contrast to rising in most recent cyclicalupswings. Development of consumer leasing may help to explainthe less intensive use of automobile instalment credit.

III - 18
INTEREST RATES AND SUPPLY OF FUNDS FORCONVENTIONAL HOME MORTGAGES
AT SELECTED S&Ls
Average rate on Basis pointnew commitments change from Spread1/ Per cent of S&Ls
for 80% loans month or (basis with funds in
(Per cent) week earlier points) short supply
1976--High 9.10 -- 80 11
Low 8.70 - -20 0
June 8.90 +12 +20 6
July 8.98 + 8 +26 7
Aug. 9.00 + 2 +53 7Sept. 8.97 - 3 +74 9Oct. 8.90 - 7 +61 8Nov. 5 8.85 - 5 n.a. 8
12 8.80 - 5 49 719 8.80 0 56 6
26 8.80 0 75 6Dec. 3 8.80 0 83 2
10 8.80 0 n.a. n.a.
1/ Average mortgage rate minus average yield on new issues of Aaa utility bonds.
n.a. - Not available.
SECONDARY HOME MORTGAGE MARKET ACTIVITY
FNMA auctions of forward purchase commitments Yields on GNMAConventional Govt.-underwritten guaranteed
Yield Yield mortgage backedAmount to 1/ Amount to 1/ securities for
($ millions) FNMA- ($ millions) FNMA- immediateOffered Accepted Offered Accepted delivery 2/
1976--High 171 127 9.31 634 321 9.20 8.44
Low 33 23 8.99 58 32 8.63 7.62
Nov. 1 142 112 9.00 215 73 8.67 8.028 8.02
15 141 127 9.00 219 114 8.68 8.0222 7.8429 71 58 8.99 60 34 8.63- 7.75
Dec. 6 7.6213 80 68 8.89 36 23 8.51 7.60
1/ Average gross yields before deducting fee of 38 basis points for mortgage servicing.Data reflect the average accepted bid yield for home mortgages, assuming a prepaymentperiod of 12 years for 30-year loans, without special adjustment for FNMA commitmentfees and FNMA stock purchase and holding requirements on 4-month commitments.Mortgage amounts offered by bidders related to total bids received.
2/ Average net yields to investors assuming prepayment in 12 years on pools of 30-yearFHA/VA mortgages carrying the prevailing ceiling rate on such loans.

III - 19
CONSUMER INSTALMENT CREDIT
1/1976-
1974 1975 QII QIII Sept. Oct.
Total
Change in outstandings$ Billions 9.0 6.8 16.9 16.7 17.8 18.8Per cent 6.1 4.4 10.5 10.0 10.4 10.9
Bank share (%) 44.4 41.7 40.1 43.8 47.1 42.9Extensions
$ Billions 160.0 163.5 182.5 186.8 189.3 192.7Bank share (%) 45.4 47.2 47.2 47.9 47.8 47.4
Liquidations ($ billions) 151.1 156.6 165.6 170.1 171.5 173.9
Automobile Credit
Change in outstandings$ Billions 0.3 2.6 7.6 7.1 7.3 6.3Per cent 0.7 5.2 14.2 12.6 10.3 8.9
Extensions
$ Billions 43.2 48.1 54.6 55.8 57.2 55.0New-car loans over 36 mos.
as % of total new-car loans
Commercial banks 2/ 8.8 14.0 22.4 28.5Finance companies 8.6 23.5 32.3 36.2 36.8 36.8
New-car finance rate (APR)Commercial banks
(36 mo. loans) 10.97 11.36 11.03 11.07 11.07 11.04
Finance companies 12.61 13.11 13.15 13.18 13.21 13.20
1/ Quarterly and monthly dollar figures and related percentage changes are SAAR.Series was begun in May 1974, with data reported
Figure for 1974 is average of May, August, and November.
for the mid-month of each quarter.

U.S. International Transactions(In millions of dollars, seasonally adjusted 1/) December 15, 1976
IV - T - 1
Merchandise exportsMerchandise importsTrade Balance
Bank-reported private capital flowsClaims on foreigners (increase -)Long-termShort-term(of which on commercial banks in
offshore centers 2/)
Liabilities to foreigners (increase +)Long-termShort-term
to commercial banks abroad(of which to commercial banks inoffshore centers 3/)
to other private foreignersto int'l and regional organizations
Foreign private net purchases (+) ofU.S. Treasury securities
Other private securities transactions (net)Foreign net purchases (+) of U.S. corp.
securities(of which stocks)
U.S. net purchases (-) of foreign securities(new foreign issues on bonds and notes)
Change in foreign official assets in the U.S.OPEC countries (increase +)
(of which U.S. corporate stocks)Other countries (increase +)
26. Change in U.S. reserve assets (increase -)
27. Other transactions and statistical discrepancy(net payments (-))Other current account items
Military transactions, net 4/
Receipt of income on U.S. assets abroadPayment of income on foreign assets in U.S.
Other services, net
Remittances and pensionsU.S. Gov't grants 4/
Other capital account itemsU.S. Gov't capital, net claims 4/ (increase
U.S. direct investment abroad (increase -)Foreign direct investment in U.S. (increaseNonbank-reported capital, net claims
(increase -)
40. Statistical discrepancy
1975 1 976YEAR Q1 Q 2 Q3 Sept. Oct.
107,088 26,836 28,450 29,711 9,875 9,76798,058 28,510 29,735 32,612 10,986 10,622
9.030 -1,674 -1.285 -2.901 -1.111 -855
-12.840 -2,960 -1.246 -1.621 -739 1,734-13,487 -3,637 -4,764 -3,339 -2,562 -687-2,373 -291 -385 -989 -245 -144-11,114 -3,346 -4,379 -2,350 -2,317 -543
(-7,212) (-3,603) (-2,393) (-2,258)(-2,129) (279)
647 677 3,518 1,718 1,823 2,421-300 -91 -25 66 -21 167947 768 3,543 1,652 1,844 2,254
-666 1,077 2,220 1,941 1,752 2,445
(1,798) (-227) (1,205) (299) (455) (3,137)1,549 155 468 905 331 -138
64 -464 855 -1,194 -239 -53
2.667 430 -592 3.021 827 19
-3.701 -1,538 -1.264 -2.739 -499 -488
2,505 989 185 67 -45 -151(3,054) (945) (189) (-45) (-56) (-225)-6,206 -2,527 -1,449 -2,806 -454 -337(-7,260) (-2,853) (-1,622) (-3,074) (-489) (-402)
5.211 2.329 3.314 1.272 -593 8065,940 2,230 2,737 1,228 -501 444(1,643) (555) 591 (374) (65) (130)-729 99 577 44 -92 362
-607 -773 -1.578 -408 -324 -81
240 4,186 2,651 3,376 2,439 -1.1352,667-883
18,219-12,212
2,163-1,727-2,893
-6,952-1,731-6,307
2,437
-1,351
4,525
1,614-5
5,495-3,216
458-483-635
-2,414798
-1,757-728
-727
4,986
1,987-13
5,462-3,305
715-441-431
-282-234
463547
-1,058
946
M IO:41. Current account balance 11,697 -60 702 n.a. n.a. n.a.42. Official settlements balance -4,604 -1,556 -1,736 -864 917 -725
43. 0/S bal. excluding OPEC 1,336 674 1,001 364 416 -281
NOTES :1/ Only trade and services, U.S. Govt. grants and U.S. Govt. capital are seasonally adjusted.2/ Offshore centers are United Kingdom, Bahamas, Panama and Other Latin America (mainly Cayman Islands and
ermud).epresents mainly liabilities of U.S. Banks to their foreign branches in offshore centers which are thenited Kingdom, Bahamas, Panama and Other Latin America (mainly Cayman Islands and Bermuda).
4/ Excludes prepayments for military purchases.

INTERNATIONAL DEVELOPMENTS
Foreign exchange markets. Since the second week of November,
the weighted average exchange value of the dollar has declined by 1/2
per cent.
. The currencies which have shown the
largest movement relative to the dollar during the recent period have
been the pound and Canadian dollar.
Strong selling pressure on the Canadian dollar was triggered
by the November 15 election victory of the French Seperatists in Quebec.
The political uncertainty generated by the Quebec situation added to concerns
that Canadian inflation rates would continue to exceed those in the United
States and that the very high levels of Canadian foreign borrowings might
prove unsustainable, and touched off very heavy selling pressure on the
Canadian currency. The Canadian dollar depreciated from U.S. $1.02 to
a low of U.S. $0.96 on November 30 as trading volume hit record levels.
The Canadian dollar has since recovered partially to U.S. $0.98.
The British pound has appreciated by over 3 per cent during the
past month, rising at one point to nearly $1.70.
. Sterling's recent exchange market movements have been most
heavily influenced by rumors concerning the continuing negotiations between

IV - 2
the British government and the IMF over a $3.9 billion loan to the United
Kingdom. The pound's recent rise reflects the apparently successful con-
clusion of these negotiations, as well as reports that some form of additional
assistance may be provided the British to deal with sterling balances.
On November 18 U.K. authorities tightened exchange controls by prohibiting
U.K. banks from making sterling loans to finance third country trade.
The foreign currency purchase tax and other Italian foreign exchange control
measures have helped reduce exchange market supply of lira. An amnesty
on repatriations of Italian foreign investments, held in violation of
Italian exchange control measures, is estimated to have resulted in capital
inflows into Italy in excess of $1 billion. Despite the lira's recent
strength, pessimism over the future exchange value of the lira is reflected
in the continued substantial discounts on lira for future delivery. The
price of lira for delivery in one year, for example, is nearly 17 per cent
below the price for immediate delivery.
The currencies of the European joint float have changed little
against the dollar over the past month. The mark has remained at the bottom

IV - 3
of the snake, occasionally touching its lower intervention limit against
the Danish krone.
. The System purchased small amounts of marks, Swiss
francs and French francs in the market over the past month, and purchased
larger amounts of Swiss francs directly from the Swiss National Bank.
These purchases enabled the System to make repayments totaling $73 million
equivalent on its Swiss franc swap debt, reducing the total of such debt
outstanding to $1,074 million.
After Mexican authorities abandoned their long-standing 8 cent
parity for the peso on September 1, they attempted to stabilize the peso's
exchange rate, first at about 5 cents and later at just above 4 cents.
. On November 19 rumors of imminent exchange controls
and political uncertainty generated by the impending installation of a
new Mexican President, brought the flight out of pesos into dollars to a
new peak, and Mexican banks began rationing their supply of dollars or
ceased selling dollars entirely. On November 22 the Bank of Mexico
announced that
banks would be prohibited from foreign exchange trading, with this activity
transferred to stockbrokers. The peso immediately fell to about 3.6 cents
with trading characterized by sharp rate movements and wide bid-ask spreads.

IV - 4
Since November 22, the peso has firmed to around 5 cents, a level
38 per cent below its old 8 cent parity.
On November 28, the Australian dollar was devalued relative to
the U.S. dollar by 17-1/2 per cent. New Zealand followed the next day
with a 7 per cent devaluation of its currency. Subsequently, the Australians
have announced two small revaluations, of 2 per cent and 1-1/4 per cent,
in accordance with their new policy of smaller, more frequent exchange
rate adjustments.
The gold price has moved over a range of $128 to $138 during
the past four weeks, with the current $135 level unchanged from that of
a month ago. On December 8 the IMF held its fifth gold auction, selling
780,000 ounces at a common price of $137.00. The next IMF auction, also
of 780,000 ounces, will be held on January 26. Beginning in March, auctions
of 525,000 ounces each will be held by the Fund on the first Wednesday of

IV -5
each month. In the first half of January, the IMF expects to initiate the
restitution of 6.25 million ounces of gold to its members in proportion
to their quotas. This is the first of four annual restitutions which will
total 25 million ounces.
International capital markets. Total borrowing in the markets
for medium-term Euro-credits, Euro-bonds, and foreign bonds has continued
at a high level. Borrowing in the four months July-October 1976 totalled
$18 billion, which at an annual rate was about 10 per cent less than in
the first half of this year; seasonal factors explain much of this slowing.
Newly-arranged Euro-credits increased sharply in these four months relative
to the rate in the first half of the year, as borrowers in industrial and
oil-exporting countries as well as in non-oil developing countries stepped
up their rate of borrowing. New Euro-bond issues were well-maintained in
the July-October period, but foreign bond issues in national markets slowed
perceptibly mainly because of reduced Canadian flotations in the U.S. market.
Interest rates have eased significantly in all these markets since mid-
year, reflecting generally soft demand for credit in the national markets
of the industrial countries.
Publicized medium-term Euro-credits arranged in July-October
amounted to $9.7 billion, almost 20 per cent above the rate in the first
half of 1976. Loans to industrial countries of $4.0 billion in fact exceeded
the first-half total by a considerable margin. Spain raised $1.2 billion,
of which $1 billion was obtained by the Spanish Government in July; British
public sector borrowers, who had been out of the market for some time until

IV 6
Borrowing in International Capital Markets(in billions of dollars)
1975Year 1st H 2nd H
19761st H Q-3 Oct.
I. Medium-term Euro-credits:total l/
Industrial countriesDenmarkFranceSpainUnited KingdomOther
Oil-exporting countriesAlgeriaIndonesiaIranVenezuelaOther
Other developing countriesArgentinaBrazilMexicoPhilippinesOther
Socialist countries andorg.'s
Int'l org.'s & other
28.5 20.6 8.5 12.0
19.0.4
3.31.15.73.5
.80.4.1.1.2
7.2.5
1.61.5.92.7
6.4.3.5
1.0.6
4.0
3.2.5
1.6.3.2.6
7.9*/12.12.2.33.3
2.80.4.5.3
1.6
1.4.1
1.10.20
2.6.7.7.7.1
1.1
3.6.3.1.6.4
2.2
1.8.4.0.20.6
5.3*/1.41.5.12.3
1.1 2.7 1.1 1.6
.4 .4 .3 .1
12.3
3.6.4.7.3
1.01.2
1.7.4.3.70.3
4.7.1
1.2.7.7
2.0
4.7 5.0
2.5 1.50 0.1 0
1.1 .1.3 .6
1.0 .8
.4 1.1
.1 0*/ 0.2 .10 0.1 1.0
1.6 2.0.1 .5.7 */.4 .9.1 .1.3 .5
.2 .3
II. Euro-bonds: totalBy borrower: Canada
FranceJapanOther
By currency:ZU.S. dollarGerman markOther
4.5.4.3.2
3.53.1.6.8
(continued on next page)
1974Year
.9 *l
10.21.21.31.26.54.82.92.5
5.6.3.8.6
3.92.02.31.3
4.6.9.5.6
2.52.9.6
1.2
8.41.9.8.7
5.05.31.71.7
3.1.6.3.31.92.4.5.2
1.0.2.1.1
.6.6
.3
.1

IV - 7
III. Foreign Bonds: total 7.8 11.9 5.1 569 9.6 3.4 0.9By borrower: Canada 2.0 3.4 1.3 2i0 3.4 1.1 0.3
IBRD 3.1 2.4 .6 1.7 1.6 0.5 0Other 2.7 6.1 3.2 3.2 4.6 1.8 0.6
By market:.' U.S.-/ 3.6 5.8 2.7 3.8 5.4 2.0 0.4Switzerland 1.0 3.4 1.4 2.0 2.6 1.1 0.4Other 3.2 1.0 .8 .9 1.6 .4 .1
IV. Total Borrowing (I+II+III) 40.8 42.7 19.2 23.5 30.3 11.2 6.9
1/ Publicized credits of over one-year maturity.2/ Breakdowns may not add to totals because of lack of comprehensive revised
data.3/ Figures differ from those from U.S. sources.*/ Less than $50 million.Source: World Bank.
last May, raised credits of $300 million in July (National Water Council)
and $500 million in October (Electricity Council). The smaller industrial
countries also stepped up their rate of borrowing, particularly Ireland
($400 million) and Greece ($308 million). The Government of Denmark, an
active borrower in the first half, did not arrange Euro-currency credits
in the period under review but subsequently arranged a $400 million credit
in early December to replenish its external reserves.
The $1.5 billion raised by oil-exporting countries nearly equalled
their first-half total; Venezuela, which had not borrowed in this market
since early 1975, arranged a $1 billion loan in October to pay off short-
term debts.
The non-oil developing countries arranged $4.1 billion of medium-
term Euro-credits in July-October, which was a higher rate than in the
first half. (Some part of the new loans was to meet maturing debt.)
Loans to Argentina and Mexico were particularly large. In October Argentina

IV - 8
effectively completed negotiations with U.S. banks for a $500 million loan
(although the agreement has not yet been formally signed). This is part
of a $1.3 billion package that Argentina is negotiating to stretch out
maturities on its external debt and that will include loans from European,
Canadian and Japanese banks and a $300 million IMF drawing. Credits arranged
by Mexico in July-October of $1.3 billion were nearly double the first-
half amount and included an $800 million loan to the Mexican Government
from a syndicate of U.S., Canadian, and European banks for which funds
were fully committed in October although formal signing did not occur until
mid-November. One-half of this loan was for five years and one-half for
seven years. Brazilian borrowing continued to be heavy in the third quarter.
Brazil is currently negotiating two loans from European banks totalling
$920 million, but part of this package may be in domestic currencies.
Socialist countries and organizations arranged $540 million
of new Euro-credits in July-October, principally for Hungary, Czechoslovakia,
and Bulgaria; this amount was at a lower rate than borrowing by this group
in 1975 and the first half of 1976. In December new credits were negotiated
by Hungary and Poland for about $350 million.
Since June the volume of Euro-credits arranged has been encouraged
by declining lending rates. 3-month deposit rates are now about 5 per cent
compared with a 5.7 per cent average for the first half of this year.
Spreads over deposit rates on Euro-dollar loans have also tended to narrow
slightly in recent months.

IV - 9
New issues of Euro-bonds of $4.1 billion in the period under review
were at about a 25 per cent slower rate than in the first half of the year,
mainly because of seasonal factors. Flotations by Canadian borrowers,
however, declined more than did total issues. Australian recourse to the
Euro-bond market increased sharply when the Government floated a $300 million
issue in September in three tranches of 7-, 10-, and 15-year maturities.
The average final maturity of new issues in July-October was 7.26 years,
slightly below the second quarter when maturities began to lengthen but
still well above the 6.91 years of the first quarter. Yields in the secondary
market eased after mid-year; yields on dollar bonds of U.S. compares at the
end of October were down about 40 basis points from the first-half average.
Foreign bond issues, totalling $4.3 billion, were down one-third
from their first-half rate, a decline apparently more than seasonal. Canadian
and World Bank issues declined more than those of other borrowers.

IV - 10
U.S. International Transactions. Major developments in the
U..S international accounts in October were the continuation of a large
trade deficit, and the emergence of a net inflow of funds on bank-reported
private capital transactions.
Nonagricultural exports declined slightly in each month from
August to October, following a period of substantial growth in the first
seven months of the year. The pattern of a strong growth in these
exports earlier in the year, followed by a slowdown more recently, was
wide-spread geographically. Shipments to most industrial countries
leveled off and in some cases declined slightly, while shipments to non-
oil developing countries dropped more noticeably.
The recent decline was more pronounced in volume terms, as
nonagricultural export prices, which had been flat earlier in the year,
rose 3.3 per cent during the three months ending in October. The
largest volume declines were in machinery and automotive products.
The slowdown in auto exports and in exports to Canada, which receives
most of our automotive exports, was largely a result of the UAW strike
against Ford Motor Company in September-October. These exports had
increased in earlier months in anticipation of the strike. More broadly,
the recent movements in U.S. exports reflect the pattern of growth in
activity abroad, which has slackened noticeably in recent months,
following a surge in the early stages of the upturn.

IV - 11
Looking to the near future, available indicators give
conflicting signals. While recent movements in export shipments and
foreign activity suggest weakness and the currency depreciations in
Canada and Mexico are likely to reduce exports, export orders for
durable goods, especially for machinery, are up strongly. In July-
October, new orders for machinery (which account for 35 per cent of
nonagricultural exports) were 25 per cent above the second quarter in
constant dollars and 34 per cent above the first quarter.
Agricultural exports have increased steadily throughout the
year, with a particularly large rise in October, reaching a record level
of $28.4 billion (seasonally adjusted annual rate). Mcst of the increase
has been in volume, as prices have remained fairly stable in 1976, The
sharp rise in October resulted from a large increase in the volume of
corn exports to Europe, particularly to those areas that had been
severely affected by the drought earlier this year. Weekly data on
shipments for November suggest that agricultural exports will be down
from the October peak.
Nonfuel imports in October declined slightly from September
levels. After increasing steadily through July, the volume of nonfuel
imports has eased in recent months with the slowdown in the growth
of U.S. economic activity. This pattern held across most import
categories except capital goods and automotive products. Capital goods
imports have continued to increase, in line with the moderate but

IV - 12
steady growth in domestic business fixed investment expenditures,
while automotive products have dropped off much more sharply than
other imports in recent months. Most of the drop in automotive
imports (largely from Canada) is related to the Ford strike.
Automotive imports from other areas have been fairly steady on balance
U.S. Merchandise Trade. International Accounts Basis(billions of dollars, seasonally adjusted annual rates)
1975
Year
EXPORTS 107.1Agric. 22.2Nonagric. 84.8
IMPORTS 98.1Fuels 28.5Nonfuels 69.5
BALANCE +9.0
1976
1Q
1107.321.386.1
114.031.882.3
-6.7
2Q
113.823.590.3
118.936.582.5
-5.1
3Qr
118.825,393.6
130.439.990.6
-11.6
July
119.425.494.0
132.340.292.1
'-12.9
Aug.
118.625.3
93.3
127.240.287.0
-8.6
Sept.r
118.525.293.3
131.838,793.1
-13.3
Oct.
117.228.488.8
127.536.491.1
-10.3
NOTE: Details may
1975
Year
NONAGRIC. ExportsPrice 144.1Volume 110.1
NONFUEL ImportsPrice 140.9Volume 80.2 1
not add to totals because of rounding.
Index Numbers 1973=100
1976
LQI
150.3 152.4 153.91107.0 110.8 113.61
138.696.6
July
152.4115.4
I
141.7 144.11 143.494.7 102.21 104.6
A ug, Sept. Oct.
153.0 156.5 157.4114.0 111.6 105.5
143.9 145.1 145.198.3 104.3 102.1
1975 1 9 7 6I )
-- -- -- --

IV - 13
this year, with increases in shipments from Japan offsetting declines
in shipments from Europe. There has been a pickup in new foreign car
sales in recent months, which has been stimulated by improvements in
price and quality incentives relative to domestic competition. The
increase in sales has largely come out of inventories that were built
up earlier in the year.
The growth of fuel imports has eased off in the last few
months with the volume of oil imports dropping from a rate of about
8-1/2 million barrels per day during the summer months to still high
rates of 7-1/2 to 8 million barrles per day in September and October.
Fuel imports are likely to remain at these rates through the end of
the year as stockpiling continues in anticipation of an OPEC price
increase. The average price of imported oil has inched up throughout
the year and in October was $12.25 per barrel.
Bank-reported capital transactions showed a large net inflow
of funds in October, following a smaller net outflow in September (revised
from the net inflow reported last month). The increase in bank-
reported claims fell off from the rates of earlier months, and bank-
reported liabilities to private foreigners rose more strongly. After
adjusting for the understatement of outstanding claims due to over-the-
weekend arbitrage between the Federal Funds and Eurodollar markets,
the net inflow of funds in October may have been on the order of $250 to $750
million. The inflow represents, in part, U.S. banks' substitution
IV - 14
of near term Euro-dollar funds raised by their overseas branches
for maturing certificates of deposit. These Euro-dollar funds are of
less than 30 days maturity -- a range where U.S. head offices are unable
to compete directly because of the prohibition on interest payments.
New issues of foreign bonds in the United States were down
slightly in October, but are expected to be about $2.5 billion in the
fourth quarter, a rate equal to that of the first three quarters. The
relative yield on Canadian issues has responded adversely to the political
situation in Quebec. However, there has been only a slight drop-off in
Canadian issues in the United States during the fourth quarter. Another
development related to foreign long -term issues in the United States
is that Venezuela, the first OPEC member to enter the U.S. market in
recent years, plans to float a five year $75 million public issue in
the first quarter of 1977.
Foreign official assets in the United States increased by
$800 million in October. Holdings of OPEC official agencies accounted
for more than half of the increase, and an increase in liabilities to
Italy accounted for most of the remainder.

IV - 15 -
Fiscal Policy in Foreign Industrial Countries. Until recently,
the stance of fiscal policy in the major foreign industrial countries has
been directed towards reducing the stimulus provided during the 1974-75 re-
cession. In Japan and Germany, these efforts have been relaxed somewhat,
in response to the pause in economic activity, and may soon be reversed.
In Italy and the United Kingdom, the move towards reduction in fiscal stim-
ulus has become more pronounced, due to unusually high rates of inflation
and associated pressures on exchange rates. Canada and France show few
signs of changes in fiscal posture in either of these directions.
Policy makers are faced with a set of circumstances that gives
no clear indication of the appropriate fiscal stance. The most recently
available data point to a continuation of the pause in the recovery, at
levels of activity and employment that are well below potential. This
suggests that a move towards fiscal stimulus might be in order. However,
changes in labor force characteristics and in the productivity of the
capital stock (resulting from higher oil prices, environmental considera-
tions, changes in the composition of demand, etc.) hamper calculations of
the gap between potential and actual GNP, and therefore, of the proper fis-
cal action.
At the same time, rates of increase in prices in 1977 are ex-
pected to remain between six and ten per cent -- somewhat lower in Germany,
higher in the United Kingdom and Italy -- representing at best gradual
improvement over 1976. Thus, there is considerable caution in all countries
about renewing inflationary pressures and expectations. In addition, sev-
eral countries must cope with adverse current-account and exchange-rate

IV - 16 -
developments, suggesting a more restrictive policy stance.
Finally, public budget deficits -- even measured in relation to
GNP -- generally remain high compared with the years prior to 1975. Prob-
lems of financing these deficits, and the adverse effects of the size of
these deficits per se on confidence and expectations, suggest to some
policy makers that a fiscal stimulus which would increase these deficits
in the short run might be ineffective.
In 1975 the combined effects of the reaction of automatic stabil-
izers to declines in real GNP, discretionary fiscal measures, and high rates
of inflation resulted in huge increases in central government budget
deficits measured in current prices. Measuring the deficits in 1974 prices
gives some idea of the contribution of inflation in magnifying the differ-
ence between nominal expenditures and nominal revenues (Table I). In 1976
projected budget deficits remain in the area of the 1975 absolute levels,
except in France, where a large decline is expected. In terms of the ratio
to GNP, there has not been much change except for France and Italy. For
those countries where 1977 estimates are available, the size of the deficits
are expected to decline somewhat in realterms, and in relation to GNP.
There has been considerable variability in the extent to which
central government borrowing requirements have been financed by central
banks and the private banking system. The proportion financed by the
central bank has been highest in Italy (60 per cent in 1975, 80 per cent so
far in 1976), and was also important in both France and Japan in 1975 (over
40 per cent), with private banks accounting for somewhat smaller shares.
In 1976 the pattern is much the same in Japan, while in France the shares

IV - 17 -
Table ICentral Government Budget Deficits
(Current Prices 1/, Constant Prices 2/, and as aPercentage of GNP)
1974 1975 1976 1977 3
Canada/Current Prices 1.2 4.1 5.0 n.a.Constant Prices 1.2 3.7 4.1 n.a.Deficit/GNP 0.8 2.5 2.7 n.a.
Japan4/Current Prices 2864 6251 7600 8100Constant Prices 2864 5836 6684 6672Deficit/GNP 2.2 4.3 4.7 4.4
FranceCurrent Prices -4.3 39 23 10Constant Prices -4.3 34.2 17.6 7.4Deficit/GNP -0.3 2.7 1.3 0.5
GermanyCurrent Price 10.3 35 34.3 28.2Constant Prices 10.3 32.3 30.7 24.2Deficit/GNP 1.0 3.4 3.0 2.3
ItalyCurrent Prices 8962 16500 14000 13900Constant Prices 8962 14077 10200 8500Deficit/GNP 9.0 14.7 10.3 8.6
United Kingdom-4/Current Prices 5.1 8.8 10.4 n.a.Constant Prices 5.1 6.9 7.2 n.a.Deficit/GNP 6.3 8.7 9.8 n.a.
1/ Billions of local currency2/ Billions of local currency, 1974 prices.3 Forecast.
4/ Fiscal year beginning in April of year cited.

IV - 18 -
of both the central and private banks have declined sharply. Non-bank
domestic sources have accounted for much of the borrowing requirement in
Canada and the United Kingdom in 1975 (70 and 60 per cent respectively)
and again in 1976. Private banks have met most of the financing require-
ment in Germany, where "overborrowing" in late 1975 substantially eased the
problem of financing this year's deficit, and allayed fears that crowding
out would occur in 1976.
To provide an indication of the changes in fiscal stimulus asso-
ciated with the budget deficits since 1975, Table II gives percentage
changes in central government expenditures and revenues, and in actual and
potential GNP, all measured in current prices. One measure of changes in
the impact of the budget on GNP is based on the concept of the cyclically
neutral budget -- one in which expenditures grow at the same rate as
potential GNP, while revenues maintain a fixed relationship to actual GNP,
so that the budget balance (in relation to GNP) moves counter-cyclically.
Changes in the ratio of expenditures to potential GNP or revenues to actual
GNP would then represent further stimulus or restrictiveness, according to
the directions of the movements. Where the movements are in the same
direction (e.g., expenditures increasing more than potential GNP and
revenues increasing more than actual GNP), the magnitude of the changes,
and a weighting scheme, are necessary to determine the net stimulus.
By these criteria, it is evident that fiscal policy in 1975
provided a substantial stimulus compared with 1974 in Canada, Japan, France,
Germany, and Italy. In the United Kingdom, proportionate changes in expend-
itures and revenues were close to those of potential and actual GNP

IV - 19 -
Table IIAnnual Percentage Changes in Expenditures, Revenues,
Actual and Potential GNP 1/
1975/74 1976/75
Canada :
(4.0, 5.4)
Japan3 :
(6.0, 7.4)
France:
(4.0, 5.4)
Germany:
(4.0, 4.4)
Italy:
(3.5, 4.7)
United Kingdom3/
(2.0, 2.7)
ExpendituresRevenueActual GNPPotential GNP
ExpendituresRevenueActual GNPPotential GNP
ExpendituresRevenueActual GNPPotential GNP
ExpendituresRevenueActual GNPPotential GNP
ExpendituresRevenueActual GNPPotential GNP
: ExpendituresRevenueActual GNPPotential GNP
18.66.2
11.515.2
9.0-10.2
9.513.5
22.0-1.210.618.6
19.41.04.612.6
44.029.513.221.6
30;022;924.830.0
13.415.415.014.2
18.116.712,712.6
9;026.615.514.1
5.78.09.17.6
23;033.021;220.5
17.717.515.016.0
1976/74
34.522.628.2
31.6
28.74.823.427.8
33.025.027.7
35.2
26.29.1
14.120.9
77.172.137;146.5
53;044.443.551.6
1977'
n.a.n.a.
15.820.01.8
13.2
6.88.813;012.8
5.411;2908.2
18;019;519;324.2
n.;a
n.a.
1 Numbers in parentheses give assumed growth rates of potential GNPreal) and trend growth rates for 1963-4 to 1973-4, respectively.SForecasts and preliminary budget data.SFiscal year, beginning in April of year cited.

IV - 20 -
respectively, but on balance the stimulus in 1975 was a bit greater than
in 1974. in 1976 budgetary stances tended to be more neutral or contrac-
tionary than in 1975 in the sense that expenditures rose about as much as,
or less than, potential GNP while revenues generally increased about as
fast, or faster than actual GNP. The single clear exception is Japan,
where the changes in potential and actual GNP were about the same, expend-
itures rose more than revenues, and both rose more than GNP, imparting
further stimulus to the economy. The direction of change in the United
Kingdom is difficult to identify, since expenditures and revenues in-
creased more than potential and actual GNP (respectively), by broadly
similar magnitudes.
While 1976 budgetary stances generally reduced the fiscal stim-
ulus provided during 1975, changes in expenditures and revenues for the
1975-76 period as a whole indicate an overall expansionary stance in Canada,
Germany, and Japan. In the United Kingdom and France, the pattern of in-
crease in expenditures and revenues was on balance roughly neutral. In
Italy, large increases in revenues and expenditures relative to both
potential and actual GNP make it difficult to characterize fiscal policy.
Budgets for 1977 are currently under debate in Germany, France,
and Italy (where the fiscal years begin in January) and are still in the
planning stages in the United Kingdom, Canada, and Japan (where the fiscal
years begin on April 1). Preliminary budget forecasts indicate generally
reduced stimulus, with expenditures in most cases rising less than poten-
tial GNP, and revenues rising in relation to actual GNP. Partially in re-
sponse to the urging of international creditors, recently announced fiscal

IV - 21 -
policy measures of a discretionary nature in the United Kingdom and Italy
are restrictive, reflecting the need to bring rates of inflation down to-
wards those of other major industrial countries and thereby restore some
stability to exchange rates. In Germany and Japan, the prolonged pause in
economic activity has prompted consideration of expansionary measures.
In the United Kingdom attention has focused on the public sector
borrowing requirement (PSBR), which amounted to £10.6 billion (about $22.5
billion or 10 per cent of GDP) in the fiscal year ending in March 1976.
According to recent forecasts, the PSBR is expected to be slightly higher
(about £11 billion) in the current fiscal year, an improvement, however,
of nearly £1 billion compared with the original budget estimate. In July,
the U.K. government announced plans to cut public sector spending in 1977-78
by £1 billion and increase revenues by about £900 million through an in-
crease in employers' social security contributions. Further measures in
conjunction with the IMF negotiations are scheduled to be announced on
December 15 (evening). (A summary of these measures will appear in the
Greenbook Supplement.)
In Italy a series of measures was announced in October and Novem-
ber that would increase revenues by some 5 trillion lira (nearly $6 billion).
Prior to these measures, the 1977 deficit had been forecast at nearly
14 trillion lira (8.6 per cent of forecast GNP), slightly higher than the
projected deficit for 1976. The measures include increased excise taxes,
indirect taxes and prices for public utilities (3 trillion lira); an accel-
eration of income tax payments so that part of the tax on 1977 incomes
will be paid in 1977 rather than 1978 (1.5 trillion lira) and increases in

IV - 22 -
public administrative charges (0.5 trillion lira). New estimates of the
1977 budget figures incorporating these steps have not yet been announced.
In France, a supplemental budget was announced in September 1976
that called for FF9.4 billion ($1.9 billion) of expenditures in the form
of transfer payments, but provided for tax increases that would match the
spending increases, so that the projected FF15 billion deficit remained
unchanged. A second supplemental budget introduced in November provided
for further spending of FF12.1 billion, and tax increases and spending cuts
totalling only FF4.1 billion, thereby increasing the deficit for this year
to FF23 billion, ($4.6 billion or 1.3 per cent of GNP) compared with FF39
billion last year. According to President d'Estaing, these measures
covered spending that had been agreed upon before the launching of the
counter-inflation program in September, rather than new measures for the
sake of stimulus. Programs announced in conjunction with the 1977 budget
call for steps to stimulate investment, a reduction in the value-added
tax, increases in corporate income taxes, and a shift in the income tax
burden from lower to higher income brackets. The proposed budget is in
balance, as were the proposed budgets for 1975 and 1976; supplementary
budgets announced over the course of the year may well alter the balance.
In Germany, the strong fiscal stimulus imparted to the economy
in 1975 has been partially reversed in the 1976 and proposed 1977 budgets
in an effort to reduce the central government deficit and alleviate the
effects of the deficit on confidence and expectations. The draft budget
incorporates tax increases expected to yield DM4.5 billion ($1.3 billion)
and provides for a relatively slow growth in public expenditure. Plans

IV - 23 -
for an increase in the basic VAT rate from 11 to 13 per cent have been
shelved until at least 1978. The recently released report of the German
Council of Economic Experts advocates a "medium term growth and stability
program" that would liberalize depreciation allowances, increase research
expenditures, lower interest rates for new and small firms, and increase
federal assistance to combat structural unemployment. The cost of the
program would be DM3 billion (0.3 per cent of GNP). An announcement of
possible policy initiatives is expected later this week.
In Japan a seven point stimulative program was announced on
November 12, providing for an acceleration of public works expenditures,
the revival of ¥400 billion ($1.3 billion) in railway and communications
fixed capital expenditures, loans for housing projects, accelerated invest-
ment of ¥800 billion ($2.7 billion) by the electric power industry, loans
to small enterprises, and measures to promote exports and employment.
Most observers expect the program to have only a moderate impact on the
economy, which has sharply slowed its rate of advance since the late
spring. A supplementary budget providing for further spending increases
is presently being compiled. If the economy continues to remain sluggish
in the coming months, it is expected that the government will reduce the
personal income tax burden, as it has done in each of the past four years.