Embed Size (px)
Citation preview

Prefatory Note
The attached document represents the most complete and accurate version available based on original copies culled from the files of the FOMC Secretariat at the Board of Governors of the Federal Reserve System. This electronic document was created through a comprehensive digitization process which included identifying the best-preserved paper copies, scanning those copies,1 and then making the scanned versions text-searchable.2 Though a stringent quality assurance process was employed, some imperfections may remain.
Please note that this document may contain occasional gaps in the text. These gaps are the result of a redaction process that removed information obtained on a confidential basis. All redacted passages are exempt from disclosure under applicable provisions of the Freedom of Information Act.
1 In some cases, original copies needed to be photocopied before being scanned into electronic format. All scanned images were deskewed (to remove the effects of printer- and scanner-introduced tilting) and lightly cleaned (to remove dark spots caused by staple holes, hole punches, and other blemishes caused after initial printing). 2 A two-step process was used. An advanced optimal character recognition computer program (OCR) first created electronic text from the document image. Where the OCR results were inconclusive, staff checked and corrected the text as necessary. Please note that the numbers and text in charts and tables were not reliably recognized by the OCR process and were not checked or corrected by staff.

CONFIDENTIAL (FR)
November 15, 1978
SUMMARY AND OUTLOOK
By the StaffBoard of Governors
of the Federal Reserve System

SUMMARY AND OUTLOOK

I -1
DOMESTIC NONFINANCIAL DEVELOPMENTS
Summary. Growth in economic activity appears to have been
well maintained so far this quarter. The increase in employment was
surprisingly strong in October, following a sluggish pace of hiring
in the preceding few months, and industrial production continued
upward. However, total retail sales edged down. While housing starts
remained strong in September, sales of new homes continued at the
reduced August rate. Business spending has been expanding, with
shipments of capital goods continuing to rise briskly, but according
to surveys these gains are expected to moderate sharply in 1979.
Incoming data indicate further upward pressure on food prices as
well as many nonfood prices.
In October, the unemployment rate declined 0.2 to 5.8 per
cent, but remained within the range of the previous six months.
Hiring increased substantially in durable-goods manufacturing, con-
tract construction and in services. The gains in employment, coupled
with a sizable increase in hourly earnings, suggest a substantial
rise in personal income in October after two months of slow growth.
Industrial production is estimated to have increased by 1/2 per cent
in October; part of the gain reflected a recovery of auto assemblies
and coal mining from the effects of railroad strikes. Gains in most
other sectors were generally more moderate than in preceding months.

I-2
Unit purchases of autos picked up in October, after a
slow start early in the new model year. Domestic car sales rose
from a 8.7 million unit annual rate in September to 9.2 million in
October--but this was still half a million annual rate below the
average of the previous six months. Sales of foreign cars continued
in the 2 million unit range. Retail sales other than autos reportedly
edged off in October to a level not much higher than the third quarter
average.
Business capital spending accelerated in August and September,
according to data on equipment shipments and construction put-in-place.
Moreover, advance spending commitments suggest that activity in this
sector will be well maintained during the next few months. New orders
for nondefense capital goods rose 3-1/2 per cent in September. The
machinery component of these goods, which had remained on a plateau
since February, increased sharply in September. Despite these favor-
able near-term indicators, private surveys of investment plans for
1979 indicate a marked deceleration in the growth of capital
spending next year.
Inventory outlays by manufacturers were moderate in September,
with a book value rise of $14 billion, annual rate, suggesting a con-
tinuation of cautious business attitudes. Wholesalers increased
their stocks at a $13 billion rate, but this followed several months
of relatively modest increases.

I-3
Housing starts continued strong in September, at an annual
rate of 2.1 million units. Single-family starts have edged down
somewhat from their highs in late 1977, but the rate of multifamily
starts has increased slightly. Financial constraints may be affecting
housing demand; in recent months, sales of new homes have declined
and inventories of unsold new single-family homes have moved somewhat
higher. The drop in sales has been concentrated in new units, but
transactions in existing homes remained at advanced levels.
Spending by State and local governments had moderated in
recent months. Employment this fall has been below the level reached
last spring, with the decline concentrated in education.
Consumer price increases accelerated to a 9 per cent annual
rate in September, as food prices jumped higher following two months
of little change. Further large increases in homeownership costs and
gasoline prices also contributed to the rapid climb in retail prices
in September. Producer prices of finished goods rose at an annual
rate of 10 per cent in October. Increases occurred at all stages of
processing and were especially large in the agricultural sector,
suggesting further upward pressures on retail food prices in coming
months. Nonfood finished goods prices rose at an annual rate of
7-1/2 per cent in October, similar to the rates of increase earlier
this year. Prices of nonfood crude and intermediate materials also
were up in October, with particularly large increases for construction
materials and nonferrous metals.
I-4
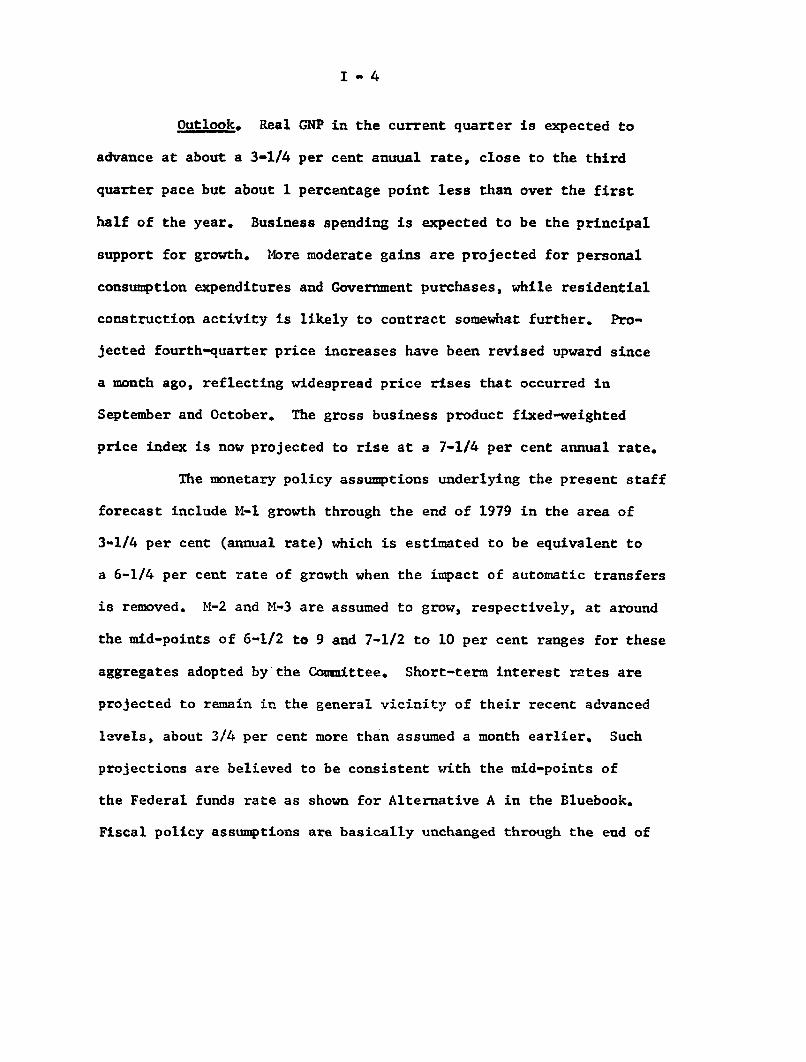
Outlook. Real GNP in the current quarter is expected to
advance at about a 3-1/4 per cent anuual rate, close to the third
quarter pace but about 1 percentage point less than over the first
half of the year. Business spending is expected to be the principal
support for growth. More moderate gains are projected for personal
consumption expenditures and Government purchases, while residential
construction activity is likely to contract somewhat further. Pro-
jected fourth-quarter price increases have been revised upward since
a month ago, reflecting widespread price rises that occurred in
September and October. The gross business product fixed-weighted
price index is now projected to rise at a 7-1/4 per cent annual rate.
The monetary policy assumptions underlying the present staff
forecast include M-1 growth through the end of 1979 in the area of
3-1/4 per cent (annual rate) which is estimated to be equivalent to
a 6-1/4 per cent rate of growth when the impact of automatic transfers
is removed. M-2 and M-3 are assumed to grow, respectively, at around
the mid-points of 6-1/2 to 9 and 7-1/2 to 10 per cent ranges for these
aggregates adopted by the Committee. Short-term interest rates are
projected to remain in the general vicinity of their recent advanced
levels, about 3/4 per cent more than assumed a month earlier. Such
projections are believed to be consistent with the mid-points of
the Federal funds rate as shown for Alternative A in the Bluebook.
Fiscal policy assumptions are basically unchanged through the end of

the current fiscal year. The staff estimate of Federal outlays in
FY 1979 remains at $491 billion, and total tax revenues are projected
at $452 billion.
Over the four quarters of 1979, projected growth of real
GNP has been trimmed back to just over 2 per cent, annual rate, about
1-1/4 percentage points below the estimate in the last Greenbook.
Real growth is expected to average about 2-3/4 per cent annual rate
in the first half of 1979, but then to slow to an 1-1/2 per cent
pace in the second half.
A substantial slowing of the growth of capital outlays by
the latter half of next year is suggested by the disappointing
surveys of capital spending plans, together with more stringent credit
conditions. Moreover, these factors are likely to produce a decelera-
tion of income gains which would tend to dampen economic growth in
other sectors. We now anticipate that real business fixed invest-
ment will rise about 2-1/4 per cent during 1979, about 2 percentage
points less than a month ago. Projected inventory investment has
also been cut back somewhat, in part because of the scaling down of
capital spending.
Housing starts in 1979 are now projected at around 1.7
million units, 100,000 less than a month ago. In the environment
of higher market rates of interest, this housing projection reflects
the influence of usury ceilings, increased interest payment burdens
for home buyers, and cautious attitudes by mortgage lenders.

I-6
With income flows damped, projected consumption growth has
also been reduced somewhat. The personal saving rate in the third
quarter was 5.1 per cent, well below historical averages; more cautious
spending attitudes by consumers are expected during 1979 and the
saving rate is projected to edge up by about 1/2 percentage point.
In line with the projection of a moderation of economic
expansion, employment growth is now estimated to slow to 1-1/2 per
cent during 1979, following a sharp increase of about 3-1/2 per cent
over this year. As a result, the unemployment rate is now expected
to rise to about 6-1/2 per cent by year end.
The staff's estimate of inflation during 1979 is, on balance,
little changed from last month. The fixed-weighted price index for
gross business product is projected to rise about 7-1/2 per cent
over the year, slightly less than in the previous projection. The
Administration's anti-inflation guidelines are assumed to exert some
moderating influence on prices and wages. However, this impact as
well as the effect of reduced aggregate demand is expected to be
largely offset by smaller projected growth of productivity, by a
larger assumed OPEC oil price increase next year, and by the continued
effects of the recent acceleration of price increases that has been
evident on a broad range of products.
Price increases are expected to be larger in the early
part of next year than in the second half. The recent widespread

I-7
price hikes at early stages of processing-both food and nonfood-
are expected to affect finished goods prices during the winter; the
OPEC price increase is now assumed to amount to 7-1/2 per cent,
effective January 1, compared to 5 per cent assumed previously; and
minimum wage and payroll tax increases may also contribute to a
bunching of price increases in the first part of 1979.
Detailed data for these projections are shown in the tables
that follow.

I - 8
STAFF GNP PROJECTIONS
Per cent changes, annual rateGross business
product Unemploymentfixed-weighted rate
Nominal GNP Real GNP price index (per cent)10/11/78 11/15/78 10/11/78 11/15/78 10/11/78 11/15/78 10/11/78 11/15/78
19751/1976L/1977!119781979
1978-11/1978-II1978-111/1978-IV
1979-I1979-111979-III1979-IV
Change:77-II78-II-77-IV to
78-IV78-11 to79-II
78-IV to79-IV
Memo:Growth Over78-111 to79-III
8.211.211.011.511.5
7.120.610.610.9
11.810.410.310.5
8.211.211.011.510.8
7.120.610.711.2
11.39.58.48.9
11.8 11.8
12.2 12.3
10.9 10.6
10.8 9.5
-1.35.74.93.83.7
-.18.73.13.3
4.13.33.32.7
-1.35.74.93.93.1
-.18.73.43.3
3.42.31.61.4
4.3 4.3 7.5 -1.2 -1.2
3.3 2.1
Annual Policy Period:
10.9 10.1 3.5 2.6
1/ Actual.
9.45.46.27.57.7
6.712.1
7.06.9
7.97.97.27.4
9.45.46.27.57.8
6.712.1
7.57.3
7.97.97.07.1
.1 .5
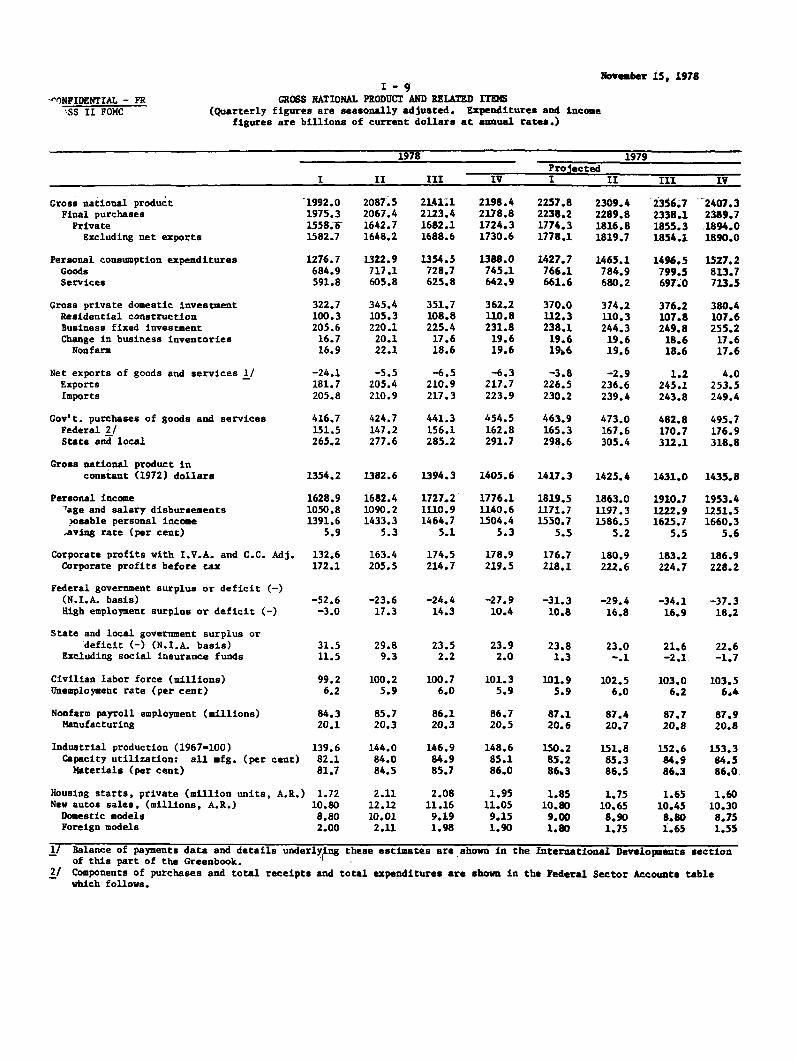
CONFIDENTIAL - FRCLASS II FOMC
November 15, 1978I-9
GROSS NATIONAL PRODUCT AND RELATED ITEMS(Quarterly figures are seasonally adjusted. Expenditures and income
figures are billions of current dollars at annual rates.)
1978 1979Projected
I II III IV I II III IV
Gross national productFinal purchases
PrivateExcluding net exports
Personal consumption expendituresGoodsServices
Gross private domestic investmentResidential constructionBusiness fixed investmentChange in business inventories
Nonfarm
Net exports of goods and services 1/ExportsImports
Gov't. purchases of goods and servicesFederal 2/State and local
Gross national product inconstant (1972) dollars
Personal incomeWage and salary disbursements
Dispsable personal incomeSaving rate (per cent)
Corporate profits with I.V.A. and C.C. Adj.Corporate profits before tax
Federal government surplus or deficit (-)(N.I.A. basis)High employment surplus or deficit (-)
State and local government surplus ordeficit (-) (N.I.A. basis)
Excluding social insurance funds
Civilian labor force (millions)Unemployment rate (per cent)
Nonfarm payroll employment (millions)Manufacturing
Industrial production (1967=100)Capacity utilization: all mfg. (per cent)
Materials (per cent)
Housing starts, private (million units, A.R.)New autos sales, (millions, A.R.)Domestic modelsForeign models
1992.01975.31558.61582.7
1276.7684.9591.8
322.7100.3205.6
16.716.9
-24.1181.7205.8
416.7151.5265.2
1354.2
1628.9L050.81391.6
5.9
132.6172.1
-52.6-3.0
2087.52067.41642.71648.2
1322.9717.1605.8
345.4105.3220.120.122.1
-5.5205.4210.9
424.7147.2277.6
1382.6
1682.41090.21433.3
5.3
163.4205.5
2141.12123.41682.11688.6
1354.5728.7625.8
351.7108.8225.4
17.618.6
-6.5210.9217.3
441.3156.1285.2
1394.3
1727.21110.91464.7
5.1
174.5214.7
2198.42178.81724.31730.6
1388.0745.1642.9
362.2110.8231.8
19.619.6
-6.3217.7223.9
454.5162.8291.7
1405.6
1776.11140.61504.4
5.3
178.9219.5
2257.82238.21774.31778.1
1427.7766.1661.6
370.0112.3238.1
19.61916
-3.8226.5230.2
463.9165.3298.6
1417.3
1819.51171.71550.7
5.5
176.7218.1
2309.42289.81816.81819.7
1465.1784.9680.2
374.2110.3244.319.619.6
-2.9236.6239.4
473.0167.6305.4
1425.4
1863.01197.31586.5
5.2
180.9222.6
2356.72338.11855.31854.1
1496.5799.5697.0
376.2107.8249.818.618.6
1.2245.1243.8
482.8170.7312.1
1431.0
1910.71222.91625.7
5.5
183.2224.7
-23.6 -24.4 -27.9 -31.3 -29.4 -34.1 -37.317.3 14.3 10.4 10.8 16.8 16.9 18.2
31.5 29.8 23.5 23.911.5 9.3 2.2 2.0
99.2 100.2 100.7 101.36.2 5.9 6.0 5.9
84.3 85.7 86.1 86.720.1 20.3 20.3 20.5
139.6 144.0 146.9 148.682.1 84.0 84.9 85.181.7 84.5 85.7 86.0
1.72 2.11 2.08 1.9510.80 12.12 11.16 11.058.80 10.01 9.19 9.152.00 2.11 1.98 1.90
23.81.3
101.95.9
87.120.6
150.285.286.3
1.8510.809.001.80
23.0-.1
102.56.0
87.420.7
151.885.386.5
1.7510.658.901.75
21.6-2.1.
103.06.2
87.720.8
152.684.986.3
1.6510.458.801.65
2407.32389.71894.01890.0
1527.2813.7713.5
380.4107.6255.2
17.617.6
4.0253.5249.4
495.7176.9318.8
1435.8
1953.41251.51660.3
5.6
186.9228.2
22.6-1.7
103.56.4
87.920.8
153.384.586.0
1.6010.308.751.55
1/ Balance of payments data and details underlying these estimates are shown in the International Developments sectionof this part of the Greenbook.
2/ Components of purchases and total receipts and total expenditures are shown in the Federal Sector Accounts tablewhich follows.

CONFIDENTIAL - FRCLASS II FOMC
I - 10PER CENT CHANGES IN GROSS NATIONAL PRODUCT
AND RELATED ITEMS(Annual rates compounded quarterly)
November 15, 1978
1978 1979Projected
I II III IV I II III IV
Constant (1972) dollars
Gross national productFinal purchasesPrivateExcluding net exports
Personal consumption expendituresGoodsServices
Gross private domestic investmentResidential structuresBusiness fixed investment
Gov't. purchases of goods and servicesFederalState and local
Disposable personal income
Current dollars
Gross national productFinal purchases
PrivateExcluding net exports
Personal consumption expendituresGoods
-. 1 8.7-1.6 8.6-1.1 11.0-1.0 7.7
-1.4 6.0-8.1 9.77.0 1.9
11.3 15.2-5.2 2.7
4.2 21.3
-3.5 -. 2-8.9 -15.3-.1 9.6
1.1 3.5
7.1 20.66.4 20.07.0 23.47.1 17.6
7.0 15.3.5 20.2
3.32.92.82.6
2.82.33.4
4.0-3.9
3.9
3.25.12.1
3.8
11.210.910.410.3
10.39.3
11.4
12.47.7
12.0
12.518.39.4
11.3
11.811.1
10.59.4
2.63.8
.88.27.3
7.67.3
Services 15.3 9.8
Gross private domestic investment 12.2 31.3Residential structures .5 21.0Business fixed investment 11.1 31.2
Gov't. purchases of goods and services 4.1 7.9Federal -2.0 -10.9State and local 7.8 19.9
Disposable personal income 9.8 12.5
Personal income 9.3 13.8Wage and salary disbursements 12.1 15.9
Corporate profits with IVA & C.C. Adj. -35.9 130.6Corporate profits before tax -13.2 103.3
Nonfarm payroll employment 3.8 6.9Manufacturing 5.7 3.1
Nonfarm business sectorOutput per hour -3.1 1.7Compensation per hour 12.2 8.2Unit labor costs 15.7 6.4
GNP implicit deflator 1/ 7.2 11.0Gross business product fixed-weighted price index 2/ 6.7 12.1
Industrial production .9 13.2
3.43.43.83.3
3.83.83.7
1.1-4.1
3.4
1.91.02.4
4.6
11.311.412.111.4
11.911.812.2
8.95.511.3
8.56.39.8
12.9
10.111.4
-4.8-2.6
1.82.7
1.712.310.4
7.67.9
2.32.32.42.1
3.22.63.7
-2.3-14.6
2.9
1.91.32.3
1.9
9.59.59.99.7
10.910.211.7
4.6-6.910.8
8.15.79.4
9.5
9.99.0
9.98.5
1.62.5
1.18.57.3
7.07.9
1.6-1.8r1.6-1.0
2.01.23.0
-4.6-16.31.7
2.43.22.0
3.4
8.48.78.77.8
8.97.7
10.3
2.2-8.89.3
8.57.69.1
10.3
10.78.8
5.23.9
1.31.0
.78.67.8
6.87.0
1.41.51.31.0
1.5.6
2.6
-2.4-8.9
1.3
2.12.41.9
1.8
8.99.18.68.0
8.57.39.8
4.5-.78.9
11.115.38.9
8.8
9.29.7
8.36.2
1.2.9
.68.57.9
7.47.1
4.7 4.5 4.1 2.3 1.8
1/ Excluding Federal pay increase rates of change are: 1978 QI, 7.2 per cent; 1978 QIV, 7.1 per cent; 1979 QI,7.6 per cent; 1979 QIV, 6.9 per cent.
2/ Using expenditures in 1972 as weights.

CONFIDENTIAL - FRCLASS II FOMC
I - 11GROSS NATIONAL PRODUCT AND RELATED ITEMS
(Expenditures and income figures are billions of current dollars.)
November 15, 1978
Gross national productFinal purchases
PrivateExcluding net exports
Personal consumption expendituresGoodsServices
Gross private domestic investmentResidential constructionBusiness fixed investmentChange in business inventoriesNonfarm
Net exports of goods and services 1/ExportsImports
Gov't. purchases of goods and servicesFederal 2/State and local
Gross national product inconstant (1972) dollars
Personal incomeWage and salary disbursements
Disposable personal incomeSaving rate (per cent)
Corporate profits with I.V.A. and C.C. Adj.Corporate profits before tax
Federal government surplus or deficit(N.I.A. basis)High employment surplus or deficit (-)
State and local government surplus ordeficit (-) (N.I.A. basis)
Excluding social insurance funds
Civilian labor force (millions)Unemployment rate (per cent)
Nonfarm payroll employment (millions)Manufacturing
Industrial production (1967=100)Capacity utilization: all manufacturing (per cent)Materials (per cent)
Housing starts, private (million units, A.R.)New auto sales, (millions, A.R.)
Domestic modelsForeign models
1972
1171.11161.7908.6911.9
733.0410.5322.4
188.362.0
116.89.48.8
-3.372.775.9
253.1102.1151.0
1171.1
942.5633.8801.3
6.2
92.196.2
Projected1978 1979
2104.8 2332.82086.2 2314,01651.9 1835.11662.5 1835.5
1335.5 1479.1718.1 791.0616.6 688.1
345.5 375.2106.3 109.5220.7 246.818.5 18 819.3 18.8
-10.6 -. 3203.9 240.4214.5 240.7
434.3 478.8154.4 170.1279.9 308.7
1973
1306.61288.61019.11012.0
809.9457.5352.3
220.066.1
136.017.914.7
7.1101.6
94.4
269.5102.2167.3
1235.0
1052.470k.3901.7
7.8
99.1115.8
1974
1412.91404.01101.31095.3
889.6498.3391.3
214.655.1
150.68.9
10.8
6.0137.9131.9
302.7111.1191.5
1217.8
1154.9764.6984.6
7.3
83.6126.9
-17.3 -6.7 -10.7 -70.6 -53.8 -48.1 -32.1 -33.0-5.9 -. 7 17.1 -19.4 -9.3 -4.6 9.8 15.7
13.75.6
86.55.6
73.719.2
119.783.188.0
2.3610.93
9.321.61
13.04.1
88.74.9-
76.820.2
129.887.592.4
2.0511.42
9.651.77
7.6-2.9
91.05.6
78.320.1
129.384.287.7
1.348.917.491.42
6.2-6.2
92.68.5
76.918.3
117.873.673.6
1.168.667.081.58
20.75.5
94.87.7
79.419.0
129.880.280.4
1.5410.128.631.50
29.611.5
97.47.0
82.319.6
137.182.481.9
1.9911.139.072.06
27.26.3
100.36.0
85.720.3
144.884.084.5
1.9611.28
9.292.00
22.7-. 7
102.76.1
87.520.7
152.085.086.3
1.7110.558.861.69
Developments section of this
Federal Sector Accounts table
1l Balance of payments data underlying these estimates are shown in the Internationalpart of the Greenbook.
2/ Components of purchases and total receipts and total expenditures are shown in thewhich follows.
1975
1528.81539.61201.21180.8
979.1541.5437.5
190.951.5
150.2-10.7-14.3
20.4147.3126.9
338.4123.1215.4
1202.3
1255.5805.9
1086.77.7
95.9120.4
1976
1700.11689.91330.41323.0
1090.2599.2491.0
243.068.2
164.610.212.2
7.4163.2155.7
359.5129.9229.6
1271.0
1380.9890.1
1184.45.7
127.0155.9
1977
1887.21871.61477.61488.7
1206.5657.4549.2
297.891.9
190.415.615.0
-11.1175.5186.6
394.0145.1248.9
1332.7
1529.0983.6
1303.05.1
144.2173.9
1427.4
1886.71210.81605.8
5.5
181.9223.4
1384.1
1703.61098.11448.5
5.4
162.4203.0
-~--

CONFIDENTIAL - FRCLASS II FOMC
I -12PER CENT CHANGES IN GROSS NATIONAL PRODUCT
AND RELATED ITEMS
November 15, 1978
Projected1972 1973 1974 1975 1976 1977 1978 1979
Constant (1972) dollars
Gross national productFinal purchasesPrivateExcluding net exports
Personal consumption expendituresGoodsServices
Gross private domestic investmentResidential structuresBusiness fixed investment
Gov't. purchases of goods and servicesFederalState and local
Disposable personal income
Current dollars
Gross national productFinal purchasesPrivateExcluding net exports
5.7 5.5 -1.4 -1.3 5.7 4.9 3.9 3.15.5 4.9 -.7 .2 4.3 4.7 3.7 3.26.7 6.3 -1.4 -.3 5.5 5.3 4.0 3.27.0 5.1 -2.3 -1.0 6.4 6.0 4.0 2.7
5.9 4.7 -.9 1.8 5.8 4.7 3.6 3.26.5 5.0 -3.4 .7 6.4 5.0 2.7 2.8
5.3 4.4 2.3 3.2 5.0 4.4 4.6 3.6
12.9 10.0 -11.4 -22.3 21.6 13.2 7.3 .218.8 -3.7 -24.6 -13.9 23.4 20.5 3.3 -7.28.1 12.2 -.3 -13.0 4.7 9.1 7.2 3.6
1.5 -.2 2.1 1.9-1.7 -5.4 -.8 .73.8 3.2 3.8 2.6
4.2 6.7 -1.5
10.1 11.6 8.19.9 10.9 8.9
10.3 12.2 8.111.0 11.0 8.2
.1 2.4 2.3 2.9.1 5.2 -. 8 3.4.1 .8 4.2 2.7
2.1 3.5 4.1 4.0 3.3
8.2 11.2 11.0 11.5 10.89.7 9.8 10.8 11.5 10.99.1 10.8 11.1 11.8 11.17.8 12.0 12.5 11.7 10.4
Personal consumption expendituresGoodsServices
Gross private domestic investmentResidential structuresBusiness fixed investment
Gov't. purchases of goods and servicesFederalState and local
Disposable personal income
Personal incomeWage and salary disbursements
Corporate profits with IVA & C.C. Adj.Corporate profits before tax
Nonfarm payroll employmentManufacturing
9.7 10.5 9.8 10.1 11.4 10.7 10.7 10.89.5 11.4 8.9 8.7 10.7 9.7 9.4 10.09.9 9.3 11.1 11.8 12.2 11.8 12.3 11.6
17.7 16.8 -2.5 -11.0 27.3 22.6 16.0 8.625.0 6.6 -16.7 -6.5 32.5 34.8 15.7 3.012.2 16.4 10.8 -. 3 9.6 15.7 15.9 11.8
8.3 6.5 12.3 11.8 6.2 9.6 10.2 10.36.1 .1 8.7 10.7 5.5 11.7 6.4 10.29.8 10.8 14.5 12.5 6.6 8.4 12.5 10.3
7.9 12.5 9.2 10.4 9.0 10.0 11.2 10.9
9.7 11.7 9.7 8.7 10.0 10.7 11.4 10.79.4 10.6 9.0 5.4 10.4 10.5 11.6 10.3
19.3 7.6 -15.6 14.7 32.4 13.5 12.6 12.017.3 20.4 9.6 -5.1 29.5 11.5 16.7 10.0
3.5 4.3 1.9 -1.7 3.2 3.6 4.2 2.23.1 5.2 -.4 -8.7 3.7 3.4 3.3 2.2
Nonfarm business sectorOutput per hourCompensation per hourUnit labor costs
3.0 1.7 -2.95.8 7.8 9.42.7 6.0 12.7
1.9 3.6 1.3 .5 1.59.9 8.5 8.1 9.1 9.47.9 4.7 6.7 8.5 7.8
GNP implicit deflatorGross business product fixed-weighted price index 1/
Industrial production
4.1 5.9 9.7 9.6 5.2 5.9 7.4 7.53.3 5.7 10.4 9.4 5.4 6.2 7.5 7.8
9.2 8.4 -.4 -8.9 10.2 5.6 5.6 5.0
1/ Using expenditures in 1972 as weights.

November 15, 1978FEDERAL SECTOR ACCOUNTS(billions of dollars)
l99 CY 78/ Calendar quarters; unadjusted dataFiscal FY 1979 CY 7 F.R. staff estimatesYear Admin. F.R. Cong. CY F.R. 1978 19791978* 1/ Board 2/ 1977* Board I* II* III* IV I II III
Unified budget receipts 3/ 402.0 4527 451.8 448.7 366.1 415.6 85.4 125.3 106.8 98.2 99,3 138.0 116.3
Unified budget outlays 37 450.7 491.6 490.5 487.5 417.0 459.9 111.2 111.3 114.9 122.5 121.2 122.5 124.2
Surplus(+)/Deficit(-), unified budget -48.7 -38.9 -38.7 -38.8 -50.9 -44.3 -25.8 14.0 -8.1 -24.3 -21.9 15.5 -7.9
Surplus(+)/beficit(-}, off-budgetagencies 4/ -10.3 -12.9 -11.1 n.a. -10.4 -10.6 -3.6 -2.3 -3.1 -1.6 -3.2 -3.7 -2.7
Means of financing combined deficits:Net borrowing from public 59.1 n.a. 41.4 n.a. 56.8 55.4 20.8 2.5 15.1 17.0 16.9 -6.3 13.8
Decrease in cash operating balance -3.3 n.a. 10.4 n.a. -0.6 -0.2 5.9 -11.1 -4.9 9.9 4.5 -4.0 0
Other 5/ 3.2 n.a. -2.0 n.a. 5.3 -0.4 2.8 -3.2 1.0 -L.0 3,7 -1.5 -3.2
Cash operating balance, end of period 22.4 n.a. 12.0 n.a. 12.3 12.5 6.4 17.5 22.4 12,5 8.0 12.0 12.0
Memo: Sponsored agency borrowing 6/ 19.1 n.a. 19.2 n.a. 6.8 21.4 4.5 6.5 6.1 4.3 3.6 5.6 5.7
NIA Budget Seasonally adjusted annual data
Receipts 411.8- n.a. 463.38/
n.a. 374.5 429.1 396.2 424.8 442.0 453.4 457.9 469.0 480.4
Expenditures 451.8 495.6 495.9 n.a. 422.6 461.1 448.8 448.3 466.1 481.3 489.2 498.4 514.5
Purchases (total) 151.8 166.8 166.6 n.a. 145.1 154.4 151.5 147.2 156.1 162.8 165.3 167.6 170.7
Defense 98.4 104.7 105.2 n.a. 94.3 100.0 97.9 98.6 100.2 103.1 104.2 106.0 107.6
Non-defense 53.3 62.1 61.4 n.a. 50.8 54.4 53.6 48.6 55.9 59.7 61.1 61.6 63.1
All other outlays 300.0, 328.8 329.38, n.a. 277.5 306.7 297.3 301.1 310.0 318.5 323.9 330.8 343.8
Surplus(+)/Deficit(-) -40.0 n.a. -32.6- n.a. -48.1 -32.0 -52.6 -23.6 -24.1 -27.9 -31.3 -29.4 -34.1
High Employment Surplus(+)/Deficit(-)
(NIA basis) 7/ 3.1 n.a. 13.7 n.a. -4.6 9.8 -3.0 17.3 14.3 10.4 10.8 16.8 16.9
* actual e--estimated r--revised n.a.--not available
1/ OMB October Budget Update (October 27, 1978), Mid-Session Review of the 1979 Budget (July 6, 1978) and the Department of Commerce.
/ Second Concurrent Budget Resolution (September 20, 1978).3/ Adjusted for accounting change in earned income credit payments--formerly treated as income tax refunds and now classified as outlays.
'/ Includes Federal Financing Bank, Postal Service Fund, Rural Electrification and Telephone Revolving Fund, Rural Telephone Bank, and Pension Benefit Guaranty
Corporation.
5/ Checks issued less checks paid, accrued items and other transactions.
6/ Includes Federal Home Loan Banks, FNMA, Federal Land Banks, Federal Intermediate Credit Banks, and Banks for Cooperatives.
7/ FRB staff estimates.
5/ Quaterly average exceeds fiscal year total by $1.0 billion for fiscal year 1978, and by $3.5 billion for fiscal year 1979, due to spreading of wage base effect over
calendar year. The fiscal year totals as published in the July 1978 Survey of Current Business are based on unadjusted data and do not conform to the average of four
seasonally adjusted quarters. The FRB staff estimates, therefore, have been adjusted in order to make the Commerce Department and the staff estimates comparable.

I - 14
Comments on the Fiscal Policy Outlook
The fiscal policy assumptions underlying this month's
projection reflect recent budgetary actions taken by the Congress
and the Administration. The staff's Federal revenue forecast
now includes the $18-1/2 billion in tax cuts (NIA basis) that
are mandated by the Revenue Act of 1978.1/ In broad terms, the
projection includes:
(1) A reduction in personal taxes--including capitalgains--that lowers revenues by $12-1/2 billionin calendar year 1979;
(2) A cut in business taxes that lowers the topcorporate rate from 48 to 46 per cent on incomeover $100,000 (estimated decline in corporate taxaccruals, $5 billion in calendar year 1979);
(3) A liberalization of the investment tax creditthat allows firms to use the credits to offset90 per cent of their tax liabilities by 1982(60% in 1979), instead of the current 50 percent. (Estimated first year (1979) revenueloss, $.3 billion);
(4) Miscellaneous business tax revisions that reducerevenues by about $.6 billion in calendar year1979.
The forecast also contains around $1 billion in tax credits for home
insulation and energy saving equipment, as provided by the new
Energy Act.
The reduction in FY 1979 receipts resulting from both the
tax cut and the energy package is estimated to be about $2-1/2
1/ The major provisions of the 1978 Revenue Act are described inPart 2, Appendix A.

I - 15
billion smaller than earlier staff assumptions. This change,
however, is partially offset by the effects on projected revenues
of reduced income assumptions. Total receipts in the current fiscal
year are now expected to be around $452 billion.
Federal spending continues to be forecast at about $491
billion, as higher interest outlays are expected to be offset by
spending reductions resulting from the President's decision to cut
Federal employment by 20,000 ($.2 billion saving) and to support
the dollar by doubling gold sales ($1.2 billion negative outlay).
Recent Administration announcements indicate that further spending
restraint can be expected in fiscal year 1900.
The deficit for FY 1979 is now projected at $39 billion
and the total amount that needs to be financed (unified plus off-
budget) is estimated at $50 billion. In the current quarter, the
Treasury's financing requirements are expected to be around $26
billion, up sharply from the third quarter's $10 billion (not
seasonally adjusted). The Treasury is expected to meet these needs
by drawing down its large end of September cash balance by $10
billion and by issuing $17 billion in marketable and nonmarketable
securities.
Finally, the high employment budget projections continue
to show a substantial $10 billion shift toward surplus between fiscal
years 1978 and 1979.

I - 16
DOMESTIC FINANCIAL DEVELOPMENTS
Summary. Since the last FOMC meeting, credit markets have
adjusted to a substantial further tightening in monetary policy. In
the latter part of October the Federal funds rate rose by about 1/2
of a percentage point, following a similar discount rate increase at
mid-month. Then on November 1, the discount rate was raised 1 per-
centage point further, the reserve requirement on large time deposits
was increased by 2 percentage points and an additional rise in the
Federal funds rate of around 1/2 of a percentage point was initiated.
These moves were part of a joint program undertaken with the Treasury
to buttress the value of the dollar on foreign exchange markets and
thereby counter inflationary pressures.
Largely in response to these actions, short-term market
interest rates increased substantially over the intermeeting period.
Commercial paper and CD rates rose as much as 150 basis points, while
rates on Treasury bills, which were in heavy demand from foreign
governments, moved 30 to 75 basis points higher. Bond yields have
increased only about 5 to 25 basis points since mid-October. These
rates had risen somewhat further in late October in response to
heightened concern about the outlook for inflation and to the sharp
decline in the foreign exchange value of the dollar, as well as to
the rise in short-term rates, but have fallen in the wake of the
November 1 policy moves. Stock prices, which had declined substantially

I - 17
in late October, have shown little net change in November, remaining
from 9 to 15 per cent below their levels at the time of the FOMC
meeting.
The publication in early November of data suggesting
substantially slower growth in the monetary aggregates also may have
contributed to the recent firmer tone in capital markets. M-1 ex-
panded at only a 3-3/4 per cent annual rate in October, following
September's rapid increase, and growth of the interest-earning
deposits in M-2 also moderated, due to a decline in savings deposits
and the small size of the increase in the average level of its large
time component.1/ Sales of money market certificates reached record
monthly totals in October at both banks and thrift institutions.
However, much of this strength apparently represented a shifting
from other time deposits--an unusually large quantity of which matured
early in the month--and growth slowed in both total time and savings
deposits subject to ceilings at banks and total deposits at thrifts.
Bank lending picked up a little in October, financed by a
substantial run-off of U.S. Treasury securities and increased use of
nondeposit sources of funds, as well as the surge in small time
deposits. Total large time deposits grew only slightly on average
1/ The impact of Automatic Transfers on the behavior of the monetaryaggregates in the first week of November will be discussed in theGreenbook Supplement.

I - 18
for the month, but CD's increased substantially in the last few weeks
of the month, contributing to upward yield pressures in this sector.
Bank lending to businesses accelerated somewhat, as did
issuance of commercial paper by nonfinancial corporations, but offer-
ings of bonds by these firms increased less than seasonally. Bond
issuance by industrial and lower-rated corporations was especially
weak. The back-up in bond rates in late October was accompanied by
a widening of yield spreads, which continued into November.
Consumer instalment borrowing in October is estimated to
have remained at the September pace, but flows of mortgage credit
may have grown somewhat, given the increase in real estate lending
at banks, the further rise in mortgage commitments outstanding at
S&Ls in September, and an increase in issuance of GNMA pass-throughs.
Average rates on conventional mortgages at S&Ls rose substantially
over the intermeeting period, and offerings at FNMA auctions swelled
in early November, reflecting concerns that market rates might rise
still further and that thrifts might draw back from the aggressive
issuance of money market certificates, as a few reportedly have done
already.
Outlook. The general level of interest rates is expected
to change little over the next few months. Both the marked rise in
these rates experienced in recent months and the slower growth of
GNP now projected will help maintain monetary aggregate growth within

I - 19
the Committee's ranges. Moreover, aggregate credit demands are
unlikely to strengthen significantly further. Interest rates on
mortgages, however, may move higher as deposit inflows at inter-
mediaries diminish.
Mortgage lending at thrift institutions is expected to be
well maintained over coming months, given the recent rise in their
loan commitments. Deposit growth, though, is expected to slow, as
the higher level of interest rates damps inflows to accounts subject
to fixed rate ceilings and discourages thrifts from offering money
market certificates aggressively. Under such circumstances, these
institutions are expected to reduce the rate at which they accumulate
liquid assets, and may have to increase once again their reliance
on Home Loan Bank advances; a pick-up in this borrowing already
began in October. Given continued strong demand for mortgage credit,
a tightening in thrift liquidity positions can be expected to be
reflected in continued pressures on mortgage rates. Such develop-
ments are likely to induce increased mortgage lending by diversified
investors and greater support of the market by sponsored Federal
agencies.
At businesses, external financing requirements are projected
to rise slightly over coming months as profit growth, which may be
held down by the slowing in economic expansion, is outpaced by the rise
in capital expenditures. If the substantial increases in short-term
debt ratios that have taken place induce businesses to direct a larger

I - 20
proportion of this borrowing into bond markets, this would put
additional upward pressures on long-term yields. However, there
have not yet been any indications of a near-term pick-up in corporate
bond offerings.
In the public sector, State and local borrowing should
remain close to the slower pace established this fall. The Federal
government's financing requirements will be substantial, but the
credit market impact of Treasury borrowing will be damped to the
extent that there are continued sales of U.S. Government obligations
to foreigners.

I - 21
INTERNATIONAL DEVELOPMENTS
Summary. Although the weighted average foreign exchange value
of the dollar is at about the same level as it was five weeks ago, in the
interim it shifted widely in both directions and intervention activity
became intense. The dollar's foreign exchange value weakened in mid-
October and dropped 4 per cent in the four days following the President's
October 24 announcement of a program to contain inflation. The program
that was announced evidently did little to change market participants'
expectations about the near-term U.S. inflation rate. A recovery from
the low point began on October 31 as the market sensed that strong
support measures were soon to be announced; the dollar's average value
rose sharply further when the measures were announced on November 1,
and by November 3 it was nearly 8 per cent above its October low.
However, the gains achieved in early November required the support
of heavy central-bank intervention.
The measures announced November 1 included a package of steps
to add to the resources available for intervention - $7.6 billion added
to FR swap lines with Germany, Switzerland and Japan; Treasury sales
of $2 billion equivalent of SDRs to those countries; Treasury drawings
of $3 billion of usable currencies from the U.S. reserve position in
the IMF; and sales of up to $10 billion equivalent of foreign-currency
denominated securities. Intervention by the United States increased
sharply in the week following the October 24 statement and amounted

I - 22
to $1 billion equivalent. A further $2.9 billion of foreign currencies,
largely DM, was sold by the United States in the November 1-14 period.
In the U.S. international accounts for the third quarter, the
merchandise trade deficit was at an annual rate of $31 billion, about
the same as in the second quarter. Non-agricultural exports were up
about 8 per cent in value over the second quarter level, of which about
3 per cent was higher volume. Non-oil imports were up about 7 per cent,
mainly in volume. Petroleum imports were unchanged in quantity or
price, holding to a $43 billion rate. Foreign investors were net sellers
of U.S. corporate stock on a small scale in the third quarter, but may
have sold more heavily during the October decline in the market. U.S.
net purchases of foreign securities were under $1/2 billion in the
third quarter, well below the first-half rate. Bank-reported private
capital transactions recorded a moderate net outflow in the third
quarter, reversing a sizable net inflow in the second quarter.
Foreign official assets in the United States, apart from
OPEC's, rose about $6 billion in the third quarter

I - 23
On the other hand, OPEC assets in the United States continued the decline
that began in the second quarter, bringing the total drop for the year
to about $2-1/2 billion, compared to an increase of about $5 billion in
the first nine months of 1977. The change reflects both a sharp reduc-
tion in the OPEC surpluses and some diversification out of traditional
dollar-denominated assets.
More complete third-quarter data covering foreign economic
developments confirm the staff view that average growth of the ten
leading foreign economies is holding at about a 3-1/2 per cent annual
rate. Japan and Canada had been growing at above average rates but seem
to have slowed slightly; growth in Germany has been hesitant but may
now be rising. Consumer prices are rising at an annual average of about
7 per cent in these ten countries, but was much lower than that average
in Germany, Switzerland and Japan. With growth rates still below
potential the employment picture abroad weakened in the third quarter
compared to the second. The combined trade surplus of six major foreign
countries remained at about $13 billion in the third quarter (not an
annual rate), mainly reflecting German and Japanese surpluses.
Outlook. It remains the staff view that GNP growth in foreign
industrial countries will rise gradually from the 3-1/2 per cent rate of
the second half to somewhat over 4 per cent in 1979. Growth in Japan

I - 24
is expected to fall short of the 7 per cent targeted rate, though it
will probably be considerably stronger than in recent quarters, and growth
in Germany should be picking up soon. In France and the United Kingdom,
however, growth rates are expected to taper off in the course of next
year. These growth rates should not put any significant pressure on
capacity abroad. The rate of increase of consumer prices abroad is
expected to change little in the period ahead.
Given the projected slowdown of the U.S. economy in the year
ahead, and some pickup in growth abroad, a somewhat larger reduction in
the U.S. trade deficit is now projected than a month ago - from the
$31 billion rate of the third quarter to about $26 billion by the end of
1979. The fourth quarter rate this year may be somewhat above the
third quarter rate as agricultural exports decline a little and oil
imports rise in anticipation of a price increase. Next year's projected
oil import bill now incorporates an assumed 7-1/2 per cent price increase
at the beginning of the year, but the estimated volume of oil imports
has been reduced. The staff view continues to be that the average value
of the dollar a year from now will be at about its average level in
August-September, which would be slightly above its present level.

November 15, 1978Outlook for U.S. Net Exports and Related Items
(billions of dollars, seasonally adjusted annual rates)
1977 1978P
1. GNP NET EXPORTS - Intl Acct. data2. (GNP net exports - GNP Acct. data) 1/
3. a) Merchandise Trade Balance
4. Exports (excl. military)
5. Agricultural
6. Nonagricultural
7. Imports8. Petroleum and petrol. products
9. Nonpetroleum
10. b) Military transactions, net 2/
11. c) Investment income, net 3/
12. d) Other services, net 4/
1 9 7 9P
-11.1 -10.2 .2-10.9) (-10.6) (-.3)
-31.1 -35.0 -28.7
120.6 140.9 169.724.4 29.8 30.096.2 111.1 139.7
151.6 175.9 198.445.0 42.8 48.0106.7 133.1 150.4
.9 1.6 3.017.3 20.5 22.21.7 2.7 3.7
1* I-
1978II Ii II v IVP
-23.8(-24.1)
-44.8
122.726.096.6
167.539.8127.7
.418.42.2
-5.3 -6.0
-5.3(-5.5)
-31.2
140.332.0
108.3
171.543.2128.2
1.921.32.8
-6.0(-6.5)*
-31.2*
148.7*31.6*117.2*
179.9*43.2*136.7*
2.020.42.8
-5.8(-6.3)
-32.9
151.829.6
122.2
184.744.8139.9
2.221.83.1
1 9 7 9I II III IV
-3.3(-3.8)
-30. f
158.730.1128.6
189.344.6144.7
2.421.53.4
-2.4 1.7
-2.4(-2.9)
-30.8
166.429.9
136.5
197.248.4
148.8
2.822.03.6
1.7(1.2)
-27.9
173.430.0
143.4
201.349.0
152.3
3.222.63.8
4.5(4.0)
-25.6
180.430.2
150.2
206.050.1
155.9
3.622.6
3.9
13. U.S. CURRENT ACCOUNT BALANCE -15.2 -17.0 -9.6 -27.4 -13.0 -13.4 -14.3 -12.9 -12.4 -8.0 -5.214. a) GNP net exports (line 1.) -11.1 -10.2 .2 -24.1 -5.3 -6.0 -5.8 -3.3 -2.4 1.7 4.515. b) U.S. Govt & private transfers 5/ -4.1 -6.8 -9.8 -3.3 -7.7 -7.4 -8.5 -9.6 -10.4 -9.7 -9.7
Constant (1972) dollars 67.0 72.2 79.9 65.7 72.9 74.5* 75.5 77.1 79.2 80.8 82.416. Merchandise exports (excl. military) (0.3) (7.8) (10.7) (4.5) (51.3) (9.1)* (5.7) (8.7) (10.8) (8.2) (8.7)17. (7. change, annual rates)
18. Merchandise imports 71.0 75.6 78.8 74.4 74.0 77.1* 76.8 76.8 78.6 79.3 80.419. (% change, annual rates) (13.0) (6.5) (4.2) (6.6) (-2.0) (17.9)* (-1.6) (0) (9.5) (4.1) (5.3)
Foreian Outlook - Ten Industrial Countries 6/20. Real GNP, Z change, annual rates21. Consumer Pricea,Z/ % change, A.R.
3.0 3.7 4.17.9 5.4 6.1
Differs from Intl. Acct. data (line 1) in the inclusion of revisionsand new data.Excludes grants to Israel under military assistance acts and exportsfinanced by those grants.Excludes U.S. Govt. interest payments to foreigners, and reinvestedearnings of incorporated affiliates which are included in line 15.Includes travel, transportation, fees and royalties, and mis-cellaneous other service transactions.Includes U.S. Govt. grants, U.S. Govt. interest payments toforeigners, remittancesand pensions, and exports to Israel financedby U.S. military assistance grants, and reinvested earnings ofincorporated affiliates.
5.54.9
4.1 3.46.8 4.1
4.5 4.3 4.4 4.46.3 6.4 7.3 7.4
6/ Weighted by the shares of Canada, France, Germany, Italy, Japan,United Kingdom, Netherlands, Skbeden, Belgium, and Switzerland in the sum of thereal GNP of the ten countries in dollar terms,
7/ Wholesale prices for Japan.
2/ Projected.e/ Estimated.*i Published data.
HtZE: Foreign outlook data have been revised to include 10 countries.
CONFIDEN'TIAr._ ~CLASS II FOMC
I
-" @
(