Embed Size (px)
Citation preview

Content last modified 03/31/2011.
Prefatory Note The attached document represents the most complete and accurate version available based on original files from the FOMC Secretariat at the Board of Governors of the Federal Reserve System. Please note that some material may have been redacted from this document if that material was received on a confidential basis. Redacted material is indicated by occasional gaps in the text or by gray boxes around non-text content. All redacted passages are exempt from disclosure under applicable provisions of the Freedom of Information Act.

CLASS I FOMC - RESTRICTED CONTROLLED (FR)
AUGUST 4, 2005
MONETARY POLICY ALTERNATIVES
PREPARED FOR THE FEDERAL OPEN MARKET COMMITTEE BY THE STAFF OF THE BOARD OF GOVERNORS OF THE FEDERAL RESERVE SYSTEM

Class I FOMC - Restricted Controlled (FR) August 4, 2005
MONETARY POLICY ALTERNATIVES
Recent Developments
(1) The Committee’s decision at its June meeting to raise the target federal
funds rate 25 basis points to 3¼ percent, to retain an assessment that the risks to price
stability and to sustainable growth were balanced, and to reiterate the “measured
pace” language was largely anticipated by investors, and the market reaction was
muted. Over subsequent weeks, a string of better-than-expected data releases on
spending and output along with upbeat corporate earnings reports painted a
consistent picture of solid economic expansion. News on inflation was read as more
mixed: Revisions to the national income and product accounts indicated that PCE
inflation last year was noticeably higher than previously estimated, but readings for
recent months came in below market expectations. Against this background, and with
the monetary policy report and public statements of policymakers seeming to point to
continued measured firming, investors marked up the expected path for policy.1
Options on federal funds futures suggest that investors have become virtually certain
of a 25-basis-point tightening at this meeting, which is consistent with the Desk’s
latest survey of primary dealers.2 Respondents to that survey anticipate no significant
changes to the wording of the FOMC statement this round and expect additional
1 The minutes of the June FOMC meeting were released shortly after the conclusion of the second round of the Chairman’s monetary policy testimony and prompted little market reaction. 2 Market anticipation of a firming move has pushed up the federal funds rate in advance of the FOMC meeting, with federal funds trading about one-third of the way to the expected new target rate today, the first day of the new maintenance period. Over the intermeeting period through August 3, the effective federal funds rate averaged 3.27 percent. The Desk purchased no Treasury bills or coupon securities in the market, and it redeemed $1.3 billion of coupon securities to remain within the per-issue limits on security holdings. The volume of outstanding long-term RPs rose $2 billion, to $19 billion.

25-basis-point policy moves at the September and November meetings. Money
market futures quotes indicate that the expected funds rate at year-end was boosted
about 35 basis points over the intermeeting period to a bit above 4 percent, and the
rate for year-end 2006 was lifted around 45 basis points to about 4¼ percent
(Chart 1).
(2) Yields on nominal Treasury notes climbed about 35 to 40 basis points over
the intermeeting period. With much of the increase concentrated in forward rates at
the front end of the curve, the spread between two- and ten-year Treasury yields
narrowed further to around 30 basis points. The London bombings did not appear to
prompt much in the way of safe-haven flows to Treasury securities or greater market
uncertainty. Similarly, the announcement of a revaluation of the Chinese renminbi
reportedly had no lasting effect in the Treasury market.3 Over the intermeeting
period, yields on inflation-protected Treasury securities rose roughly in line with those
on their nominal counterparts, implying little net change in inflation compensation.
Inflation expectations as gauged by the Michigan survey also were little changed,
edging down for the short-term measure but rising slightly for the longer-term
measure. The spot price of West Texas intermediate crude oil rose about $4.00 per
barrel, ending the period close to a record high in nominal terms (Chart 2). Prices of
far-dated oil futures moved up more than $3.00 on balance.
3 On July 21, the People’s Bank of China (PBOC) announced that it was dropping the renminbi’s peg to the dollar in favor of a managed float with reference to an unspecified currency basket, at an initial setting that implied an immediate 2 percent appreciation versus the dollar. Concern that the new currency regime would lead to fewer purchases of dollar assets by the Chinese authorities, or that it might put upward pressure on U.S. prices, prompted a rise of 6 to 12 basis points in Treasury coupon yields that day. However, most of this effect appeared to be reversed over the next few days, as subsequent exchange rate movements and a second statement by the PBOC led investors to conclude that any further near-term revaluation of the renminbi would be limited. Judging from nondeliverable forward contracts, the value of the renminbi expected in twelve months increased only modestly on balance over the intermeeting period.
Class I FOMC - Restricted Controlled (FR) Page 2 of 35

Chart 1Interest Rate Developments
Note: Vertical lines indicate June 29, 2005. Last daily observations are for August 4, 2005.
Aug. Sept. Oct. Nov. Dec.2005
3.4
3.6
3.8
4.0
4.2Percent
August 4, 2005 June 29, 2005
●
●
●
●
●
●
●●
3.51
3.73
3.92
4.05
3.46
3.60
3.69 3.71
Expected Federal Funds Rates
Note. Estimates assume a 1.0 basis point per month term premiumand zero probability of intermeeting moves.
Aug. Nov. Feb. May Aug. Nov. Feb.2005 2006 2007
3.0
3.5
4.0
4.5
5.0Percent
August 4, 2005June 29, 2005
Expected Federal Funds Rates*
*Estimates from federal funds and eurodollar futures, with an allowance for term premia and other adjustments.
Jan. Apr. July Oct. Jan. Apr. July2004 2005
0
1
2
3
4
5
6
7Percent
Ten-YearTwo-Year
Nominal Treasury Yields*
Daily
*Par yields from an estimated off-the-run Treasury yield curve.
FOMC
Jan. Apr. July Oct. Jan. Apr. July2004 2005
0
50
100
150
200Basis points
Ten-Year TreasurySix-Month Eurodollar
Options Implied Volatilities
DailyFOMC
Jan. Apr. July Oct. Jan. Apr. July2004 2005
0.0
0.5
1.0
1.5
2.0
2.5
3.0
3.5Percent
Five-YearTen-Year
TIPS Yields*
DailyFOMC
* Estimates are from a smoothed inflation-indexed yield curve.
Jan. Apr. July Oct. Jan. Apr. July2004 2005
1.5
2.0
2.5
3.0
3.5
4.0Percent
Five-to-Ten Years AheadNext Five Years
Inflation Compensation*
Daily
*Based on a comparison of an estimated TIPS yield curve to an estimatednominal off-the-run Treasury yield curve.
FOMC
Class I FOMC - Restricted Controlled (FR) Page 3 of 35

Chart 2Asset Market Developments
Note: Vertical lines indicate June 29, 2005. Last daily observations are for August 4, 2005.
Jan. Apr. July Oct. Jan. Apr. July2004 2005
20
25
30
35
40
45
50
55
60
65
70Dollars per barrel
Spot WTILong-dated Oil Futures
DailyFOMC
Oil Price
1991 1993 1995 1997 1999 2001 2003 2005
0
1
2
3
4
5
6
7
Bond Default andC&I Loan Delinquency Rates Percent of outstandings
C&I loan delinquency rate (Call Report)
Bond default rate*
*Six-month moving average, from Moody’s Investors Service.
Q1
Jun.
0
40
80
120
160
200
Jan. Apr. July Oct. Jan. Apr. July2004 2005
150
350
550
750
950
1150
Basis points Basis points
Ten-Year BBB (left scale)Five-Year High-Yield (right scale)
FOMC
Corporate Bond Spreads*
Daily
*Measured relative to an estimated off-the-run Treasury yield curve.
Jan. Apr. July Oct. Jan. Apr. July2004 2005
80
90
100
110
120Index(12/31/03=100)
WilshireNasdaq
FOMC
Stock Prices
Daily
Jan. Apr. July Oct. Jan. Apr. July2004 2005
0
10
20
30
40Percent
S&P 500Nasdaq
Options Implied Volatilities
DailyFOMC
0
2
4
6
8
10
12
1988 1992 1996 2000 2004
E/P ratio
Real Long-term Treasury yield*
+
+
* Perpetuity Treasury yield minus Philadelphia Fed 10-year expected inflation.Note. + Denotes the latest observation using daily interest rates and stock prices and latest earnings data from I/B/E/S.
12-Month Forward Trend Earnings-Price Ratio forS&P 500 and Real Long-term Treasury Yield
Monthly
Percent
0
2
4
6
8
10
12
Class I FOMC - Restricted Controlled (FR) Page 4 of 35

(3) Reflecting positive earnings announcements and strong economic data,
spreads on investment-grade corporate bonds edged lower over the intermeeting
period. Those on speculative-grade securities fell about 60 basis points, nearly
reversing their runup of this spring. Broad equity indexes rose 3 to 6 percent over the
period, paced by large gains in technology shares, and the implied volatility of equity
prices remained low. Nonetheless, a rough measure of the equity premium—the gap
between the twelve-month forward trend earnings-price ratio and the real long-term
Treasury yield—held steady at a fairly high level.
(4) Although dollar interest rates rose noticeably relative to those of other
major currencies, the trade-weighted foreign exchange value of the dollar against
other major currencies declined about 1 percent on balance over the intermeeting
period (Chart 3).4 The dollar initially rose after the June FOMC meeting, but it gave
up these gains late in the intermeeting period. On net, the dollar depreciated about
2 percent against the euro and 1 percent against the Canadian dollar, while registering
modest gains against sterling and the yen. On August 4, the Bank of England
announced a cut in its official target rate of 25 basis points to 4½ percent, citing
downside risks to the economy in the near term. This decision had been widely
anticipated, and its announcement prompted little market reaction. Share prices in
foreign industrial countries increased 2 to 6 percent over the intermeeting period.
(5) Against an index of the currencies of our other important trading partners,
the dollar fell about 1½ percent on balance over the period, pulled down by decreases
in its value versus the Mexican peso and Chinese renminbi. The dollar also declined
against the currencies of several other Asian emerging economies in the wake of
China’s revaluation. Immediately after China’s announcement, the Malaysian
4
Class I FOMC - Restricted Controlled (FR) Page 5 of 35

Chart 3International Financial Indicators
Note: Vertical lines indicate June 29, 2005. Last daily observations are for August 4, 2005.
Jan. Apr. July Oct. Jan. Apr. July2004 2005
90
92
94
96
98
100
102
104
106
108
110
112
BroadMajor CurrenciesOther Important Trading Partners
Nominal Trade-Weighted Dollar Indexes
Daily
Index(12/31/03=100)
FOMC
3.0
3.5
4.0
4.5
5.0
5.5
6.0
Jan. Apr. July Oct. Jan. Apr. July2004 2005
0.0
0.5
1.0
1.5
2.0
2.5
3.0
UK (left scale)Germany (left scale)Japan (right scale)
Ten-Year Government Bond Yields
Daily
Percent
FOMC
Jan. Apr. July Oct. Jan. Apr. July2004 2005
90
95
100
105
110
115
120
125
130
UK (FTSE-350)Euro Area (DJ Euro)Japan (Topix)
Stock Price Indexes
Daily
Index(12/31/03=100)
FOMC
Jan. Apr. July Oct. Jan. Apr. July
2004 2005
200
300
400
500
600
700
800
900
1000
OverallBrazil
EMBI+ Index
Daily
Basis Points
FOMC
Class I FOMC - Restricted Controlled (FR) Page 6 of 35

authorities announced that they were adopting a managed float for the ringgit
exchange rate.
(6) Domestic nonfinancial debt appears to have decelerated in the second
quarter, with all major sectors contributing to the slowing (Chart 4). In the business
sector, internal funds evidently are abundant and capital expenditures are apparently
expanding at only a moderate pace, holding down borrowing by nonfinancial firms in
recent months. Net bond issuance remained tepid in June and July, and commercial
paper outstanding dropped somewhat, on net, over the same period. In contrast,
business loans continued to expand briskly on balance. Data from the Senior Loan
Officer Opinion Survey indicate a further easing of standards and terms on C&I loans
over the past three months and also a further strengthening in demand for such loans,
supported by increased financing needs for investment and mergers and acquisitions.
Household borrowing seems to have slowed a bit in the second quarter but apparently
remained quite brisk, propelled by continued expansion of mortgage debt at close to a
10 percent rate. Federal debt growth dropped off markedly last quarter, consistent
with higher-than-expected tax receipts and a narrowing of the deficit in recent
months.
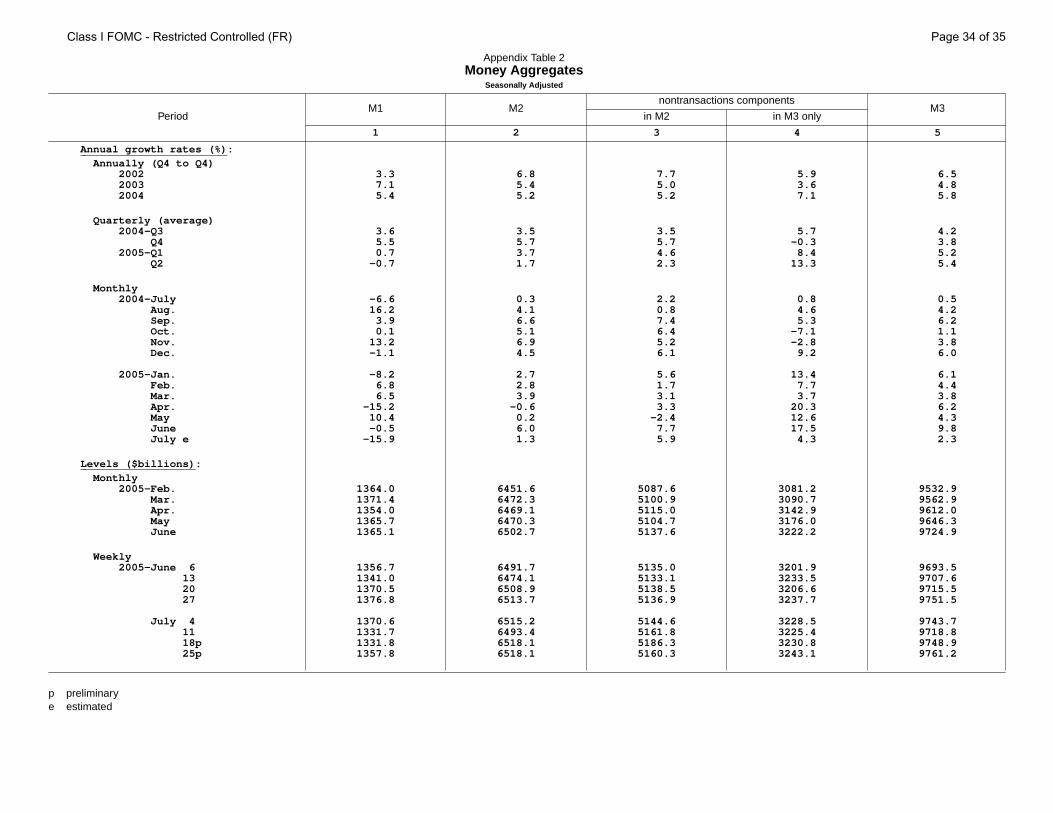
(7) M2 growth picked up to a 6 percent rate in June, but fell back in July to
around the pace registered over the first five months of the year. The strength in M2
in June owed primarily to an increase in liquid deposits; a rise in mortgage
prepayments and a bulge in nonwithheld individual income tax payments likely played
a role in that pickup. Over the first two quarters of 2005, the growth of M2, at a
2¾ percent annual rate, was somewhat above the pace predicted by standard
historical relationships with income and short-term interest rates, perhaps owing to
the flattening of the yield curve.
Class I FOMC - Restricted Controlled (FR) Page 7 of 35

Chart 4Debt and Money
Growth of Nonfinancial Debt
Percent, s.a.a.r.
2003
2004
2005
Q1
Q2
Q3
Q4
Q1Q2 p
Total______
8.1
9.3
7.7
8.2
8.2
10.06.3
Nonfederal___________
7.5
8.7
7.0
8.9
8.4
9.17.3
p Projected.-20
-10
0
10
20
30
40
50
60
C&I LoansCommercial PaperBonds
Sum
Changes in Selected Components ofNonfinancial Business Debt $Billions
2003 2004 Q1 Apr May Jun Jul
2005
Monthly rate
Note. Commercial paper and C&I loans are seasonally adjusted,bonds are not.
1991 1993 1995 1997 1999 2001 2003 2005
-3
0
3
6
9
12
15
18
21
Growth of Household DebtPercent
Quarterly, s.a.a.r.
p Projected.
Q2p
Q2p
ConsumerCredit
HomeMortgage
-4
-2
0
2
4
6
8
10
Growth of M2
s.a.a.r.Percent
e
e Estimated.
2003 2004 Q1 Apr May Jun Jul
2005
-10
-5
0
5
10
15
20
Growth of Liquid Deposits
s.a.a.r.Percent
e
e Estimated.
2003 2004 Q1 Apr May Jun Jul2005
0.25
0.50
1.00
2.00
4.00
8.00
1993 1995 1997 1999 2001 2003 2005
1.8
1.9
2.0
2.1
2.2
2.3
M2 Velocity and Opportunity CostVelocityPercent
Quarterly
Opportunity Cost*(left axis)
Velocity(right axis)
p Projected.*Two-quarter moving average.
Q2p
Q2p
Class I FOMC - Restricted Controlled (FR) Page 8 of 35

Economic Outlook
(8) Incoming data on spending and production have led the staff to mark up its
assessment of near-term strength in the economy, and the annual revisions to the
national income and product accounts have induced the staff to trim its estimates of
the level and growth rate of potential output. Inflation pressures are also greater in
this projection, partly because of the upward revision to the outlook for energy prices.
Consequently, the staff has assumed more policy tightening than in the June
Greenbook, with the target federal funds rate reaching 4 percent in the fourth quarter
of this year and 4¼ percent by the middle of next year, 50 basis points higher than in
June—a path roughly the same as that priced into asset markets. Bond yields are
expected to remain close to their current higher levels, while equity prices are assumed
to increase further at a pace sufficient to generate risk-adjusted returns in line with
those on fixed-income instruments. Relative to the last round, the foreign exchange
value of the dollar starts at a level that is a bit lower than anticipated in June and
declines over the forecast period at a slightly faster pace. The price of West Texas
intermediate crude oil is projected to stay near its recent higher level, in line with
futures market quotes. Under these assumptions, real GDP is forecast to expand at a
pace slightly above 4 percent over the second half of this year, essentially closing the
output gap by the fourth quarter. Next year, real output is projected to grow at the
same rate as its potential, about 3 percent. The flattening out of oil prices and a
deceleration in non-oil import prices cause total PCE inflation to drop from
2½ percent this year to 2 percent in 2006, while core PCE inflation holds about
steady near 2 percent over the forecast period.
Class I FOMC - Restricted Controlled (FR) Page 9 of 35

Policy Alternatives
(9) Table 1 presents three policy alternatives for consideration by the
Committee. The federal funds rate would be boosted 25 basis points at this meeting
under Alternatives A and B, and 50 basis points under Alternative C. Apart from
updating the description of the current economic situation, the proposed
announcement associated with Alternative B is little changed from that issued after
the June meeting. In contrast, the announcement accompanying Alternative A would
hint at a near-term slowing in the pace of policy tightening, in part by noting that
policy accommodation has been substantially reduced. The proposed announcement
for Alternative C emphasizes the strength of aggregate spending, suggests that
pressures on business costs and inflation could be increasing, and eliminates all
forward-looking language. As usual, the Committee could consider combining the
policy action and draft language from more than one alternative or view some of the
language options as possibilities for the future.
(10) If the Committee agrees with the staff’s assessment that a small amount of
slack remains in the economy and that the current configuration of financial asset
prices is likely to prove consistent with the expansion of aggregate spending coming
into line with potential output growth before long, it may be attracted to the 25-basis-
point firming and statement language of Alternative B. Investors currently anticipate
a quarter-point move at this meeting followed by several additional firmings—
expectations that should be largely preserved by the combination of policy action and
language proposed under this alternative. And, while recent indicators suggest that
the growth of aggregate demand has been surprisingly buoyant of late, the Committee
may interpret the relatively low inflation readings for recent months as indicating that
prices are not currently in the process of accelerating. Although the stance of
monetary policy evidently remains accommodative, the gap between the actual real
funds rate and current estimates of its equilibrium value has narrowed considerably
Class I FOMC - Restricted Controlled (FR) Page 10 of 35

Table 1: Alternative Language for the August FOMC Announcement
June FOMC Alternative A Alternative B Alternative C
Policy Decision
1. The Federal Open Market Committee decided today to raise its target for the federal funds rate by 25 basis points to 3-1/4 percent.
The Federal Open Market Committee decided today to raise its target for the federal funds rate by 25 basis points to3-1/2 percent.
The Federal Open Market Committee decided today to raise its target for the federal funds rate by 25 basis points to3-1/2 percent.
The Federal Open Market Committee decided today to raise its target for the federal funds rate by 50 basis points to 3-3/4 percent.
2. The Committee believes that, even after this action, the stance of monetary policy remains accommodative and, coupled with robust underlying growth in productivity, is providing ongoing support to economic activity.
The Committee believes that , even after this action, the stance the degree of monetary policy remains accommodative and, coupled with robust underlying growth in productivity, is providing ongoing support to economic activity. accommodation has been substantially reduced.
[no change]
The Committee believes that, even after this action, the stance of monetary policy remains accommodative and, coupled with robust underlying growth in productivity, is providing ongoing support to economic activity.
3. Although energy prices have risen further, the expansion remains firm and labor market conditions continue to improve gradually.
Although energy prices have risen further, tThe expansion remains firm despite high energy prices, and labor market conditions continue to improve gradually.
Although energy prices have risen further, the expansion remains firm Aggregate spending, despite high energy prices, appears to have strengthened since late winter, and labor market conditions continue to improve gradually.
Although energy prices have risen further, the expansion remains firm Aggregate spending appears to be expanding briskly despite high energy prices, and labor market conditions continue to improve gradually.
Rationale
4. Pressures on inflation have stayed elevated, but longer-term inflation expectations remain well contained.
Pressures on inflation have stayed elevated, but Core inflation has been relatively low in recent months, and longer-term inflation expectations remain well contained.
Pressures on inflation have stayed elevated, but Core inflation has been relatively low in recent months and longer-term inflation expectations remain well contained, but pressures on inflation have stayed elevated.
Pressures on inflation have stayed elevated, but Core inflation has been relatively low in recent months and longer-term inflation expectations remain seem well contained, but pressures on business costs and inflation appear to be increasing.
5. The Committee perceives that, with appropriate monetary policy action, the upside and downside risks to the attainment of both sustainable growth and price stability should be kept roughly equal.
[no change]
[no change]
[none]
Assessment of Risk
6. With underlying inflation expected to be contained, the Committee believes that policy accommodation can be removed at a pace that is likely to be measured. Nonetheless, the Committee will respond to changes in economic prospects as needed to fulfill its obligation to maintain price stability.
With underlying inflation expected to be contained, the Committee believes that remaining policy accommodation can be removed at a pace that is likely to be measured. Nonetheless, the Committee will respond to changes in economic prospects as needed to fulfill its obligation to maintain price stability.
[no change]
[none]
Class I FOMC - Restricted Controlled (FR) Page 11 of 35

since mid-2004 (Chart 5). According to those estimates, continued policy firming at a
pace of 25 basis points per meeting would bring the real funds rate within the range of
staff estimates of its equilibrium value by November. But even if members believe
that such a sequence of policy actions is likely to produce sufficient restraint on
inflation, they might judge it premature to send any signal at this time that the course
of policy tightening is nearing completion. Indeed, in light of the recent indications of
strong economic activity, policymakers may have boosted their sense of the degree of
policy tightening that will prove necessary and may now even see an appreciable
probability that the federal funds rate will need to be raised for a time above its
estimated short-run equilibrium value. Even with such an assessment, though,
members may judge that continuing to tighten policy at a measured pace, albeit over a
slightly longer period than previously anticipated, should provide adequate restraint
on spending and inflation.
(11) As shown in Table 1, the statement for Alternative B updates the wording
employed in June in light of incoming data on spending, output, and employment by
noting that “Aggregate spending, despite high energy prices, appears to have
strengthened since late winter, and labor market conditions continue to improve
gradually.”5 The Committee might acknowledge incoming price data by noting that
“Core inflation has been relatively low in recent months,” and, with both survey and
TIPS-based measures of inflation expectations little changed, it could reiterate that
“longer-term inflation expectations remain well contained.” However, it might wish
to emphasize that “pressures on inflation have stayed elevated” by moving that
thought to the end of the sentence. The statement could again indicate that “with
appropriate monetary policy action, the upside and downside risks to the attainment
of both sustainable growth and price stability should be kept roughly equal.” That
5 This statement will need to be reviewed in light of Friday’s labor market report. A revised Table 1 will be distributed to the Committee should changes appear warranted.
Class I FOMC - Restricted Controlled (FR) Page 12 of 35

Chart 5Equilibrium Real Federal Funds Rate
1990 1991 1992 1993 1994 1995 1996 1997 1998 1999 2000 2001 2002 2003 2004 2005 2006 2007
-2
-1
0
1
2
3
4
5
6
7
8Percent
50 b.p. Tightening25 b.p. TighteningCurrent Rate
Notes: The real federal funds rate is constructed as the difference between the quarterly average of the actual nominalfunds rate and the log difference of the core PCE price index over the previous four quarters. For the current quarter,the nominal funds rate used is the target federal funds rate as of the Bluebook publication date.
Notes: Confidence intervals and bands reflect uncertainties about model specification, coefficients, and the level ofpotential output. The final column indicates the values for the current quarter based on the estimation for the previousBluebook, except that the TIPS-based measure and the actual real funds rate are the values published in the previousBluebook.
Short-Run Estimates with Confidence Bands
Short-Run and Medium-Run Measures
Actual real federal funds rateRange of model-based estimates70 percent confidence band90 percent confidence bandGreenbook-consistent measure
Current Estimate Previous Bluebook
Short-Run Measures Greenbook-consistent measure 1.9 1.5 Single-equation model 1.9 1.9 Small structural model 2.2 2.8 Large model (FRB/US) 2.3 2.1 Confidence intervals for three model-based estimates 70 percent confidence interval (0.7 - 3.6( 90 percent confidence interval -0.2 - 4.4(
Medium-Run Measures TIPS-based measure 1.9 1.7 Single-equation model 2.1 2.2 Small structural model 2.4 2.7 Confidence intervals for two model-based estimates 70 percent confidence interval (1.4 - 3.2( 90 percent confidence interval (0.7 - 3.7(
Memo Actual real federal funds rate 1.19 1.26
Class I FOMC - Restricted Controlled (FR) Page 13 of 35

Equilibrium Real Rate Chart: Explanatory Notes
The equilibrium real rate is the real federal funds rate that, if maintained, would be projected to return output to its potential level over time. The short-run equilibrium rate is defined as the rate that would close the output gap in twelve quarters given a model’s projection of the economy, and the medium-run concept is the value of the real funds rate projected to keep output at potential in seven years under the assumption that monetary policy acts to bring actual and potential output into line in the short run and then keep them equal thereafter. The real federal funds rate employs the log difference of the core PCE price index over the previous four quarters as a proxy for expected inflation, with the staff projection used for the current quarter. Since TIPS indexation is based on the total CPI, the TIPS-consistent measure incorporates an adjustment for the expected difference between CPI inflation and core PCE inflation.
Measure Description
Single-Equation Model
The measure of the equilibrium real rate in the single-equation model is based on an estimated aggregate-demand relationship between the current value of the output gap and its lagged values as well as the lagged values of the real federal funds rate. In light of this model’s simple structure, the short-run measure of the equilibrium real rate depends only on the recent position of output relative to potential, and the medium-run measure is virtually constant.
Small Structural Model
The small-scale model of the economy consists of equations for five variables: the output gap, the equity premium, the federal budget surplus, the trend growth rate of output, and the real bond yield. Unlike the estimates from the single-equation model, values of the equilibrium real rate also depend directly on conditions associated with output growth, fiscal policy, and capital markets.
Large Model (FRB/US)
Estimates of the equilibrium real rate using FRB/US—the staff’s large-scale econometric model of the U.S. economy—depend on a very broad array of economic factors, some of which take the form of projected values of the model’s exogenous variables. These projections make use of several simple forecasting rules which are appropriate for the three-year horizon relevant for the short-run concept but are less sensible over longer horizons. Thus, we report only the short-run measure for the FRB/US model.
Greenbook-consistent
Measures of the equilibrium real rate cannot be directly obtained from the Greenbook forecast, because the Greenbook is not based on a formal model. Rather, we use the FRB/US model in conjunction with an extended version of the Greenbook forecast to derive a Greenbook-consistent measure. FRB/US is first add-factored so that its simulation matches the extended Greenbook forecast, and then a second simulation is run off this baseline to determine the value of the real federal funds rate that closes the output gap. The medium-run concept of the equilibrium real rate is not computed because it requires a relatively long extension of the Greenbook forecast.
TIPS-consistent Yields on TIPS (Treasury Inflation-Protected Securities) incorporate investors’ expectations of the future path of real interest rates. The seven-year instantaneous real forward rate derived from TIPS yields as of the Bluebook publication date reflects the short-term real interest rate expected to prevail in seven years. This forward rate is adjusted down for a term premium, assumed to be 70 basis points, and adjusted up for the difference between total CPI inflation and core PCE inflation, projected to be 40 basis points in the medium run.
Class I FOMC - Restricted Controlled (FR) Page 14 of 35

assessment would also support retention of the phrase indicating that the removal of
policy accommodation can likely proceed at a measured pace.
(12) Investors appear virtually certain that the FOMC will increase the target
federal funds rate 25 basis points at this meeting, and they reportedly put high odds
on an announcement that retains both the measured pace language and the
assessment that the risks to sustainable growth and to price stability should remain
balanced with appropriate policy action. Thus, the market reaction to an
announcement along the lines of Alternative B should be relatively modest, although
rates could back up a little in response to the changes in the wording suggesting that
the FOMC was focusing on the strength in spending and inflation pressures. Barring
significant downside surprises in economic data over coming weeks, investors would
likely come to boost further the already substantial odds placed on additional policy
moves later this year, particularly should public statements by policymakers point to a
continuation of firming.
(13) Recognizing that the cumulative tightening put in place over the past year
has substantially reduced the degree of monetary policy accommodation, the
Committee may believe that the real federal funds rate is now nearing its equilibrium
level. In view of such an assessment as well as the subdued readings on core inflation
in recent months, the FOMC might opt for Alternative A’s combination of a
25-basis-point hike in the funds rate at this meeting and a statement that hints that the
Committee could soon slow the pace of policy firming. This alternative would seem
particularly attractive if members thought that slack in labor markets was greater than
in the staff assessment, implying less need to tighten policy than in the Greenbook.
Even if the Committee believed that it would probably need to tighten policy
somewhat further following a quarter-point step on Tuesday, a near-term pause might
be viewed as prudent to allow more time to evaluate the effects of its cumulative
policy action to date. A funds rate path incorporating a quarter-point tightening at
Class I FOMC - Restricted Controlled (FR) Page 15 of 35

this meeting followed by a shallower trajectory of tightening would be consistent with
the prescriptions from several policy rules (Chart 6).
(14) The draft statement associated with Alternative A could indicate that “The
Committee believes that the degree of monetary policy accommodation has been
substantially reduced,” while again acknowledging that the expansion remains firm
and that labor market conditions continue to improve gradually. Particularly if the
Committee were concerned about a possible slackening in the pace of trend
productivity growth, it might wish to eliminate the previous language pointing to
robust underlying productivity growth as a factor supporting the expansion. With
regard to prices, the statement could indicate that “Core inflation has been relatively
low in recent months, and longer-term inflation expectations remain well contained,”
dropping the reference to inflation pressures. In the penultimate sentence, the
FOMC could indicate that “remaining” policy accommodation can likely be removed
at a measured pace. Alternatively, if the Committee judged that the real federal funds
rate now was in the neighborhood of its equilibrium level, it might choose to drop the
“measured pace” sentence entirely, thus suggesting that further firming could prove to
be unnecessary.
(15) Market participants expect that the path of the intended federal funds rate
will begin to flatten out around year-end, but market commentary and survey evidence
indicate that investors do not anticipate that the FOMC will signal any such
development next week. Accordingly, a statement employing the draft wording
shown in Alternative A would likely produce a noticeable downward shift in interest
rates implied by money market futures quotes, as investors priced in a slower pace of
policy action and probably also revised down the likely extent of cumulative
tightening. That change in policy outlook would likely prompt a rally in bond and
equity markets and some depreciation in the foreign exchange value of the dollar. If
Class I FOMC - Restricted Controlled (FR) Page 16 of 35

Chart 6Actual and Assumed Federal Funds Rate and
Range of Values from Policy Rules and Futures Markets
1988 1989 1990 1991 1992 1993 1994 1995 1996 1997 1998 1999 2000 2001 2002 2003 2004 20050
2
4
6
8
10
0
2
4
6
8
10Percent
Shaded region is the range of values from rules 1a, 2a, 4, 5, and 6 below
Actual federal funds rate and Greenbook assumptionMarket expectations estimated from futures quotes
Values of the Federal Funds Rate from Policy Rules and Futures Markets
2005 2006
Q2 Q3 Q4 Q1 Q2
Rules with Imposed Coefficients 1. Baseline Taylor Rule: a) π*=1.5 3.16 4.23 4.26 4.14 4.25 1. Baseline Taylor Rule: b) π*=2 2.91 3.98 4.01 3.89 4.00 2. Aggressive Taylor Rule: a) π*=1.5 2.55 4.07 4.23 4.09 4.20 3. First-difference Rule: b) π*=2 2.30 3.82 3.98 3.84 3.95 3. First-difference Rule: a) π*=1.5 2.80 3.48 3.87 4.14 4.40 3. First-difference Rule: b) π*=2 2.55 3.23 3.37 3.39 3.40
Rules with Estimated Coefficients 4. Outcome-based Rule 2.67 3.43 3.77 3.89 4.01 5. Greenbook Forecast-based Rule 2.65 3.37 3.60 3.71 3.76 6. FOMC Forecast-based Rule 2.31 2.74 3.01 3.29 3.35 7. TIPS-based Rule 2.90 3.20
Memo Expected federal funds rate derived from futures 3.43 3.88 4.09 4.16 Actual federal funds rate and Greenbook assumption 2.94 3.40 3.90 4.00 4.00
Note: Rule prescriptions for 2005Q3 through 2006Q2 are calculated using current Greenbook projections for inflationand the output gap (or unemployment gap). For rules that contain the lagged funds rate, the rule’s previous prescriptionfor the funds rate is used to compute prescriptions for 2005Q4 through 2006Q2. It is assumed that there is no feedbackfrom the rule prescriptions to the Greenbook projections through 2006Q2. The TIPS-based rule is computed usingaverage TIPS and nominal Treasury yields to date.
Class I FOMC - Restricted Controlled (FR) Page 17 of 35

Policy Rules Chart: Explanatory Notes In all of the rules below, it denotes the federal funds rate, πt the staff estimate at date t of trailing four-quarter core PCE inflation, (yt-yt*) the staff estimate (at date t) of the output gap, π* policymakers’ long-run objective for inflation, it-1 the lagged federal funds rate, gt-1 the residual from the rule’s prescription the previous quarter, (yt+3|t-yt+3|t*) the staff’s three-quarter-ahead forecast of the output gap, (Δ yt+3|t-Δyt+3|t*) the staff’s forecast of output growth less potential output growth three quarters ahead, πt+3|t a three-quarter-ahead forecast of inflation, and (ut+3|t-ut+3|t*) a three-quarter-ahead forecast of the unemployment gap. Data are quarterly averages taken from the Greenbook and staff memoranda closest to the middle of each quarter, unless otherwise noted.
Root-mean-square error
Rule Specification 1988:1-2005:2
2001:1-2005:2
Rules with Imposed Coefficients
1. Baseline Taylor Rule it = 2 + πt + 0.5(yt-yt*) + 0.5(πt-π*) .96a 1.05a
2. Aggressive Taylor Rule it = 2 + πt + (yt-yt*) + 0.5(πt-π*) .68a .62a
3. First-difference Rule
it = it-1 + 0.5(Δ yt+3|t-Δ yt+3|t*) + 0.5(πt+3|t-π*)
.96a .42a
Rules with Estimated Coefficients
4. Estimated Outcome-based Rule Rule includes both lagged interest rate and serial correlation in residual.
it = .51it-1 + 0.49 [1.29 + 0.95(yt-yt*) + 1.45πt]+ 0.52gt-1
.24 .26
5. Estimated Greenbook Forecast-based Rule Rule includes both lagged interest rate and serial correlation in residual.
it = .71it-1 + 0.29 [0.73 + 1.04(yt+3|t-yt+3|t*) + 1.59πt+3|t] + 0.37gt-1
.25 .27
6. Estimated FOMC Forecast-based Rule Unemployment and inflation forecasts are from semiannual “central tendency” of FOMC forecasts, interpolated if necessary to yield 3-qtr-ahead values; ut* forecast is from staff memoranda. Inflation forecasts are adjusted to core PCE deflator basis. Rule is estimated at semiannual frequency, and projected forward using Greenbook forecasts.
it = 0.49it-2 + 0.51 [0.29 ! 2.11(ut+3|t-ut+3|t*) + 1.59πt+3|t]
.46
.63
7. Estimated TIPS-based Rule πcomp5|t denotes the time-t difference between 5-yr nominal Treasury yields and TIPS. Sample begins in 1999 due to TIPS volatility in 1997-8.
it = 0.97it-1+ [-1.24 + 0.69πcomp5|t]
.40b .42
a RMSE for rules with imposed coefficients is calculated setting π*=1.5. b RMSE for TIPS-based rule is calculated for 1999:1-2005:2.
Class I FOMC - Restricted Controlled (FR) Page 18 of 35
the “measured pace” sentence were included, the extent of the rally might be limited
by a recognition that some further policy tightening could still be in the cards.
(16) If the Committee has become significantly more concerned about inflation
pressures of late, it may favor the 50-basis-point increase in the federal funds rate of
Alternative C. Greater worries about inflation prospects could have been prompted
by the brisk growth in aggregate demand apparently in train in the current quarter,
which could be read as suggesting that asset prices are not exerting sufficient restraint
on spending to keep actual output from overshooting its potential before long.
Moreover, members may see the potential for an intensification of cost pressures
stemming from a variety of sources. The further rise in far-dated oil futures prices
over the intermeeting period, for example, suggests that business energy costs will
ratchet up somewhat further in coming months. Also, members may be concerned
about the potential for further acceleration in unit labor costs if their assessment of
the NAIRU is noticeably higher than the staff’s estimate of 5 percent or if they judge
that structural productivity growth could be slowing more sharply than estimated by
the staff. Indeed, the slower growth of productivity in recent quarters as well as the
lower estimates of productivity implied by the annual revisions to the national income
and product accounts might incline policymakers to trim their views of structural
productivity even more than has the staff. And, even if they had a baseline outlook
for the economy and prices similar to that in the Greenbook forecast, members may
prefer lower inflation than the 2 percent core PCE rate projected by the staff for late
2006.
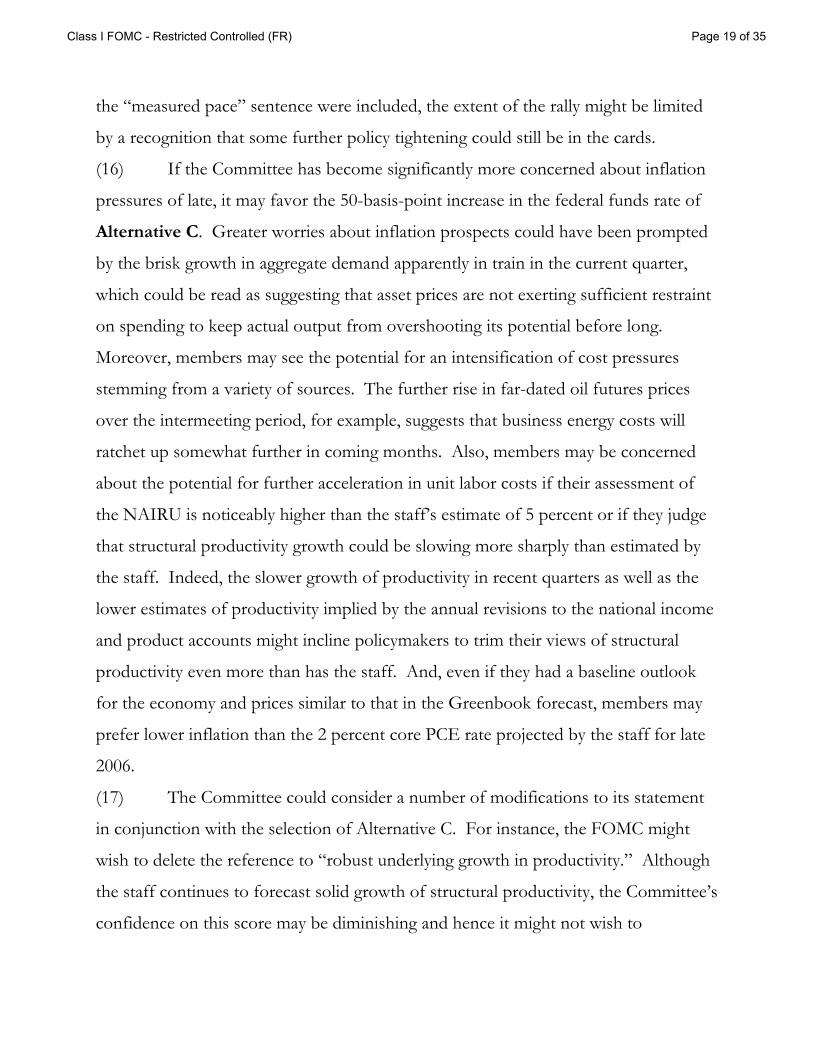
(17) The Committee could consider a number of modifications to its statement
in conjunction with the selection of Alternative C. For instance, the FOMC might
wish to delete the reference to “robust underlying growth in productivity.” Although
the staff continues to forecast solid growth of structural productivity, the Committee’s
confidence on this score may be diminishing and hence it might not wish to
Class I FOMC - Restricted Controlled (FR) Page 19 of 35

characterize the pace of underlying productivity growth so explicitly. The statement
could highlight the strength of the economy by stating that “Aggregate spending
appears to be expanding briskly despite high energy prices.” It could acknowledge
recent price developments while registering some concern about inflation prospects
by noting that “Core inflation has been relatively low in recent months and longer-
term inflation expectations seem well contained, but pressures on business costs and
inflation appear to be increasing.” As discussed in the June Bluebook, the Committee
might also take this opportunity to eliminate the forward-looking language from the
statement, dropping both the risk assessment and the last two sentences referring to
the measured pace of tightening and to the Committee’s commitment to respond to
economic developments as needed to maintain price stability.
(18) Market participants would no doubt be taken aback by the combination of a
50-basis-point increase in the funds rate at this meeting and the announcement
suggested for Alternative C. Investors might infer that policy firming in the current
cycle would likely bring the funds rate appreciably above 4¼ percent, the peak funds
rate that seems to be currently incorporated in market prices. Moreover, with the
elimination of the measured-pace language, market participants might come to believe
that at least some of that rate gap could be covered in additional 50-basis-point
strides. With the expected policy path pushed sharply upward and little forward-
looking guidance provided by the FOMC, investors’ uncertainty regarding the future
path of policy would likely increase. In all likelihood, the upward revision to policy
expectations would trigger a sell-off in fixed-income and equity markets and a rise in
the foreign-exchange value of the dollar, although the increase in long-term yields and
appreciation of the dollar could be limited if the drop in share prices were especially
sharp. If the FOMC were particularly concerned about inflation pressures but was
not prepared to hike rates 50 basis points at this meeting, it could couple a quarter-
point move with some of the changes in the statement suggested for Alternative C.
Class I FOMC - Restricted Controlled (FR) Page 20 of 35

Such a pairing would temper the surprise to market participants, but it would
probably still lead them to mark up significantly their expectations of policy firming.
Money and Debt Forecasts
(19) Under the Greenbook forecast, M2 growth this year and next is projected at
only about 2¼ percent and 3½ percent, respectively (Table 2). M2 velocity is
expected to increase modestly further over the forecast period. However, the
projected flat yield curve should support the demand for M2 assets, and thus velocity
is likely to remain below the level suggested by historical relationships among money,
nominal income, and short-run opportunity costs. The growth of domestic
nonfinancial sector debt is forecast to step down somewhat this year and to slow
further in 2006. Borrowing by households is expected to drop off considerably,
largely reflecting a deceleration in mortgage debt as the pace of home price
appreciation slows and activity in the housing market flattens out. Federal borrowing
is also likely to slow a little as the budget deficit narrows a bit. Despite rising capital
expenditures, business borrowing is projected to remain moderate this year and next,
as some firms meet their funding needs by drawing on their large stockpiles of liquid
assets and on repatriations of retained income from abroad. Overall, domestic
nonfinancial sector debt is expected to expand 7½ percent in 2005 and 6 percent in
2006, down from about 8½ percent in 2004.
Class I FOMC - Restricted Controlled (FR) Page 21 of 35

Table 2Alternative Growth Rates for M2 (percent, annual rate)
Raise 25 bp* Raise 50 bp** Greenbook***Monthly Growth Rates
Jan-05 2.7 2.7 2.7Feb-05 2.8 2.8 2.8Mar-05 3.9 3.9 3.9Apr-05 -0.6 -0.6 -0.6
May-05 0.2 0.2 0.2Jun-05 6.0 6.0 6.0Jul-05 1.3 1.3 1.3
Aug-05 1.3 1.1 1.3Sep-05 1.5 1.0 1.3Oct-05 1.9 1.1 1.3Nov-05 2.4 1.6 1.2Dec-05 2.7 2.1 1.2
Quarterly Growth Rates2004 Q4 5.7 5.7 5.72005 Q1 3.7 3.7 3.72005 Q2 1.7 1.7 1.72005 Q3 2.3 2.1 2.22005 Q4 2.0 1.3 1.3
Annual Growth Rates2004 5.2 5.2 5.22005 2.4 2.2 2.32006 4.0 3.8 3.4
Growth From To2004 Q4 Jul-05 2.7 2.7 2.72004 Q4 Sep-05 2.5 2.4 2.4
Dec-05 Jun-05 1.8 1.4 1.3Jul-05 Dec-05 2.0 1.4 1.3
* Increase of 25 basis points in the target federal funds rate at this meeting and no change thereafter.** Increase of 50 basis points in the target federal funds rate at this meeting and no change thereafter.*** This forecast is consistent with norminal GDP and interest rates in the Greenbook forecast.
Class I FOMC - Restricted Controlled (FR) Page 22 of 35

Directive and Balance of Risks Statement
(20) Draft language for the directive and draft risk assessments identical to those
presented in Table 1 are provided below.
Directive Wording The Federal Open Market Committee seeks monetary and financial
conditions that will foster price stability and promote sustainable growth
in output. To further its long-run objectives, the Committee in the
immediate future seeks conditions in reserve markets consistent with
MAINTAINING/increasing/REDUCING the federal funds rate
AT/to an average of around ____________ 3¼ percent.
Risk Assessments
A. The Committee perceives that, with appropriate monetary policy
action, the upside and downside risks to the attainment of both
sustainable growth and price stability should be kept roughly equal.
With underlying inflation expected to be contained, the Committee
believes that remaining policy accommodation can be removed at a
pace that is likely to be measured. Nonetheless, the Committee will
respond to changes in economic prospects as needed to fulfill its
obligation to maintain price stability.
B. The Committee perceives that, with appropriate monetary policy
action, the upside and downside risks to the attainment of both
sustainable growth and price stability should be kept roughly equal.
With underlying inflation expected to be contained, the Committee
believes that policy accommodation can be removed at a pace that is
likely to be measured. Nonetheless, the Committee will respond to
Class I FOMC - Restricted Controlled (FR) Page 23 of 35

changes in economic prospects as needed to fulfill its obligation to
maintain price stability.
C. None.
Class I FOMC - Restricted Controlled (FR) Page 24 of 35

Appendix Chart 1
Treasury Yield Curve
1960 1963 1966 1969 1972 1975 1978 1981 1984 1987 1990 1993 1996 1999 2002 2005
−4
−2
0
2
4Percentage Points
+ Denotes most recent weekly value.Note. Blue shaded regions denote NBER−dated recessions.
+
Spread Between Ten−year Treasury Yield and Federal Funds Rate
Quarterly
1 3 5 7 10 20
3.0
3.5
4.0
4.5
5.0
5.5
6.0Percent
August 4, 2005 June 29, 2005
Treasury Yield Curve*
Maturity in Years*Smoothed yield curve estimated from off−the−run Treasury coupon securities. Yields shown are those on notional par Treasury securities with semi−annual coupons.
Class I FOMC - Restricted Controlled (FR) Page 25 of 35

Appendix Chart 2
Dollar Exchange Rate Indexes
1973 1976 1979 1982 1985 1988 1991 1994 1997 2000 2003
80
90
100
110
120
130
140
150
Ratio ScaleMarch 1973=100
+ Denotes most recent weekly value.
+
Nominal
Major Currencies
Monthly
1973 1976 1979 1982 1985 1988 1991 1994 1997 2000 2003
80
90
100
110
120
130
140
Ratio ScaleMarch 1973=100
Real
MajorCurrencies
Broad
Other Important
Monthly
Note. The major currencies index is the trade−weighted average of currencies of the Euro area, Canada, Japan, the U.K., Switzerland, Australia, and Sweden. The other important trading partners index is the trade−weighted average of currencies of 19 other important trading partners. The Broad index is the trade−weighted average of currencies of all important trading partners. Real indexes have been adjusted for relative changes in U.S. and foreign consumer prices. Blue shaded regions denote NBER−dated recessions.
Class I FOMC - Restricted Controlled (FR) Page 26 of 35

Appendix Chart 3
Stock Indexes
0
5
10
15
20
25
30
35
40
45Ratio
+
1960 1963 1966 1969 1972 1975 1978 1981 1984 1987 1990 1993 1996 1999 2002 2005
500
1000
1500
2000
Ratio Scale1941−43=10
* Based on trailing four−quarter earnings.+ Denotes most recent weekly value.
+
Nominal
Monthly
P/E Ratio*
S&P 500
1960 1963 1966 1969 1972 1975 1978 1981 1984 1987 1990 1993 1996 1999 2002 2005
20
40
60
80
100
120
140160
Ratio Scale1941−43=10
* Deflated by the CPI.+ Denotes most recent weekly value.Note. Blue shaded regions denote NBER−dated recessions.
+
Real
Monthly
S&P 500*
Class I FOMC - Restricted Controlled (FR) Page 27 of 35

Appendix Chart 4
One−Year Real Interest Rates
1985 1987 1989 1991 1993 1995 1997 1999 2001 2003 2005−4
0
4
8Percent
* Mean value of respondents.
+
Monthly
One−Year Treasury Constant Maturity Yield Less One−Year Inflation Expectations (Michigan Survey)*
1985 1987 1989 1991 1993 1995 1997 1999 2001 2003 2005−4
0
4
8Percent
* ASA/NBER quarterly survey until 1990:Q1; Philadelphia Federal Reserve Bank Survey of Professional Forecastersthereafter. Median value of respondents.
++
GDP Deflator
CPI
Monthly
One−Year Treasury Constant Maturity Yield Less One−Year Inflation Expectations (Philadelphia Fed)*
1985 1987 1989 1991 1993 1995 1997 1999 2001 2003 2005−4
0
4
8Percent
+ Denotes most recent weekly Treasury constant maturity yield less most recent inflation expectation.Note. Blue shaded regions denote NBER−dated recessions.
+
Monthly
One−Year Treasury Constant Maturity Yield Less Change in the Core CPI from Three Months Prior
Class I FOMC - Restricted Controlled (FR) Page 28 of 35

Appendix Chart 5
Long−Term Real Interest Rates*
1985 1987 1989 1991 1993 1995 1997 1999 2001 2003 2005 0
2
4
6
8
10Percent
+
+
+
Monthly
Real Ten−Year Treasury Yields
Real rate usingPhiladelphia Fed Survey
Real rate usingMichigan Survey
Ten−year TIPS yield
1985 1987 1989 1991 1993 1995 1997 1999 2001 2003 2005
2
4
6
8
10
12
14Percent
+
++
Nominal and Real Corporate Bond Rates
Monthly
Nominal rate on Moody’sA−rated corporate bonds
Real rate usingPhiladelphia Fed Survey
Real rate usingMichigan Survey
* For real rates, measures using the Philadelphia Fed Survey employ the ten−year inflation expectations from the Blue Chip Survey until April 1991 and the Philadelphia Federal Reserve Bank Survey of Professional Forecasters thereafter (median value of respondents). Measures using the Michigan Survey employ the five− to ten−year inflation expectations from that survey (mean value of respondents).
+ For TIPS and nominal corporate rate, denotes the most recent weekly value. For other real rate series, denotes the most recent weekly nominal yield less the most recent inflation expectation. Note. Blue shaded regions denote NBER−dated recessions.
Class I FOMC - Restricted Controlled (FR) Page 29 of 35

Appendix Chart 6
Commodity Price Measures
1985 1987 1989 1991 1993 1995 1997 1999 2001 2003 2005
70
80
90
100
110
120
130140
Ratio scale, index (1980=100)Journal of Commerce Index
Weekly
Total
Metals
1985 1987 1989 1991 1993 1995 1997 1999 2001 2003 2005
220
240
260
280
300
320
340360380
Ratio scale, index (1967=100)CRB Spot Industrials
Weekly
1985 1987 1989 1991 1993 1995 1997 1999 2001 2003 2005180
200
220
240
260
280
300
320
340Ratio scale, index (1967=100)
Note. Blue shaded regions denote NBER−dated recessions.
CRB Futures
Weekly
Class I FOMC - Restricted Controlled (FR) Page 30 of 35

Appendix Chart 7
Growth of Real M2 and M3
1960 1963 1966 1969 1972 1975 1978 1981 1984 1987 1990 1993 1996 1999 2002 2005
−5
0
5
10Percent
1960 1963 1966 1969 1972 1975 1978 1981 1984 1987 1990 1993 1996 1999 2002 2005
−5
0
5
10Percent
M2
Quarterly
1960 1963 1966 1969 1972 1975 1978 1981 1984 1987 1990 1993 1996 1999 2002 2005
−5
0
5
10
15Percent
1960 1963 1966 1969 1972 1975 1978 1981 1984 1987 1990 1993 1996 1999 2002 2005
−5
0
5
10
15Percent
M3
Quarterly
Note. Four−quarter moving average deflated by the CPI. Blue shaded regions denote NBER−dated recessions. Dashed areas denote projection period.
Class I FOMC - Restricted Controlled (FR) Page 31 of 35

Appendix Chart 8
Inflation Indicator Based on M2
Note: P* is defined to equal M2 times V* divided by potential GDP. V*, or long-run velocity, is estimatedusing average velocity over the 1959:Q1-to-1989:Q4 period and then, after a break, over the interval from1993:Q1 to the present. For the forecast period, P* is based on the staff M2 forecast and P is simulated using ashort-run dynamic model relating P to P*. Blue areas indicate periods in which P* is notably less than P.Gray areas denote the projection period.
1965 1968 1971 1974 1977 1980 1983 1986 1989 1992 1995 1998 2001 2004
40
60
80
100
120
140Ratio ScalePrice Level
Quarterly
Implicit GDPprice deflator (P) Long-run equilibrium
price level (P*)
1965 1968 1971 1974 1977 1980 1983 1986 1989 1992 1995 1998 2001 2004
40
60
80
100
120
140Ratio Scale
1965 1968 1971 1974 1977 1980 1983 1986 1989 1992 1995 1998 2001 2004
2
4
6
8
10
12PercentInflation 1
Quarterly
1965 1968 1971 1974 1977 1980 1983 1986 1989 1992 1995 1998 2001 2004
2
4
6
8
10
12Percent
1. Change in the implicit GDP price deflator over the previous four quarters.
Class I FOMC - Restricted Controlled (FR) Page 32 of 35

Short-term Long-term
Federalfunds
Treasury billssecondary market
CDssecondary
market
Comm.paper Off-the-run Treasury yields Indexed yields Moody’s
Baa
MunicipalBondBuyer
Conventional homemortgages
primary market
4-week 3-month 6-month 3-month 1-month 2-year 5-year 10-year 20-year 5-year 10-year Fixed-rate ARM
1 2 3 4 5 6 7 8 9 10 11 12 13 14 15 16
2.34 2.08 2.28 2.63 2.51 2.29 3.13 4.10 5.03 5.64 1.57 2.28 6.90 5.45 6.34 4.270.92 0.73 0.87 0.96 1.04 0.97 1.49 2.65 3.84 4.68 0.40 1.38 6.00 4.73 5.38 3.36
3.38 3.34 3.49 3.73 3.72 3.40 4.09 4.32 4.73 5.04 1.78 2.00 6.22 5.04 6.04 4.472.19 1.86 2.31 2.63 2.50 2.24 3.11 3.58 3.97 4.28 0.98 1.50 5.64 4.72 5.53 4.10
1.43 1.37 1.51 1.76 1.68 1.48 2.50 3.49 4.43 5.12 1.15 1.88 6.46 5.18 5.87 4.061.61 1.54 1.68 1.91 1.86 1.67 2.51 3.35 4.26 4.96 1.12 1.82 6.27 5.04 5.75 3.991.76 1.62 1.79 2.05 2.04 1.79 2.57 3.35 4.24 4.92 1.00 1.76 6.21 4.99 5.72 4.021.93 1.91 2.11 2.33 2.26 2.01 2.86 3.52 4.32 4.95 0.93 1.68 6.20 5.06 5.73 4.152.16 1.95 2.23 2.50 2.45 2.22 3.02 3.59 4.34 4.94 0.97 1.65 6.15 5.03 5.75 4.18
2.28 2.02 2.38 2.68 2.61 2.33 3.23 3.70 4.32 4.82 1.15 1.72 6.02 4.92 5.71 4.122.50 2.36 2.59 2.85 2.77 2.49 3.39 3.76 4.25 4.65 1.10 1.63 5.82 4.87 5.63 4.162.63 2.64 2.80 3.09 2.97 2.67 3.74 4.15 4.59 4.92 1.27 1.77 6.06 5.01 5.93 4.232.79 2.63 2.84 3.14 3.09 2.84 3.67 3.99 4.42 4.78 1.21 1.69 6.05 4.93 5.86 4.253.00 2.62 2.90 3.17 3.22 2.97 3.65 3.84 4.22 4.59 1.25 1.65 6.01 4.83 5.72 4.233.04 2.82 3.03 3.22 3.38 3.11 3.65 3.76 4.07 4.38 1.37 1.67 5.86 4.77 5.58 4.243.26 3.09 3.29 3.53 3.57 3.27 3.90 3.98 4.25 4.50 1.64 1.88 5.95 4.85 5.70 4.40
3.02 2.79 2.98 3.14 3.29 3.00 3.55 3.68 4.02 4.37 1.24 1.58 5.83 4.72 5.62 4.262.99 2.81 3.01 3.14 3.33 3.03 3.62 3.73 4.04 4.35 1.34 1.64 5.80 4.75 5.56 4.213.02 2.77 3.00 3.22 3.37 3.11 3.73 3.86 4.18 4.49 1.47 1.76 5.96 4.83 5.63 4.253.00 2.80 3.04 3.27 3.42 3.17 3.65 3.76 4.07 4.38 1.40 1.70 5.87 4.76 5.57 4.233.20 2.95 3.15 3.35 3.46 3.22 3.67 3.75 4.04 4.34 1.40 1.69 5.84 4.77 5.53 4.243.25 3.01 3.18 3.40 3.52 3.22 3.79 3.87 4.16 4.43 1.52 1.80 5.93 4.82 5.62 4.333.26 3.01 3.22 3.47 3.55 3.25 3.87 3.95 4.23 4.48 1.62 1.89 5.95 4.84 5.66 4.393.25 3.10 3.32 3.57 3.59 3.28 3.93 4.02 4.29 4.54 1.72 1.94 5.99 4.87 5.73 4.423.27 3.22 3.42 3.67 3.63 3.33 4.00 4.08 4.31 4.55 1.73 1.92 5.95 4.86 5.77 4.46 -- 3.32 3.48 3.73 3.70 3.39 4.07 4.15 4.39 4.62 1.76 1.96 -- -- 5.82 4.47
3.13 3.13 3.31 3.54 3.59 3.25 3.90 3.99 4.27 4.52 1.71 1.93 5.98 -- -- --3.25 3.10 3.30 3.54 3.58 3.30 3.91 3.98 4.24 4.49 1.70 1.90 5.94 -- -- --3.27 3.12 3.34 3.60 3.59 3.29 3.98 4.09 4.35 4.60 1.74 1.95 6.04 -- -- --3.25 3.14 3.37 3.61 3.61 3.28 3.94 4.04 4.30 4.54 1.69 1.90 5.98 -- -- --3.28 3.17 3.45 3.68 3.61 3.31 3.97 4.06 4.31 4.56 1.73 1.94 5.97 -- -- --3.25 3.24 3.44 3.67 3.62 3.31 3.98 4.06 4.31 4.55 1.73 1.93 5.96 -- -- --3.27 3.22 3.40 3.67 3.63 3.34 4.01 4.10 4.33 4.57 1.74 1.93 5.98 -- -- --3.27 3.24 3.40 3.65 3.65 3.34 3.98 4.04 4.26 4.50 1.70 1.88 5.88 -- -- --3.31 3.24 3.41 3.68 3.66 3.37 4.05 4.12 4.35 4.58 1.73 1.91 5.95 -- -- --3.30 3.28 3.49 3.73 3.68 3.37 4.07 4.15 4.39 4.61 1.76 1.96 5.99 -- -- --3.20 3.34 3.49 3.73 3.69 3.40 4.09 4.16 4.41 4.64 1.78 1.99 6.02 -- -- --3.35 3.33 3.46 3.72 3.70 3.39 4.06 4.13 4.37 4.60 1.73 1.94 6.00 -- -- --3.38 3.33 3.47 3.72 3.72 -- 4.08 4.15 4.39 4.61 1.74 1.94 -- -- -- --
Appendix Table 1
Selected Interest Rates(Percent)
NOTE: Weekly data for columns 1 through 13 are week-ending averages. Columns 2 through 4 are on a coupon equivalent basis. Data in column 6 are interpolated from data on certain commercial paper trades settled by theDepository Trust Company. Column 14 is the Bond Buyer revenue index, which is a 1-day quote for Thursday. Column 15 is the average contract rate on new commitments for fixed-rate mortgages (FRMs) with 80 percentloan-to-value ratios at major institutional lenders. Column 16 is the average initial contract rate on new commitments for 1-year, adjustable-rate mortgages (ARMs) at major institutional lenders offering both FRMs andARMs with the same number of discount points.
p - preliminary data
Aug Sep Oct Nov Dec Jan Feb Mar Apr May Jun Jul
Jun Jun Jun Jun Jul Jul Jul Jul Jul Aug
Jul Jul Jul Jul Jul Jul Jul Jul Jul Aug Aug Aug Aug
0404040404
05050505050505
3101724
18
152229
5
192021222526272829
1234
05050505050505050505
05050505050505050505050505
04 -- High-- Low
05 -- High-- Low
Monthly
Weekly
Daily
p
MFMA
Class I FOMC - Restricted Controlled (FR) Page 33 of 35
Appendix Table 2Money Aggregates
Seasonally Adjusted
nontransactions components
in M2 in M3 onlyM1 M2 M3
1 2 3 4 5
Period
Annual growth rates (%):
Annually (Q4 to Q4)2002 3.3 6.8 7.7 5.9 6.52003 7.1 5.4 5.0 3.6 4.82004 5.4 5.2 5.2 7.1 5.8
Quarterly (average)2004-Q3 3.6 3.5 3.5 5.7 4.2
Q4 5.5 5.7 5.7 -0.3 3.82005-Q1 0.7 3.7 4.6 8.4 5.2
Q2 -0.7 1.7 2.3 13.3 5.4
Monthly2004-July -6.6 0.3 2.2 0.8 0.5
Aug. 16.2 4.1 0.8 4.6 4.2Sep. 3.9 6.6 7.4 5.3 6.2Oct. 0.1 5.1 6.4 -7.1 1.1Nov. 13.2 6.9 5.2 -2.8 3.8Dec. -1.1 4.5 6.1 9.2 6.0
2005-Jan. -8.2 2.7 5.6 13.4 6.1Feb. 6.8 2.8 1.7 7.7 4.4Mar. 6.5 3.9 3.1 3.7 3.8Apr. -15.2 -0.6 3.3 20.3 6.2May 10.4 0.2 -2.4 12.6 4.3June -0.5 6.0 7.7 17.5 9.8July e -15.9 1.3 5.9 4.3 2.3
Levels ($billions):
Monthly2005-Feb. 1364.0 6451.6 5087.6 3081.2 9532.9
Mar. 1371.4 6472.3 5100.9 3090.7 9562.9Apr. 1354.0 6469.1 5115.0 3142.9 9612.0May 1365.7 6470.3 5104.7 3176.0 9646.3June 1365.1 6502.7 5137.6 3222.2 9724.9
Weekly2005-June 6 1356.7 6491.7 5135.0 3201.9 9693.5
13 1341.0 6474.1 5133.1 3233.5 9707.620 1370.5 6508.9 5138.5 3206.6 9715.527 1376.8 6513.7 5136.9 3237.7 9751.5
July 4 1370.6 6515.2 5144.6 3228.5 9743.711 1331.7 6493.4 5161.8 3225.4 9718.818p 1331.8 6518.1 5186.3 3230.8 9748.925p 1357.8 6518.1 5160.3 3243.1 9761.2
p preliminar ye estimated
Class I FOMC - Restricted Controlled (FR) Page 34 of 35

Class I FOMC - Restricted Controlled (FR) Page 35 of 35