Embed Size (px)
Citation preview
UNIVERSITI PUTRA MALAYSIA
ECONOMIC ANALYSIS ON THE RELATIONSHIP BETWEEN MEDICALCOST, OBESITY, HEALTH OUTCOMES AND LABOUR MARKET IN
MALAYSIA
FOO LEE PENG
FEP 2018 9
© COPYRIG
HT UPM
i
ECONOMIC ANALYSIS ON THE RELATIONSHIP BETWEEN MEDICAL COST, OBESITY, HEALTH OUTCOMES AND LABOUR MARKET IN
MALAYSIA
By
FOO LEE PENG
Thesis Submitted to the School of Graduate Studies, Universiti Putra Malaysia, in Fulfillment of the Requirements for the Degree of Doctor of Philosophy
September 2017

© COPYRIG
HT UPM
ii
COPYRIGHT
All materials contained within the thesis, including without limitation text, logos, icons photographs and all other artwork, is copyright material of Universiti Putra Malaysia unless otherwise stated. Use may be made of any material contained within the thesis for non-commercial purposes from the copyright holder. Commercial use of the material may only be made with the express, prior, written permission of Universiti Putra Malaysia.
Copyright © Universiti Putra Malaysia

© COPYRIG
HT UPM
iii
DEDICATION
This thesis is dedicated to my parents and fiancé for their endless love, support and encouragement.

© COPYRIG
HT UPM
i
Abstract of thesis presented to the Senate of Universiti Putra Malaysia in fulfilment of the requirement for the degree of Doctor of Philosophy
ECONOMIC ANALYSIS ON THE RELATIONSHIP BETWEEN MEDICALCOST, OBESITY, HEALTH OUTCOMES AND LABOUR MARKET IN
MALAYSIA
By
FOO LEE PENG
September 2017
Chairman : Hanny Zurina Binti Hamzah, PhD Faculty : Economics and Management
Obesity has reached epidemic levels worldwide, including Malaysia. Although the government of Malaysia had introduced various programs to reverse the obesity epidemic, there is no significant change in outcome. In fact, obesity prevalence remains high and even shows dramatic increase although many efforts have been done. Thus, this study takes a critical look at the economic cost of obesity via direct cost and indirect cost. The study intends to (a) identify the relationship between Body Mass Index (BMI) and personal medical cost, (b) examine the burden of obesity via the Disability-Adjusted Life Year (DALY); (c) examine obesity and its effect on labour market performance. For the first objective, Generalized Linear Models (GLMs) is utilized on patient level data obtain from Serdang Hospital in year 2011. The second objective, the mortality data was obtained from Department of Statistics; while prevalence and incidence data were extracted from existing literature and computed by DISMOD II. DISMOD II is a software tool introduced by the World Health Organization to check the consistency of estimates of incidence, prevalence, duration and case fatality for diseases. Lastly, for the third objective, an ordinal regression is performed by using the data retrieved from self-administered questionnaire. A total of 531 candidates who aged 20 to 59 years old responds to the questionnaires via face-to-face interviews and online questionnaire.After carefully selection, only 391 respondents were including in the analysis. The findings from the first objective suggest obese patients paid lower personal medical cost as they are covered mainly by the public hospital policies and government subsidies. The policy was aimed to improve the welfare of the citizen in overall health status, but it isfair to say that it has wrongly promoting obesity related diseases (or urban diseases due to lifestyle choices) which makes the obese patients pay lower personal medical cost. Asfor the second objective, population attribution fraction and disability-adjusted life year were applied to quantify years of life lost from premature death and number of years lost due to disability resulting from obesity. PAF is the proportional reduction

© COPYRIG
HT UPM
ii
in population disease or mortality if the population were entirely unexposed compare to the present exposure pattern. The burden of disease attributable to obesity was 2951 PYsand 1657 PYs per 1000 person for men and women respectively. Among all obesity related diseases worldwide, hypertension has the most significant burden of disease attributable to being obese, where men were 523 PYs per 1000 persons; this was followed by women 524 PYs per 1000 persons. On the other hand, the result from third objective suggests that employers do not consider workers appearance in their hiringprocess. The key success to employment is primary depending on education level and age (assuming age increases substantially with experiences). However, the obese workers admitted that they received unfavorable treatment during the employment. Thus, this study would like to propose further research in using questionnaires to distinguish between private and public servants, which will help to eliminate the sticky effect on their salaries. The outcome of this study is crucial as it gives comprehensive information on the consequences of obesity to the overall economic. The information from this study also enables the authorities to develop activities and programs to combat obesity and to maintain healthy lifestyle among Malaysians.
© COPYRIG
HT UPM
iii
Abstrak tesis yang dikemukakan kepada Senat Universiti Putra Malaysia sebagai memenuhi keperluan untuk ijazah Doktor Falsafah
ANALISIS EKONOMI PADA HUBUNGAN ANTARA KOS PERUBATAN, OBESITI, HASIL KESIHATAN DAN PASARAN BURUH DI MALAYSIA
Oleh
FOO LEE PENG
September 2017
Pengerusi : Hanny Zurina Binti Hamzah, PhD Fakulti : Ekonomi dan Pengurusan
Obesiti telah mencapai tahap epidemik di seluruh dunia, termasuk Malaysia. Walaupun kerajaan Malaysia telah memperkenalkan pelbagai program untuk mengurangkan gejala obesiti, namun perkara ini belum mampu membawa perubahan yang ketara. Malah, prevalens obesiti masih kekal tinggi dan menunjukkan peningkatan yang dramatik walaupun banyak usaha menanganinya telah dilakukan. Oleh itu, kajian ini mengambil kira secara kritikal kesan terhadap kos ekonomi disebabkan obesiti menerusi kos langsung dan kos tidak langsung. Kajian ini bertujuan (a) mengenal pasti hubungan antara kos perubatan individual dan Indeks Jisim Tubuh (BMI), (b) memeriksa beban obesiti melalui kecacatan terlaras tahun hayat yang terjejas oleh ketidakupayaan (the disability-adjusted life year), dan (c) mengkaji obesiti dan kesannya terhadap prestasi pasaran buruh. Bagi objektif pertama, model linear umum (generalized linear models)digunakan ke atas data pesakit tahun 2011 yang diperoleh dari Hospital Serdang. Bagi objektif kedua, data kematian telah diperoleh daripada Jabatan Perangkaan; manakala data prevalens dan insidens merupakan hasil ekstrak kajian terdahulu dan dikira di dalam DISMOD II. DISMOD II adalah alat perisian yang diperkenalkan oleh Pertubuhan Kesihatan Sedunia untuk memeriksa konsistensi anggaran kejadian, kelaziman, durasi dan kes kematian bagi penyakit. Akhir sekali, bagi objektif ketiga, data dari hasil borang soal selidik yang diperoleh telah menggunkan metodologi regresi ordinal (ordinal regression). Sebanyak 531 calon yang berumur 20 hingga 59 tahun menjawab soalan-soalan melalui temu bual secara bersemuka dan soal selidik dalam talian. Selepas pemilihan yang teliti, hanya 391 responden termasuk dalam analisis. Penemuan dari objektif pertama mencadangkan pesakit obesiti membayar kos perubatan peribadi yang lebih rendah disebabkan kebanyakkan kos itu kebanyakanya ditanggung oleh dasar hospital kerajaan dan subsidi kerajaan. Pada mulanya, dasar ini adalah bertujuan untukmemperbaiki kebajikan masyarakat secara keseluruhan namun ia adalah adil untuk berkata bahawa ia adalah salah dengan mempromosikan penyakit berkaitan denganobesiti (ataupun penyakit yang disebabkan oleh pilihan gaya hidup) di mana
© COPYRIG
HT UPM
iv
menyebabkan pesakit obesiti membayar kos perubatan peribadi yang rendah. Bagi objektif kedua, pecahan pembahagian populasi (population attribution fraction) dan tahun hayat terjejas oleh ketidakupayaan (disability-adjusted life year) telah digunakan untuk mengukur jumlah tahun atau hayat kehidupan yang hilang akibat daripada kematian pramatang serta kecacatan yang disebabkan oleh obesiti. PAF adalah pengurangan proporsional dalam penyakit atau kematian jika populasi tidak didedahkan penyakit sama sekali berbanding dengan pendedahan sekarang. Beban penyakit yang disebabkan oleh obesiti adalah 2951 PYs dan 1657 PYs bagi setiap 1000 orang untuk lelaki dan wanita. Di antara semua penyakit berkaitan obesiti di seluruh dunia, hipertensi mempunyai beban penyakit paling ketara yang disebabkan oleh obesiti, di mana lelaki adalah 523 PYs bagi setiap 1000 orang; ini diikuti oleh wanita 524 PYs bagi setiap 1000 orang. Selain itu, keputusan daripada objektif ketiga mencadangkan majikan tidak mengambil kira penampilan pekerja sewaktu mengambil perkerja. Kejayaan utama untuk pekerjaan adalah bergantung kepada tahap pendidikan dan umur (dengan mengandaikan usia meningkat selari dengan pengalaman). Walau bagaimanapun, pekerja yang obes mengakui bahawa mereka menerima layanan yang tidak baik semasa bekerja. Oleh itu, kajian ini ingin mencadangkan penyelidikan lanjut dengan menggunakan soal selidik untuk membezakan antara penjawat awam dan swasta, di mana ia akan membantu menghapuskan kesan melekat pada gaji mereka. Hasil kajian ini penting kerana ia memberikan maklumat yang komprehensif tentang kesan obesiti kepada keadaan ekonomi secara keseluruhan. Maklumat daripada kajian ini juga membolehkan pihak berkuasa untuk membangunkan pelbagai a k t i vi t i danpr ogr a m un t u k m em erangi obesi t i dan mengekalkan ga ya h idup sihat di kalangan rakyat Malaysia.

© COPYRIG
HT UPM
v
ACKNOWLEDGEMENTS
It is a humbling experience to acknowledge those people who have, mostly out of kindness, helped along the journey of my Ph.D. I am indebted to so many for encouragement and support.
I would first like to thank my supervisor Dr Hanny Zurina Hamzah. It has been an honor to be her first Ph.D. student. The door to her office was always open whenever I ran into a trouble or had questions about my research. I had almost given up and was ready to quit graduate school before I met her. She consistently motivates me whenever I was depressed and steered me in to the right direction whenever she thought I needed it. Iappreciate all her contributions of time, ideas, and funding to make my Ph.D. experience productive and stimulating.
I would also like to thank my committee members, Dr. Norashidah Mohamed Nor and Dr. Rusmawati Said who always provided me their generous advices, inspiring guidance and encouragement throughout my research. This thesis could not have been completed without their untiring and professional assistance.
My greatest gratitude goes to my friend, Peggy Lee who always on my side, thank you for listening, offering me advices, and supporting me through this entire process.
Last but not least, I would like to thank my family and fiancé for supporting me throughout the years, financially, practically and with moral support, especially my parents. They are all my source of encouragement and inspiration throughout my life. My fiancé, Young; thank you for everything you have done. I would not have finished this thesis without your endless support.

© COP
UPM
© COPYRIG
HT UPM
vii
This thesis was submitted to the Senate of Universiti Putra Malaysia and has been accepted as fulfilment of the requirement for the degree of Doctor of Philosophy. The members of the Supervisory Committee were as follows:
Hanny Zurina Binti Hamzah, PhD Senior Lecturer Faculty of Economic and Management Universiti Putra Malaysia (Chairman)
Norashidah Mohamed Nor, PhD Senior Lecturer Faculty of Economic and Management Universiti Putra Malaysia (Member)
Rusmawati Said, PhDAssociate Professor Faculty of Economic and Management Universiti Putra Malaysia (Member)
___________________________ ROBIAH BINTI YUNUS, PhD Professor and Dean School of Graduate Studies Universiti Putra Malaysia
Date :

© COPYRIG
HT UPM
viii
Declaration by graduate student
I hereby confirm that:
� this thesis is my original work;
� quotations, illustrations and citations have been duly referenced;
� this thesis has not been submitted previously or concurrently for any other degree at any other institutions;
� intellectual property from the thesis and copyright of thesis are fully-owned by Universiti Putra Malaysia, as according to the Universiti Putra Malaysia (Research) Rules 2012;
� written permission must be obtained from supervisor and the office of Deputy Vice-Chancellor (Research and Innovation) before thesis is published (in the form of written, printed or in electronic form) including books, journals, modules, proceedings, popular writings, seminar papers, manuscripts, posters, reports, lecture notes, learning modules or any other materials as stated in the Universiti Putra Malaysia (Research) Rules 2012;
� there is no plagiarism or data falsification/fabrication in the thesis, and scholarly integrity is upheld as according to the Universiti Putra Malaysia (Graduate Studies) Rules 2003 (Revision 2012-2013) and the Universiti Putra Malaysia (Research) Rules 2012. The thesis has undergone plagiarism detection software.
Signature: Date:
Name and Matric No: Foo Lee Peng, GS36351
© COPYRIG
HT UPM
ix
Declaration by Members of Supervisory Committee
This is to confirm that:
� the research conducted and the writing of this thesis was under our supervision;
� supervision responsibilities as stated in the Universiti Putra Malaysia (Graduate Studies) Rules 2003 (Revision 2012-2013) are adhered to.
Signature:
Name of Chairman of Supervisory Committee: Dr. Hanny Zurina Binti Hamzah
Signature:
Name of Memberof Supervisory Committee: Dr. Norashidah Mohamed Nor
Signature:
Name of Memberof Supervisory Committee: Associate Professor Dr. Rusmawati Said
© COPYRIG
HT UPM
x
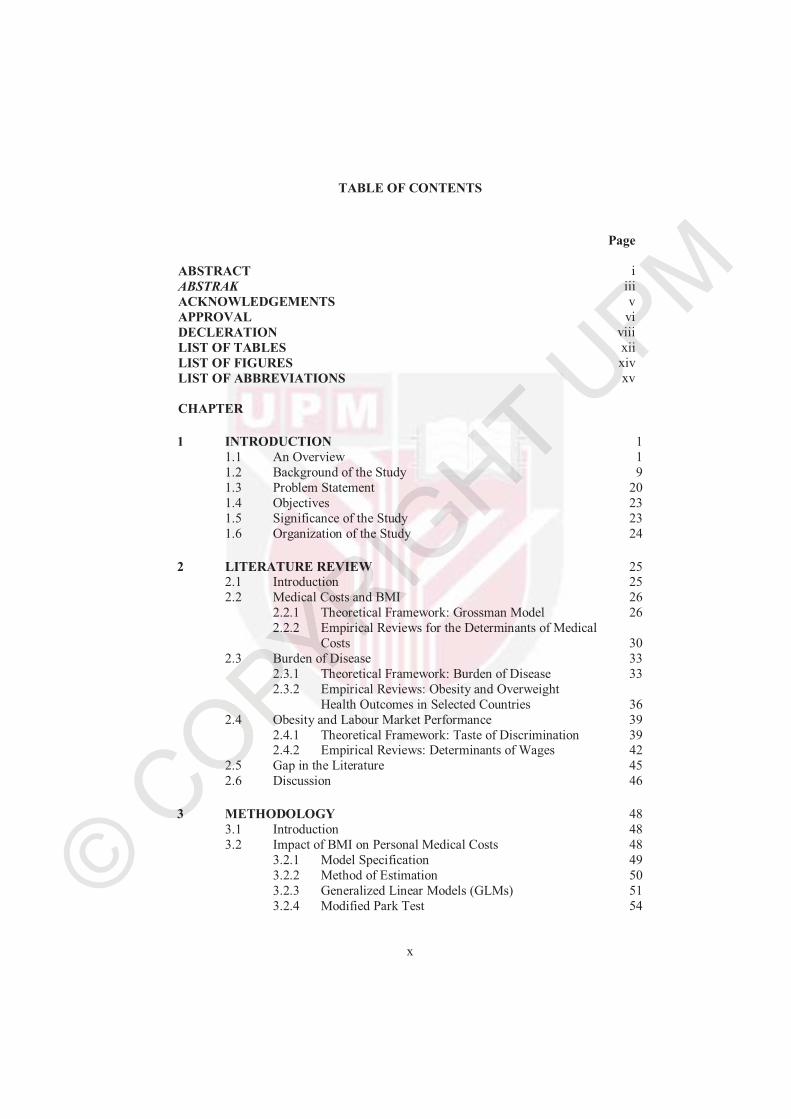
TABLE OF CONTENTS
Page
ABSTRACT iABSTRAK iiiACKNOWLEDGEMENTS v
APPROVAL viDECLERATION viiiLIST OF TABLES xiiLIST OF FIGURES xivLIST OF ABBREVIATIONS xv
CHAPTER
1 INTRODUCTION 1 1.1 An Overview 1 1.2 Background of the Study 9 1.3 Problem Statement 20 1.4 Objectives 23 1.5 Significance of the Study 23 1.6 Organization of the Study 24
2 LITERATURE REVIEW 25 2.1 Introduction 25 2.2 Medical Costs and BMI 26
2.2.1 Theoretical Framework: Grossman Model 26 2.2.2 Empirical Reviews for the Determinants of Medical Costs 30
2.3 Burden of Disease 33 2.3.1 Theoretical Framework: Burden of Disease 33 2.3.2 Empirical Reviews: Obesity and Overweight Health Outcomes in Selected Countries 36
2.4 Obesity and Labour Market Performance 39 2.4.1 Theoretical Framework: Taste of Discrimination 39 2.4.2 Empirical Reviews: Determinants of Wages 42
2.5 Gap in the Literature 45 2.6 Discussion 46
3 METHODOLOGY 48 3.1 Introduction 48 3.2 Impact of BMI on Personal Medical Costs 48
3.2.1 Model Specification 49 3.2.2 Method of Estimation 50 3.2.3 Generalized Linear Models (GLMs) 51 3.2.4 Modified Park Test 54

© COPYRIG
HT UPM
xi
3.2.5 Pregibon Link Test 54 3.2.6 Pearson Correlation Test (Karl Pearson) 55 3.2.7 Information Criteria 55
3.3 Burden of Disease Due to Obesity 56 3.3.1 DISMOD II Model 62
3.4 The Effects of Obesity on the Labour Market Performance 65 3.4.1 Population and Sample 65 3.4.2 Questionnaire Design 66 3.4.3 Pilot Test 68 3.4.4 Measurement Procedures 69 3.4.5 Model Specifications 70 3.4.6 Factor Analysis 72 3.4.7 Reliability Test 73 3.4.8 Ordinal Regression Model 74 3.4.9 Model Fitting Information 76 3.4.10 Goodness of Fit 77
3.5 Chapter Summary 77
4 RESULTS AND DISCUSSION 79 4.1 Introduction 79 4.2 Findings for Obesity and Personal Medical Costs 79
4.2.1 Descriptive Analysis 79 4.2.2 Analysis of the Dependent Variables 81 4.2.3 Comparison of Models and Baseline Results 82 4.2.4 Average Marginal Effects of BMI Levels 85
4.3 Findings for Burden of Obesity by DALY 87 4.3.1 The DALY and Attributable Disease 87
4.4 Findings for BMI and Its Effect on Labour Market Outcomes 93 4.4.1 Descriptive Statistics 93 4.4.2 Reliability and Factor Analysis 95 4.4.3 Procedures 96 4.4.4 Ordinal Regression Model Results Across Models 97 4.4.5 Interaction Terms 102
4.5 Chapter Summary 102
5 CONCLUSIONS 104 5.1 Introduction 104 5.2 Personal Medical Costs and Obesity 104 5.3 Burden of Disease Due to Obesity 105 5.4 Obesity and Labour Market Outcomes 105 5.5 Recommendations for Future Research 106 5.6 Discussion and Limitations 106 5.7 Chapter Summary 109
REFERENCES 111 APPENDICES 130 BIODATA OF STUDENT 154
© COPYRIG
HT UPM
xii
LIST OF TABLES
Table Page
1 Classification of Weight by BMI 2
1.2 Hospital Inpatient and Outpatient Charges 13
1.3 Health Risks of Overweight and Obesity 14
3 Common Distributions with Variance Function and Canonical Link Function
53
3.1 Example of Relative Risk Calculation 59
3.2 KMO Measurement of Sampling Adequacy Criteria 73
3.3 Cronbach Alpha Decision Rules 73
4 Patient Data in Serdang Hospital by BMI Categories 80
4.1 Mean for Several Types of Personal Medical Costs per Patient in the Year 2011 (Serdang Hospital)
81
4.2 Summary of the Regression Analysis for the Variables Predicting Personal Medical Costs
83
4.3 Average Predicted Personal Medical Cost Differences According to BMI Levels and Gender
85
4.4 Attributable Burden (AB) of Diseases Due to Being Overweight and Obese by Gender in Malaysia (person years /1000 persons)
88
4.5 Attributable Burden (AB) of Diseases Due to Being Overweight by Gender and Age Group in Malaysia (person years /1000 persons)
90
4.6 Attributable Burden (AB) of Diseases Due to Obesity by Gender and Age Group in Malaysia (person years /1000 persons)
92
4.7 Descriptive Statistics for All Respondents 94
4.8 Cronbach’s Alpha and Kaiser-Meyer-Olkin (KMO) 95
4.9 Diagnostic Tests 96
4.10 Ordinal Regression Results 98

© COPYRIG
HT UPM
xiii
4.11 Odds Ratio 99
4.12 Ordinal Regression with the Interaction Term 102
© COPYRIG
HT UPM
xiv
LIST OF FIGURES
Figure Page
1 Prevalence of Obesity Among Adults > 18 in the World (% obese) 5
1.1 Prevalence of Obesity and Overweight Among Adults (aged 18
years old) in Malaysia from Year 1996 to 2015
8
1.2 Total Health Expenditure by Source of Funding, 2012 10
1.3 Total Death of Selected Obesity-Related Diseases for Malaysian in the Year 2011
16
1.4 Lowes Curves of the Probability of Being Employed Against BMI by Age Group
20
2 Theoretical Framework 25
3 WHO Guideline to Estimating the Burden of Disease 57
3.1 The Basic Diseases Model Underlying DISMOD II 62
© COPYRIG
HT UPM
xv
LIST OF ABBREVIATIONS
AMA American Medical Association
WHO World Health Organization
ICD International Classification of Diseases
BMI Body Mass Index
OECD Organization for Economic Co-operation and Development
NHMS National Health and Morbidity Survey
NPANM National Plan of Action for Nutrition of Malaysia
THE Total Health Expenditure
GDP Gross Domestic Product
OOP Out-of-pocket
MASO Malaysian Association for the Study of Obesity
TIA Transient Ischemic Attack
NAFLD Non-Alcoholic Fatty Liver Disease
GST Good and Services Tax
YLL Years of Life Lost
YLD Years live with Disability
QALY Quality-Adjusted Life-Years
DALY Disability Adjusted Life Years
2PM Two-Part Generalized Linear Models
GLMs Generalized Linear Models
ML Maximum Likelihood Method
AIC Akaike Information Criterion
BIC Bayesian Information Criterion
PAF Population attributable faction

© COPYRIG
HT UPM
xvi
RR Relative Risk
MSA Measure of Sampling Adequacy
VIF Variance Inflation Factor
T2DM Type 2 Diabetes Mellitus
KMO Kaiser-Meyer-Olkin
MOH Ministry of Health
© COPYRIG
HT UPM
1
CHAPTER 1
1 INTRODUCTION
1.1 An Overview
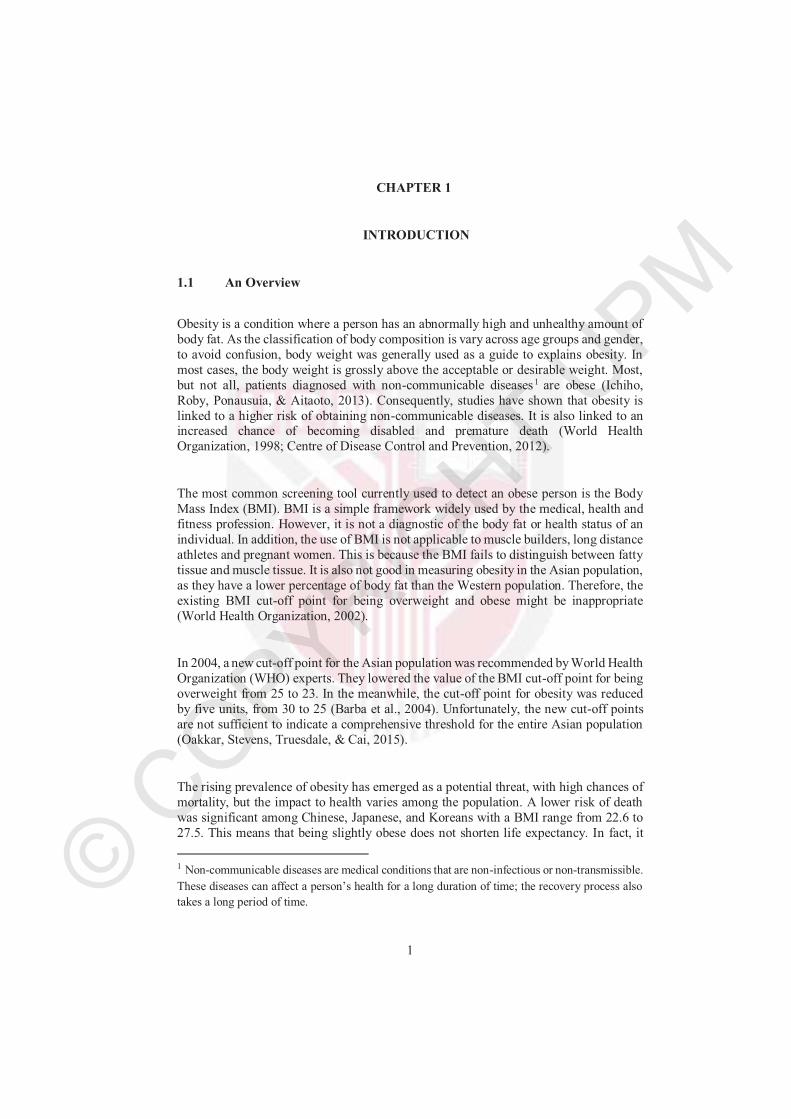
Obesity is a condition where a person has an abnormally high and unhealthy amount of body fat. As the classification of body composition is vary across age groups and gender, to avoid confusion, body weight was generally used as a guide to explains obesity. In most cases, the body weight is grossly above the acceptable or desirable weight. Most, but not all, patients diagnosed with non-communicable diseases1 are obese (Ichiho, Roby, Ponausuia, & Aitaoto, 2013). Consequently, studies have shown that obesity is linked to a higher risk of obtaining non-communicable diseases. It is also linked to an increased chance of becoming disabled and premature death (World Health Organization, 1998; Centre of Disease Control and Prevention, 2012).
The most common screening tool currently used to detect an obese person is the Body Mass Index (BMI). BMI is a simple framework widely used by the medical, health and fitness profession. However, it is not a diagnostic of the body fat or health status of an individual. In addition, the use of BMI is not applicable to muscle builders, long distance athletes and pregnant women. This is because the BMI fails to distinguish between fatty tissue and muscle tissue. It is also not good in measuring obesity in the Asian population, as they have a lower percentage of body fat than the Western population. Therefore, the existing BMI cut-off point for being overweight and obese might be inappropriate (World Health Organization, 2002).
In 2004, a new cut-off point for the Asian population was recommended by World Health Organization (WHO) experts. They lowered the value of the BMI cut-off point for being overweight from 25 to 23. In the meanwhile, the cut-off point for obesity was reduced by five units, from 30 to 25 (Barba et al., 2004). Unfortunately, the new cut-off points are not sufficient to indicate a comprehensive threshold for the entire Asian population (Oakkar, Stevens, Truesdale, & Cai, 2015).
The rising prevalence of obesity has emerged as a potential threat, with high chances of mortality, but the impact to health varies among the population. A lower risk of death was significant among Chinese, Japanese, and Koreans with a BMI range from 22.6 to 27.5. This means that being slightly obese does not shorten life expectancy. In fact, it
1 Non-communicable diseases are medical conditions that are non-infectious or non-transmissible.
These diseases can affect a person’s health for a long duration of time; the recovery process also takes a long period of time.
© COPYRIG
HT UPM
2
improves the life span (Flegal, Kit, & Orpana, 2013). That being said, the risk of death among Indians (citizen of India) and people from Bangladesh are increased among candidates with a BMI of 20.0 or less, as compared with those with a BMI of 22.6 to 25.0. Having a lower BMI led to more deaths than an obese BMI (Zheng et al., 2011).
Due to the limitations of the WHO guidelines for the Asian population, Malaysia has come out with new guidelines which highlight the increasing trend of co-morbidities among Malaysians at lower BMI values (Clinical Practice Guidelines on Management of Obesity, 2004). The move was made to identify further public health actions along with the new BMI cut-off points.
Table 1 : Categories of Obesity According to BMI
Classification World Health Organization (WHO)
Guidelines
WHO Guidelines for the Asian population
Clinical Practice Guidelines (CPG) in
Malaysia
BMI
At risk
Obesity Class I Obesity Class IIObesity Class III
30-34.935-39.9≥40
23-24.9
25-29.9≥30
23-27.4
27.5-34.935-39.9≥40
Overweight >25 ≥22.9 ≥22.9Normal 18.5-24.9 18.5-22.9 18.5-22.9Underweight <18.5 <18.5 <18.5
*BMI is a person's weight in kilograms divided by the square of height in meters
(Source: WHO, 1998 & 2004; CPG, 2004)
Some researchers pointed out that fast food restaurants are one of the leading suspects contributing to obesity (Hollands, Campbell, Gilliland, & Sarma, 2014; Malik, Willett, & Hu, 2013). An adult who consumes food at a fast food restaurant frequently will have a 60 to 80 percent higher chance of being obese, as compared to someone who consumes fast food less than once per week (Anderson, Rafferty, Lyon-callo, Fussman, & Imes, 2011). Anderson et al. (2011) highlights other reasons (e.g., dislike for cooking, convenient and good tastes) as the main reasons why people prefer to consume food at a fast food restaurant.
Similarly, a lack of physical activities resulting from a changing mode of transportation and industrialization can also lead to obesity. In relation to modern technology, instead of walking or cycling, there is growth in the use of the car, which can be significantly less time consuming. Furthermore, cycling or walking may not always be practical when the work location is far from home (Panter, Desousa, & Ogilvie, 2013). As more developing countries are moving towards industrialization, they shift their production from the agricultural sector to the manufacturing and services sector (Szirmai, 2012).
© COPYRIG
HT UPM
3
Heavy carrying and lifting are common activities for farmers. Service sector jobs are more sedentary (Racine et al., 2012).
In addition, lifestyle plays an important role in the managed quality of life. Without proper daily activity planning, it is meaningless to blame other factors that threaten health (Egger & Dixon, 2014). Everyone on the earth has the freedom to choose which types of lifestyles they want to maintain based on their preferences, self-esteem and needs throughout their changes in life stages. The proper planning of activities should work to achieve a better health status. After work, people prefer to spend their time in front of the television or holding smart phones, instead of conducting physical exercise. As a result of this unhealthy lifestyle, obesity is their destiny. This is because their daily energy expenditure is low and their intake of saturated fat and dairy products is high (Camhi, Crouter, Hayman, Must, & Lichtenstein, 2015). Over time, a change in lifestyle may have serious effects on health, particularly for those who lack exercise activity (Bray, Evans, Ph, & Gregg, 2012).
Highlighting the obesity condition is not just a cosmetic concern. A person who is obese has a high tendency to develop high blood pressure, diabetes, heart disease, joint problems, sleep apnea, cancer and metabolic syndrome (Stanford Health Care, 2015). The primary reason why candidates fall into the obese region is an unhealthy diet practice, sedentary lifestyle and/or maternity. Some physicians may highlight the contribution of medicine and genetics to obesity. However; the interaction between genes and obesity remains unclear (Lyon & Hirschhorn, 2005).
The problem of obesity is strongly related to an inactive lifestyle and poor eating habits. In the past, the problem only occurred in high-income countries. It is now also a problem in low and middle-income countries. The phenomena have caused countries to face double burdens, as they are dealing with malnutrition and obesity at the same time (Food and Agricultural Organization of United Nations, 2013). An insufficient food intake and over nutrition increases the risks of engaging in infections and non-communicable diseases.
Even though obesity has raised a lot of attention, there are no universal agreements toclassify obesity as a disease. Physicians generally accept obesity as a complex condition, but disagree whether obesity should be declared a medical disease (Stoner & Cornwall, 2014). They argue that obesity is a risk factor for certain diseases, but that it does not meet the requirements to be qualified as a disease. The intense controversy goes further, as obesity is preventable and can be treated. It heavily depends on individual behaviour (Allison et al., 2008). Furthermore, the BMI fails to illustrate the distribution of body fat and might lead to a misclassification of a healthy individual as a patient when labelling obesity as a disease.

© COPYRIG
HT UPM
4
Conversely, in 2013, the American Medical Association (AMA) officially recognized obesity as a disease to improve the health outcomes of American citizens. The move was due to the alarming situation that one in three American adults are obese or overweight (Organisation for Economic Co-operation and Development, 2014). The highlight of obesity as a disease follows three guidelines: i) disability of some aspect of the body; ii) characteristic signs or symptoms; and iii) harm or morbidity. Recognizing obesity as a disease will help physicians, as obesity is resulting in a progressive economic and social burden (Stoner & Cornwall, 2014). Furthermore, obesity fits the medical criteria as a disease, because it can impair body functions.
On the other hand, WHO categorized obesity as an endocrine, nutritional and metabolic disease. In 1999, it was listed under the International Classification of Diseases2 (ICD) E66 to explain a condition marked by an abnormally high, unhealthy amount of body fat. In 2015, the I.C.D codes 10th version further extended from E66.01 to E66.09 to explain the different conditions of obesity (WHO, 2015).
Malaysia does not officially declare obesity as a disease. However, the Department ofStatistics Malaysia does classify it as a Cause of Death, according to the ICD code (MOH, 2012). Furthermore, there is low awareness regarding the movement among Malaysians and they do not view it seriously (Nutrition Society of Malaysia, 2013).Today, many Malaysians still do not recognize obesity as a disease and they are comfortable with it.
The WHO lists obesity as one of the leading global risks for mortality in the world (Global Health Risks, 2012). According to the report, obesity is a bigger health crisis than hunger. The health burden of obesity is very significant. The report was consistent with research by the Organization for Economic Co-operation and Development (OECD), stating that the problem of obesity has reached an alarming stage. Worldwide obesity almost doubled between 1980 and 2008 from 6 percent to 12 percent, respectively.
2 The International Classification of Diseases is the standard diagnostic tool for epidemiology, health management and clinical purposes. It is used to monitor the incidence and prevalence of diseases and other health problems. It has been proven as a picture of the general health situation of countries and populations.
© COP
PM
5
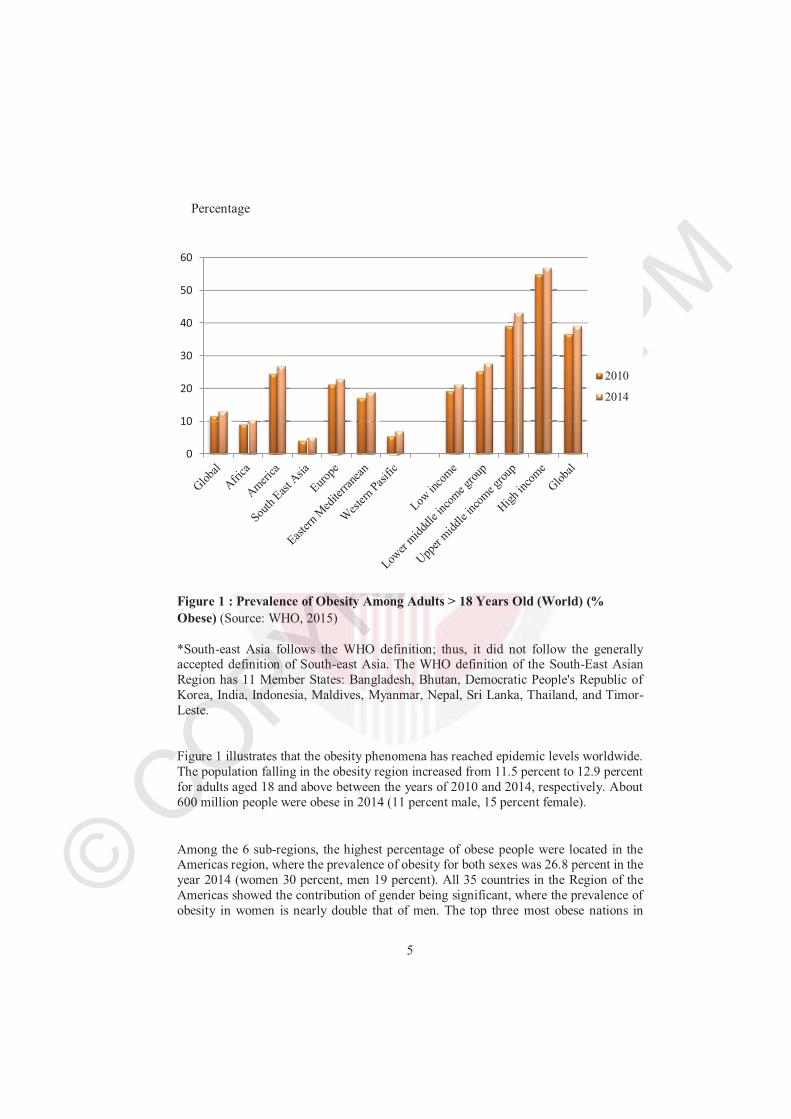
Figure 1 : Prevalence of Obesity Among Adults > 18 Years Old (World) (% Obese) (Source: WHO, 2015)
*South-east Asia follows the WHO definition; thus, it did not follow the generally accepted definition of South-east Asia. The WHO definition of the South-East Asian Region has 11 Member States: Bangladesh, Bhutan, Democratic People's Republic of Korea, India, Indonesia, Maldives, Myanmar, Nepal, Sri Lanka, Thailand, and Timor-Leste.
Figure 1 illustrates that the obesity phenomena has reached epidemic levels worldwide. The population falling in the obesity region increased from 11.5 percent to 12.9 percent for adults aged 18 and above between the years of 2010 and 2014, respectively. About 600 million people were obese in 2014 (11 percent male, 15 percent female).
Among the 6 sub-regions, the highest percentage of obese people were located in the Americas region, where the prevalence of obesity for both sexes was 26.8 percent in the year 2014 (women 30 percent, men 19 percent). All 35 countries in the Region of the Americas showed the contribution of gender being significant, where the prevalence of obesity in women is nearly double that of men. The top three most obese nations in
0
10
20
30
40
50
60
2010
2014
Percentage
© COPYRIG
HT UPM
6
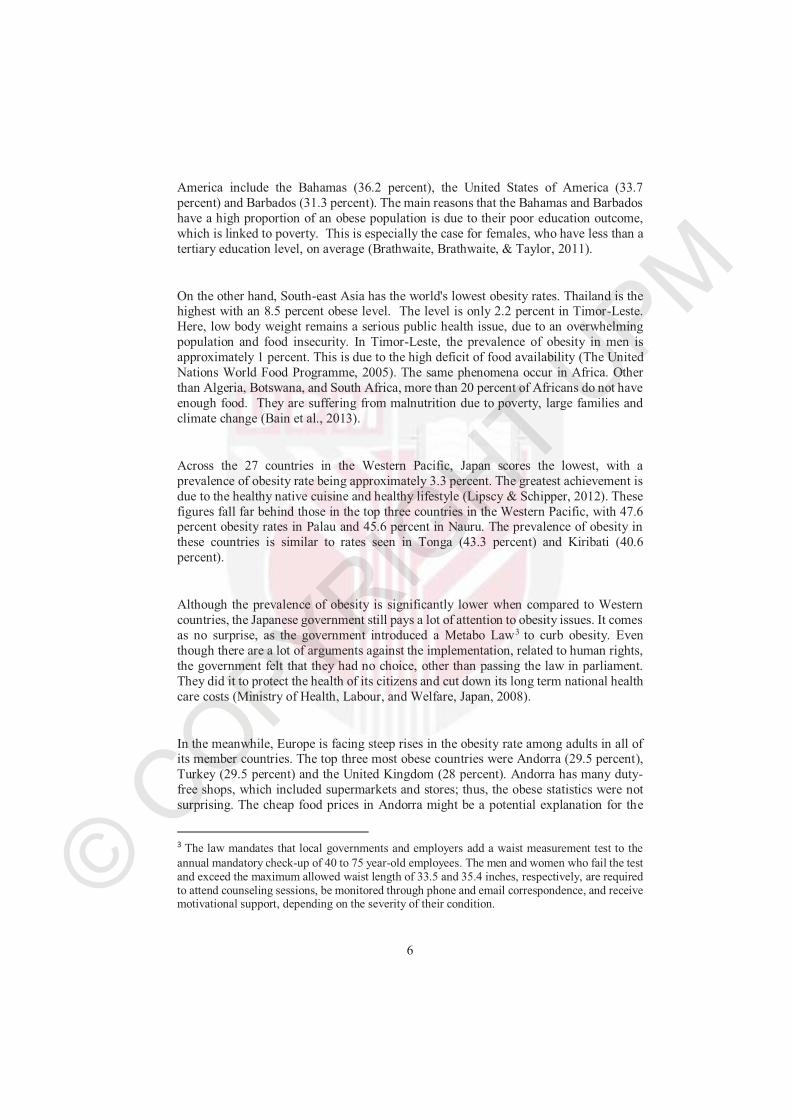
America include the Bahamas (36.2 percent), the United States of America (33.7 percent) and Barbados (31.3 percent). The main reasons that the Bahamas and Barbados have a high proportion of an obese population is due to their poor education outcome, which is linked to poverty. This is especially the case for females, who have less than a tertiary education level, on average (Brathwaite, Brathwaite, & Taylor, 2011).
On the other hand, South-east Asia has the world's lowest obesity rates. Thailand is the highest with an 8.5 percent obese level. The level is only 2.2 percent in Timor-Leste. Here, low body weight remains a serious public health issue, due to an overwhelming population and food insecurity. In Timor-Leste, the prevalence of obesity in men is approximately 1 percent. This is due to the high deficit of food availability (The United Nations World Food Programme, 2005). The same phenomena occur in Africa. Other than Algeria, Botswana, and South Africa, more than 20 percent of Africans do not have enough food. They are suffering from malnutrition due to poverty, large families and climate change (Bain et al., 2013).
Across the 27 countries in the Western Pacific, Japan scores the lowest, with a prevalence of obesity rate being approximately 3.3 percent. The greatest achievement is due to the healthy native cuisine and healthy lifestyle (Lipscy & Schipper, 2012). These figures fall far behind those in the top three countries in the Western Pacific, with 47.6 percent obesity rates in Palau and 45.6 percent in Nauru. The prevalence of obesity in these countries is similar to rates seen in Tonga (43.3 percent) and Kiribati (40.6 percent).
Although the prevalence of obesity is significantly lower when compared to Western countries, the Japanese government still pays a lot of attention to obesity issues. It comes as no surprise, as the government introduced a Metabo Law3 to curb obesity. Even though there are a lot of arguments against the implementation, related to human rights, the government felt that they had no choice, other than passing the law in parliament. They did it to protect the health of its citizens and cut down its long term national health care costs (Ministry of Health, Labour, and Welfare, Japan, 2008).
In the meanwhile, Europe is facing steep rises in the obesity rate among adults in all of its member countries. The top three most obese countries were Andorra (29.5 percent), Turkey (29.5 percent) and the United Kingdom (28 percent). Andorra has many duty-free shops, which included supermarkets and stores; thus, the obese statistics were not surprising. The cheap food prices in Andorra might be a potential explanation for the
3 The law mandates that local governments and employers add a waist measurement test to the
annual mandatory check-up of 40 to 75 year-old employees. The men and women who fail the test and exceed the maximum allowed waist length of 33.5 and 35.4 inches, respectively, are required to attend counseling sessions, be monitored through phone and email correspondence, and receive motivational support, depending on the severity of their condition.
© COPYRIG
HT UPM
7
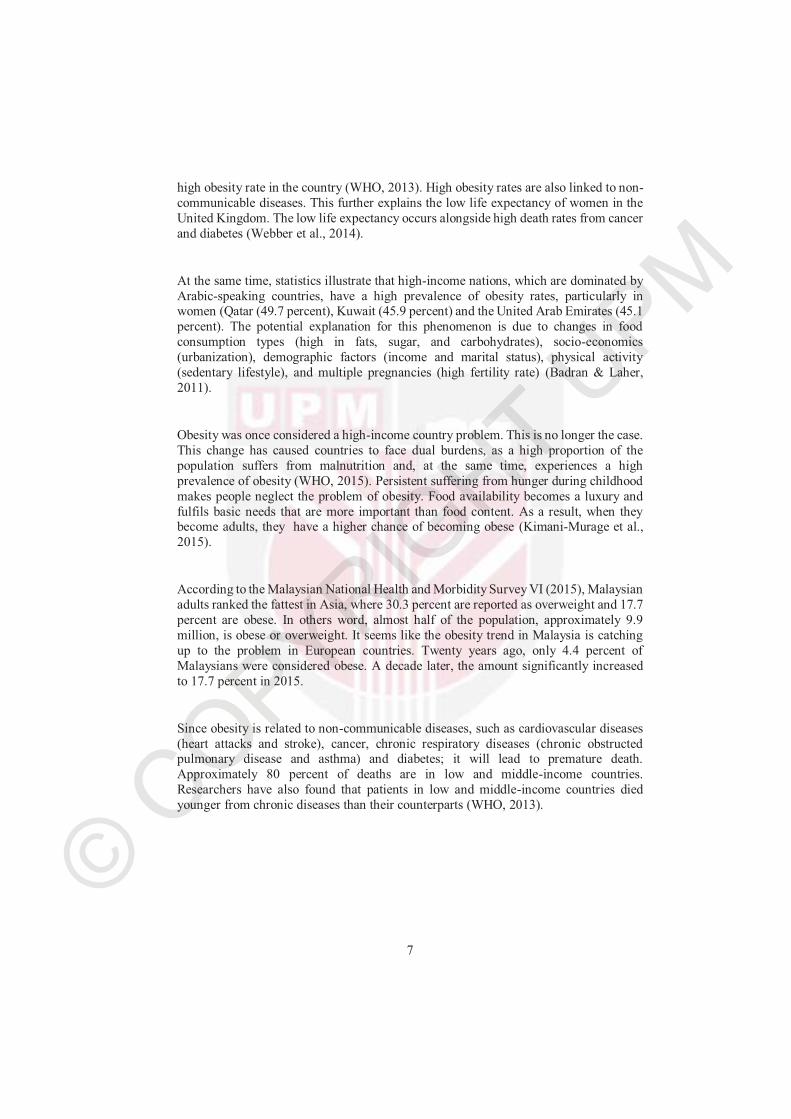
high obesity rate in the country (WHO, 2013). High obesity rates are also linked to non-communicable diseases. This further explains the low life expectancy of women in the United Kingdom. The low life expectancy occurs alongside high death rates from cancer and diabetes (Webber et al., 2014).
At the same time, statistics illustrate that high-income nations, which are dominated by Arabic-speaking countries, have a high prevalence of obesity rates, particularly in women (Qatar (49.7 percent), Kuwait (45.9 percent) and the United Arab Emirates (45.1 percent). The potential explanation for this phenomenon is due to changes in food consumption types (high in fats, sugar, and carbohydrates), socio-economics (urbanization), demographic factors (income and marital status), physical activity (sedentary lifestyle), and multiple pregnancies (high fertility rate) (Badran & Laher, 2011).
Obesity was once considered a high-income country problem. This is no longer the case. This change has caused countries to face dual burdens, as a high proportion of the population suffers from malnutrition and, at the same time, experiences a high prevalence of obesity (WHO, 2015). Persistent suffering from hunger during childhood makes people neglect the problem of obesity. Food availability becomes a luxury and fulfils basic needs that are more important than food content. As a result, when they become adults, they have a higher chance of becoming obese (Kimani-Murage et al., 2015).
According to the Malaysian National Health and Morbidity Survey VI (2015), Malaysian adults ranked the fattest in Asia, where 30.3 percent are reported as overweight and 17.7 percent are obese. In others word, almost half of the population, approximately 9.9 million, is obese or overweight. It seems like the obesity trend in Malaysia is catching up to the problem in European countries. Twenty years ago, only 4.4 percent of Malaysians were considered obese. A decade later, the amount significantly increased to 17.7 percent in 2015.
Since obesity is related to non-communicable diseases, such as cardiovascular diseases (heart attacks and stroke), cancer, chronic respiratory diseases (chronic obstructed pulmonary disease and asthma) and diabetes; it will lead to premature death. Approximately 80 percent of deaths are in low and middle-income countries. Researchers have also found that patients in low and middle-income countries died younger from chronic diseases than their counterparts (WHO, 2013).
© COP
PM
8
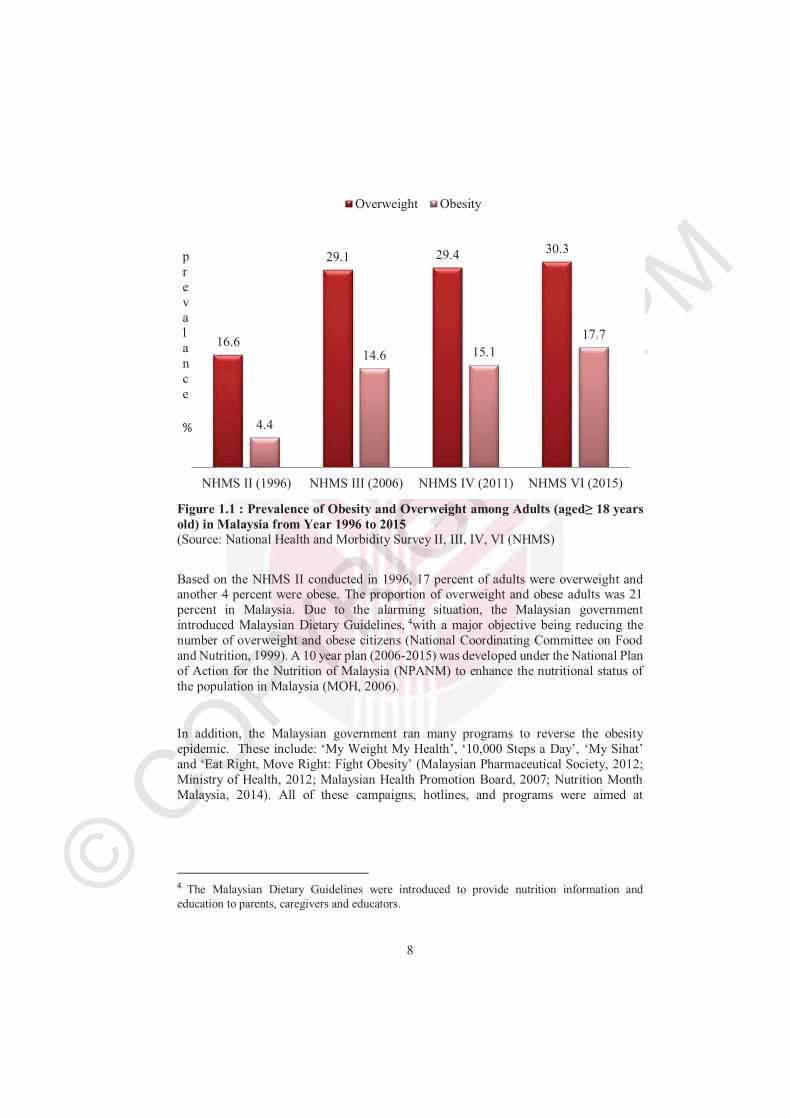
Figure 1.1 : Prevalence of Obesity and Overweight among Adults (aged≥ 18 years old) in Malaysia from Year 1996 to 2015(Source: National Health and Morbidity Survey II, III, IV, VI (NHMS)
Based on the NHMS II conducted in 1996, 17 percent of adults were overweight and another 4 percent were obese. The proportion of overweight and obese adults was 21 percent in Malaysia. Due to the alarming situation, the Malaysian government introduced Malaysian Dietary Guidelines, 4with a major objective being reducing the number of overweight and obese citizens (National Coordinating Committee on Food and Nutrition, 1999). A 10 year plan (2006-2015) was developed under the National Plan of Action for the Nutrition of Malaysia (NPANM) to enhance the nutritional status of the population in Malaysia (MOH, 2006).
In addition, the Malaysian government ran many programs to reverse the obesity epidemic. These include: ‘My Weight My Health’, ‘10,000 Steps a Day’, ‘My Sihat’and ‘Eat Right, Move Right: Fight Obesity’ (Malaysian Pharmaceutical Society, 2012; Ministry of Health, 2012; Malaysian Health Promotion Board, 2007; Nutrition Month Malaysia, 2014). All of these campaigns, hotlines, and programs were aimed at
4 The Malaysian Dietary Guidelines were introduced to provide nutrition information and
education to parents, caregivers and educators.
16.6
29.1 29.4 30.3
4.4
14.6 15.1
17.7
NHMS II (1996) NHMS III (2006) NHMS IV (2011) NHMS VI (2015)
Overweight Obesity
prevalance
%
© COPYRIG
HT UPM
9
promoting a healthy lifestyle among Malaysians by providing information on nutrition, proper diet and fitness.
Unfortunately, there has been no significant change. The overweight and obesity prevalence remains high. In fact, it showed a dramatic increase of more than four-fold, despite these concentrated efforts by the government. This is attributable to the rising incidence of multiple chronic illnesses, resulting in substantial medical costs to treat obesity (Mora, Gil, & Sicras-Mainar, 2014).
It has been widely documented that obesity is heavily associated with health diseases, such as high blood pressure, stroke, diabetes and heart diseases (Apovian, 2010).Therefore, to combat this problem, members of the public need to introduce and maintain behavioural and dietary changes in their lives without being too reliant on the government. No governing body can influence or alter someone's decisions about their lifestyle. It is unethical for these bodies to regulate or enact laws to restrict lifestyle choices, like enforcing people to stay away from sugary drinks, amongst others. The threat of obesity as a lifelong problem should be highlighted upon to create awareness among citizens regarding the need for voluntary lifestyle changes, including consistently engaging in healthy activities. In fact, just by improving daily eating habits, exercising daily, and reducing the amount of time spent in front of the television and computers, the chances of obesity are significantly reduced (Swinburn, Caterson, Seidell, & James, 2004).
1.2 Background of the Study
Obesity is one of the major obstacles in developing a healthy lifestyle. This is because obesity is associated with other illness, such as high blood pressure, stroke, diabetes and heart disease (American Heart Association, 2013; James et al., 2004; Apovian, 2010).Since the prevalence of obesity has increased, so has the incidence of these diseases. As a result, the medical costs of treating obesity also increase.
Money is an important issue in relation to the obesity crisis. Medical Inflation5 is not a new term in Malaysia. Although medical inflation is influenced not just by demand factors like obesity which must be age- and risk-adjusted for comparability, but also by supply factors such as delivery, financing systems and public expenditures. However, there is an undeniable link between rising rates of obesity and rising medical spending. Despite the serious health consequences of obesity, medical costs due to the illness are higher as well. Due to the biggest worry of high medical costs, Malaysians have the
5 Medical inflation is as definite as a rise in the price of medical goods and services. The medical consumer price index (CPI) is the estimation of the medical inflation.
© COPYRIG
HT UPM
10
tendency to turn to private medical insurance and avoid exhausting their savings in the future when suffering from an illness (HSBC, 2013).
However, after the government approved the hike in private medical costs, which was about 14.4 percent in the year 2013, the insurance premium also increased by 20 percent to absorb the extra charges. The painful truth is the story does not end here; even the premium insurance companies have received an increase in annual policyholder medical claims, but the medical claims usually come with a limit, for example, each year the maximum claims can only be RM100,000. This makes the existing policyholders seek other alternatives to cover their medical costs, when the current policy is unable to cover their medical expenses (Malaysian Employers Federation, 2014).
The burden of high medical costs further extends when the government announced the implementation of the new minimum wage on the 1st of July 2016 to be increased from RM900 to RM1,000 per month for workers in Peninsular Malaysia and RM800 to RM920 for those in Sabah, Sarawak and Labuan (National Human Resource Centre, 2016). As certain positions, such as cleaners and lab assistants, still heavily depends on them, the implementation of minimum wages does raise the hospital operating costs. The move further explains the high medical costs as higher wages born by the hospital.
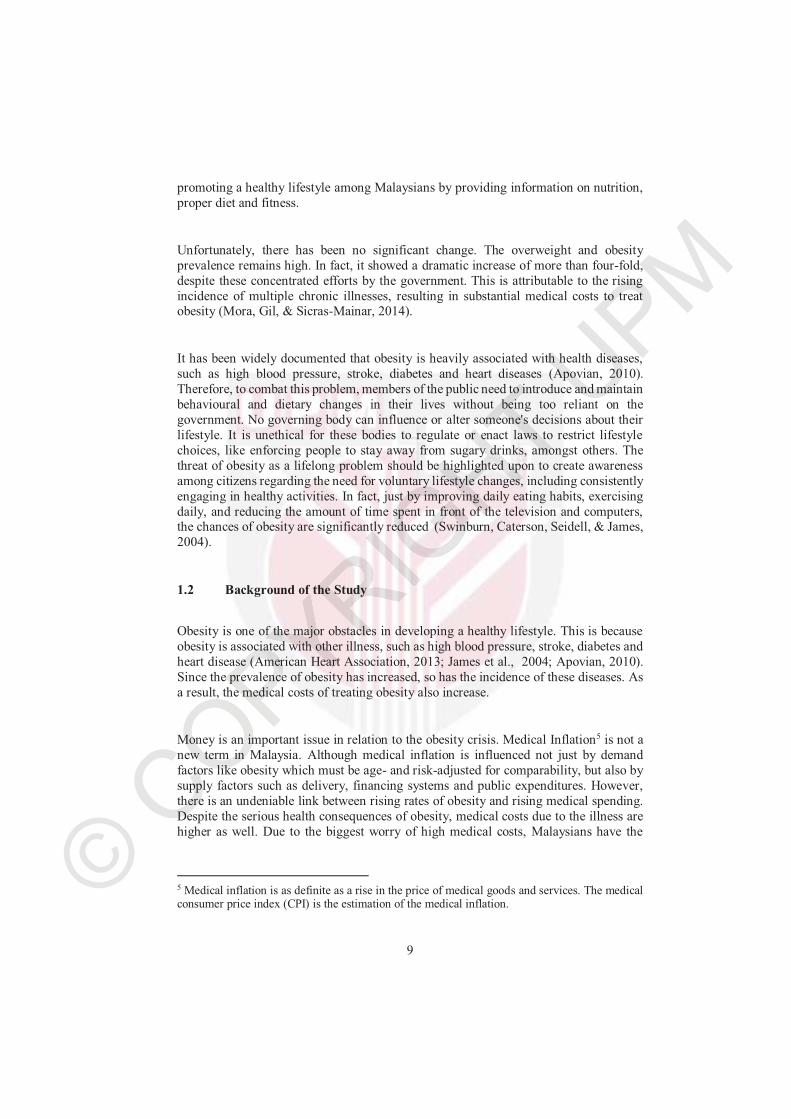
Figure 1.2 : Total Health Expenditures by Source of Funding (2012) (Source: Ministry of Health, 2014)
44%
37%
7%
4%
3% 2%
3%
Percentage (%)
MOH
Out of Pocket Expenditure (OOP)
Private Insurances
Other Federal Agencies
Ministry of Higher Education(MOHE)
Corporate
Others
© COPYRIG
HT UPM
11
Similar to other developing countries, Malaysian health care is facing challenges in providing accessible health services. Total health expenditures (THE) in the year 2012 were RM 42,256 million, which is approximately 4.5 percent of the Gross Domestic Product (GDP) in that year. A significant upward trend can be observed between the years of 2005 and 2012 (MOH, 2014). The THE in the country has doubled since the year 2005.
The public and private sector play their own role in funding the health care system. The primary source of financing comes from the public sector, with RM22,461 million, which equals 53.15 percent of the THE in the year of 2012. In the public sector, these sources of financing include the federal government, state government, local authorities and social security funds. In the meanwhile, in the private sector, these sources of financing include private insurance enterprises, managed care organizations, privatehousehold out-of-pocket (OOP)6, Not-for-Profit institutions, and private corporations.
The Ministry of Health contributes the largest amount of funding among the public sectors, RM18,593 million, to plan, purchase and provide health services to the public. Since public health services are heavily subsidized by the government, medicine and treatments were charged with a small amount co-payment of 2 to 3 percent of the actual prices (Chua & Cheah, 2012). Furthermore, certain groups are entitled to basic services at zero charges (e.g., preschool children, schoolchildren up to 17 years of age, pregnant women, civil servants and their dependents under 21 years of age and disadvantaged people with mental and physical problems) (Jaafar et al., 2013). Despite the situation, almost the full amount of the expenditure for the provision and administration of public health programs are contributed to by MOH spending.
At the same time, the top private contributor to THE is private household out-of-pocket (OOP) with 37 percent of the THE in the year 2012. Private hospitals have become more prominent, because patients are demanding more than a basic health care service, which means quality health care services. Problems at public hospitals include long waiting times, insufficient staff, crowded waiting areas and accessibility. This has resulted in people choosing private hospitals as their priority (Hameed & Nor, 2014)
The second highest source of private health care spending is coming from personal, family or company insurance policies (RM2, 774 million). Since the introduction of the personal income tax relief in the year 1996, and the policy which separates medical insurance from life insurance in the year 1997, the demand for medical insurance has
6 Out-of-pocket expenditures include any direct outlay by households, including gratuities and in-
kind payments, to health practitioners and suppliers of pharmaceuticals, therapeutic appliances, and other goods and services with a primary intent of contributing to the restoration or enhancement of the health status of individuals or population groups. It is a part of the private health expenditures.
© COPYRIG
HT UPM
12
increased. Policyholders are under comprehensive medical coverage, which includes medical costs and other protections, such as alternative medicine and compensation for losses of daily income (AIA, 2013).
The consequences of obesity can be easily understood. Obesity causes a loss of working days, lower productivity and some serious chronic problems, including high blood pressure, diabetes, heart disease, joint problems, sleep apnea7 and respiratory8diseases. In addition, people that experience obesity and overweight will reduce their quality of life and life expectancy due to the disability (Fontaine & Barofsky, 2001). This is because a patient might find it difficult to participate in certain activities. This also affects the enjoyment of the activities.
However, the public’s perspective seems to undermine the impact of obesity and the risks of obesity related illnesses. Many of them experience “weight blindness9” unless the individual is extremely obese. Therefore, when the AMA labelled obesity as a “multi-metabolic and hormonal disease”, it provided a clear warning to the public.
Unlike the neighbouring countries of Indonesia and the Philippines, that practice a decentralization system, Malaysia is still maintaining a central administration with policies and programs being formulated and funded by MOH (Jaafar et al., 2013). THE, in the year 2013, was recorded as RM 44,748 million, which is equal to 4.53 percent of the GDP (Zainuddin, 2015). Despite being a highly-subsidized system, the health expenditure has remained predominantly spent on public needs, at 52 percent of THE.
Malaysia is operating a two-tiered health care system, including a government-run universal health care system and a private health care system. Hence, patients are free to choose between a government-subsidized hospital or a private hospital (self-funding or insurance). Although the government hospitals have the best facilities across the nation, private hospitals remain the first choices for certain patients. The reason for this is because of the shortage of medical staff in public hospitals, which leads to long queues.
7 Sleep apnea is a potentially serious sleep disorder in which breathing repeatedly stops and starts.
You may have sleep apnea if you snore loudly and you feel tired, even after a full night's sleep. 8 The integrated system of organs involved in the intake and exchange of oxygen and carbon
dioxide between the body and the environment, including the nasal passages, larynx, trachea, bronchial tubes, and lungs. 9 Weight blindness refers to ignorance or a failure to recognize an increase in weight.
© COPYRIG
HT UPM
13
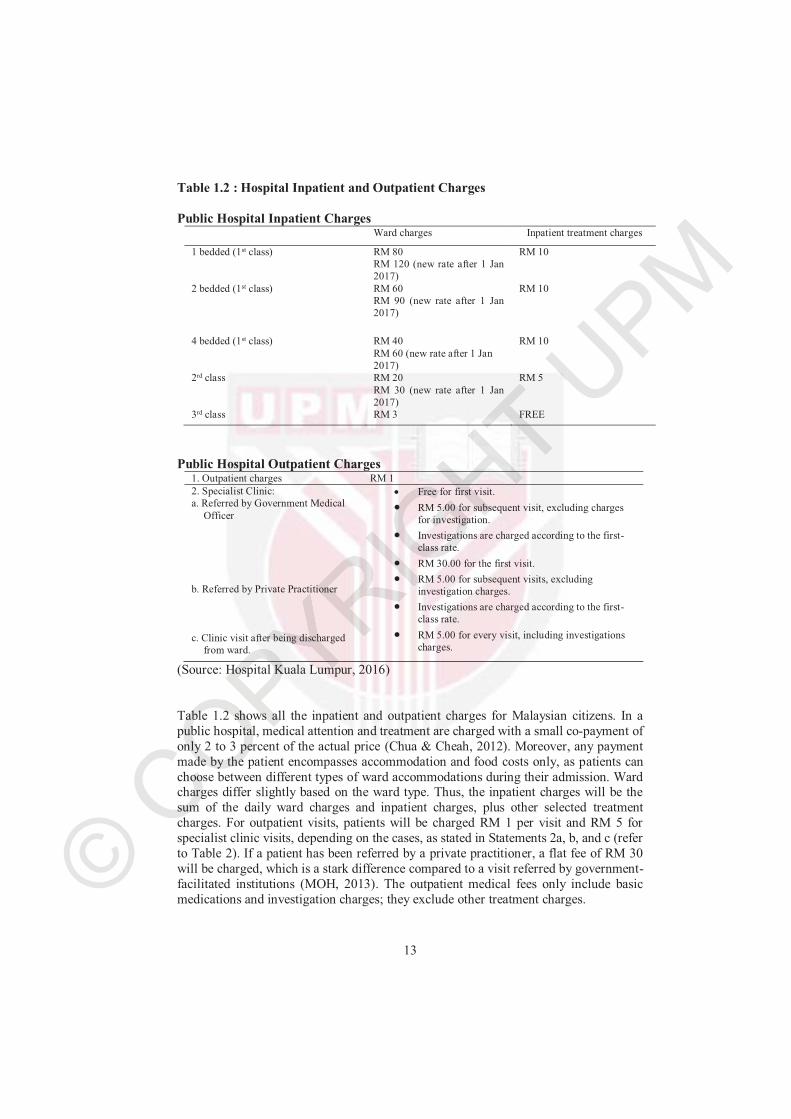
Table 1.2 : Hospital Inpatient and Outpatient Charges
Public Hospital Inpatient Charges Ward charges Inpatient treatment charges
1 bedded (1st class) RM 80RM 120 (new rate after 1 Jan 2017)
RM 10
2 bedded (1st class) RM 60 RM 90 (new rate after 1 Jan 2017)
RM 10
4 bedded (1st class) RM 40
RM 60 (new rate after 1 Jan 2017)
RM 10
2rd class RM 20
RM 30 (new rate after 1 Jan 2017)
RM 5
3rd class RM 3 FREE
Public Hospital Outpatient Charges 1. Outpatient charges RM 1
2. Specialist Clinic:a. Referred by Government Medical
Officer
b. Referred by Private Practitioner
c. Clinic visit after being discharged from ward.
� Free for first visit.
� RM 5.00 for subsequent visit, excluding charges for investigation.
� Investigations are charged according to the first-class rate.
� RM 30.00 for the first visit.
� RM 5.00 for subsequent visits, excluding investigation charges.
� Investigations are charged according to the first-class rate.
� RM 5.00 for every visit, including investigations charges.
(Source: Hospital Kuala Lumpur, 2016)
Table 1.2 shows all the inpatient and outpatient charges for Malaysian citizens. In a public hospital, medical attention and treatment are charged with a small co-payment of only 2 to 3 percent of the actual price (Chua & Cheah, 2012). Moreover, any payment made by the patient encompasses accommodation and food costs only, as patients can choose between different types of ward accommodations during their admission. Ward charges differ slightly based on the ward type. Thus, the inpatient charges will be the sum of the daily ward charges and inpatient charges, plus other selected treatment charges. For outpatient visits, patients will be charged RM 1 per visit and RM 5 for specialist clinic visits, depending on the cases, as stated in Statements 2a, b, and c (refer to Table 2). If a patient has been referred by a private practitioner, a flat fee of RM 30 will be charged, which is a stark difference compared to a visit referred by government-facilitated institutions (MOH, 2013). The outpatient medical fees only include basic medications and investigation charges; they exclude other treatment charges.
© COPYRIG
HT UPM
14
Furthermore, certain groups are entitled to basic services at zero charges. This policy can be enjoyed by children aged up to 17 years old, senior citizens, civil servants and their listed dependents that are under 21 years old, and disadvantaged people with mental and physical problems (Quek, 2008). Additionally, any medical costs for patients diagnosed with any kind of infectious diseases or illnesses (e.g., dengue, Zika, and Hand,Foot & Mouth Disease), will be waived (MOH, 2016).
Due to these comprehensive and widely covered aspects of the national health care system, it has been ranked highly among the top thirty health care packages in the world. This list ranks each country according to three criteria: 1) life expectancy (60 percent), 2) relative per capita cost of health care (30 percent), and 3) absolute per capita cost of health care (10 percent) (Bloomberg, 2014). Despite these generous benefits, some still try to exploit and manipulate the non-rejection policy (everyone has accessibility to health care) by leaving without settling their bills (Bloomberg, 2014).
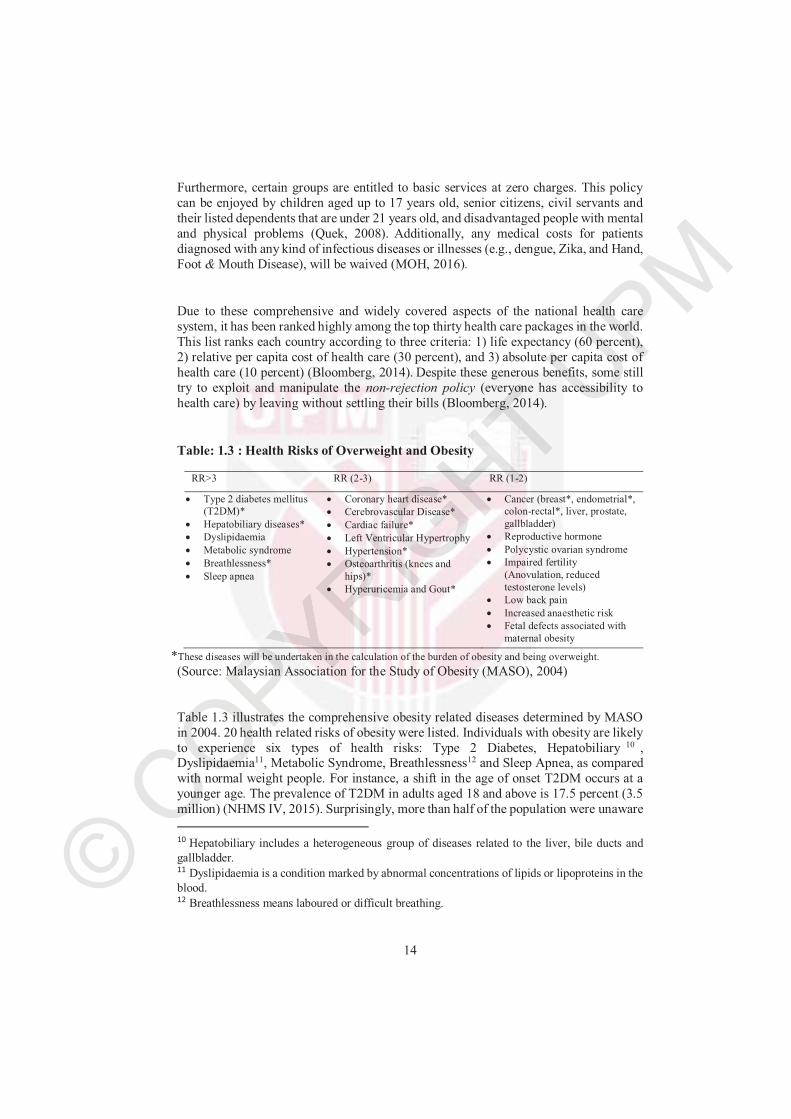
Table: 1.3 : Health Risks of Overweight and Obesity
RR>3 RR (2-3) RR (1-2)
� Type 2 diabetes mellitus (T2DM)*
� Hepatobiliary diseases*
� Dyslipidaemia
� Metabolic syndrome
� Breathlessness*
� Sleep apnea
� Coronary heart disease*
� Cerebrovascular Disease*
� Cardiac failure*
� Left Ventricular Hypertrophy
� Hypertension*
� Osteoarthritis (knees and
hips)*
� Hyperuricemia and Gout*
� Cancer (breast*, endometrial*, colon-rectal*, liver, prostate,
gallbladder)
� Reproductive hormone
� Polycystic ovarian syndrome
� Impaired fertility
(Anovulation, reduced
testosterone levels)
� Low back pain
� Increased anaesthetic risk
� Fetal defects associated with
maternal obesity
*These diseases will be undertaken in the calculation of the burden of obesity and being overweight.
(Source: Malaysian Association for the Study of Obesity (MASO), 2004)
Table 1.3 illustrates the comprehensive obesity related diseases determined by MASO in 2004. 20 health related risks of obesity were listed. Individuals with obesity are likely to experience six types of health risks: Type 2 Diabetes, Hepatobiliary 10 ,Dyslipidaemia11, Metabolic Syndrome, Breathlessness12 and Sleep Apnea, as compared with normal weight people. For instance, a shift in the age of onset T2DM occurs at a younger age. The prevalence of T2DM in adults aged 18 and above is 17.5 percent (3.5 million) (NHMS IV, 2015). Surprisingly, more than half of the population were unaware
10 Hepatobiliary includes a heterogeneous group of diseases related to the liver, bile ducts and
gallbladder.11 Dyslipidaemia is a condition marked by abnormal concentrations of lipids or lipoproteins in the
blood.12 Breathlessness means laboured or difficult breathing.

© COPYRIG
HT UPM
15
of their diagnosis (MOH, 2015). In the meanwhile, the chances of having Dyslipidaemia are higher among males above 45 years old and women above 55 years old or those having premature menopause (MOH, 2011). This is because a high BMI level is usually associated with high blood pressure and high cholesterol. The combination of the high level of BMI, blood pressure and cholesterol leads to the development of diseases listed in the first column.
At the same time, obesity also increases the risk of Coronary Heart Disease, Cerebrovascular Disease, Cardiac Failure, Hypertension, Osteoarthritis, Hyperuricemia and Gout. Coronary Heart Disease is one of the leading causes of death worldwide, including in Malaysia (WHO, 2011). Based on the data obtained from the percutaneouscoronary intervention (PCI) registry 2010-2012, males still predominate females by 4:1, whereby out of 13750 patients, 82.4 percent were males (Azman, Ahmad, & Kui-hian, 2012). In the meanwhile, Osteoarthritis is the most common form of arthritis. There is no cure for the disease, however, maintaining healthy weight or treatment can slow down the progress of damaging the joint functions.
The impact of obesity on the 7 types of diseases in column 3 is relatively lower, as compared to other diseases, such as type 2 diabetes mellitus and cardiovascular disease. This is because the diseases in column 3 are not single diseases, but a collection of individual diseases. For example, obese women with sleep apnea have a higher chance of infertility, compared to normal weight women without sleep apnea. Most of the diseases in column 3 cannot be cured. Treatment goals are based on patient symptoms; therefore, a combination treatment will be needed to meet these goals.
© CO
PM
16
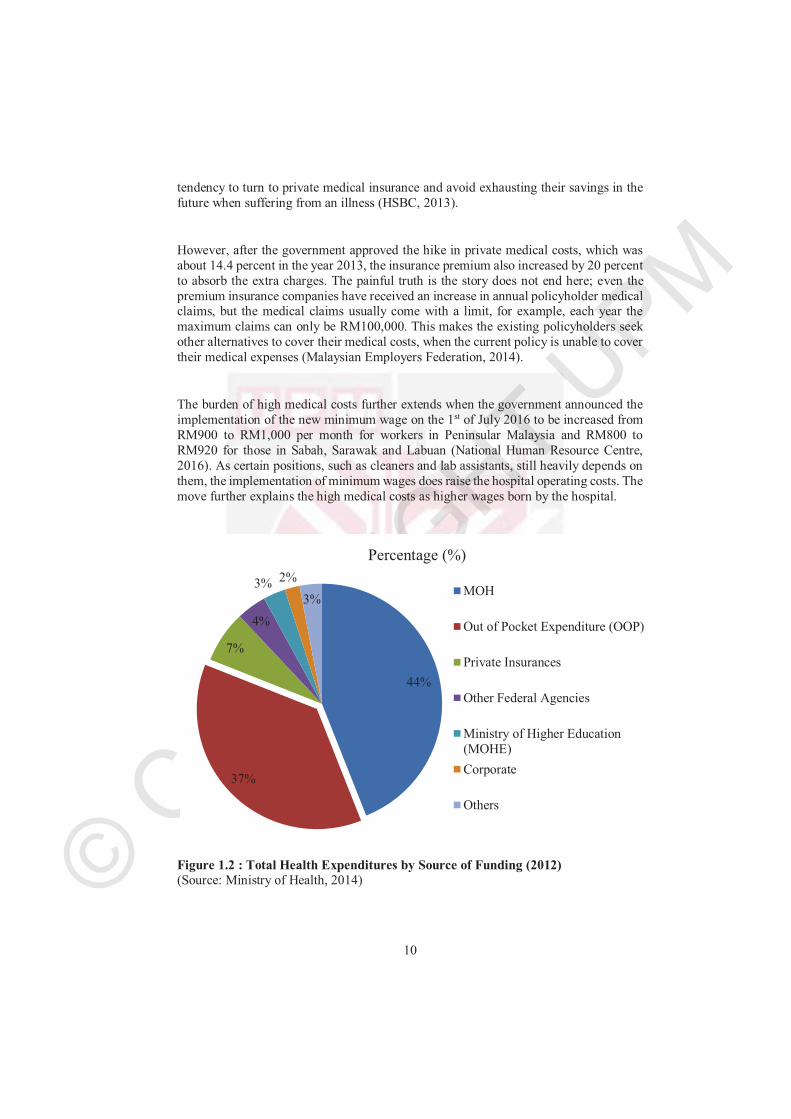
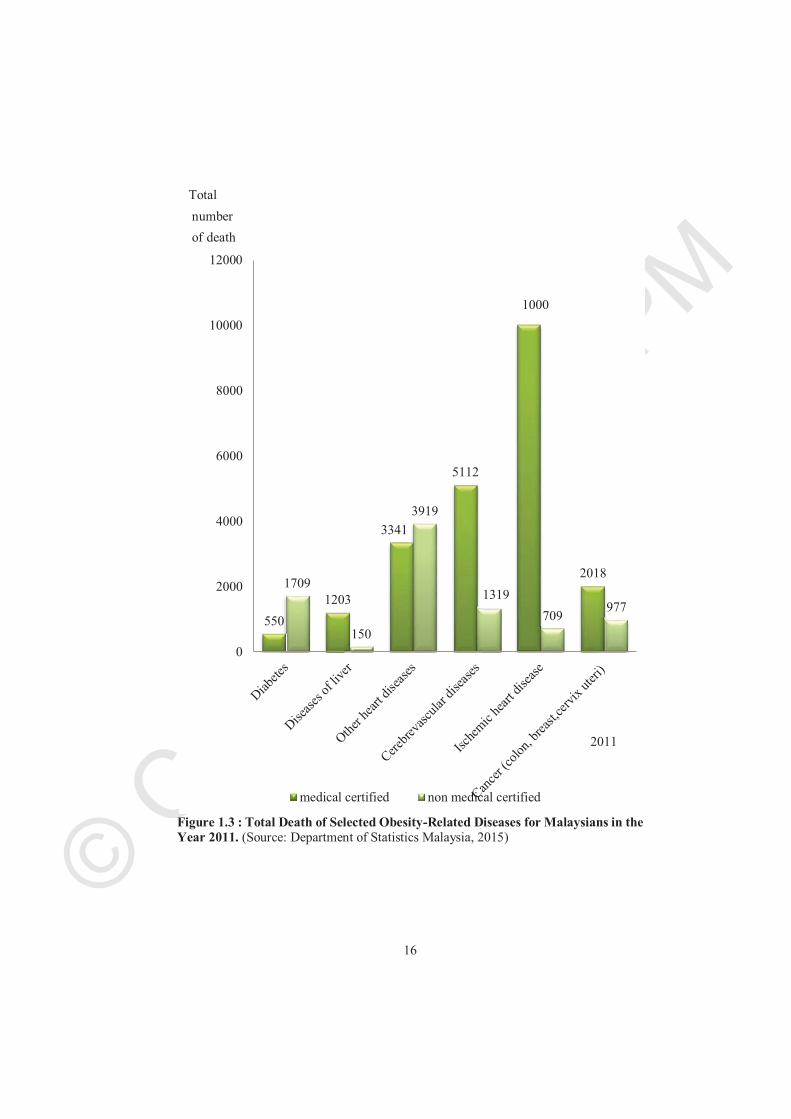
Figure 1.3 : Total Death of Selected Obesity-Related Diseases for Malaysians in the Year 2011. (Source: Department of Statistics Malaysia, 2015)
550
1203
3341
5112
20181709
150
3919
1319
709977
0
2000
4000
6000
8000
10000
12000
medical certified non medical certified
2011
Total
number
of death
1000
© COPYRIG
HT UPM
17
Figure 1.3 illustrates the total deaths for selected obesity-related diseases in Malaysia in the year 2011. In Malaysia, the information on the causes of death is categorized by medically certified13and non-medically certified14 cases. The Department of Statistics coded the causes of death according to WHO’s (International Classification of Diseases, 10th Revision (ICD 10)) medically certified death. In the meanwhile, for non-medically certified death, causes of death are coded based on the Code Book for Uncertified Causes of Deaths, Version 3, developed by the Department of Statistics, Malaysia. This coding was based on a discussion with the Ministry of Health Malaysia, National Registration Department, Royal Malaysia Police and Kuala Lumpur City Hall (Department of Statistics, 2015).
The quality of death registration data is the main problem in many countries, particularly in developing countries, such as Malaysia (Adnan, Bujang, Supramaniam, & Hamid, 2012). In the year 2011, total deaths that were medically certified was 70,835 and non-medically certified deaths was 64,628. In other words, almost 50 percent of the deaths in Malaysia were non-medically certified.
Heart disease has become increasingly common in recent decades. In Malaysia, it continues to hound modern-day men and women. The difference between gender is very significant when it comes to heart disease. People have generally thought that heart disease occurs in men which was proven in the statistics. In 2011, the total medically certified deaths from cardiovascular disease among adults aged 20 to 60 years old was 4,363 cases, with 3,481 occurring in men (Department of Statistics, 2015). About 92 percent of the deaths were from coronary heart disease.
On the other hand, cerebrovascular disease poses a significant threat to Malaysians. It is one of the five leading causes of death in Malaysia (WHO, 2013). Based on the statistics, the total deaths from cerebrovascular disease was 6,431 persons in the year 2011, with 5,112 of those being medically certified. The most common 4 types of cerebrovascular disease are stroke, transient ischemic attack (TIA), subarachnoid haemorrhage and vascular dementia. All of these diseases come silently and destroy the patient’s life within seconds. The patient may suffer from death on the spot or have a disability for the rest of their life. This is because brain damage affects patient senses, speech and their understanding of speech. Patient behaviours, thoughts and memory patterns are altered. The worst part is that one side of the patient’s body may be paralyzed (The National Stroke Association of Malaysia, 2012).
Malaysia has the highest number of people with diabetes among the Asian nations. The number of diabetes patients aged 18-year-old and above increased to 31 percent in 2015, up from 15.2 percent in 2011. The increasing number is correlated with the increment of
13 Medically certified refers to verification made by a medical officer and coroner. 14 Non-medically certified refers to verification made by informants without medical qualifications, such as the police or other individuals.
© COPYRIG
HT UPM
18
overweight and obesity patients (NHMS IV, 2011). If the disease is not controlled, it could lead to early death and permanent disability. In the year 2011, the patients who died due to diabetes were 2,259, with 505 being medically certified and 1,709 being non-medically certified. Among the patients who were medically certified, 256 of them were aged 20 to 60 years old (almost half of medical certified death). The number of patients who died after 45 years of age has been increasing for both genders.
The incidence of three types of cancer has increased dramatically since 2008. According to the Ministry of Health, almost 50 percent of the female patients were diagnosed with breast and cervix and uterine before 50 years of age, which is much earlier than that of Western countries. In the meanwhile, there are no differences between the incidences of colon cancer among genders until 40 years of age. The incidence case among male patients is slightly higher after age 50 and above (Globacon, 2012). In the year 2011, there were 2,995 deaths under these diseases.
In 2011, there were 1,353 deaths caused by diseases of the liver, in which 1,203 deaths were medically certified and 150 deaths were non-medically certified. The number was relatively smaller (1.8 percent), compared to all causes of death (medically certified). This might be due to the fact that liver diseases are associated with cardiovascular diseases. Thus, most of the patients died and were certified under heart diseases, rather than liver-related complications (Cruez, 2014). Among the types of liver diseases, non-alcoholic fatty liver disease (NAFLD) is the most common liver disease among Malaysians. Unfortunately, there is no data available for the prevalence of liver disease in Malaysia (Magosso et al., 2010).
In the past, plus sized bodies were preferable for all age group, since many jobs demanded physical activity, such as laborious tasks in agricultural fields. Today, the labour market has immensely changed. Job requirements are less focused on physical exertion, which means a plus sized body is less preferable. For instance, for an office job, a plus sized body does not have a significant impact on productivity (Sharifzadeh, 2013). In fact, a high level of BMI usually illustrates a direct relationship with a productivity loss (Gates, Succop, Brehm, Gillespie, & Sommers, 2008; Park, 2009).Productivity loss among obese workers can occur as a result of injury in the workplace. The time needed to recover is longer with obese workers, as compared to workers with a normal weight. Furthermore, they are likely to increase the demand for support services and disability management, since the obese conditions are limiting their basic physical abilities (Borak, 2011).
As a profit-oriented firm, productivity loss will lower a company’s revenue. To mitigate such a problem, employers are less likely to employ obese workers if they are given the choice (Heinen & Darling, 2009). Slack can occur with increasing numbers of sick days, low productivity and the accelerating burden of medical costs, leading to a negative perception of employers of obese workers. In another perspective, it seems like the firms are penalized in terms of high health care costs and employees’ unhealthy habits. Thus,
© COPYRIG
HT UPM
19
obesity may be associated with high unemployment rates and, in some cases, obese employees in certain job positions might have to receive lower wages. Therefore, the effect of obesity on the labour market will be a high unemployment rate and the probability of getting lower wages (Han, Norton, & Powell, 2011).
Another negative impact of obesity is the likelihood of discrimination by peers based on their appearances (Baum & Ford, 2004). Discrimination is defined as the unjust treatment of people depending on their group affiliation, such as race, age and sex (Fershtman, Gneezy, & Verboven, 2005). Obese workers are generally labelled as someone lacking in self-control, lazy and unintelligent, although, in actual fact, there are no differences between obese and non-obese workers in terms of their ability, performance and personality. When gender is taken into consideration, the effect of obesity on wages differs between males and females, with the obese females being discriminated against with lower earnings, as compared with their non-obese counterparts (Caliendo & Lee, 2013; Judge & Cable, 2011). They are also more likely to end up with low paying jobs, such as in a nursing care or health care centre. On the other hand, their non-obese counterparts are getting high paying customer related jobs which require attractive looking people, such as sales and customer relationship representatives (Nickson, Timming, Re, & Perrett, 2016).
In addition, the impact of obesity on the male worker seems to be positive. In certain cases, employers preferred overweight and slightly obese workers, because of the needs of a certain position. For example, this may include blue-collar workers who perform labour jobs and typically work with their hands. Previously, their job scopes were more focused on lifting or carrying heavy items. But now, with advanced technology, which reduces the need for a human in production, all of these practices can be done by a machine. However, certain practices still heavily depend on manual workers, such as fruit and vegetable pickers and manual materials handlers. A slightly bigger size gives them an advantage, because they are more durable and less likely to get sick when they are exposed to the sun for long hours. Most of the studies do not detect an existing discrimination among obese and non-obese male workers. Some of the studies even found that obese men were better paid (Härkönen, Räsänen, & Näsi, 2011).
© COPYRIG
HT UPM
20
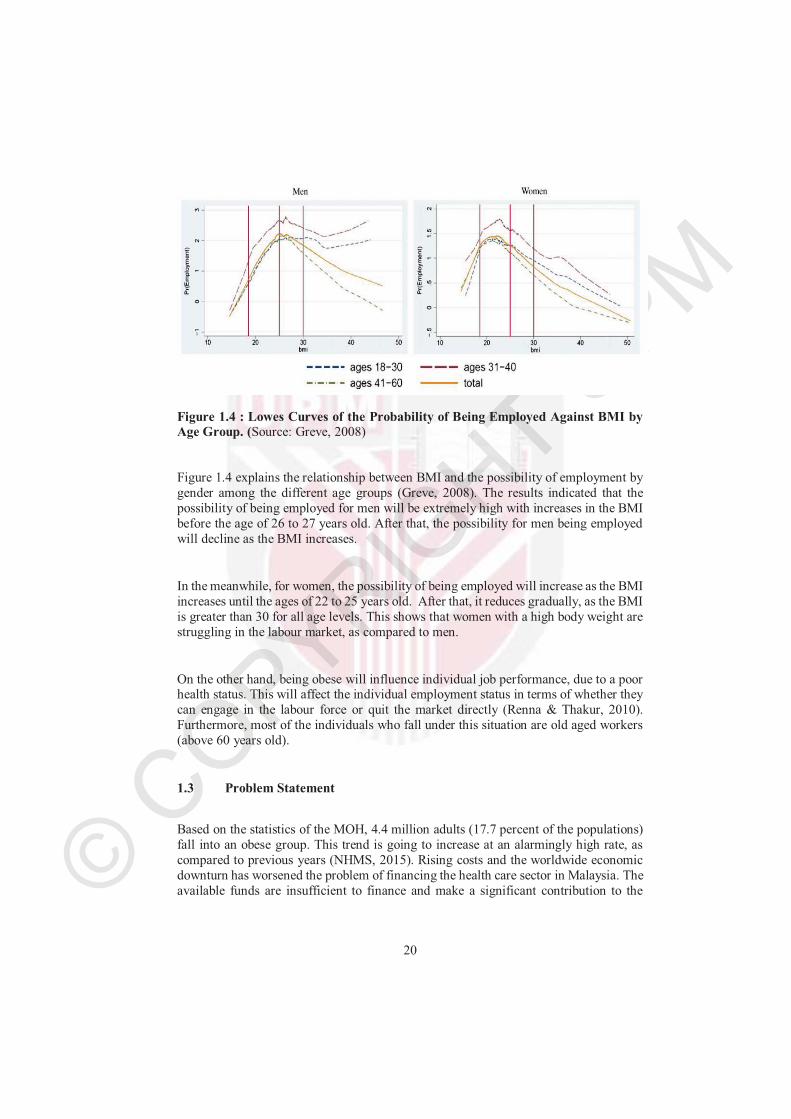
Figure 1.4 : Lowes Curves of the Probability of Being Employed Against BMI by Age Group. (Source: Greve, 2008)
Figure 1.4 explains the relationship between BMI and the possibility of employment by gender among the different age groups (Greve, 2008). The results indicated that the possibility of being employed for men will be extremely high with increases in the BMI before the age of 26 to 27 years old. After that, the possibility for men being employed will decline as the BMI increases.
In the meanwhile, for women, the possibility of being employed will increase as the BMI increases until the ages of 22 to 25 years old. After that, it reduces gradually, as the BMI is greater than 30 for all age levels. This shows that women with a high body weight are struggling in the labour market, as compared to men.
On the other hand, being obese will influence individual job performance, due to a poor health status. This will affect the individual employment status in terms of whether they can engage in the labour force or quit the market directly (Renna & Thakur, 2010).Furthermore, most of the individuals who fall under this situation are old aged workers (above 60 years old).
1.3 Problem Statement
Based on the statistics of the MOH, 4.4 million adults (17.7 percent of the populations) fall into an obese group. This trend is going to increase at an alarmingly high rate, as compared to previous years (NHMS, 2015). Rising costs and the worldwide economic downturn has worsened the problem of financing the health care sector in Malaysia. The available funds are insufficient to finance and make a significant contribution to the
© COPYRIG
HT UPM
21
population’s health15. For these reasons, it is important to better understand the impact of obesity in relation to the economic performance. Furthermore, few studies have explained the impact of obesity on social and economic realities. As such, it is very crucial to find out what the costs of obesity are before any solutions or advice can being given.
The main problem is the lack of literature regarding obesity, which makes the Malaysian’s level of awareness low. An unbalanced diet due to eating a variety of foods could lead to an obesity problem. Even though there are many identical adverse impacts due to obesity in terms of social, economic and psychological impacts; the public’s awareness of the obesity problem is currently weak. Alternatively, there is a gap between society’s knowledge and behaviour (Ministry of Health, 2010). Although people have a basic understanding of the negative consequences of obesity, they still engage in unhealthy lifestyles.
Nevertheless, the burden of obesity in Malaysia is expected to be a significant health concern in the near future. If the prevalence of obesity keeps on rising, the personal medical costs will increase too. Individuals with obesity are required to pay more for their medical treatments, as compared to others. Additionally, the negative consequences (e.g., lives lost and life with a disability) will affect the national gross domestic product (GDP) in terms of a productivity loss. Likewise, the lower salary offer for obese people will reduce the potential tax revenue to the government and further enlarge the income inequality level in Malaysia.
The soaring cost of personal medical care has caused people’s daily expenditures to be higher than before. This led to hard decision choices in lifestyles and medical care. Moreover, the existing government subsidized health centres are unable to keep up with the demand for medical care. Hence, individuals have to pick up a larger share of the increasing price from their own pocket (Malaysia Medical Association, 2014).
Population health plays a very important element in maintaining the stability of society and the development of the nation’s economics. However, most of the literature is focused on mortality, not on the long-time sickness that affects patient daily lives. Other than monetary value, obesity also causes mortality and morbidity. In other words, obesity will cause an individual to suffer from a disability. The extreme case will be obesity-attributable deaths. Both mortality and disability will be costly to society. The health risk will differ by gender. For example, coronary heart disease kills more males than females. Therefore, Years of Lives Lost (YLL) and Years of Disability (YLD) should be counted differently.
15 Population health refers to the health outcomes of a group of individuals.
© COPYRIG
HT UPM
22
WHO reported the burden of disease attributed to obesity by six sub-regions. However, this report did not include Malaysia. This may show that there is a lack of interest by researchers in this topic or no funding available for it as the funding mostly spend on medical care. In fact, the burden of disease studies is useful to measure health loss and better planning towards quality of life. In addition, the diseases suggested by WHO are not fully explained by the prevalence of disease related to obesity, despite that Malaysians are formed by a different race. Some of the diseases have a high prevalence across different ethnicities. The Chinese had a higher prevalence of hypertension and hyperlipidaemia. Indians had higher rates of diabetes mellitus and a family history of premature coronary artery disease (CAD) (Ang & Chan, 2016).
Furthermore, poor health status constrains productivity and leads to increases in business costs. Employees with a particularly high BMI can be less productive in the workplace, due to many health problems. Moreover, they might require frequent medical check-ups. Thus, the health care costs will be higher, as compared with non-obese employees.
The hidden cost will have a significant effect on labour market outcomes. Although appearance is unrelated to productivity, wage differentials are often accompanied by observable productive characteristics, such as human capital and experiences. This further explains the possibility of discrimination in the labour market. The obesity penalty16 does happen in certain extreme cases, where obese women are being paid a lower rate (Chu & Ohinmaa, 2016). The results suggest discrimination happens when employers have a negative perception in that obese women tend to have limited self-control, as opposed to women of a moderate weight. They often view obese employees with laziness, lack of honesty and motivation. Therefore, employers are unlikely to place those employees in a management team.
In conclusion, the economic cost of obesity is a crucial area of study, because obesity related comorbidities exert a heavy toll on the economy and society at large. Obesity leads to a greater risk with respect to multiple diseases, which leads to high medical costs to treat obesity related comorbidities. On the other hand, the occurrence of multiple obesity related diseases is also linked to a higher chance of premature death and impairment. Coronary heart disease, cerebrovascular disease and cardiac failure leads patients to be more likely to engage in dying earlier.
16 Obesity penalty refers to unfair treatment of obese workers.
© COPYRIG
HT UPM
23
1.4 Objectives
The general objective of this study is to explore the economic cost of obesity in Malaysia.
Specific Objectives
1. To determine the impact of BMI on personal medical costs. 2. To examine the burden of obesity via disability-adjusted life years (DALY). 3. To examine the effects of obesity on the labour market performance.
1.5 Significance of the Study
Since obesity is the main contributor to numerous health conditions, it is no longer an individual problem when it is linked to health care and productivity costs. When adults engage in obesity, they are putting themselves at a high risk for various chronic diseases. The impact of obesity is not limited to higher medical costs. Its impacts further extend into health status and the labour market. Thus, this study will provide some evidence links to obesity patients in terms of medical costs, health dimensions and the labour market.
Employees will tend to overlook obesity as an individual problem, since they are lack access to the information. As such, the majority negative perception is based on individual experience. Obese individuals are often the targets of bias. They are vulnerable to negative attitudes in multiple domains of living. However, based on the outcome of this research, they will better understand their weaknesses, as compared to others, in terms of workplace performance. Obese employees should be more vigorous in weight loss programs and changing their attitudes. This comprehensive research provides insight into the labour market in Malaysia and highlights the missing piece of the puzzle.
This study will provide a basis for policymakers for developing a public health policy to curb obesity. By strengthening the latest trends of obesity prevalence in Malaysia, more effective practices can be implemented. At the same time, health care organizations will play an important role. They can provide a good health management framework to the public and introduce a greater health status.
Unlike other diseases, obesity is preventable. The snapshot of the problem associated with obesity will lead to high awareness and actions by the individuals. As obesity is a matter of personal responsibility, individuals need better self-control in their daily lives. Throughout this research, the adverse effect of obesity is heavily emphasised. Thus,
© COPYRIG
HT UPM
24
obese individuals should shift their lifestyles in a healthy mode, such as by practicing healthier eating and devoting more time to physical activities.
For the researcher, this study will help to identify the critical areas of obesity by looking at the economic perspectives, where most of the previous literature has focussed on scientific findings. Since obesity has a serious impact on multiple health issues, it is costly to treat an obese patient with multiple diseases. Thus, the most cost-effective method is to educate the population about the negative consequences of obesity. If the population fails to identify the issues and underestimates the obesity problem, all preventive and management interventions are useless.
1.6 Organization of the Study
The organization of this thesis is as follows. Chapter Two introduces the literature review based on each objective basis. The first objective describes the Grossman Model, which explains the demand for health care and provides a comprehensive explanation of the differences of the demand in goods and services, as compared with health care. Furthermore, the determinants of medical costs are absorbed from the various studies. The second section focuses on reviewing the Burden of Disease via two methods: DALY and the quality-adjusted life year (QALY). Finally, the Taste of Discrimination Model explains the occurrence of discrimination and illustrates how this study is distinguished from other works which focus on the Human Capital Model.
Chapter Three provides a brief description of the methodology and the procedures used for the data collection process. For the first objective, an economic technique (Generalized Linear Models) was applied to measure the direct cost of obesity. To maintain the robustness of the results, a few diagnostic tests (e.g., Modified Park Test, Pregibon Link Test, Pearson Correlation Test and Information Criteria) were done. Next, the indirect costs were measured in two difference perspectives. The burden of disease due to obesity will be computed by using DALY. The impact of obesity to the labour market was carried out with questionnaires. The content validity and the sampling process was described, and the Cumulative Logit Model was presented.
Chapter Four explains the data analysis process and presents the results. Finally, Chapter Five offers a summary and discussion of the researcher's findings, implications for practice, and recommendations for future research.
© COPYRIG
HT UPM
111
6 REFERENCES
Adnan, T. H., Bujang, M. A., Supramaniam, P., & Hamid, M. A. (2012). Trend analysis of medically certified death in Malaysia , 1995 – 2010. Journal of Health Informatics in Developing Countries, 6(1), 396–405.
Alberti G, Zimmet P, Shaw J, Bloomgarden Z, Kaufman F, S. M. (2004). Type 2 diabetes in the young : The Evolving Epidemic. Diabetes Care ,27(7), 1798-1811.
Ali, S. A. (2012). Sample size calculation and sampling techniques sample size. Journalof Pakistan Medical Association, 62(6), 624–626.
Alley, D. E., & Chang, V. W. (2007). The changing relationship of obesity and disability, 1988-2004. Journal of the American Medical Association, 298(17), 2020–2027.
Allison, D. B., Downey, M., Atkinson, R. L., Billington, C. J., Bray, G. A, Eckel, R. H., …and Tremblay, A. (2008). Obesity as a disease: a white paper on evidence and arguments commissioned by the Council of the Obesity Society. Obesity (Silver Spring, Md.), 16(6), 1161–1177.
American Diabetes Association. (2016). 6. Obesity management for the treatment of type 2 diabetes. Diabetes Care, 39(January), S47–S51.
Amoako, A. O., & Pujalte, G. G. A. (2014). Osteoarthritis in young, active, and athletic individuals. Clinical Medicine Insights: Arthritis and Musculoskeletal Disorders, 7, 27–32.
Anderson, B., Rafferty, A. P., Lyon-callo, S., Fussman, C., & Imes, G. (2011). Fast-food consumption and obesity among michigan adults. Preventing Chronic Disease,8(4), A71.
Apovian, C. M. (2010). The causes, prevalence, and treatment of obesity revisited in 2009: What have we learned so far? The American Journal of Clinical Nutrition,91(1), 277S–279S.
Armour, B. S., Courtney-long, E. A., Campbell, V. A., & Wethington, H. R. (2013). Disability prevalence among healthy weight , overweight , and obese adults. Obesity (Silver Spring), 21(4), 852–855.
Australian Institute of Health and Welfare. (2013) Diabetes and disability: impairments, activity limitations, participation restrictions and comorbidities. Canberra: AIHW, 2013. (AIHW Cat. No. CVD 63; Diabetes Series No. 20.)
Averett, S. L. (2014). The hidden private cost of obesity : Lower earnings and a lower probability of employment. IZA World of Labor, (May), 1–10.
© COPYRIG
HT UPM
112
Azman, W., Ahmad, W., & Kui-hian, S. (2012). National cardiovascular disease annual report of the percutaneous coronary intervention (PCI) Registry. (MOH/S CRC/38.14(AR) Kuala Lumpur, Malaysia: National Cardiovascular Disease database, 2014.
Badran, M., & Laher, I. (2011). Obesity in Arabic-speaking countries. Journal of Obesity,686430.
Barker, L. a., Gout, B. S., & Crowe, T. C. (2011). Hospital malnutrition: Prevalence, identification and impact on patients and the healthcare system. International Journal of Environmental Research and Public Health, 8(2), 514–527.
Bain, L. E., Awah, P. K., Geraldine, N., Kindong, N. P., Sigal, Y., Bernard, N., & Tanjeko, A. T. (2013). Malnutrition in Sub-Saharan Africa: Burden, causes and prospects. Pan African Medical Journal, 15, 1–9.
Barba, C., Cavalli-Sforza, T., Cutter, J., Darnton-Hill, I., Deurenberg, P., Deurenberg-Yap, M., & Gill, T. (2004). Appropriate body-mass index for Asian populations and its implications for policy and intervention strategies. Lancet, 363(9403), 157–63.
Barendregt, J. J., Van Oortmarssen, G. J., Vos, T., & Murray, C. J. (2003). A generic model for the assessment of disease epidemiology: the computational basis of DisMod II. Population Health Metrics, 1, 4.
Barth, E., Bernt, B., Torbjørn, H., & Oddbjørn, R. (2008). Performance pay and inequality, Manpower Human Resources Lab (April). Houghton streets,London.
Basu, A., & Manning, W. G. (2009). Issues for the next Generation of health care cost. Medical Care, 47(7), 109–114.
Baum, C. L., & Ford, W. F. (2004). The wage effects of obesity: A longitudinal study. Health Economics, 13(9), 885–899.
Baum, S. (2014). Higher education earning Premium value, variation, and Trends. Urban Institute, (February), 1–12.
Beltra-Sanchez, H., Razak, F., & Subramanian, S. V. (2014). Going beyond the disability-based morbidity definition in the compression of morbidity framework. Global Health Action 2014, 7, 24166.
Bender, R., & Grouven, U. (1998). Using binary logistic regression models for ordinal data with non-proportional odds. Journal of Clinical Epidemiology, 51(10), 809–816.
© COPYRIG
HT UPM
113
Berenson, J., Doty, M., Abrams, M., & Shih, A. (2012). Achieving better quality of care for low-income populations : The role of health insurance and the medical home for reducing health inequities. The Commonwealth Fund, 11, 1–18.
Bhattacharya, J., & Bundorf, M. K. (2009). The incidence of the healthcare costs of obesity. Journal of Health Economics, 28(3), 649–658.
Bhurosy, T., & Jeewon, R. (2013). Pitfalls of using body mass index (BMI) in assessment of obesity risk. Current Research in Nutrition and Food Science,1(1), 71–76.
Bohl, A. A., Phelan, E. A., Fishman, P. A., & Harris, J. R. (2012). How are the costs of care for medical falls distributed? The costs of medical falls by component of cost, timing, and injury severity. Gerontologist, 52(5), 664–675.
Booth, F. W., Roberts, C. K., & Laye, M. J. (2012). Lack of exercise is a major cause of chronic diseases. Comprehensive Physiology, 2(2), 1143–1211.
Borak, J. (2011). Obesity and the workplace. Occupational Medicine, 61(4), 220–222.
Brathwaite, N. V., Brathwaite, A., & Taylor, M. (2011). The Socio-economic determinants of obesity in adults in the Bahamas. West Indian Medical Journal,60(4), 434–441.
Bray, G. A., Evans, G., Ph, D., & Gregg, E. W. (2012). Lifestyle change and mobility in obese adults with type 2 diabetes. The New England Journal of Medicine, 366, 1209–1217.
Brunello, G., & D’Hombres, B. (2007). Does body weight affect wages? Evidence from Europe. Economics and Human Biology, 5(1), 1–19.
Caley, M., & Sidhu, K. (2011). Estimating the future healthcare costs of an aging population in the UK: Expansion of morbidity and the need for preventative care. Journal of Public Health, 33(1), 117–122.
Caliendo, M., & Lee, W.-S. (2013). Fat chance! Obesity and the transition from unemployment to employment. Economics and Human Biology, 11(2), 121–33.
Camhi, S. M., Crouter, S. E., Hayman, L. L., Must, A, & Lichtenstein, A. H. (2015). Lifestyle behaviors in metabolically healthy and unhealthy overweight and obese women: A preliminary study. Plos One, 10(9), e0138548.
Canadian Nurses Association. (2004). Violence in the Workplace (Vol. 17). Ottawa.
Cawley, J. (2004). An economic framework for understanding physical activity and eating behaviors. American Journal of Preventive Medicine, 27, 117–125.
© COPYRIG
HT UPM
114
Cecchini, M., Sassi, F., Lauer, J. A., Lee, Y. Y., Guajardo-barron, V., & Chisholm, D. (2010). Tackling of unhealthy diets, physical inactivity, and obesity : health effects and cost-effectiveness. The Lancet, 376(9754), 1775–1784.
Chatterjee, S., Levin, C., & Laxminarayan, R. (2013). Unit cost of medical services at different hospitals in India. Plos One, 8(7), e69728.
Choi, H. K., Atkinson, K., Karlson, E. W., & Curhan, G. (2005). Obesity, weight change, hypertension, diuretic use, and risk of gout in men: the health professionals follow-up study. Archives of Internal Medicine, 165(7), 742–748.
Chu, F., & Ohinmaa, A. (2016). The obesity penalty in the labor market using longitudinal Canadian data. Economics and Human Biology, 23, 10–17.
Chua, H. T., & Cheah, J. C. H. (2012). Financing universal coverage in Malaysia: a case study. BMC Public Health, 12(Suppl 1), S7.
Chen, C. K., & Hughes, J. (2004). Using ordinal regression model to analyze student satisfaction questionnaires. Association for Institutional Research, 1, 13.
Clarke, T., Ward, B., Freeman, G., & Schiller, J. (2015). Early release of selected estimates based on data from the January–March 2015 National Health Interview Survey. [Press release] Retrieved from
https://www.cdc.gov/nchs/data/nhis/earlyrelease/earlyrelease201605.pdf
Cohen-Mansfield, J., & Perach, R. (2011). Is there a reversal in the effect of obesity on mortality in old age? Journal of Aging Research, 2011, 765071.
Cylus, J., Hartman, M., Washington, B., Andrews, K., Cylus, B. J., Hartman, M., Catlin, A. (2011). Pronounced gender and age differences are evident in personal health care spending per person. Health Affairs, 30(1), 153-160.
Compolina, A., Adami, F., Santos, J., & Lebrao, M. (2014). Expansion of morbidity : trends in healthy life expectancy of the elderly population. Revista da Associação Médica Brasileira, 60(5), 434–441.
Cossio, M. L. T., Giesen, L. F., Araya, G., Pérez-Cotapos, M. L. S., Vergara, R. L., Manca, M., … Héritier, F. (2012). The Global Burden of Disease: Generating Evidence, Guiding Policy. Institute for Health Metrics and Evaluation (Vol. XXXIII). Seattle, WA: IHME, 2013.
Czado, C., & Munk, A. (2000). Noncanonical links in generalized linear models – when is the effort justified? Journal of Statistical Planning and Inference, 87(2), 317–345.
Czepiel, S. A. (2012). Maximum likelihood estimation of logistic regression models: theory and implementation. Class Notes, 1–23.

© COPYRIG
HT UPM
115
Decola, P. R. (2012). Gender effects on health and healthcare, Handbook of Clinical Gender Medicine. 10–17.
Doehner, W., Von Haehling, S., & Anker, S. D. (2015). Protective overweight in cardiovascular disease: Moving from “paradox” to “paradigm.” European Heart Journal, 36(40), 2729–2732.
Dixon, J. B. (2010). The effect of obesity on health outcomes, Molecular and Cellular Endocrinology.316, 104–108.
Dohmen, T. J. (2004). Performance, seniority, and wages: Formal salary systems and individual earnings profiles. Labour Economics, 11(6), 741–763.
Duffy, B., Smith, K., Terhanian, G., & Bremer, J. (2005). Comparing data from online and face-to-face surveys. International Journal of Market Research, 47(6), 615–639.
Drost, E. A. (2011). Validity and reliability in social science research. Education Research and Perspectives, 38(1), 105–123
Egger, G., & Dixon, J. (2014). Beyond obesity and lifestyle: a review of 21st century chronic disease determinants. BioMed Research International, 2014, 731685.
Einav, L., Finkelstein, A., Ryan, S. P., Schrimpf, P., & Cullen, M. R. (2013). Selection on moral hazard in health insurance. American Economic Review, 103(1), 178–219.
Elias, M. F., & Elias, P. K. (2007). Blood pressure and disability: Novus orsa. Hypertension, 50(6), 1006–1008.
Employment in the Danish State Sector. (2011). Agency for the Modernisation of Public Administration.
Fairuzah Saad. (2015, December 17). personal communication
Fershtman, C., Gneezy, U., & Verboven, F. (2005). Discrimination and nepotism: The efficiency of the anonymity rule. The Journal of Legal Studies, 34(2), 371–396.
Fiaschi, D., & Gabbriellini, C. (2013). Wage functions and rates of return to education in Italy. In Fifth meeting of the Society for the Study of Economic Inequality (ECINEQ) Bari (Italy).
Finkelstein, E. A., Trogdon, J. G., Cohen, J. W., & Dietz, W. (2009). Annual medical spending attributable to obesity: Payer-and service-specific estimates. Health Affairs, 28(5).
Finkelstein EA, Strombotne KL, Popkin BL (2010), Costs of obesity and implications for policy-makers, Choices, 25 (3).
© COPYRIG
HT UPM
116
Finkelstein EA, Strombotne KL (2010), The economics of obesity, American Journal of Clinical Nutrition,91(5).
Finkelstein EA, DiBonaventura M, Burgess SM, Hale BC (2010), The costs of obesity in the workplace, Journal of Occupational & Environmental Medicine, 52 (10): 971-976
Flegal, K. M., & Kalantar-zadeh, K. (2014). Perspective: Overweight, mortality and survival, Obesity (Silver Spring), 21(9), 1744–1745.
Flegal, K. M., Kit, B. K., & Orpana, H. (2013). Association of all-cause mortality with overweight and obesity using standard body mass categories. Journal of the American Medical Association, 309(1), 71–82.
Fontaine, K. R., & Barofsky, I. (2001). Obesity and health-related quality of life. Obesity Reviews : An Official Journal of the International Association for the Study of Obesity, 2(3), 173–182.
Fullerton, A. S. (2009). A conceptual framework for ordered logistic regression models. Sociological Methods & Research, 38, 306–347.
Galama, T. J., Hullegie, P., Meijer, E., & Outcault, S. (2012). Is there empirical evidence for decreasing returns to scale in a health capital model? Health Economics (United Kingdom), 21(9), 1080–1100.
Garcia, J. (2006). Obesity, employment and wages in Europe , The Economics of Obesity (Advances in Health Economics and Health Services Research), 17, p187-21.
Gates, D. M., Succop, P., Brehm, B. J., Gillespie, G. L., & Sommers, B. D. (2008). Obesity and presenteeism: the impact of body mass index on workplace productivity. Journal of Occupational and Environmental Medicine, 50(1), 39–45.
Goulart, B. N. G. De, & Oenning, N. S. X. (2016). Applicability of burden of disease methodology in human communication disorders. Revista CEFAC, 18(3), 778–788.
Gray, A. (2005). Population ageing and health care expenditure. Oxford Institute of Ageing, (2), 15–20.
Gray V, Holman CD. Deaths and premature loss of life caused by overweight and obesity in Australia in 2011–2050: Benefits from different intervention scenarios. Australian Preventative Health Taskforce, 2009. (accessed 22 February 2016).
Greve, J. (2008). Obesity and labor market outcomes in Denmark. Economics and Human Biology, 6(3), 350–362.
© COPYRIG
HT UPM
117
Griswold, M., Parmigiani, G., Potosky, A., & Lipscomb, J. (2004). Analyzing health care costs : a comparison of statistical methods motivated by medicare colorectal cancer charges. Biostatistics, 1(1), 1–23.
Groves, M. O. (2005). How important is your personality? Labor market returns to personality for women in the US and UK. Journal of Economic Psychology,26(6), 827–841.
Growiec, J. (2010). Human Capital, Aggregation, and Growth. Macroeconomic Dynamics, 14(02), 189.
Guh, D. P., Zhang, W., Bansback, N., Amarsi, Z., Birmingham, C. L., & Anis, A. H. (2009). The incidence of co-morbidities related to obesity and overweight: a systematic review and meta-analysis. BMC Public Health, 9, 88.
Guryan, J., & Charles, K. K. (2013). Taste-based or statistical discrimination: The economics of discrimination returns to its roots. Economic Journal, 123(572), 417–432.
Ha, D. T. P., Feskens, E. J. M., Deurenberg, P., Mai, L. B., Khan, N. C., & Kok, F. J. (2011). Nationwide shifts in the double burden of overweight and underweight in Vietnamese adults in 2000 and 2005: two national nutrition surveys. BMC Public Health, 11, 62.
Haagsma, J. A, Graetz, N., Bolliger, I., Naghavi, M., Higashi, H., Mullany, E. C., … Vos, T. (2016). The global burden of injury: incidence, mortality, disability-adjusted life years and time trends from the Global Burden of Disease study 2013. Injury Prevention, 22(1), 3–18.
Hagen, S. (2013). Rising demand for long-term services and supports for elderly people. Washington, DC: Congressional Budget Office, (June). Retrieved from https://www.cbo.gov/publication/44363
Hainer, V., & Aldhoon-Hainerová, I. (2013). Obesity paradox does exist. Diabetes Care,36(SUPPL.2) s276-s281.
Han, E., Norton, E. C., & Powell, L. M. (2011). Direct and indirect effects of body weight on adult wages. Economics and Human Biology, 9(4), 381–392.
Han, T. S., Tajar, A., & Lean, M. E. J. (2011). Obesity and weight management in the elderly. British Medical Bulletin, 97(1), 169–196.
Härkönen, J. (2007). Labour force dynamics and the obesity gap in female unemployment in Finland. Research on Finish Society, 1, 3–15.
Härkönen, J., Räsänen, P., & Näsi, M. (2011). Obesity, unemployment, and earnings. Nordic Journal of Working Life Studies, 1, 23–38.
© COPYRIG
HT UPM
118
Heckman, J. J., Lochner, L. J., & Todd, P. E. (2003). Fifty years of mincer earnings regressions. NBER Working Paper No. 9732.
Heiervang, E., & Goodman, R. (2011). Advantages and limitations of web-based surveys: Evidence from a child mental health survey. Social Psychiatry and Psychiatric Epidemiology, 46(1), 69–76.
Heineck, G., & Anger, S. (2010). The returns to cognitive abilities and personality traits in Germany. Labour Economics, 17(3), 535–546.
Hellec, B., Campbell-Scherer, D., & Allan, G. M. (2015). The skinny on BMI and mortality. Canadian Family Physician, 61(11), 970.
Heinen, L., & Darling, H. (2009). Addressing Obesity in the Workplace: The Role of Employers. Milbank Quarterly, 87(1), 101–122.
Heo, M., Pietrobelli, A., Wang, D., Heymsfield, S. B., & Faith, M. S. (2010). Obesity and functional impairment: influence of comorbidity, joint pain, and mental health. Obesity (Silver Spring, Md.), 18(10), 2030–2038.
Herzing, J. M. E. (2016). Book review. Journal of Offical Statistics, 32(4), 1011–1014.
Hiestand, D. M., Britz, P., Goldman, M., & Phillips, B. (2006). Prevalence of symptoms and risk of sleep apnea in the US population. Chest, 130(3), 780–786.
Hollands, S., Campbell, M. K., Gilliland, J., & Sarma, S. (2014). Association between neigbourhood fast food and full-service restaurant density and body mass index: A cross- sectional study of Canadian adults. Canadian Journal of Public Health,105(3) e172-e178, 3–6.
Honna, N. (2005). English as a multicultural language in Asia and intercultural literacy. Intercultural Communication Studies, 14(2), 73–89.
Hren, R. (2012). Theoretical shortcomings of the Grossman model. Bulletin: Economics, Organisation and Informatics in Healthcare, 28(1), 63–75.
Hussels, S., & Zurbruegg, R. (2005). Demand for insurance. Risk Management and Insurance Review, 8(2), 257–278.
Hyder, A. A, Puvanachandra, P., & Morrow, R. H. (2012). Measuring the health of populations: explaining composite indicators. Journal of Public Health Research, 1(3), 222–8.
Ichiho, H. M., Roby, F. T., Ponausuia, E. S., & Aitaoto, N. (2013). An Assessment of Non-Communicable Diseases , Diabetes , and Related Risk Factors in the Territory of American Samoa : A systems perspective. Journal of Medicine &Public health ,72(5), 10–18.
© COPYRIG
HT UPM
119
Institute for Public Health. (2015). National Health and Morbidity Survey 2015 (NHMS 2015). Vol. II: Non-Communicable Diseases, Risk Factors & Other Health Problems. Ministry of health (Vol. II).
Jaafar, S., Mohd Noh, K., Muttalib, K. A., Othman, N. H., Healy, J., Maskon, K., Said, Z. M. (2013). Malaysia health system review. Asia Pacific Observatory on Health Systems and Policies, 3(1).
Johansson, E., Böckerman, P., Kiiskinen, U., & Heliövaara, M. (2009). Obesity and labour market success in Finland: the difference between having a high BMI and being fat. Economics and Human Biology, 7(1), 36–45.
Jameela Zainuddin (2015). Health Expenditure Report 1997-2013, Kuala Lumpur: Malaysia National Health Accounts Units, Ministry of Health.
Judge, T. A, & Cable, D. M. (2011). When it comes to pay, do the thin win? The effect of weight on pay for men and women. The Journal of Applied Psychology,96(1), 95–112.
Kadir, K. A., Shakizah, W., & Mohd, W. (2015). Students ’ awareness of the importance of English language proficiency with regard to future employment. World Review of Business Research, 5(3), 259–272.
Kaiser, H. (1974). An index of factorial simplicity. Psychometrika, 39, 31-6.
Kamarudin WC. (2015, December 17). Personal communication.
Kang, J. H., Jeong, B. G., Cho, Y. G., Song, H. R., & Kim, K. A. (2011). Socioeconomic costs of overweight and obesity in Korean adults. Journal of Korean Medical Science, 26(12), 1533–1540.
Kim, J. (2011). Education, English language proficiency, and earnings of male immigrants in the US labor market. Journal of Business & Economics Research,1(3), 17–26.
Kimani-Murage, E. W., Muthuri, S. K., Oti, S. O., Mutua, M. K., Van De Vijver, S., & Kyobutungi, C. (2015). Evidence of a double burden of malnutrition in urban poor settings in Nairobi, Kenya. Plos One, 10(6), 1–17.
Kimberlin, C. L., & Winterstein, A. G. (2008). Validity and reliability of measurement instruments used in research. American Journal of Health-System Pharmacy,65(23), 2276–2284.
Konnopka, a., Bödemann, M., & König, H. H. (2011). Health burden and costs of obesity and overweight in Germany. European Journal of Health Economics, 12(4), 345–352.

© COPYRIG
HT UPM
120
Kőszegi, B. (2006). Emotional agency. The Quarterly Journal of Economics, 121(1), 121-155.
Krejcie, R. V, & Morgan, D. W. (1970). Determining sample size for research activities. Educational and Psychological Measurement, 38, 607–610.
Kuperman, E. F., Showalter, J. W., Lehman, E. B., Leib, A. E., & Kraschnewski, J. L. (2013). The impact of obesity on sepsis mortality: a retrospective review. BMC Infectious Diseases, 13, 377.
Kyrou, I., Osei-Assibey, G., Williams, N., Thomas, R., Halder, L., Taheri, S., Kumar, S. (2011). Self-reported disability in adults with severe obesity. Journal of Obesity,10–13.
Latifa M. hameed, & Fadilah Mat Nor. (2014). Public and private shares in the distribution of doctors in Malaysia. Synergizing Knowledge on Management and Muamalah, 1(May), 57–64.
Lawson, C., & Montgomery, D. C. (2006). Logistic regression analysis of customer satisfaction data. Quality and Reliability engineering International, 22, 971–984.
Lehnert, T., Sonntag, D., Konnopka, A., Riedel-Heller, S., & König, H.-H. (2013). Economic costs of overweight and obesity. Best Practice & Research. Clinical Endocrinology & Metabolism, 27(2), 105–15.
Lengerke, T. Von, & Krauth, C. (2011). Maturitas economic costs of adult obesity : A review of recent European studies with a focus on subgroup-specific costs. Maturitas, 69(3), 220–229.
Letamo, G., & Navaneetham, K. (2014). Prevalence and determinants of adult under-nutrition in Botswana. Plos One 9(7), e102675.
Li, C., Engström, G., Hedblad, B., Calling, S., Berglund, G., & Janzon, L. (2006). Sex differences in the relationships between BMI, WHR and incidence of cardiovascular disease: a population-based cohort study. International Journal of Obesity, 30, 1775–1781.
Lipscy, P. Y., & Schipper, L. Energy efficiency in the japanese transport sector, Energy Policy. 56, 248–258
Liu, I., & Agresti, A. (2005). The analysis of ordered categorical data: an overview and a survey of recent developments. Sociedad de Estadıstica E Investigacion Operativa Test, 14(1), 1–73.
Lobstein, T. (2011). Prevalence and costs of obesity. Medicine, 39(1), 11–13.
© COPYRIG
HT UPM
121
Loo, K., & Gan, S. (2012). Burden of stroke in Malaysia. International Journal of Stroke,7(2), 165–167.
Long, G. I. (2013). Differences between union and nonunion compensation, 2001–2011. Monthly Labor Review, 17.
Lyon, H. N., & Hirschhorn, J. N. (2005). Genetics of common forms of obesity: a brief overview. The American Journal of Clinical Nutrition, 82(1), 215–217.
Maas, A. H. E. M., & Appelman, Y. E. A. (2010). Gender differences in coronary heart disease, Netherlands Heart Journal, 18(12), 598–603.
Magosso, E., Ansari, M. A., Gopalan, Y., Rizal, M., Yuen, K. H., Shuaib, I. L., & Nesaretnam, K. (2010). Prevalence of non-alcoholic fatty Liver in a hypercholesterolemia population of northwestern peninsular Malaysia. TheSoutheast Asian Journal of Tropical Medicine and Public Health ,41(4), 936–942.
Malehi, A. S., Pourmotahari, F., & Angali, K. A. (2015). Statistical models for the analysis of skewed healthcare cost data: a simulation study. Health Economics Review, 5(11), 1–16.
Malik, V. S., Willett, W. C., & Hu, F. B. (2013). Global obesity: trends, risk factors and policy implications. Nature Reviews :Endocrinology, 9(1), 13–27.
Malnick, S. D. H., & Knobler, H. (2006). The medical complications of obesity. QJM: monthly journal of the Association of Physicians, 99(9), 565–579.
Manning, W. G., & Mullahy, J. (2001). Estimating log models: To transform or not to transform? Journal of Health Economics, 20(4), 461–494.
Martínez-mesa, J., González-chica, D. A., Duquia, R. P., Bastos, J. L., & Bonamigo, R. R. (2016). Sampling : how to select participants in my research study ?. Anais Brasileiros de Dermatologia, 91(3), 326–330.
Mason, C., & Perreault, W. (2012). Collinearity,power, and intreoretation of interpretation regression analysis multiple. Journal of Marketing Research,28(3), 268–280.
Maynard, J. W., McAdams DeMarco, M. a, Baer, A. N., Köttgen, A., Folsom, A. R., Coresh, J., & Gelber, A. C. (2012). Incident gout in women and association with obesity in the Atherosclerosis Risk in Communities (ARIC) Study. The American Journal of Medicine, 125(7).
Mela, C. F., & Kopalle, P. K. (2002). The impact of collinearity on regression analysis: the asymmetric effect of negative and positive correlations. Applied Economics,34(6), 667–677.
© COPYRIG
HT UPM
122
Mirel, L., & Carper, K. (2014). Trends in Health Care Expenditures for the Elderly, Age 65 and Over: 2001, 2006, and 2011. Agency for Healthcare research and quality.
Mitra, A. (2001). Effects of physical attributes on the wages of males and females, Applied Economics Letters. 8,731-735.
Moghaddam, A. A., Woodward, M., & Huxley, R. (2007). Obesity and risk of colorectal cancer: A meta-analysis of 31 studies with 70,000 events. Cancer Epidemiology Biomarkers and Prevention, 16(12), 2533–2547.
MOH. (2004). Clinical practice guidelines on management of obesity. Kuala Lumpur, Minstry of Health.
MOH. (2011). Clinical practice guideline management of dyslipidemia 2011. Kuala Lumpur, Minstry of Health.
MOH. (2015). Management of type 2 diabetes mellitus. Kuala Lumpur, Minstry of Health.
Mohanty, M. S. (2009). Effects of positive attitude on happiness and wage: Evidence from the US data. Journal of Economic Psychology, 30(6), 884–897.
Mohanty, M. S. (2013). Why are positive attitude and wage correlated? The role of productivity re-examined. Journal of Quantitative Economics, 11, 277-307.
Mohanty, M. S. (2015). Estimating the simultaneous relationship among job satisfaction, wage and positive attitude of matured adults : the US evidence. The Business and Management Review, 6(3), 174–188.
Mora, T., Gil, J., & Sicras-mainar, A. (2013). The influence of BMI , obesity and overweight on medical costs : a panel data perspective. Journal of Cultural Economics, 37(2), 185-201
Moran, J. L., Solomon, P. J., Peisach, A. R., & Martin, J. (2007). New models for old questions: Generalized linear models for cost prediction. Journal of Evaluation in Clinical Practice, 13(3), 381–389.
Murray, C. J. L., Lopez, a. D., & Jamison, D. T. (1994). The global burden of disease in 1990: Summary results, sensitivity analysis and future directions. Bulletin of the World Health Organization, 72(3), 495–509.
Murray, C. L. (2015) Global, regional, and national life expectancy, all-cause mortality, and cause-specific mortality for 249 causes of death, 1980-2015: a systematic analysis for the Global Burden of Disease Study 2015. The Lancet, 388, 1459-1544.
Moreno, P. (2010). Unions and discrimination. Cato Journal, 30(1), 67–85.
© COPYRIG
HT UPM
123
Mwachofi, A., & Al-Assaf, A. F. (2011). Health care market deviations from the ideal market. Sultan Qaboos University Medical Journal, 11(3), 328–337.
Nagai, M., Kuriyama, S., Kakizaki, M., Ohmori-matsuda, K., Sone, T., Hozawa, A., Tsuji, I. (2012). Impact of obesity, overweight and underweight on life expectancy and lifetime medical expenditures : the Ohsaki Cohort Study. BMJ, 2
Nair, G. K. S., Rahim, R. A., Setia, R., Husin, N., Sabapathy, E., Jalil, N. A. A., Seman, N. A. (2012). Malaysian graduates English adequacy in the job sector. Asian Social Science, 8(4), 143–147.
Ng, V. K. Y., & Cribbie, R. A. (2016). Using the gamma generalized linear model for modeling continuous, skewed and heteroscedastic outcomes in psychology. Current Psychology, , 1–11.
Nickson, D., Timming, A. R., Re, D., & Perrett, D. I. (2016). Subtle increases in BMI within a healthy weight range still reduce womens employment chances in the service sector. PLOS ONE, 11(9), 1–14.
Nor Azlin, M. N., Aljunid, S. M., Aziz, N. A., Nur, M., & Sulong, S. (2012). Direct medical Cost of stroke : Findings from a tertiary hospital in Malaysia. Medical Journal of Malaysia, 67(5), 468–472.
Nord, E., Daniels, N., & Kamlet, M. (2009). QALYs : Some Challenges. International Society for Pharmacoeconomic and Outcomes Research, 12(10), 10–15.
Nowrojee, S., Codde, J., Geelhoed, L., Somerford, P., & Branch, E. (2005). Burden of disease : a framework for health planning ? WA Burden of disease study, epidemiology branch, Department of Health, Government of Western Australia, Perth.
Nuttall, F. (2015). Body Mass Index. Nutrition Today, 50(3), 117–128.
Oakkar, E. E., Stevens, J., Truesdale, K. P., & Cai, J. (2015). BMI and all-cause mortality among Chinese and Caucasians : the people ’ s Republic of China and the atherosclerosis risk in communities studies. Asia Pacific Journal of Clinical Nutrition, 24, 472–479.
Oga, E. A., & Eseyin, O. R. (2016). The obesity paradox and heart failure: A systematic review of a decade of evidence. Journal of Obesity, 2016.
Ogden, C. L., Carroll, M. D., Fryar, C. D., & Flegal, K. M. (2015). Prevalence of obesity Among adults and youth: United States, 2011-2014. NCHS Data Brief, (219), 1–8.
Organisation for Economic Co-operation and Development. (2014). OECD: Obestiy update 2014. OECD Health Statistics, (June), 8.

© COPYRIG
HT UPM
124
Owens, G. M. (2008). Gender differences in health care expenditures, resource utilization, and quality of care. Journal of Managed Care Pharmacy : JMCP,14(3 Suppl), 2–6.
Pager D, & Shepherd H. (2012). The sociology of discrimination: Racial discrimination in employment, housing, credit and consumer markets. Annual Review of Sociology, 100(2), 130–134.
Pakseresht, S., Ingle, G. K., Garg, S., & Sarafraz, N. (2014). Stage at diagnosis and delay in seeking medical care among women with breast cancer, delhi, India. Iranian Red Crescent Medical Journal, 16(12), e14490.
Palmieri, J. J., & Stern, T. A. (2009). Lies in the doctor-patient relationship. The Primary Care Companion to The Journal of Clinical Psychiatry, 11(4), 163–168.
Pan, C. X., Chai, E., & Farber, J. (2008). Myths of the high medical cost of old age and dying. International Journal of Health Services : Planning, Administration, Evaluation, 38(2), 253–275.
Panter, J., Desousa, C., & Ogilvie, D. (2013). Incorporating walking or cycling into car journeys to and from work: The role of individual, workplace and environmental characteristics. Preventive Medicine, 56(3-4), 211–217.
Park, J. (2009). Obesity on the job. Perspectives, 10(2), 14–22.
Pallant, J. (2013). SPSS Survival Manual. A step by step guide to data analysis using SPSS, 4th edition. Retrieved from www.allenandunwin.com/spss
Park, J.-H., Yoon, S.-J., Lee, H., Jo, H.-S., Lee, S.-I., Kim, Y., Shin, Y. (2006). Burden of disease attributable to obesity and overweight in Korea. International Journal of Obesity (2005), 30(11), 1661–1669.
Perlroth, D. J., Goldman, D. P., & Garber, A. M. (2010). The potential impact of comparative effectiveness research on U.S. health care expenditures. Demography, 47, S173–S190.
Phan, L. H., Kho, J., & Ching, B. (2013). Nation building, English as an international language, medium fo instruction and language debate:Malaysia and possible ways forward. Journal of International and Comparative Education, 2(2), 58–71.
Polinder, S., Haagsma, J. A, Stein, C., & Havelaar, A. H. (2012). Systematic review of general burden of disease studies using disability-adjusted life years. Population Health Metrics, 10(1), 21.
Puhl, R., & Brownell, K. D. (2001). Bias, discrimination, and obesity. Obesity Research,9(12), 788–805.
© COPYRIG
HT UPM
125
Quek, D. K. L. (2008). The Malaysian health care system a review. Intensive workshop on health systems in transition, Kuala Lumpur, Malaysia, 29–30 April 2009
Racine, E. F., Laditka, S. B., Dmochowski, J., Alavanja, M. C. R., Lee, D., & Hoppin, J. A. (2012). Farming activities and carrying and lifting: the agricultural health study. Journal of Physical Activity & Health, 9(1), 39–47.
Rechel B, Doyle Y, Grundy E, McKee M. (2009). How can health systems respond to population ageing? Policy Brief No. 10. Joint Observatory/HEN series on health systems and policy analysis. Copenhagen: World Health Organization, on behalf of the European Observatory on Health Systems and Policies.
Renna, F., & Thakur, N. (2010). Direct and indirect effects of obesity on U.S. labor market outcomes of older working age adults. Social Science & Medicine, 71(2), 405–413.
Richman, I. B., & Brodie, M. (2014). A national study of burdensome health care costs among non-elderly Americans. BMC Health Services Research, 14,473.
Ritchie, S. A., & Connell, J. M. C. (2007). The link between abdominal obesity, metabolic syndrome and cardiovascular disease. Nutrition, Metabolism and Cardiovascular Diseases, 17(4), 319–326.
Robberstad, B. (2005). Qaly vs daly vs lys gained: What are the difference, and what difference do they make for health care priority setting? Norsk Epidemiologi,15(2), 183–191.
Roeters, J. E., Lennep, V., Westerveld, H. T., Erkelens, D. W., & Van, E. E. (2002). Risk factors for coronary heart disease : implications of gender. Cardiovascular Research, 53, 538–549.
Rubin J.B, & Borden W.B. (2012). Coronary artery disease in young adults. Current Atherosclerosis Reports, 14, 140–149.
Department of Statistics. (2014). Salaries and Wages Survey Report. Kuala Lumpur, Malaysia.
Salvetti, M. D. G., Pimenta, C. A. D. M., Braga, P. E., & Corrêa, C. F. (2012). Disability related to chronic low back pain: Prevalence and associated factors. Revista Da Escola de Enfermagem Da USP, 46 Spec No, 16–23.
Sassi, F. (2006). Calculating qalys, comparing qaly and daly calculations. Health Policy and Planning, 21(5), 402–408.
Stevens, J.P. (1992). Applied Multivariate Statistics for the Social Sciences (2nd edition). Hillsdale, NJ: Erlbaum.

© COPYRIG
HT UPM
126
Schmid, F. (2016). The gender wage gap in Switzerland over time. Swiss Journal of Sociology, 42(3), 443–467.
Seong, A. C., Chb, M. B., Kok, C., John, M., & Cth, F. (2016). A review of coronary artery disease research in malaysia. Medical Journal of Malaysia, 71(June), 42–57.
Sharifzadeh, M. (2013). Does fitness and exercises increase productivity ? Assessing health, fitness and productivity Relationship, American Journal of Management, 13(1), 32–52.
Shaya, F. T., Mullins, C. D., & Wong, W. (2002). Incidence versus prevalence modeling in pharmacoeconomics. Expert Review of Pharmacoeconomics & Outcomes Research, 2(5), 435–442.
Sivanandam, H & Rahim,R .‘Increase won’t burden patients’. The Star, November 16, 2016 p.1.Retrieved from http://www.thestar.com.my/news/nation/2016/11/16/increase-wont-burden-patients-dg-those-who-choose-first-class-wards-can-afford-it/
Smink, F. R. E., Van Hoeken, D., & Hoek, H. W. (2012). Epidemiology of eating disorders: Incidence, prevalence and mortality rates. Current Psychiatry Reports, 14(4), 406–414.
Smyth, G. K. (2003). Pearson’s goodness of fit statistic as a score test statistic. Science and Statistics: A Festschrift for Terry Speed, 40(March), 1–12.
Snipes, M., & Taylor, D. C. (2014). Model selection and akaike information criteria: An example from wine ratings and prices. Wine Economics and Policy, 3(1), 3–9.
Solé-Auró, A., & Alcañiz, M. (2014). Are we living longer but less healthy? Trends in mortality and morbidity in Catalonia (Spain), 1994-2011. European Journal of Ageing, 61–70.
Spalding, M., & Sebesta, S. (2008). Geriatric screening and preventive care. American Academy of Family Physicians, 2, 206–2015.
Stem, A., & Adult, W. M. (2014). An example of selecting a statistical model for your health services research : Using pooled cross-sectional survey data sets, medical expenditure panel survey from 1996 to 2008.University of Alberta Health Science Journal, 10(1).
Stoner, L., & Cornwall, J. (2014). Did the American Medical Association make the correct decision classifying obesity as a disease? Australasian Medical Journal,7(11), 462–464.
© COPYRIG
HT UPM
127
Streiner, D. L. (2003). Construct validity of the relationship profile test : A self-report measure of dependency-detachment. Journal of Personality Assessment, 80(1), 99–103.
Suff, P., Cox, A., & Reilly, P. (2007). Paying for performance new trends in performance-related pay. Institute for Employment Studies, 1–38.
Suruhanjaya Perkidmatan Awam. (2015). Annual Report 2015. Kuala Lumpur.
Swinburn, B., Caterson, I., Seidell, J., & James, W. (2004). Diet, nutrition and the prevention of excess weight gain and obesity. Public Health Nutrition, 7(1a), 123–146.
Szirmai, A. (2012). Industrialisation as an engine of growth in developing countries, 1950-2005. Structural Change and Economic Dynamics, 23(4), 406–420.
Szolnoki, G., & Hoffmann, D. (2013). Online, face-to-face and telephone surveys - Comparing different sampling methods in wine consumer research. Wine Economics and Policy, 2(2), 57–66.
Tavakol, M., & Dennick, R. (2011). Making sense of cronbach’s alpha. International Journal of Medical Education, 2, 53–55.
Teddlie, C., & Yu, F. (2007). Mixed methods sampling: A typology with examples. Journal of Mixed Methods Research, 1(1), 77–100.
Tharakan, J. (2012). Stroke registry - relevance and contributions. Medical Journal of Malaysia, 67(3), 251–252.
The United Nations World Food Programme. (2005). Food Insecurity and Vulnerability Analysis. Dili, Timor Leste.
Thirusanku, J., & Md Yunus, M. (2014). Status of English in Malaysia. Asian Social Science, 10(14), 254–260.
Todorova, T., & Dzharova, V. (2010). Optimal time and opportunity cost of job search in low-income groups: An out-of-the-job Search model. Modern Economy,01(03), 195–205.
Tong, S. F., Low, W. Y., & Ng, C. J. (2011). Profile of men’s health in Malaysia: problems and challenges. Asian Journal of Andrology, 13(4), 526–533.
Tsai, A, Williamson, D, & Glick, H. (2011). Direct medical cost of overweight and obesity in the United States: a quantitative systematic review. International Association for the Study of Obesity, 12(1), 50–61.
© COPYRIG
HT UPM
128
Van Sonderen, E., Sanderman, R., & Coyne, J. C. (2013). Ineffectiveness of reverse wording of questionnaire items: Let’s learn from cows in the rain. PLOS ONE,8(7), 1–7.
Vatcheva, K., Lee, M., McCormick, J. B., & Rahbar, M. H. (2016). Multicollinearity in regression analyses conducted in epidemiologic studies. Epidemiology, 06(02), 1–20.
Villareal, D. T., Apovian, C. M., Kushner, R. F., & Klein, S. (2005). Obesity in older adults: Technical review and position statement of the American Society for Nutrition and NAASO, The Obesity Society. American Journal of Clinical Nutrition, 82(5), 923–934.
Višnjić, a., Veličković, V., & Milosavljević, N. (2011). Qaly-measure of cost-benefit analysis of health interventions. Scientific Journal of the Faculty of Medicine in Niš, 28(4), 195–199.
Vlassoff, C. (2007). Gender differences in determinants and consequences of health and illness. Journal of Health, Population and Nutrition, 25(1), 47–61.
Waddell, G. R. (2006). Labor-market consequences of poor attitude and low self-esteem in youth. Economic Inquiry, 44(1), 69–97.
Wang, S., Liu, L., Li, L., & Liu, J. (2014). Comparison of Chinese inpatients with different types of medical insurance before and after the 2009 healthcare reform. BMC Health Services Research, 14(1), 443.
Wang, Y. C., McPherson, K., Marsh, T., Gortmaker, S. L., & Brown, M. (2011). Health and economic burden of the projected obesity trends in the USA and the UK. The Lancet, 378(9793), 815–825.
Wang, Y., & Liu, Q. (2006). Comparison of akaike information criterion (AIC) and bayesian information criterion (BIC) in selection of stock-recruitment relationships. Fisheries Research, 77(2), 220–225.
Wang, Z., Liu, M., Pan, T., & Tong, S. (2016). Lower Mortality Associated With Overweight in the U.S. National Health Interview Survey: Is Overweight Protective? Medicine, 95(2), e2424–e2424.
Webber, L., Divajeva, D., Marsh, T., McPherson, K., Brown, M., Galea, G., & Breda, J. (2014). The future burden of obesity-related diseases in the 53 WHO European-Region countries and the impact of effective interventions: a modelling study. BMJ Open, 4(7), e004787.
Weinstein, M. C., Torrance, G., & Mcguire, A. (2009). Qalys : The Basics. International Society for Pharmacoeconomic and Outcomes Research, 12(1),s5-s9
© COPYRIG
HT UPM
129
Whitehead, S. J., & Ali, S. (2010). Health outcomes in economic evaluation: the Qaly and utilities. British Medical Bulletin, 96(1), 5–21.
Wiener, J. M., & Tilly, J. (2002). Population ageing in the United States of America: implications for public programmes. International Journal of Epidemiology,31(4), 776–781.
Wild. (2004). Estimates for the year 2000 and projections for 2030. World Health, 27(5), 1047–1053.
Winship, C. & Mare, R. (1984). Regression models with ordinal variables. American Sociological Review, 49(4), 512–525.
Woo, K. H. (2015). Recruitment Practices in the Malaysian public sector: Innovations or political responses? Journal of Public Affairs Education, 21(2), 229–246.
World Health organization (2009) Global health risks - Mortality and burden of disease attributable to selected major risks. Retrieved from:
http://www.thehealthwell.info/node/9612.
Wu, X., Lu, Y., Zhou, S., Chen, L., & Xu, B. (2016). Impact of climate change on human infectious diseases: Empirical evidence and human adaptation. Environment International, 86, 14–23.
Wynia, M. K. (2009). The risks of rewards in health care: How pay-for-performance could threaten, or bolster, medical professionalism. Journal of General Internal Medicine, 24(7), 884–887.
Yip, C. H., Pathy, N. B., & Teo, S. (2014). A review of breast cancer reseach in Malaysia. Medical Journal of Malaysia, 69(August), 8–22.
Yip, C. H., Taib, N. A. M., & Mohamed, I. (2006). Epidemiology of breast cancer in Malaysia. Asian Pacific Journal of Cancer Prevention, 7(3), 369–374.
Zainal Ariffin, O., & Nor Saleha, I. (2011). National Cancer Registry 2007. Kuala Lumpur: Ministry of Health.
Zhao, W., Zhai, Y., Hu, J., Wang, J., Yang, Z., Kong, L., & Chen, C. (2008). Economic burden of obesity-related chronic diseases in Mainland China. Obesity Reviews,9(SUPPL. 1), 62–67.
Zheng, W., McLerran, D. F., Rolland, B., Zhang, X., Inoue, M., Matsuo, K., … Tsugane, S. (2011). Association between body-mass index and risk of death in more than 1 million Asians. New England Journal of Medicine, 364(8), 719–729.
Zussman, A. (2013). Ethnic discrimination: Lessons from the Israeli online market for used cars. Economic Journal, 123(572), 433–468.


![OBESITI [Sumber Elektronik]](https://img.pdfslide.net/doc/110x75/55cf8e52550346703b90ea04/obesiti-sumber-elektronik.jpg)


![OBESITI [Sumber Internet].pdf](https://img.pdfslide.net/doc/110x75/5867853b1a28ab36408bd5c9/obesiti-sumber-internetpdf.jpg)