Embed Size (px)
Citation preview

ASIA AND PACIFIC COMMISSION ON AGRICULTURAL STATISTICS
TWENTY-SIXTH SESSIONThimphu, Bhutan, 15-19 February 2016
Agenda Item 6.4
Food and Nutrition Security; A Status Report of Nepal
Contributed by: Hem Raj Reg, Senior Statistics OfficerMinistry of Agriculture Development, [email protected]
APCAS/16/6.4.4
Hem Raj Regmi
Ministry of Agriculture Development Nepal
Food and Nutrition Security; A Status Report
of NepalBased on Food Balance Sheets and Household Survey using
ADEPT FSM ModulesBy
Building statistical capacity for quality food security and nutrition information in support
of better informed policies : FAO TCP/RAS/3409
3
PRESENTATION OUTLINE1. Brief about Nepal and Nepalese Agriculture
2. Methodology Adopted by MOAD on measuring food security
3. Data Generation, Analysis and Products Details on Food Balance
Sheet and ADePT/FSM
4. Lesson Learned and Way Forward
5. Acknowledgements
7 provinces5 development regions3 ecological region
MountainHillTerai
Nepal- a small but diverse country
DOLPA
MUGU
JUMLA
KAILALI
BARD IYA
HUMLA
DOTI
SU RKHET
NAWAL
PARASI
KAPIL-
BASTURU PAN-
DEH I
DANG
BANKE
ACHHAM KALIKO T
JHAPA
MORANG
SIRAHA
SAPTARI
DARCHULA
BAJHANG
BAITAD I
DADEL-
DHURA
KANCHAN-
PUR
BAJU RA
PARSA
BARARAU T-
AHAT
DHANU SA
MAHO -
TARI
SU NSARI
SARLAH I
DHAD ING
MAKAWAN-
PU R
CH ITWAN
KASKI
TANAHU
PALPA
SYANGJA
PARBAT
ARGHAK
HACH I
GU LMI
UDAYAPU R
SINDHU LI
I LAM
BHOJ-
PU R
DHAN-
KU TA
TAPLEJU NG
OKHAL-
DHUNGA
TERHA-
THUM
KHOTANG
LALIT
BHAK
KATHM
SU LU K-
HUMBU
DOLAKHA
SANKHUWA-
SABA
NUWAKOT
SINDHU -
PALCHOK
KAVRE
RASUWA
LAMJUNG
GORKHA
PYU T-
HAN
ROLPA
SALYANMYAGD I
DAILEKH
JAJARKOT
RU KUM
MUSTANG
MANANG
CHINA
INDIA
N
Farwestern Midwestern
Western
Central
Eastern10 religions125 caste/ethnic groups123 languages spoken as mother tongue
60 m above the sea level to highest peak in the worldThe Mount Everest-8848 m
Life expectancy ranges from 42 years in Mugu to 75 years in Kathmandu
5
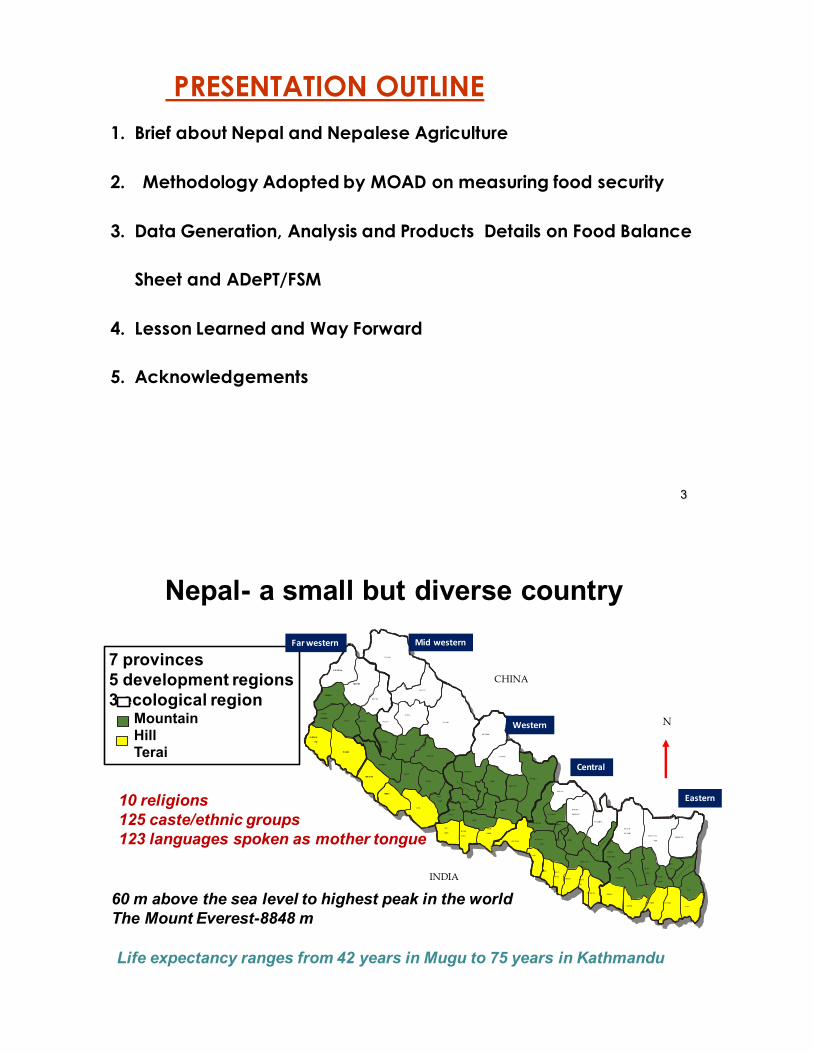
Nepalese agriculture
• 27% land arable, 18 percent cultivated
• 54 percent irrigated; 33% has over the years irrigation
facility
• >60% employment
• >33% GDP contribution
• 78% hold land size < 0.8 ha (CBS 2011)
• 0.84% of total energy consumption
• Consumption of commercial fuel (7.14%), petroleum
(9.66%), electricity (2.7%), renewable (5.5%)
Food Security in Nepal; Policy, Strategy and Practices
•Constitutional provision for food and nutrition security•Constitutional right
– Right to food sovereignty as fundamental citizen right – Obligation of State– Policies of State
• Agriculture Development StrategyOverarching policy document for agriculture sector for next 20 yearsStrong emphasis on food and nutrition security (FNS)• 4 Strategic Components
– Governance ; – Productivity;.– Commercialization; – Competitiveness;.
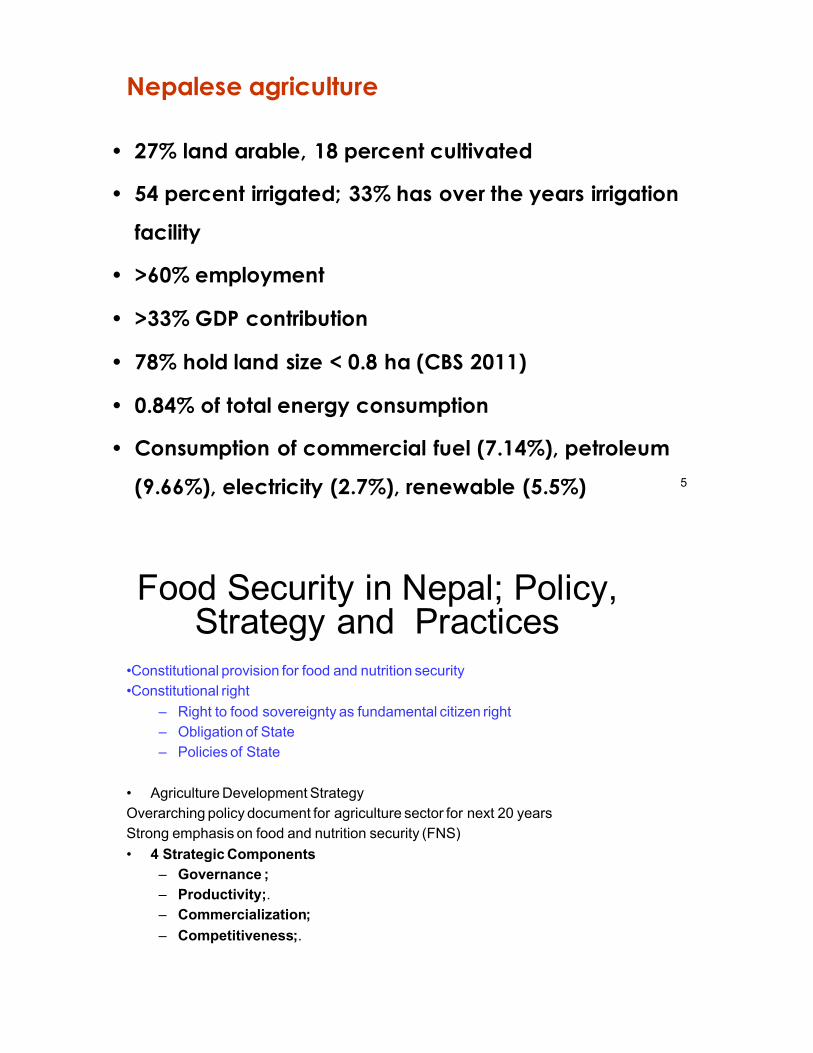
Food security and nutrition: An Approach Paper to the Thirteenth Plan (FY 2013/14-15/16)
Objectives-To improve the consumption of food in sufficient quantity and nutrient value, and
-To identify areas and communities vulnerable to food insecurity and increase their access to nutritious
foodstuffs.
Strategies-Make necessary arrangements in food-and-nutrition-insecure areas and communities for solving the
food crisis in the short and the long term.
-Implement targeted programmes for raising the production of suitable high-value commodities in
those areas most vulnerable to food insecurity.
-Ensure food security (food availability, stability in use, and continuity) through the protection,
promotion and efficient use of agro-biodiversity and the development and expansion of climate
change-adaptive technologies, and
-Create an efficient regulatory mechanism to ensure that foodstuff is clean and healthy.
Operating Policies-A Food and Nutrition Security Policy, Food Sovereignty Act, and National Food and Nutrition Security
Action Plan will be formulated and implemented.
-Access to nutritious foodstuff will be enhanced by providing special facilities for increasing livestock
production and productivity
-The Nepal Food Security Monitoring System will be institutionalised.
Expected outcomesThe status of food-and-nutrition security in vulnerable areas will have improved, market infrastructures
such as storage facilities and collection centers will have been enhanced, modern technology and
equipment will be used in food-related research, standards for the import and export of foodstuff
will have been established.
Multi-Sector Nutrition Plan Framework
Each Ministries has their own responsibilities!
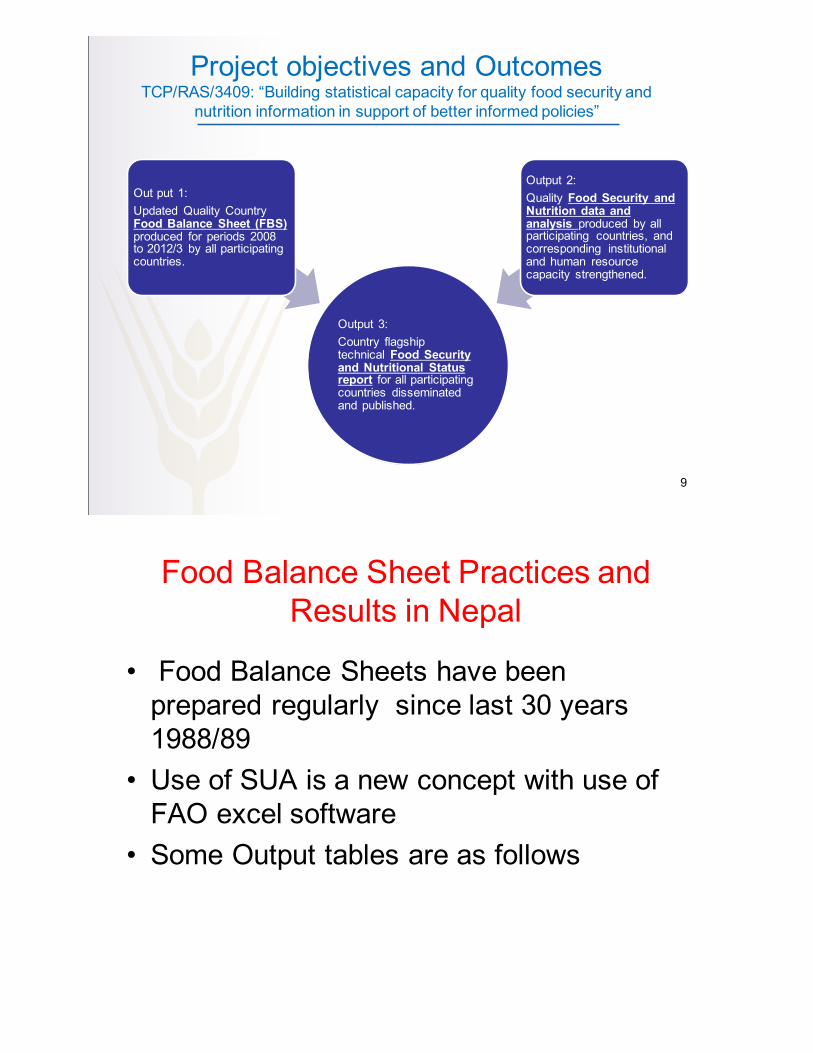
Project objectives and OutcomesTCP/RAS/3409: “Building statistical capacity for quality food security and
nutrition information in support of better informed policies”
9
Output 3: Country flagship technical Food Security and Nutritional Status report for all participating countries disseminated and published.
Out put 1: Updated Quality Country Food Balance Sheet (FBS) produced for periods 2008 to 2012/3 by all participating countries.
Output 2: Quality Food Security and Nutrition data and analysis produced by all participating countries, and corresponding institutional and human resource capacity strengthened.
Food Balance Sheet Practices and Results in Nepal
• Food Balance Sheets have been prepared regularly since last 30 years 1988/89
• Use of SUA is a new concept with use of FAO excel software
• Some Output tables are as follows
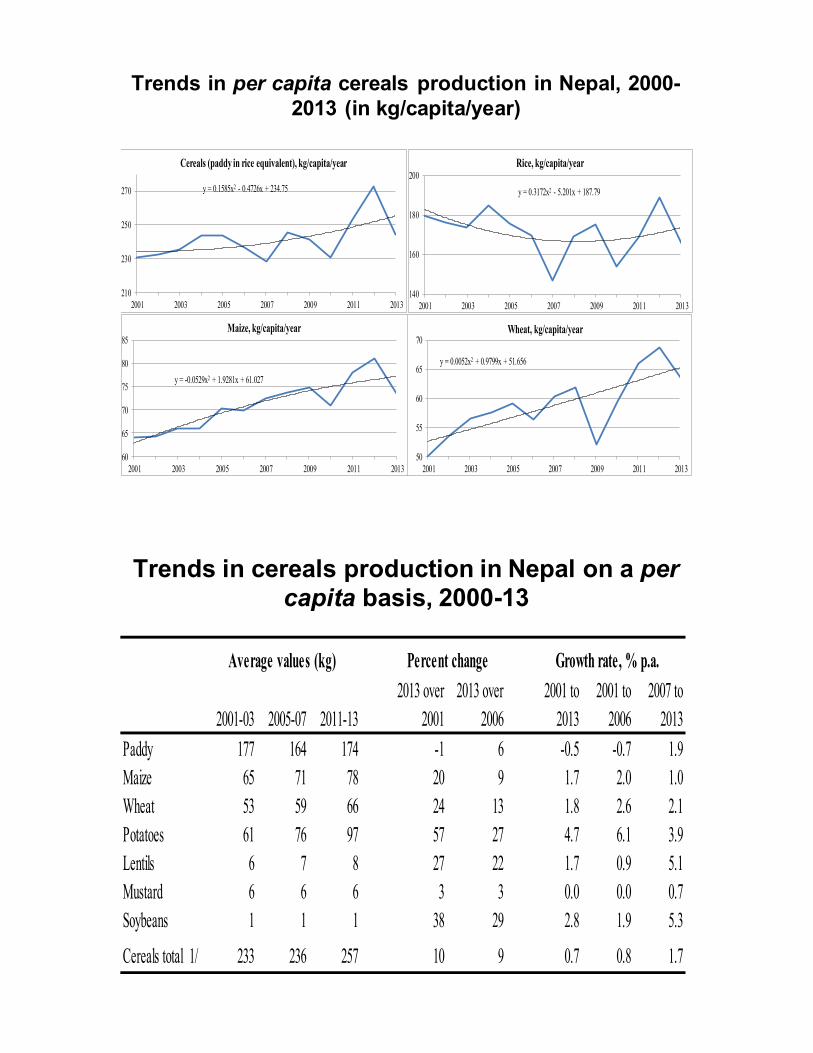
Trends in per capita cereals production in Nepal, 2000-2013 (in kg/capita/year)
y = 0.1585x2 - 0.4726x + 234.75
210
230
250
270
2001 2003 2005 2007 2009 2011 2013
Cereals (paddy in rice equivalent), kg/capita/year
y = 0.3172x2 - 5.201x + 187.79
140
160
180
200
2001 2003 2005 2007 2009 2011 2013
Rice, kg/capita/year
y = -0.0529x2 + 1.9281x + 61.027
60
65
70
75
80
85
2001 2003 2005 2007 2009 2011 2013
Maize, kg/capita/year
y = 0.0052x2 + 0.9799x + 51.656
50
55
60
65
70
2001 2003 2005 2007 2009 2011 2013
Wheat, kg/capita/year
Trends in cereals production in Nepal on a per capita basis, 2000-13
2013 over 2013 over 2001 to 2001 to 2007 to2001-03 2005-07 2011-13 2001 2006 2013 2006 2013
Paddy 177 164 174 -1 6 -0.5 -0.7 1.9Maize 65 71 78 20 9 1.7 2.0 1.0Wheat 53 59 66 24 13 1.8 2.6 2.1Potatoes 61 76 97 57 27 4.7 6.1 3.9Lentils 6 7 8 27 22 1.7 0.9 5.1Mustard 6 6 6 3 3 0.0 0.0 0.7Soybeans 1 1 1 38 29 2.8 1.9 5.3
Cereals total 1/ 233 236 257 10 9 0.7 0.8 1.7
Average values (kg) Percent change Growth rate, % p.a.

Trends in the DES and their adequacy levels for Nepal and other South Asian countries
Average DES, kcal/caput/day
Growth rate, % p.a.1991-93 1999-01 2011-13 1991-00 2001-13
Bangladesh 2,077 2,272 2,454 1.00 0.53India 2,291 2,359 2,453 0.52 0.73Nepal 2,218 2,279 2,544 0.38 1.01Pakistan 2,318 2,365 2,442 0.42 0.58Sri Lanka 2,165 2,343 2,492 1.05 0.67SA-5 2,270 2,349 2,454 0.55 0.69
Adequacy of the DES, %
Growth rate, % p.a.1991-93 1999-01 2011-13 1991-00 2001-13
Bangladesh 97 103 108 0.70 0.22India 106 107 108 0.28 0.52Nepal 106 108 118 0.24 0.80Pakistan 109 109 108 0.17 0.28Sri Lanka 96 102 110 0.82 0.76SA-5 105 107 108 0.31 0.47
Average values
Average values
0
20
40
60
80
100
120
Bangladesh India Nepal Pakistan Sri Lanka SA-5
Adequacy of the DES, %
Avg1991-93 Avg1999-01 Avg2011-13
0
500
1000
1500
2000
2500
3000
Bangladesh India Nepal Pakistan Sri Lanka SA-5
Average DES, kcal/caput/day
Avg1991-93 Avg1999-01 Avg2011-13
Trends in the availability of food energy (calories/per capita/day), 2008-13
Grw. rate
S.N. Product groups 2008 2009 2010 2011 2012 2013 Av08-13 % Cum % % p.a.1 Rice 891 837 818 819 831 878 846 30 30 -0.32 Maize 525 535 537 604 608 507 553 20 49 1.03 Wheat 386 326 406 340 318 321 350 12 62 -3.44 Edible oils/oilseeds 217 197 242 253 254 259 237 8 70 4.85 Potatoes/yams 126 151 156 158 166 176 155 5 76 5.66 Milk/dairy products 118 122 147 142 155 158 140 5 81 6.17 Pulses/beans 77 79 72 89 84 134 89 3 84 9.08 Spices 65 79 87 88 105 86 85 3 87 6.49 Other cereals 90 81 81 81 80 89 84 3 90 -0.310 Sugar 75 75 84 82 80 92 81 3 93 3.311 Vegetables 64 66 69 74 77 77 71 3 95 4.212 Meats 60 69 61 59 59 65 62 2 97 -0.413 Fruits 55 57 33 34 49 48 46 2 99 -3.214 Nuts 7 7 27 17 11 15 14 0.5 99 12.215 Alchol. beverages 10 11 13 13 13 12 12 0.4 100 3.916 Fish 3 3 3 3 3 3 3 0.1 100 -1.517 Coffee/tea 1 1 1 0 1 1 1 0.0 100 6.8
All total 2,772 2,698 2,837 2,855 2,894 2,922 2,830 100 - 1.4 Cereals total 1,892 1,779 1,842 1,844 1,837 1,795 1,832 65 - -0.5 - cereals share % 68 66 65 65 63 61 65 - - -1.8 Non-cereals total 879 919 995 1,012 1,057 1,126 998 35 - 4.8 - non-cereals share % 32 34 35 35 37 39 35 - - 3.4
Food energy -kcal/capita/day
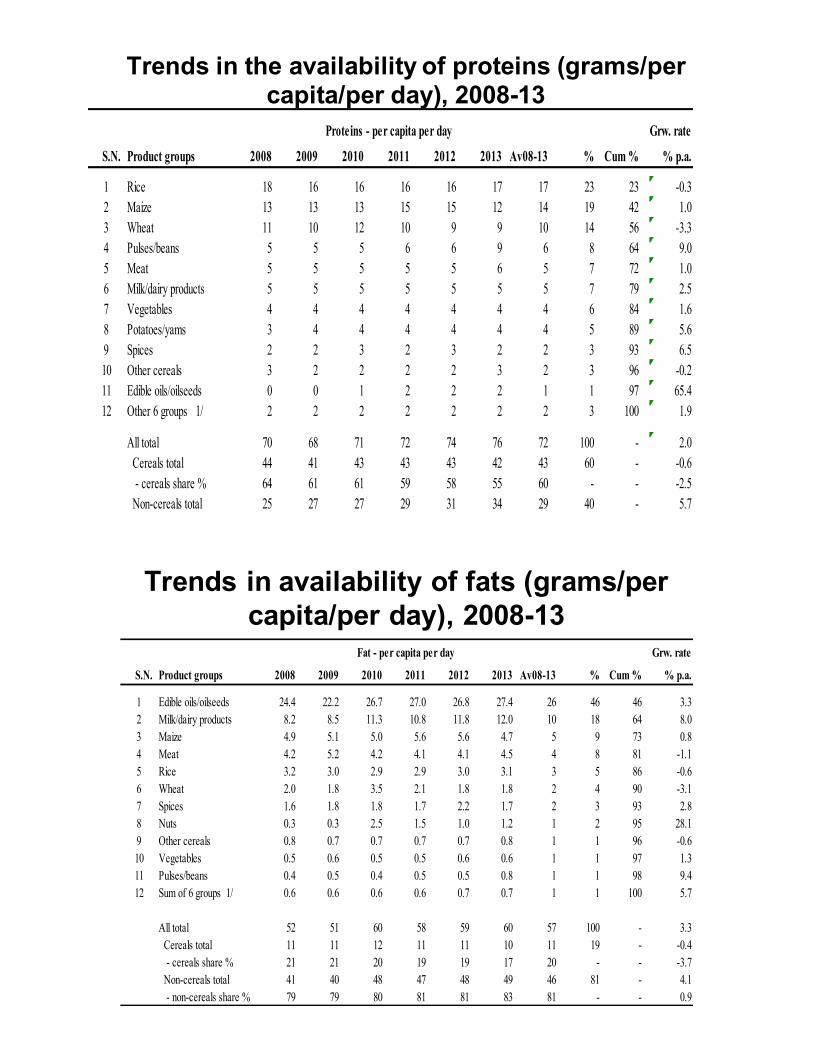
Trends in the availability of proteins (grams/per capita/per day), 2008-13
Grw. rate
S.N. Product groups 2008 2009 2010 2011 2012 2013 Av08-13 % Cum % % p.a.
1 Rice 18 16 16 16 16 17 17 23 23 -0.32 Maize 13 13 13 15 15 12 14 19 42 1.03 Wheat 11 10 12 10 9 9 10 14 56 -3.34 Pulses/beans 5 5 5 6 6 9 6 8 64 9.05 Meat 5 5 5 5 5 6 5 7 72 1.06 Milk/dairy products 5 5 5 5 5 5 5 7 79 2.57 Vegetables 4 4 4 4 4 4 4 6 84 1.68 Potatoes/yams 3 4 4 4 4 4 4 5 89 5.69 Spices 2 2 3 2 3 2 2 3 93 6.510 Other cereals 3 2 2 2 2 3 2 3 96 -0.211 Edible oils/oilseeds 0 0 1 2 2 2 1 1 97 65.412 Other 6 groups 1/ 2 2 2 2 2 2 2 3 100 1.9
All total 70 68 71 72 74 76 72 100 - 2.0 Cereals total 44 41 43 43 43 42 43 60 - -0.6 - cereals share % 64 61 61 59 58 55 60 - - -2.5 Non-cereals total 25 27 27 29 31 34 29 40 - 5.7 - non-cereals share % 36 39 39 41 42 45 40 - - 3.7
Proteins - per capita per day
Trends in availability of fats (grams/per capita/per day), 2008-13
Grw. rate
S.N. Product groups 2008 2009 2010 2011 2012 2013 Av08-13 % Cum % % p.a.
1 Edible oils/oilseeds 24.4 22.2 26.7 27.0 26.8 27.4 26 46 46 3.32 Milk/dairy products 8.2 8.5 11.3 10.8 11.8 12.0 10 18 64 8.03 Maize 4.9 5.1 5.0 5.6 5.6 4.7 5 9 73 0.84 Meat 4.2 5.2 4.2 4.1 4.1 4.5 4 8 81 -1.15 Rice 3.2 3.0 2.9 2.9 3.0 3.1 3 5 86 -0.66 Wheat 2.0 1.8 3.5 2.1 1.8 1.8 2 4 90 -3.17 Spices 1.6 1.8 1.8 1.7 2.2 1.7 2 3 93 2.88 Nuts 0.3 0.3 2.5 1.5 1.0 1.2 1 2 95 28.19 Other cereals 0.8 0.7 0.7 0.7 0.7 0.8 1 1 96 -0.610 Vegetables 0.5 0.6 0.5 0.5 0.6 0.6 1 1 97 1.311 Pulses/beans 0.4 0.5 0.4 0.5 0.5 0.8 1 1 98 9.412 Sum of 6 groups 1/ 0.6 0.6 0.6 0.6 0.7 0.7 1 1 100 5.7
All total 52 51 60 58 59 60 57 100 - 3.3 Cereals total 11 11 12 11 11 10 11 19 - -0.4 - cereals share % 21 21 20 19 19 17 20 - - -3.7 Non-cereals total 41 40 48 47 48 49 46 81 - 4.1 - non-cereals share % 79 79 80 81 81 83 81 - - 0.9
Fat - per capita per day

Import, Trade and Stock Dependency and Self Sufficiency Ratio in different years
-20
0
20
40
60
80
100
2009 2010 2011 2012 2013ImportDependancyRatio 9.3 12 11.2 13 15.4TradeDependencyRatio -6.4 -10.9 -10.3 -12 -14.3StockDependencyRatio 1.5 -1.6 1.2 6.5 2.9SelfSufficiencyRatio 95.1 87.5 90.9 94.5 88.6
Ratio
inPercentage
4 36
25
11
45
117
37
0
10
20
30
40
50
Energy Protein Fats
Import dependency rates (%), 2008-13 average
From cereals From non-cereals From all products

Estimatesofaveragekcalandproteins(inFAOdatabaseandfromnewFBS)
2000
2200
2400
2600
2800
3000
2001 2003 2005 2007 2009 2011 2013
Dietary energy (kcal/capita/day)FAO dataNew FBS estimates
50
60
70
80
2001 2003 2005 2007 2009 2011 2013
Proteins (gm/capita/day)
FAO dataNew FBS estimates
Givenaveragekcalavailability,estimatedratesofundernourishment(PoU,hunger)andfoodinadequacy(PoFI)(2011)
Assumptions: Min. kcal requirement 1,724 kcal for PoU (hunger) & 2,200 kcal for PoFI (inadequacy) (CoVdistribution assumed same). Estmated using log-normal distribution (the FAO method).
6.8
3.8
2.5
0.0
2.0
4.0
6.0
8.0
FAOSOFI NLSS/Adept newFBS
PoU - %ofpop.undernorished31
22
17
0
8
16
24
32
FAOSOFI NLSS/Adept newFBS
PoFI - %ofpop.withfoodinadequacy
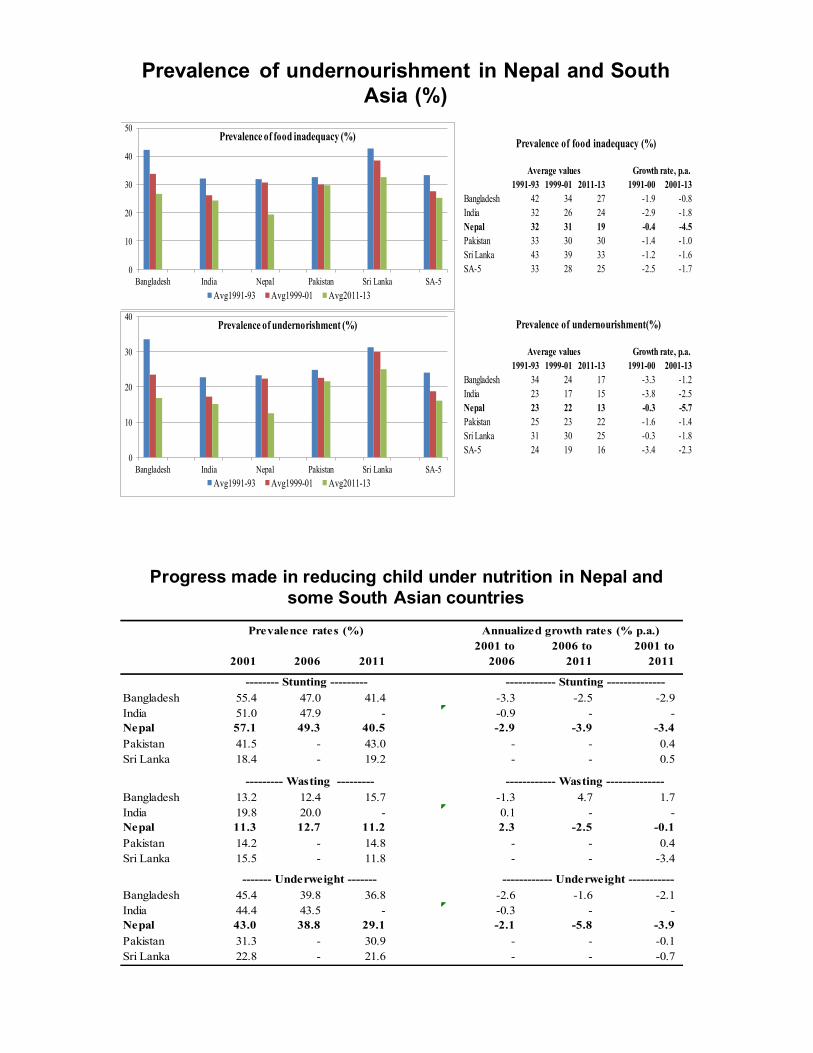
Prevalence of undernourishment in Nepal and South Asia (%)
Prevalence of food inadequacy (%)
Growth rate, p.a.1991-93 1999-01 2011-13 1991-00 2001-13
Bangladesh 42 34 27 -1.9 -0.8India 32 26 24 -2.9 -1.8Nepal 32 31 19 -0.4 -4.5Pakistan 33 30 30 -1.4 -1.0Sri Lanka 43 39 33 -1.2 -1.6SA-5 33 28 25 -2.5 -1.7
Prevalence of undernourishment(%)
Growth rate, p.a.1991-93 1999-01 2011-13 1991-00 2001-13
Bangladesh 34 24 17 -3.3 -1.2India 23 17 15 -3.8 -2.5Nepal 23 22 13 -0.3 -5.7Pakistan 25 23 22 -1.6 -1.4Sri Lanka 31 30 25 -0.3 -1.8SA-5 24 19 16 -3.4 -2.3
Average values
Average values
0
10
20
30
40
50
Bangladesh India Nepal Pakistan Sri Lanka SA-5
Prevalence of food inadequacy (%)
Avg1991-93 Avg1999-01 Avg2011-13
0
10
20
30
40
Bangladesh India Nepal Pakistan Sri Lanka SA-5
Prevalence of undernorishment (%)
Avg1991-93 Avg1999-01 Avg2011-13
Progress made in reducing child under nutrition in Nepal and some South Asian countries
2001 to 2006 to 2001 to2001 2006 2011 2006 2011 2011
-------- Stunting --------- ------------ Stunting --------------Bangladesh 55.4 47.0 41.4 -3.3 -2.5 -2.9India 51.0 47.9 - -0.9 - -Nepal 57.1 49.3 40.5 -2.9 -3.9 -3.4Pakistan 41.5 - 43.0 - - 0.4Sri Lanka 18.4 - 19.2 - - 0.5
--------- Wasting --------- ------------ Wasting --------------Bangladesh 13.2 12.4 15.7 -1.3 4.7 1.7India 19.8 20.0 - 0.1 - -Nepal 11.3 12.7 11.2 2.3 -2.5 -0.1Pakistan 14.2 - 14.8 - - 0.4Sri Lanka 15.5 - 11.8 - - -3.4
------- Underweight ------- ------------ Underweight -----------Bangladesh 45.4 39.8 36.8 -2.6 -1.6 -2.1India 44.4 43.5 - -0.3 - -Nepal 43.0 38.8 29.1 -2.1 -5.8 -3.9Pakistan 31.3 - 30.9 - - -0.1Sri Lanka 22.8 - 21.6 - - -0.7
Prevalence rates (%) Annualized growth rates (% p.a.)
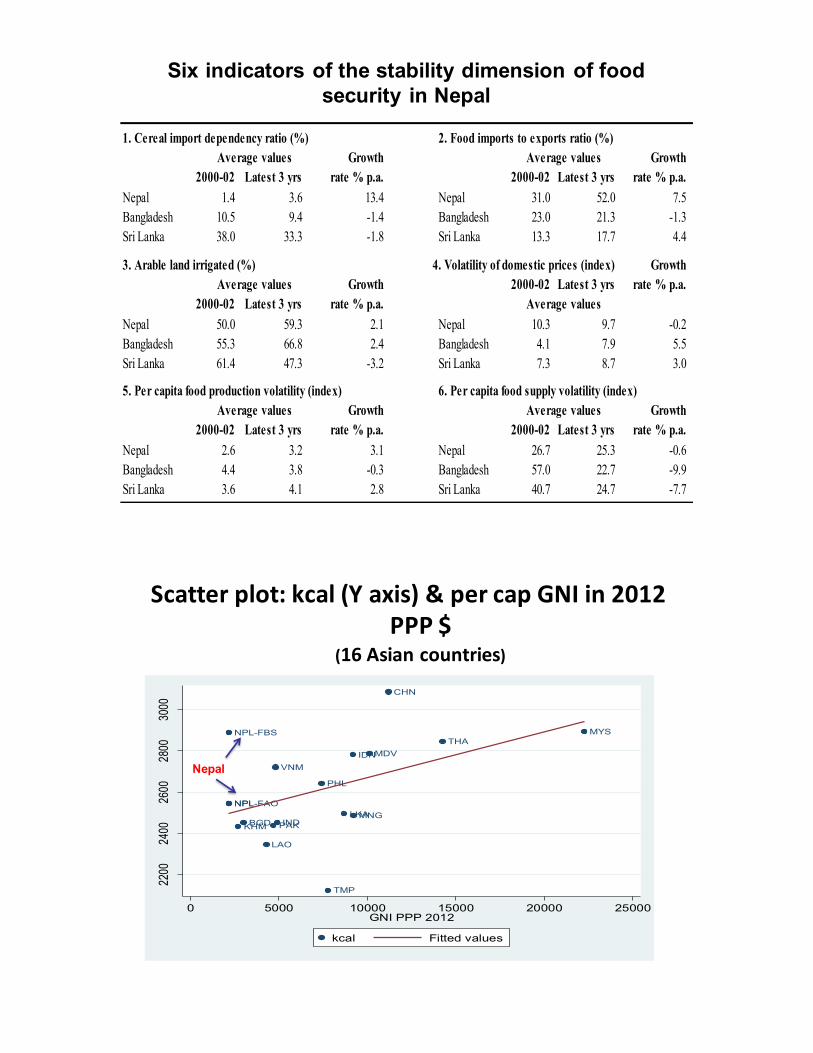
Six indicators of the stability dimension of food security in Nepal
2. Food imports to exports ratio (%)Growth Growth
2000-02 Latest 3 yrs rate % p.a. 2000-02 Latest 3 yrs rate % p.a.Nepal 1.4 3.6 13.4 Nepal 31.0 52.0 7.5Bangladesh 10.5 9.4 -1.4 Bangladesh 23.0 21.3 -1.3Sri Lanka 38.0 33.3 -1.8 Sri Lanka 13.3 17.7 4.4
4. Volatility of domestic prices (index) GrowthGrowth 2000-02 Latest 3 yrs rate % p.a.
2000-02 Latest 3 yrs rate % p.a.Nepal 50.0 59.3 2.1 Nepal 10.3 9.7 -0.2Bangladesh 55.3 66.8 2.4 Bangladesh 4.1 7.9 5.5Sri Lanka 61.4 47.3 -3.2 Sri Lanka 7.3 8.7 3.0
5. Per capita food production volatility (index) 6. Per capita food supply volatility (index)Growth Growth
2000-02 Latest 3 yrs rate % p.a. 2000-02 Latest 3 yrs rate % p.a.Nepal 2.6 3.2 3.1 Nepal 26.7 25.3 -0.6Bangladesh 4.4 3.8 -0.3 Bangladesh 57.0 22.7 -9.9Sri Lanka 3.6 4.1 2.8 Sri Lanka 40.7 24.7 -7.7
1. Cereal import dependency ratio (%) Average values
Average values Average values
Average values Average values
Average values
3. Arable land irrigated (%)
Scatterplot:kcal(Yaxis)&percapGNIin2012PPP$
(16Asiancountries)CHN
MYSNPL-FBS
NPL-FAONPL
THAMDVIDN
VNM
PHL
LKAMNGINDBGD PAKKHM
LAO
TMP
2200
2400
2600
2800
3000
0 5000 10000 15000 20000 25000GNI PPP 2012
kcal Fitted values
Nepal

Results from ADePt FSM using Nepal Living Standard Survey III Data
Engle ratio – expenditure on food to total consumption expenditure by deciles (%), 2010-11 for Nepal (2010 for Bangladesh)
30
40
50
60
70
80
D 1 D 2 D 3 D 4 D 5 D 6 D 7 D 8 D 9 D 10
Engle ratio (%) - urban
Nepal Bangladesh
30
40
50
60
70
80
D 1 D 2 D 3 D 4 D 5 D 6 D 7 D 8 D 9 D 10
Engle ratio - rural
Nepal Bangladesh
Variation in caloric intake levels by TCE decile, 2010/11
1,500
2,000
2,500
3,000
3,500
4,000
4,500
D 1 D 2 D 3 D 4 D 5 D 6 D 7 D 8 D 9 D 10
Calories (kcal)
Urban householdsRural households
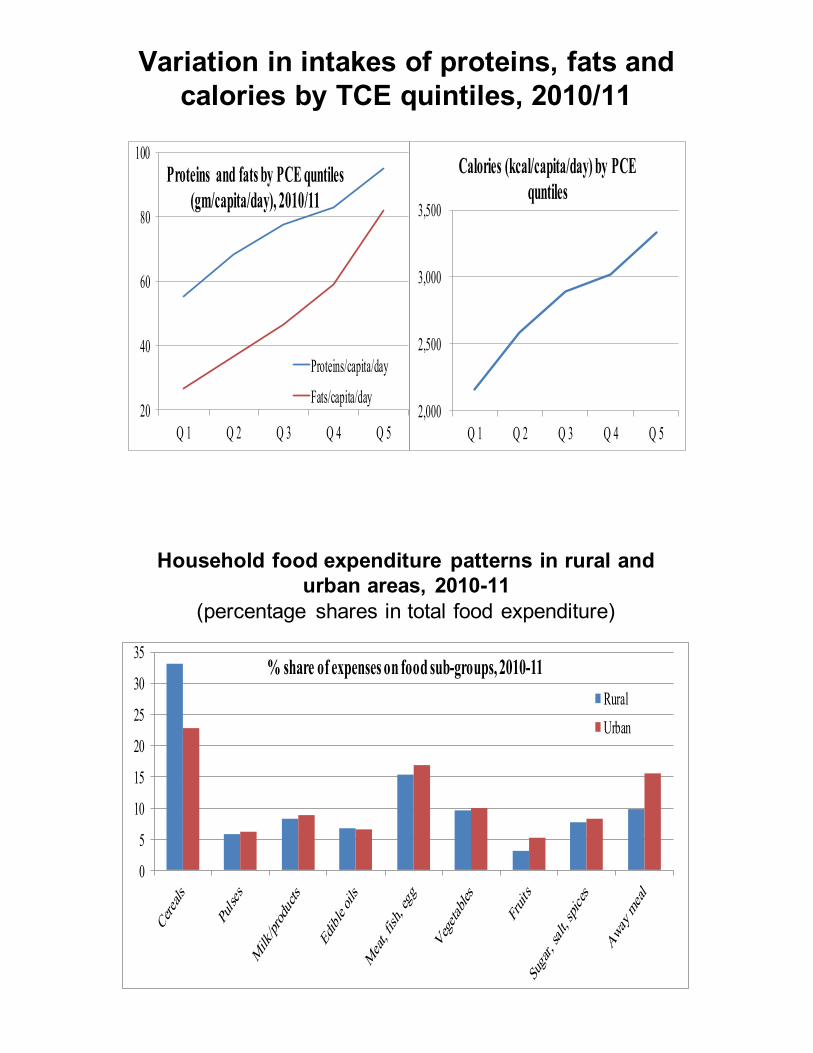
Variation in intakes of proteins, fats and calories by TCE quintiles, 2010/11
2,000
2,500
3,000
3,500
Q 1 Q 2 Q 3 Q 4 Q 5
Calories (kcal/capita/day) by PCE quntiles
20
40
60
80
100
Q 1 Q 2 Q 3 Q 4 Q 5
Proteins and fats by PCE quntiles (gm/capita/day), 2010/11
Proteins/capita/day
Fats/capita/day
Household food expenditure patterns in rural and urban areas, 2010-11
(percentage shares in total food expenditure)
0
5
10
15
20
25
30
35% share of expenses on food sub-groups, 2010-11
RuralUrban

Region/ House- Family Energy Protein Fat Min. DES Avg. DESquintle/ holds size Populatn. (DEC) reqrmnt. reqrmnt.deciles
# # 000 kcal/cap/day gm/cap/day gm/cap/day kcal/cap/day kcal/cap/day
Nepal all 5,988 4.9 28,024 2,725 73.5 47.0 1,724 2,175
Urban 2,088 4.4 5,329 2,685 73.7 57.5 1,788 2,280Rural 3,900 5.0 22,694 2,735 73.5 44.6 1,709 2,150
Q 1 (poorest) 1,044 6.1 - 2,154 55.3 26.8 1636 -Q 2 1,068 5.5 - 2,588 68.4 36.8 1686 -Q 3 1,079 4.8 - 2,889 77.8 46.8 1736 -Q 4 1,207 4.2 - 3,019 83.0 59.2 1761 -Q 5 (richest) 1,588 3.7 - 3,332 95.1 82.2 1821 -
Eastern 1,272 4.8 6,525 2,766 73.9 45.6 1,732 2,186Centeral 2,280 4.8 9,999 2,813 76.3 49.7 1,734 2,194Western 1,152 4.6 5,367 2,654 70.5 50.2 1,727 2,180Mid-western 756 5.2 3,653 2,608 71.8 42.6 1,695 2,123Far-western 528 5.0 2,480 2,591 70.2 39.5 1,699 2,136
D 1 - Nepal 526 6.4 3,679,102 1,948 - - - -D 2 - Nepal 518 5.9 3,389,366 2,377 - - - -D 3 - Nepal 537 5.7 3,281,933 2,485 - - - -D 4 - Nepal 531 5.3 3,051,084 2,698 - - - -D 5 - Nepal 530 4.9 2,854,001 2,785 - - - -D 6 - Nepal 549 4.6 2,650,725 3,001 - - - -D 7 - Nepal 571 4.3 2,487,375 2,982 - - - -D 8 - Nepal 636 4.1 2,357,639 3,057 - - - -D 9 - Nepal 714 3.9 2,268,348 3,111 - - - -D 10 - Nepal 874 3.5 2,002,976 3,582 - - - -
D 1 - Urban - - - 1,909 - - - -D 2 - Urban - - - 2,066 - - - -D 3 - Urban - - - 2,361 - - - -D 4 - Urban - - - 2,308 - - - -D 5 - Urban - - - 2,414 - - - -D 6 - Urban - - - 2,556 - - - -D 7 - Urban - - - 2,571 - - - -D 8 - Urban - - - 2,532 - - - -D 9 - Urban - - - 2,640 - - - -D 10 - Urban - - - 3,304 - - - -
D 1 - Rural - - - 1,949 - - - -D 2 - Rural - - - 2,399 - - - -D 3 - Rural - - - 2,499 - - - -D 4 - Rural - - - 2,746 - - - -D 5 - Rural - - - 2,825 - - - -D 6 - Rural - - - 3,086 - - - -D 7 - Rural - - - 3,084 - - - -D 8 - Rural - - - 3,313 - - - -D 9 - Rural - - - 3,470 - - - -D 10 - Rural - - - 4,151 - - - -
Estimates of food consumption & requirements ------------ Demographics ---------
A comparison of the estimates of food supplies in the FAO database and the new SUA/FBS
2008 2009 2010 2011 2012 2013 Avgeragekcal/capita/dayFAO database 2,490 2,522 2,553 2,547 2,546 2,538 2,533 New FBS estimates 2,772 2,698 2,837 2,855 2,894 2,922 2,830 Difference 282 176 284 308 348 384 297 % difference 11.3 7.0 11.1 12.1 13.7 15.1 11.7
Protein/capita/dayFAO database 63 64 65 n.a. n.a. n.a. 64 New FBS estimates 70 68 71 72 74 76 70 Difference 7.0 4.0 6.0 - - - 5.7 % difference 11.1 6.3 9.2 - - - 8.9
Fats/capita/dayFAO database 44 47 49 51 n.a. n.a. 48 New FBS estimates 52 51 60 58 59 60 55 Difference 8.0 4.0 11.0 7.0 - - 7.5 % difference 18.2 8.5 22.4 13.7 - - 15.7

Technical Notes on the difference• food energy, the difference between the two estimates
averages 297 kcal/capita/day for 2008-13, a difference of 12%. The average difference for 2008-13 is 5.7 gm/capita/day for protein (or 9%) and 7.5 gm/capita/day for fat (or 16%).
• The12% difference in caloric supply leads to a marked difference in the estimated prevalence rates of food insecurity. For example, assuming 1,724 kcal as the minimum and 2,200 as the adequate requirement (see Section 2.1.2 for details), the standard FAO methodology gives the following prevalence rates: 7.1% for undernourishment (the PoU) and 32% for food inadequacy (the PoFI) with the lower DES in the FAO database (2,533 kcal), but only 2.7% of PoU and 18% of PoFI with the higher DES (2,830) from the new SUA/FBS.
• The differences are large and potentially significant, e.g.
Accounting for the discrepancy in the two estimates
• What might explain the discrepancy in the estimated DES? One source of discrepancy is easily identifiable which is the discrepancy in the population numbers used, higher population in the FAO database and lower in the FBS.
• The CBS has released fresh estimates of Nepal’s population following the 2011 Census, including for the years prior to 2011. The SUA/FBS used these numbers. Apparently, FAO did not update population numbers in its database.
• Assuming the same level of the DES as in the FAO database, the use of the higher population (as in FAO database) reduces the DES by 60 kcal/capita/day.
• In other words, the DES would have been higher by 60 kcal in the FAO database if the correct (lower) population size was used
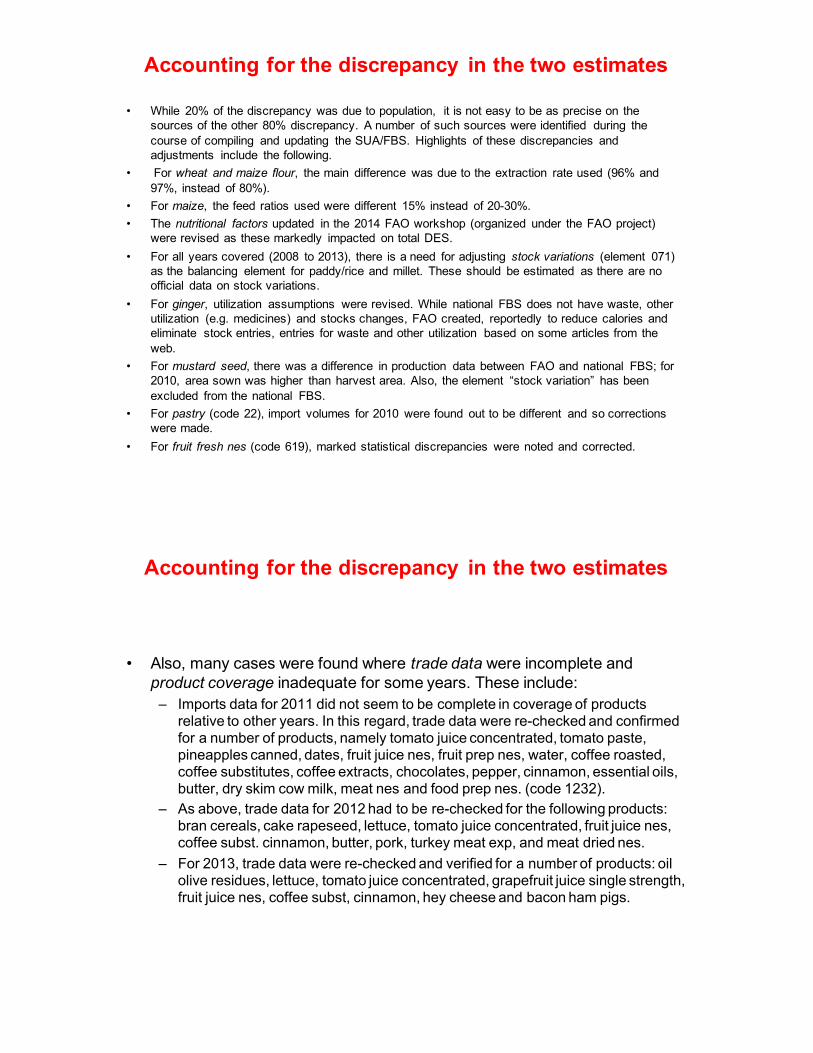
• While 20% of the discrepancy was due to population, it is not easy to be as precise on the sources of the other 80% discrepancy. A number of such sources were identified during the course of compiling and updating the SUA/FBS. Highlights of these discrepancies and adjustments include the following.
• For wheat and maize flour, the main difference was due to the extraction rate used (96% and 97%, instead of 80%).
• For maize, the feed ratios used were different 15% instead of 20-30%.• The nutritional factors updated in the 2014 FAO workshop (organized under the FAO project)
were revised as these markedly impacted on total DES. • For all years covered (2008 to 2013), there is a need for adjusting stock variations (element 071)
as the balancing element for paddy/rice and millet. These should be estimated as there are no official data on stock variations.
• For ginger, utilization assumptions were revised. While national FBS does not have waste, other utilization (e.g. medicines) and stocks changes, FAO created, reportedly to reduce calories and eliminate stock entries, entries for waste and other utilization based on some articles from the web.
• For mustard seed, there was a difference in production data between FAO and national FBS; for 2010, area sown was higher than harvest area. Also, the element “stock variation” has been excluded from the national FBS.
• For pastry (code 22), import volumes for 2010 were found out to be different and so corrections were made.
• For fruit fresh nes (code 619), marked statistical discrepancies were noted and corrected.
Accounting for the discrepancy in the two estimates
• Also, many cases were found where trade data were incomplete and product coverage inadequate for some years. These include:– Imports data for 2011 did not seem to be complete in coverage of products
relative to other years. In this regard, trade data were re-checked and confirmed for a number of products, namely tomato juice concentrated, tomato paste, pineapples canned, dates, fruit juice nes, fruit prep nes, water, coffee roasted, coffee substitutes, coffee extracts, chocolates, pepper, cinnamon, essential oils, butter, dry skim cow milk, meat nes and food prep nes. (code 1232).
– As above, trade data for 2012 had to be re-checked for the following products: bran cereals, cake rapeseed, lettuce, tomato juice concentrated, fruit juice nes, coffee subst. cinnamon, butter, pork, turkey meat exp, and meat dried nes.
– For 2013, trade data were re-checked and verified for a number of products: oil olive residues, lettuce, tomato juice concentrated, grapefruit juice single strength, fruit juice nes, coffee subst, cinnamon, hey cheese and bacon ham pigs.
Accounting for the discrepancy in the two estimates

Challenges Faced and How we solved them
• Update of food composition table• Post harvest loss estimation• Processing rate and loss• Other utilization like , alcohol and tourist
consumption• Disaggregation of data upto varietal like
fruits, vegetables and fishes• Balancing of the elements
Lessons Learned; For my country • Capacity building at the local level is key to generate
commitments for the effectiveness of the FNSM system• Stakeholders benefited by the information for decision
making–• Data and results helped on macro level indicators• FNS monitoring needs multi-sectoral coordination and
support at the national and local level • Time taking process • FNS concept not fully understood (only food sufficiency) • Importance of build agencies’ awareness and have them
engaged in the process (more than a nice reference table!), • They want to keep monitoring at a “technical level” and have an
inclusive structure to do that

Lessons Learned; For other country • Regional cooperation (south –south) on
capacity development• Regional data on trade for verification, ex
export data from Nepal should come to Import data in India and vice versa
• Regional lessons learning and coordination
• Capacity transfer from Rome to Bangkok and national level
• Ready for Technical Support?
Lessons Learned; For FAO
• Helpful in MDG monitoring and progress reporting
• Should be useful for SDG monitoring focused on Goal 2 ie Zero Hunger and some data on nutrition monitoring
• Comparison of FAO data base with new food composition table and thresholds
Acknowledgements“Building statistical capacity for quality food
security and nutrition information in
support of better informed policies”, TCP/RAS/3409, FAO Regional Office for Asia and the Pacific (FAO-RAP), Bangkok.
Thank You