Embed Size (px)
Citation preview

Food, Fibre & Forestry Facts
2017 Edition
A SUMMARY OF AUSTRALIA’S AGRICULTURE SECTOR
2 FOOD, FIBRE & FORESTRY FACTS — A SUMMARY OF AUSTRALIA’S AGRICULTURE SECTOR, 2017
E: [email protected]: 0408 448 250
ADDRESS
NFF House14–16 Brisbane AvenueBarton ACT AUSTRALIA 2600
POSTAL ADDRESS
Locked Bag 9Kingston ACT AUSTRALIA 2604
P: (02) 6269 5666
For more information

3FOOD, FIBRE & FORESTRY FACTS — A SUMMARY OF AUSTRALIA’S AGRICULTURE SECTOR, 2017
ContentsIntroduction .................................................................................................................... 4
Farm Facts: National and State-by-State ................................................. 5–21Australian farmers – punching above their weight .....................................6–7Australian farmers – food and fibre producers ........................................... 8–9Australian farmers – employers ...................................................................... 10–11Australian farmers – frontline environmentalists ..................................... 12–16Australian farmers – investors in research and technology ............... 18–19Australian farmers – self-reliant ...........................................................................20Australian farmers – in summary .......................................................................... 21
Farm Facts: Major Commodities ................................................................23–51Beef ...................................................................................................................... 24–25Chicken ............................................................................................................... 26–27 Cotton .................................................................................................................. 28–30Dairy ..................................................................................................................... 32–34Dried fruits ................................................................................................................... 35Forestry ................................................................................................................36–37Grains and oilseeds ........................................................................................ 38–39Pork ........................................................................................................................ 40–41Rice .........................................................................................................................42–43Sheep meat ........................................................................................................ 44–46Sugar ..................................................................................................................... 48–49Wool ........................................................................................................................50–51
About The NFF .................................................................................................. 52–55Vision............................................................................................................................ 52Mission .......................................................................................................................... 52Aims and objectives ......................................................................................... 53–54Members ...................................................................................................................... 55

4 FOOD, FIBRE & FORESTRY FACTS — A SUMMARY OF AUSTRALIA’S AGRICULTURE SECTOR, 2017
IntroductionThe 2017 Food, Fibre & Forestry Facts is the authoritative ready reckoner to the latest facts and stats you need to know about Australian agriculture.
Whether you are a school student working on an assignment, a journalist working on a story or just an inquisitive mind, Food, Fibre & Forestry Facts has something for you.
The resource compendium, developed by the National Farmers’ Federation (NFF), contains fully sourced and attributed data in easily digestible grabs.
Food, Fibre & Forestry Facts is designed as a fast reference to top-of-mind national and state-by-state farm facts such as how many farmers are there in Australia, how much land do they farm, what is agriculture worth to our nation’s economy and how are farmers looking after the environment.
This reference also drills down to specific figures on Australia’s leading agricultural commodities, including: beef; sheep, wool, grains, cotton, dairy, pork, rice, dried fruit, sugar and forestry.
In addition to Food, Fibre & Forestry Facts, more information about Australian agriculture and how the NFF is working to advance it, can be found at:
, www.nff.org.au, or www.farmers.org.au
More detailed data on specific commodities or state-based agriculture issue is available from NFF’s more than 30 member organisations:
, See here.
The NFF is committed to dynamic and timely engagement with stakeholders who require further information about our great sector.
If you do not already receive NFF communications please email your details to:

5
FARM FACTSNational andState-by-StateThis section contains information on Australian agriculture’s contribution nationally, as well as within each State and Territory
FOOD, FIBRE & FORESTRY FACTS — A SUMMARY OF AUSTRALIA’S AGRICULTURE SECTOR, 2017

6 FOOD, FIBRE & FORESTRY FACTS — A SUMMARY OF AUSTRALIA’S AGRICULTURE SECTOR, 2017
FARM FACTS National and State-by-State
Australian farmers — punching above their weight
• There are 85,681 agricultural businesses in Australia that have an Estimated Value of Agricultural Operations (EVAO) of $40,000 or greater. This is a change from previous Australian Bureau of Statistics (ABS) Rural Environment and Agricultural Collections, where a scope of EVAO of $5,000 or greater was used.
• The gross value of Australian agriculture increased by $3.7 billion from 2014–15, to $58.1 billion in 2015–16.
SOURCE: ABARES, Agricultural Commodities – June Quarter 2017.
• In 2015–16, all states except Northern Territory showed an increase in farm production. Queensland was the highest contributing state with an increase of 12%, driven by an increase in livestock disposals (up 14%) and total value of crops (up 11%).
SOURCE: ABARES, Agricultural Commodity Statistics 2016.
State No. of farms % of total farms Total area (ha)
NSW 26,124 30.5% 53,438,094VIC 20,776 24.2% 10,676,372QLD 18,153 21.2% 127,550,908SA 9,484 11.1% 47,579,721WA 8,400 9.8% 76,802,353TAS 2,330 2.7% 1,459,082NT 374 0.4% 53,546,280ACT 40 0.05% 25,448
SOURCE: Australian Bureau of Statistics, Agricultural Commodities 2015/2016, Catalogue No. 7121.0.

7FOOD, FIBRE & FORESTRY FACTS — A SUMMARY OF AUSTRALIA’S AGRICULTURE SECTOR, 2017 FOOD, FIBRE & FORESTRY FACTS — A SUMMARY OF AUSTRALIA’S AGRICULTURE SECTOR, 2017
• In Australia, individuals spent on average $4739 for food in 2015–16. This includes eating out and non-alcoholic beverages. This amount has risen by 16% during the past six years: In 2009–10, individuals spent $4,083 on food per annum.
SOURCE: ABS, Household Expenditure Survey, Australia: Summary of Results, 2015–16, Catalogue No.6530.0.
• Food imports, particularly for processed food, accounted for only 15 per cent of household food consumption in Australia in 2015–16.
SOURCE: Hogan, Linsday. (2017) Food demand in Australia: Trends and food security issues. ABARES research report 17.7, Canberra.
7

8 FOOD, FIBRE & FORESTRY FACTS — A SUMMARY OF AUSTRALIA’S AGRICULTURE SECTOR, 2017
Australian farmers — food and fibre producers
• Out of the $58.1 billion worth of food and fibre Australian farmers produced in 2015–16, 77 per cent ($44.8 billion) was exported.
SOURCE: ABARES, Agricultural Commodities – June Quarter 2017
• Food and fibre exports represented 15.3% of Australia’s total goods and services exports in 2015–16.
SOURCE: ABARE, Australian Commodity Statistics, 2016
• Australia’s agricultural export commodities in 2015–16 were:
SOURCE: ABARE, Australian Commodities June Quarter, 2017
Dairy products7%
Wool7%
Meat and live animals29%
Horticulture6%
Wine5%
Sugar4%
Cotton3%
Grains, oilseeds and pulses24%
Other15%
• The top three agricultural commodities produced nationally, ranked by gross value in 2015–16 were:
Cattle and calves $12.4 billion
Wheat $6.9 billion
Whole milk $4.3 billionSOURCE: ABARES, Agricultural Commodities – June Quarter 2017

9FOOD, FIBRE & FORESTRY FACTS — A SUMMARY OF AUSTRALIA’S AGRICULTURE SECTOR, 2017
• More than 99% of Australia’s agricultural businesses are wholly Australian owned, owning 88% (or 343.3 million hectares) of Australia’s agricultural land. Wholly Australian owned businesses also control 87% of Australia’s agricultural water entitlements (or 13.3 million megalitres).
SOURCE: ABS, Agricultural Land and Water Ownership, 2015–16, Catalogue No. 7127.0.
• Proportion of agricultural land held by foreign persons:
SOURCE: ABARE, Australian Commodities June Quarter, 2017
US10%
Other46%
Korea7%
Japan10%
Indonesia7%
China20%
State Foreign owned land in hectares
Australian owned land in hectares
Total agricultural land
Percent foreign owned %
NSW/ACT 2,316,756 56,447,162 58,763,918 4%VIC 174,423 10,790,028 10,964,451 2%QLD 16,575,601 123,290,105 139,865,706 12%SA 7,026,510 38,198,353 45,224,863 16%WA 5,663,606 73,378,370 79,041,976 7%TAS 80,914 1,509,939 1,590,853 5%NT 16,761,154 39,648,855 56,410,009 30%Total 48,598,963 343,262,813 391,861,776 12%
SOURCE: Australian Bureau of Statistics, Agricultural Land and Water Ownership, 2015–16, Catalogue No. 7127.0.

10 FOOD, FIBRE & FORESTRY FACTS — A SUMMARY OF AUSTRALIA’S AGRICULTURE SECTOR, 2017
Australian farmers — employers
• As of May 2017, 304,200 people were employed in the Australian farm sector — accounting for about 3% of the national workforce.
SOURCE: Australian Bureau of Statistics, Labour Force, Australia, Detailed, Quarterly, May 2017 Catalogue No. 6291.0.55.003.
• Across the supply chain agriculture powers 1.6 million jobs.SOURCE: Australia’s Farm Dependent Economy: Analysis of the role of Agriculture in the Australian Economy.
• As of May 2017, Australian agriculture directly employed 217,000 full-time workers, and 87,200 part-time workers.
SOURCE: Australian Bureau of Statistics, Labour Force, Australia, Detailed, Quarterly, May 2017 Catalogue No. 6291.0.55.003.
• 216,100 males and 88,100 females are employed in the Australian farm sectorSOURCE: Australian Bureau of Statistics, Labour Force, Australia, Detailed, Quarterly, May 2017 Catalogue No. 6291.0.55.003.
• The number of people as of May 2017 employed in agriculture, forestry and fishing jobs in each State and Territory follow:
• The proportion of Australian farmers that operate small and medium enterprises includes:
By turnover
Zero to less than $50k
$50k to less than $200k
$200k to less than $2m
$2m or more Total
31.25% 29.51% 34.87% 4.34% 100%46,943 44,329 52,385 6,526 150,212
By employee
Non-employing 1–19 employees
20–199 employees
200+ employees
Total
71.20% 27.73% 0.98% 0.04% 100.00%106,945 41,654 1,469 55 150,212
SOURCE: Australian Bureau of Statistics, 2016, Counts of Australian Businesses, including Entries and Exits, Jun 2012 to Jun 2016, cat. no. 8165.0.
NSW 76,000 VIC 87,800QLD 55,400 SA 32,300WA 36,300 TAS 13,900NT 1,700 ACT 900SOURCE: Australian Bureau of Statistics, Labour Force, Australia, Detailed, Quarterly, May 2017 Catalogue No. 6291.0.55.003.

11FOOD, FIBRE & FORESTRY FACTS — A SUMMARY OF AUSTRALIA’S AGRICULTURE SECTOR, 2017
• The proportion of farm businesses according to business structure:
• In the vegetable and horticulture industries, most farm employees are seasonal workers and most of these employees are working in Australia on a visa. In contrast, the cotton industry has more full-time employees, and those workers classified as seasonal, are generally Australian or New Zealand residents.
SOURCE: Valle, H, Millist, N & Galeano, D 2017, Labour force survey, ABARES report to the Department of Agriculture and Water Resources, Canberra, May. CC BY 4.0.
Industry Sole traders/ Individual business
Companies Partnerships Trusts Total
Agriculture, forestry and fishing
67,004 17,855 90,206 27,971 203,03633% 8.79% 44.43% 13.78% 100%
SOURCE: Australian Bureau of Statistics, 2016, Counts of Australian Businesses, including Entries and Exits, Jun 2012 to Jun 2016, cat. no. 8165.0.
• Proportion of farm businesses according to business structure (Financial year 2015–16):
SOURCE: Australian Taxation Office (2017), Taxation Statistics 2014–2015, Selected taxation items by broad industry for 2014–2015 income year and 2015–2016 financial year.
Trusts
Sole traders/individual businesses
Partnerships
Companies

12 FOOD, FIBRE & FORESTRY FACTS — A SUMMARY OF AUSTRALIA’S AGRICULTURE SECTOR, 2017
Australian farmers — frontline environmentalists
• Agricultural businesses occupy and manage 48% of Australia’s landmass, as such, they are at the frontline in delivering environmental outcomes on behalf of the broader community.
SOURCE: Australian Bureau of Statistics, Land Management and Farming in Australia, 2015–2016, Catalogue No. 4627.0.
• At 30 June 2016 there were 371 million hectares of agricultural land in Australia, a 1.4% increase on the previous year.
SOURCE: Australian Bureau of Statistics, Land Management and Farming in Australia, 2015–2016, Catalogue No. 4627.0.
• Of the 371 million hectares of land operated by agricultural businesses in Australia, 312.2 million hectares (or 84%) was used for grazing which is a 2% increase when compared to 2014–15. An estimated 61,400 agricultural businesses (or 72%) of all agricultural businesses, reported grazing land, a proportion virtually unchanged from the previous year.
SOURCE: Australian Bureau of Statistics, Land Management and Farming in Australia, 2015–2016, Catalogue No. 4627.0.
— a massive 63% reduction between 1996–2016. SOURCE: Australian Bureau of Statistics, Australian Environmental-Economic Accounts, 2017, Catalogue No. 4655.
• Australian water consumption decreased in 2014–15 by 7% from 2013–14. The largest decrease in water consumption was in the agriculture industry.
SOURCE: Australian Bureau of Statistics, Water Accounts, 2014, Catalogue No. 4655.
• Since 2011, loss of valuable agricultural lands continued across most states and territories because of urban encroachment.
SOURCE: Department of Environment, Australia State of the Environment overview, 2016.
• The sophistication of Australia’s agricultural land management continues to increase, with ongoing reductions in the intensity of agricultural chemical use, more careful use of fertilisers and more flexible approaches to grazing management to reduce erosion and increase productivity.
SOURCE: Department of Environment, Australia State of the Environment overview, 2016.
• Since 2011, areas managed for conservation have continued to expand, to about 18% of Australia’s land area.
SOURCE: Department of Environment, Australia State of the Environment overview, 2016.
• Australian primary industries have led the nation in reducing greenhouse gas emissions intensity
13FOOD, FIBRE & FORESTRY FACTS — A SUMMARY OF AUSTRALIA’S AGRICULTURE SECTOR, 2017
• Early indications are that environmental watering in the Murray–Darling Basin driven by the 2012 Murray–Darling Basin Plan, along with the effects of natural floods, have contributed to ecological benefits for stream functioning and biodiversity.
SOURCE: Department of Environment, Australia State of the Environment overview, 2016.
• Information on the impact of pest animals on the Australian economy is limited. The most recent conservative estimate puts the national economic impact of pest animals, particularly in agricultural systems, at between $720 million and $1 billion annually, in production losses and public and private management costs.
SOURCE: Invasive Plants and Animals Committee 2016, Australian Pest Animal Strategy 2017 to 2027: consultation draft, Australian Government Department of Agriculture and Water Resources, Canberra.
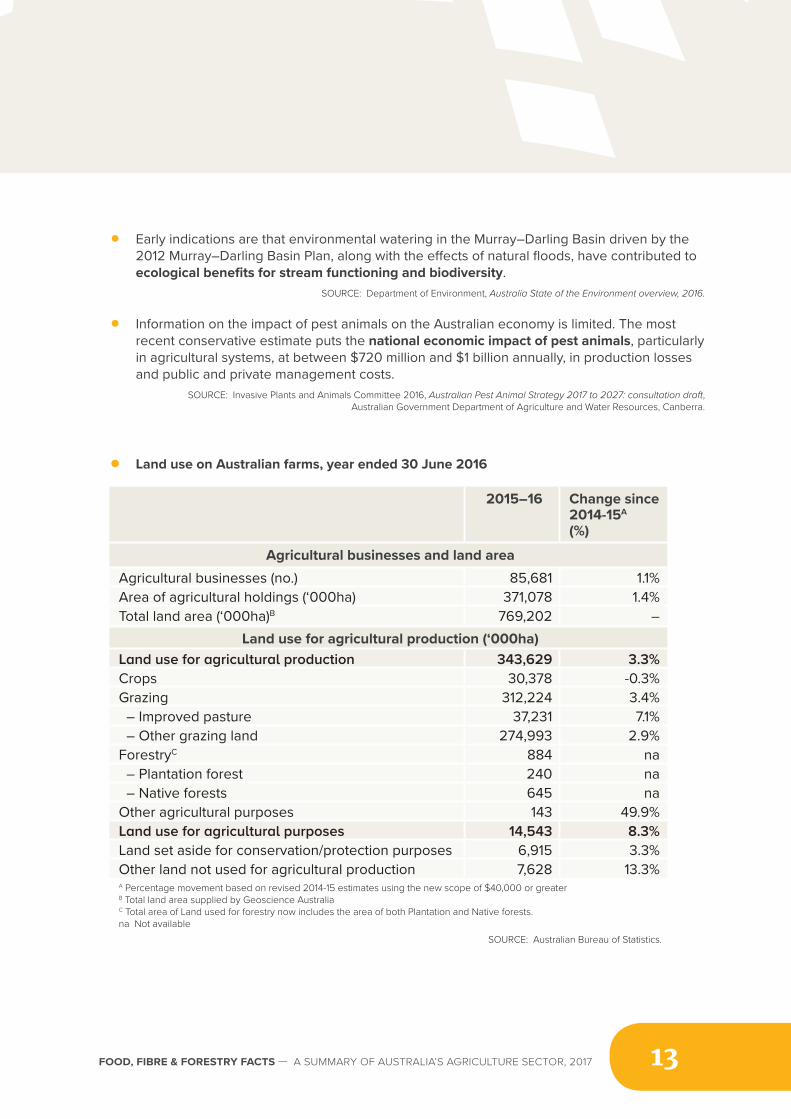
2015–16 Change since2014-15A
(%)
Agricultural businesses and land areaAgricultural businesses (no.) 85,681 1.1%Area of agricultural holdings (‘000ha) 371,078 1.4%Total land area (‘000ha)B 769,202 –
Land use for agricultural production (‘000ha)Land use for agricultural production 343,629 3.3%Crops 30,378 -0.3%Grazing 312,224 3.4% – Improved pasture 37,231 7.1% – Other grazing land 274,993 2.9%ForestryC 884 na – Plantation forest 240 na – Native forests 645 naOther agricultural purposes 143 49.9%Land use for agricultural purposes 14,543 8.3%Land set aside for conservation/protection purposes 6,915 3.3%Other land not used for agricultural production 7,628 13.3%A Percentage movement based on revised 2014-15 estimates using the new scope of $40,000 or greaterB Total land area supplied by Geoscience AustraliaC Total area of Land used for forestry now includes the area of both Plantation and Native forests.na Not available
SOURCE: Australian Bureau of Statistics.
• Land use on Australian farms, year ended 30 June 2016
14 FOOD, FIBRE & FORESTRY FACTS — A SUMMARY OF AUSTRALIA’S AGRICULTURE SECTOR, 2017
• The Australian Government launched a nationally coordinated approach to eradicating Australia’s worst freshwater aquatic pest, the European carp, through a $15 million National Carp Control Plan contained in the 2016 Federal Budget.
SOURCE: Invasive Animals CRC Annual Report, 2015–16.
• 6.8 million hectares of agricultural land has been set aside by Australian farmers for conservation/protection purposes.
SOURCE: Australian Bureau of Statistics, Land Management and Farming in Australia, 2015–2016, Catalogue No. 4627.0.
• In 2015–16 an estimated 31,900 agricultural businesses undertook some form of crop stubble and/or trash management practices over an area of 22.3 million hectares of cropping land.
SOURCE: Australian Bureau of Statistics, Land Management and Farming in Australia, 2015–2016, Catalogue No. 4627.0.
• The most common land cultivation practice for crops and pasture continues to be zero or minimum till where farmers undertake no cultivation apart from sowing or planting. Of the 18.3 million hectares of crop land cultivated 75% (or 13.8 million hectares) received no cultivation, apart from sowing or planting, a 12% increase on 2014–15. Similarly, 77% (or 3.1 million hectares) of the 4 million hectares of pasture land cultivated received no cultivation, apart from sowing, which was a 41% increase in area on the 2014–15 estimate.
SOURCE: Australian Bureau of Statistics, Land Management and Farming in Australia, 2015–2016, Catalogue No. 4627.0.
14 FOOD, FIBRE & FORESTRY FACTS — A SUMMARY OF AUSTRALIA’S AGRICULTURE SECTOR, 2017

15FOOD, FIBRE & FORESTRY FACTS — A SUMMARY OF AUSTRALIA’S AGRICULTURE SECTOR, 2017
• Both the area and the number of businesses using precision agriculture techniques increased during 2015–16. Controlled traffic farming continues to be the most prevalent of these practices and is undertaken by 6,600 businesses (a 14% increase on 2014–15) over an area of 6.7 million hectares, a 28% increase from the 2014–15 estimate. New South Wales (incl. Australian Capital Territory) had the largest area on which controlled traffic farming was undertaken with 2.9 million hectares, a 30% increase on 2014–15. Spatial yield monitoring and mapping was conducted over an area of 5.8 million hectares in 2015–16, an 8.7% increase from 2014–15.
SOURCE: Australian Bureau of Statistics, Land Management and Farming in Australia, 2015–2016, Catalogue No. 4627.0.
• The recently revised Australian Pest Animal and Weed Strategy confirms the massive impact of rabbits, which with current biological intervention keeps rabbit numbers to about 15% of their potential. At this level they still impact on 304 threatened species and cost agriculture over $200 million per annum.
SOURCE: Invasive Animals CRC Annual Report, 2015–16.
• Agricultural businesses spend a significant amount on managing pest animals and weeds. An average of $19,620 was spent per agricultural business on undertaking pest animal and weed management activities.
SOURCE: Stenekes, N, Kancans, R and Binks, B, 2017, Pest animal and Weed Management Survey: National landholder survey results, ABARES research report 17.5, May. CC BY 4.0.
• For those managing pest animals they spend an average of $7,023 per year (pest animals including feral, natives, insects and other pests (for example, parasites and mites).
SOURCE: Stenekes, N, Kancans, R and Binks, B, 2017, Pest animal and Weed Management Survey: National landholder survey results, ABARES research report 17.5, May. CC BY 4.0.
• Agricultural businesses spend an average of $17,917 per year on weed management activities, this includes all activities undertaken as part of the business as usual production cycle activities, for example spraying weeds before planting a crop.
SOURCE: Stenekes, N, Kancans, R and Binks, B, 2017, Pest animal and Weed Management Survey: National landholder survey results, ABARES research report 17.5, May. CC BY 4.0.
• Differences in regional climatic conditions appear to be influencing the use of water on Australian farms, the above average temperatures and dry conditions in southern Australia through 2015–16, along with record high prices for water, were critical factors in water use for Victoria and South Australia in particular.
SOURCE: Australian Bureau of Statistics, Water Use on Australian Farms 2015–16, Catalogue No.4618.
• Australian agriculture is becoming increasingly water efficient. Data shows that between 1982 and 2012, many wheat growing regions have improved water use efficiency by between 50 and 100 per cent (Australian Export Grains Innovation Centre (AEGIC) 2015) while the Australian cotton industry has achieved a 40% increase in water productivity over the past decade.
SOURCE: Australian Grown Cotton Sustainability Report 2014.

16 FOOD, FIBRE & FORESTRY FACTS — A SUMMARY OF AUSTRALIA’S AGRICULTURE SECTOR, 2017
• Nationally, the number of agricultural businesses irrigating decreased by 18% to 22,700 from 2014–15. New South Wales, Victoria and South Australia all fell by 21%, driven largely by decreases in areas for cropping particularly for rice, wheat, sorghum and canola. Reduced water allocations also contributed to the decline.
SOURCE: Australian Bureau of Statistics, Water Use on Australian Farms 2015–16, Catalogue No.4618.
• Area irrigated by commodity:
600,000
500,000
400,000
300,000
200,000
100,000
0
Are
a (h
a)
Grazing Hay Silage Rice Othercereals
Cotton Sugarcane
Fruitand nuts
VegetablesNurseries
Grapevines
SOURCE: Australian Bureau of Statistics, Water Use on Australian Farms 2015–16, Catalogue No.4618
• Australian agricultural businesses spent $251 million on irrigation related expenditure in 2015–16.
SOURCE: Australian Bureau of Statistics, Water Use on Australian Farms 2015–16, Catalogue No.4618.
• Agriculture is a vital industry in the Murray Darling Basin, the Murray Darling Basin accounted for 57% of the nation’s total water used for irrigation in 2015–16. Agricultural businesses in the Murray Darling Basin region used 4.9 million megalitres of water to irrigate 1.2 million hectares of crops and pastures during 2015–16. The area irrigated in the Murray Darling Basin accounted for 58% of the nation’s total area watered.
SOURCE: Australian Bureau of Statistics, Water Use on Australian Farms 2015–16, Catalogue No.4618.
17FOOD, FIBRE & FORESTRY FACTS — A SUMMARY OF AUSTRALIA’S AGRICULTURE SECTOR, 2017

18 FOOD, FIBRE & FORESTRY FACTS — A SUMMARY OF AUSTRALIA’S AGRICULTURE SECTOR, 2017
Australian farmers — investors in research and technologyA key aspect of modern agriculture is the integration of science and technology into management practices. Agricultural industries rely on knowledge derived from areas as diverse as plant and animal biology and behaviour, chemistry, statistics, land resource, genetics, environment and climate; and the integration of this knowledge with economics and modern information technologies.
Research and development income and expenditure 2016–17:
SOURCE: Department of Industry, Innovation and Science, Science, Research and Innovation Budget Tables, 2016–17
2007
-08
2008
-09
2009
-10
2010
-11
2011
-12
2012
-13
2013
-14
2014
-15 Estimated
Actual 2015-16
Budget Estimate 2016-17
Chicken meat 1.01 1.09 1.47 1.47 1.53 1.12 1.16 1.24 1.29 1.32Coal 0.00 0.00 0.00 0.00 0.00 0.00 0.00 0.00 0.00 0.00Cotton 1.95 2.20 3.43 4.58 10.29 11.80 10.98 7.30 5.34 5.45Dairying 27.96 27.32 28.25 30.24 30.87 31.28 32.98 35.37 34.50 34.78Dried fruit 0.00 0.00 0.00 0.00 0.00 0.00 0.00 0.00 0.00 0.00Egg industry 0.83 0.89 1.12 1.68 1.97 1.76 2.19 2.03 2.17 2.17Fish 0.82 0.23 0.81 0.91 0.91 0.86 0.88 0.97 1.00 1.10Forestry 4.63 5.19 5.10 5.20 5.23 4.50 4.92 5.42 5.41 5.52Grain legumes 0.00 0.00 0.00 0.00 0.00 0.00 0.00 0.00 0.00 0.00Grape & wine 9.88 12.54 12.11 11.21 11.16 11.74 12.71 11.84 18.16 17.60Honey 0.28 0.29 0.36 0.37 0.42 0.29 0.30 0.28 0.31 0.32Horticulture 18.79 18.73 21.43 21.60 21.06 23.81 24.62 26.32 28.79 29.57Meat 30.56 34.85 35.50 35.23 36.01 35.50 40.18 43.67 40.43 32.97Oilseeds 0.00 0.00 0.00 0.00 0.00 0.00 0.00 0.00 0.00 0.00Other grains 36.39 30.78 30.25 22.19 46.61 55.55 55.72 53.70 59.26 51.47Pig industry 3.18 3.98 3.67 4.60 4.75 4.69 4.69 5.18 5.00 5.15Rural Industries R&D Corporation
0.82 0.42 1.84 2.44 4.29 4.62 5.48 2.96 2.53 2.41
Special rural 0.00 0.00 0.00 0.00 0.00 0.00 0.00 0.00 0.00 0.00Sugar 4.82 4.49 4.14 3.82 3.92 4.34 19.56 22.68 24.40 23.10Tobacco 0.00 0.00 0.00 0.00 0.00 – – – 0.00 0.00Wheat 40.39 31.11 45.18 63.96 64.18 62.84 64.70 63.89 48.86 63.05Wool 45.11 41.70 35.32 47.03 52.00 43.75 43.31 48.30 56.10 56.10Total 227.42 215.80 229.96 256.53 295.19 298.45 324.37 331.16 333.54 332.07*Actual cost in year incurred.

19FOOD, FIBRE & FORESTRY FACTS — A SUMMARY OF AUSTRALIA’S AGRICULTURE SECTOR, 2017
• Innovation is vital to the growth, profitability and sustainability of Australia’s rural industries. Agencies investing and working on rural research, development and extension (RD&E) are spread across Commonwealth and state/territory Governments and include the 16 Rural Research and Development Corporations, Co-operative Research Centres (CRCs), Universities funded through the Australian Research Council, and the CSIRO.
SOURCE: Annex 11 to the Report on the Review of the National Innovation System; May 2009
• Calculation by Australian Bureau of Agriculture and Resource Economics and Sciences (ABARES) show that a $1 public investment in RD&E leads to $12 in benefits generated by farmers in the long term.
SOURCE: Sheny,Y., Gray, E.M., Mullen, J.D and Davidson, A. (2011) Public investment in agricultural R&D and extension: an anyalisys of the static and dynamic effects on Australian braodacre productivity. ABARES research report 11.7, Canberra.
• The RDCs collectively invest about $600 million a year into RD&E, and have a total budget of about $800 million.
SOURCE: Council of Rural RDCs, Background information fact sheet, 2017.
• A comparison of the estimated RDC RD&E expenditure in the 167 project clusters ($432 million) against the total estimated investment in the clusters ($983 million) indicates an average leverage of 53 ratio of about 1.27 to 1, meaning that for every $1 contributed by the RDCs, co-investment partners contributed, on average, $1.27 to the RD&E investment.
SOURCE: Agtrans Research, AgEconPlus, EconSearch, Cross-RDC Impact Assessment and Performance Reporting Update prepared for The Council of Rural Research and Development Corporations, Stage 1, October 2016.
• In 2016–17 Australian farmers invested $334 million-a-year in research and development through the Rural Research and Development Corporations. This is over and above the $325 million co-contribution made through the Federal Department of Agriculture and Water Resources.
SOURCE: Department of Industry, Innovation and Science, Science, Research and Innovation Budget Tables, 2016–17.
• Efficiency gains through new technologies and farm management practices, achieved on the back of research and development, have enabled Australian agriculture to stay a step ahead of our international competitors — returning average productivity growth of 2.7% -a-year over a 30-year period.
It should be noted that productivity growth varies considerably across farms, industries and regions. Key to this productivity growth have been advances in knowledge and technology, improved use of available technologies and management practices, and structural changes that have seen increased farm size and shifts in enterprise mixes.
SOURCE: Australian Government Productivity Commission 2015, PC Productivity Update, July 2015.

20 FOOD, FIBRE & FORESTRY FACTS — A SUMMARY OF AUSTRALIA’S AGRICULTURE SECTOR, 2017
70
60
50
40
30
20
10
0
Perc
ent
1.34%
9.40%
43.07%
48.93%
0.66%
62.03%
19.82%
9.44%
21.34%18.92%
Australia Canada Japan Korea New Zealand Norway Turkey USA China(Peoples
Republic of)
EuropeanUnion (28countries)
Australian farmers — self-reliant
• Australian farmers are among the most self-sufficient in the world, with government support for Australian farms representing just 1% of farming income. By comparison, in Norway it is 62%, Korea 49%, China 21%, European Union 19% and United States 9%.
SOURCE: OECD (2017), Agricultural Policy Monitoring and Evaluation 2017, OECD Publishing, Paris.
• Producer support, percentage of gross farm receipts 2015–16:
SOURCE: OECD (2017), Agricultural Policy Monitoring and Evaluation 2017, OECD Publishing, Paris.

21FOOD, FIBRE & FORESTRY FACTS — A SUMMARY OF AUSTRALIA’S AGRICULTURE SECTOR, 2017
Australian farmers — in summary
• Through developing new technologies, seizing environmentally-sustainable farm practices, and improving efficiency and competitiveness modern farming is essential to Australia’s economic, environmental and social wellbeing, and a vital source for Australia’s food security and, increasingly, mounting world food needs.
Farming is a mainstay of Australian ingenuity, adaptability and enterprise.
21FOOD, FIBRE & FORESTRY FACTS — A SUMMARY OF AUSTRALIA’S AGRICULTURE SECTOR, 2017

22 FOOD, FIBRE & FORESTRY FACTS — A SUMMARY OF AUSTRALIA’S AGRICULTURE SECTOR, 2017

23FOOD, FIBRE & FORESTRY FACTS — A SUMMARY OF AUSTRALIA’S AGRICULTURE SECTOR, 2017 23
FARM FACTSMajorCommoditiesThis section contains information on Australian agriculture’s leading commodities, namely:
Beef, Cotton, Chicken meat, Dairy, Dried Fruits, Forestry, Grains, Pork, Rice, Sheep Meat, Sugar and Wool
FOOD, FIBRE & FORESTRY FACTS — A SUMMARY OF AUSTRALIA’S AGRICULTURE SECTOR, 2017

24 FOOD, FIBRE & FORESTRY FACTS — A SUMMARY OF AUSTRALIA’S AGRICULTURE SECTOR, 2017
FARM FACTS Beef
Australian beef — staking its credentials
• 2015–16 saw 47,021 farms producing beef cattle in Australia, with a national herd of 25 million head. The breakdown by State and Territory is as follows:
NSW SA
Herd: 5 million Herd: 1 million
VIC TAS
Herd: 3.5 million Herd: 0.6 million
QLD NT
Herd: 10.5 million Herd: 2.2 million
WA
Herd: 2 millionSOURCE: Meat & Livestock Australia, Fast Facts 2017: Australia’s Beef Industry.
• In total, Australian beef cattle farmers produce 2.5 million tonnes of beef and veal each yearSOURCE: ABARE, Australian Commodity Statistics, 2016.
• The beef industry accounts for 55% of all farms with agricultural activity. SOURCE: Meat & Livestock Australia, Fast Facts 2017: Australia’s Beef Industry.
• The gross value of Australian cattle and calf production (including live cattle exports) in 2015–16 was $12.7 billion
SOURCE: Meat & Livestock Australia, Fast Facts 2017: Australia’s Beef Industry.

25FOOD, FIBRE & FORESTRY FACTS — A SUMMARY OF AUSTRALIA’S AGRICULTURE SECTOR, 2017
Australian beef — consumption at home
Australian beef — to the world market
• Australians eat an average 26kg of beef per person, per year. Remarkably, this has remained relatively constant for the past 15 years
SOURCE: Meat & Livestock Australia, Fast Facts 2017: Australia’s Beef Industry.
• In 2015–16, Australians spent $8.5 billion on beef. In terms of volume, beef is the third most popular fresh meat consumed through the food service industry after chicken and seafood
SOURCE: Meat & Livestock Australia, Fast Facts 2017: Australia’s Beef Industry.
• Australians remain the second-largest consumers of meat per capita, and the sixth-largest consumers of beef in the world, averaging 26 kg per person in 2016.
SOURCE: Meat & Livestock Australia, Fast Facts 2017: Australia’s Beef Industry
• Australia exported 962,983 tonnes of beef in 2016–17, worth $8.5 billion. The major export markets for beef are Japan (29%), the United States (21.7%) and Korea (16.8%).
SOURCE: Meat & Livestock Australia, Fast Facts 2017: Australia’s Beef Industry.
• Australian live cattle exports are worth $1.2 billion in 2016–17 – predominantly exported to Indonesia (58.7%), Vietnam (17.7%) and China (8.2%).
SOURCE: Meat & Livestock Australia, Fast Facts 2017: Australia’s Beef Industry.
• Australia produces 3% of the world’s beef, and was the third largest beef exporter during 2016–17.
SOURCE: Meat & Livestock Australia, Fast Facts 2017: Australia’s Beef Industry.

26 FOOD, FIBRE & FORESTRY FACTS — A SUMMARY OF AUSTRALIA’S AGRICULTURE SECTOR, 2017
FARM FACTS Chicken meat
Australian chicken meat — top of the pecking order
• 2015–16 saw 530 farms producing chicken meat in Australia, with a national flock of over 90 million head. The breakdown by State and Territory is as follows:
NSW QLD TAS
Businesses: 183 Businesses: 100 Businesses: 16
Flock: 30.1 million Flock: 18.4 million Flock: n/a
VIC SA WA
Businesses: 139 Businesses: 50 Businesses: 42
Flock: 22.7 million Flock: 12 million Flock: n/aSOURCE: Australian Bureau of Statistics, Agricultural Commodities 2015/2016, Catalogue No. 7121.0.
• In total, Australian chicken meat farmers produce 108.7 million tonnes of chicken meat each year.
SOURCE: ABARE, Australian Commodity Statistics, 2016.
• The gross value of Australian chicken meat production in 2014–15 was $2.6 billion. SOURCE: ABARE, Australian Commodity Statistics, 2016.
• Australian farmers exported 29kt of chicken meat in 2015–16, with a gross value of $53 million.
SOURCE: ABARE, Australian Commodity Statistics, 2016.

27FOOD, FIBRE & FORESTRY FACTS — A SUMMARY OF AUSTRALIA’S AGRICULTURE SECTOR, 2017 27
Australian chicken meat — consumption at home
• Australians eat an average of 45.3kg of chicken meat per person, per year. This not only cements chicken’s position as Australian consumers’ favourite meat, but also makes Australia one of the largest consumers of chicken meat in the world!
SOURCE: ABARE, Australian Commodity Statistics, 2016.
FOOD, FIBRE & FORESTRY FACTS — A SUMMARY OF AUSTRALIA’S AGRICULTURE SECTOR, 2017

28 FOOD, FIBRE & FORESTRY FACTS — A SUMMARY OF AUSTRALIA’S AGRICULTURE SECTOR, 2017
FARM FACTS Cotton
Australian cotton — on a roll
• In an average year, there are about 1,200 cotton farms in Australia. Of these, about half are in NSW and a half are in Queensland.
SOURCE: Monsanto audited numbers.
• The Australian cotton industry has achieved a 40% increase in water productivity since 2003. In other words, 40% less water is now needed to grow one tonne of cotton lint, compared to in 2003. Australian cotton growers have almost doubled their irrigation water use index from 1.1 bales/megalitre in 2000–01 to 1.9 bales/megalitre in 2009–10.
SOURCE: Australian Cotton Water Story 2012, ABS 2014
• The average Australian cotton farm is a family-owned operation, with about 500 hectares of cotton and creating jobs for six to seven people.
SOURCE: Cotton Australia, Australian Cotton Industry Facts 2016.
• The major production area in NSW stretches south from the Macintyre River on the Queensland border and covers the Gwydir, Namoi and Macquarie valleys. In NSW, cotton is also grown along the Barwon and Darling rivers in the west and the Lachlan and Murrumbidgee rivers in the south. In Queensland, cotton is grown mostly in the south on the Darling Downs and in the St George, Dirranbandi and Macintyre Valley regions. The remainder is grown near Emerald, Theodore and Biloela in Central Queensland.
SOURCE: Cotton Australia, Australian Cotton Industry Facts 2016.
• Cotton growers supplement cotton with other crops including wheat, chickpeas and sorghum, and many Australian cotton growers also graze sheep and cattle.
SOURCE: Cotton Australia, Australian Cotton Industry Facts 2016.
• For the past 10 years, the average annual amount of cotton lint produced in Australia was 641,806 metric tonnes (2,827,338 bales). Production reached a record high in 2011–12 at 1,215,870 metric tonnes (5.3 million bales) and a low in 2007–08 at 136,831 metric tonnes (600,000 bales).
SOURCE: Cotton Australia, Australian Cotton Industry Facts 2016.

29FOOD, FIBRE & FORESTRY FACTS — A SUMMARY OF AUSTRALIA’S AGRICULTURE SECTOR, 2017
Australian cotton — biotechnology and the environment
• Comparing five-year averages for the periods 2010–15 and 1998–2003, the Australian cotton industry has achieved a 92% reduction in insecticide use, with some crops not sprayed for insects at all through a combination of biotechnology and Integrated Pest Management practices.
SOURCE: Cotton Australia, Cotton Annual 2017.
• 99.9% of Australia’s cotton crop is grown with varieties containing biotech traits. SOURCE: Monsanto audited numbers, February 2017.
• In 2015–16, Australia recorded irrigated cotton lint yields of 11.07 bales/hectare and dryland cotton yields of 3.87 bales/hectare. Australian yields are high by international standards, more than three times the world average.
SOURCE: Cotton Australia tables (compilation of industry sources). Dryland yield calculated by dividing bales by paddock hectares (not green hectares), ABARES.
• The value of Australian raw cotton exports in 2015–16 was $1.264 billion. This was severely impacted by drought and compares to an average of $1.5 billion in a normal year.
SOURCE: ABARES, Australian Commodity Statistics, 2016.
• The gross value of Australian cotton production (both lint and seed) in 2015–16 was $1.423 billion, and in 2016–17, Cotton Australia estimates 3.8 million bales valued at $2.6 billion (both lint and seed).
SOURCE: ABARES, Australian Commodity Statistics, 2017.

30 FOOD, FIBRE & FORESTRY FACTS — A SUMMARY OF AUSTRALIA’S AGRICULTURE SECTOR, 2017
Australian cotton — to the world market
• In a normal year, Australia’s cotton growers produce enough cotton to clothe 500 million people.
SOURCE: Cotton Australia, Australian Cotton Industry Facts, 2016.
• Australia produces about 3% of the world’s cotton but is the fifth largest exporter, behind the USA, India, Brazil, Uzbekistan.
SOURCE: Cotton Australia, Cotton Annual 2017.
• 99% of Australia’s raw cotton is exported. The major buyers of Australian cotton are currently China (55%), India, Thailand, Vietnam, Indonesia and Bangladesh.
SOURCE: ABARES, ACSA and ICAC.
FARM FACTS Cotton (continued)
3030 FOOD, FIBRE & FORESTRY FACTS — A SUMMARY OF AUSTRALIA’S AGRICULTURE SECTOR, 2017

FOOD, FIBRE & FORESTRY FACTS — A SUMMARY OF AUSTRALIA’S AGRICULTURE SECTOR, 2017 31FOOD, FIBRE & FORESTRY FACTS — A SUMMARY OF AUSTRALIA’S AGRICULTURE SECTOR, 2017

32 FOOD, FIBRE & FORESTRY FACTS — A SUMMARY OF AUSTRALIA’S AGRICULTURE SECTOR, 2017
FARM FACTS Dairy
Australian dairy — cream of the crop
• There are 6102 dairy farms in Australia. The national herd is 1.663 million dairy cows.
The State breakdown of the national herd and registered dairy farms includes:
NSW QLD TAS
Properties: 685 Properties: 421 Properties: 434
Herd: 177,000 Herd: 91,000 Herd: 146,000
VIC SA WA
Properties: 4,141 Properties: 259 Properties: 162
Herd: 1120,000 Herd: 67,000 Herd: 62,000SOURCE: Dairy Australia, Australian Dairy Industry In Focus 2016.
• The average herd size has increased from 93 cows in 1985 to an estimated 284 currently. There is also a steady trend emerging to very large farm operations of more than 1,000 head of dairy cattle.
SOURCE: Dairy Australia, Australian Dairy Industry In Focus 2016.
• Australian dairy farmers produce 9,539 million litres of whole milk per year with the farmgate value of milk production being $4.3 billion.
SOURCE: Dairy Australia, Australian Dairy Industry In Focus 2016.
• Milk production for the 2015/16 year by State is as follows:
NSW 1.165 billion litres SA 514 million litres
VIC 6.186 billion litres WA 387 million litres
QLD 405 million litres TAS 883 million litresSOURCE: ABARES, Australian Commodity Statistics, 2016

33FOOD, FIBRE & FORESTRY FACTS — A SUMMARY OF AUSTRALIA’S AGRICULTURE SECTOR, 2017
• The average milk production per farm has increased from 311,000 litres to 1,563,000 litres per year over the past 30 years.
SOURCE: Dairy Australia, Australian Dairy Industry In Focus 2016.
• Use of Australian milk by state: 2015–16:
• Dairy farming employs about 38,000 people throughout Australia. SOURCE: Dairy Australia, Australian Dairy Industry In Focus 2016
• In terms of the utilisation of Australian milk in 2015–16, the share of volume produced is as follows: cheese (30%), skim milk or butter milk powder, (29%), drinking milk (26%), whole milk powder (6%), and other (9%).
SOURCE: Dairy Australia, Australian Dairy Industry In Focus 2016.
• Consumption of dairy products per person in 2015–16 in Australia.
100
80
60
40
20
0
Perc
ent
Drinking milk Manufacturing – Australia Manufacturing – Export
NSW QLD SA TAS VIC WA AUSTSOURCE: Dairy Australia, Australian Dairy Industry In Focus 2016.
Cheese 13.9kg
Drinking milk 105LSOURCE: Dairy Australia, Farm Facts 2016

34 FOOD, FIBRE & FORESTRY FACTS — A SUMMARY OF AUSTRALIA’S AGRICULTURE SECTOR, 2017
FARM FACTS Dairy (continued)
Australian dairy — to the world market
• Australia exports about 34% of its annual milk production.SOURCE: Dairy Australia, Farm Facts 2016.
• Dairy is the third largest agricultural industry in Australia, worth $3 billion in exports in 2015–16.
SOURCE: Dairy Australia, Farm Facts 2016.
• The top Australian export destinations for dairy products are as follows:
• Australia accounts for 6% of the world trade in dairy products, behind New Zealand (38%) the European Union (33%), and the United States of America (12%).
SOURCE: Dairy Australia, Australian Dairy Industry In Focus 2016.
South East Asia $838 million
Greater China $795 million
Japan $464 million
Other Asia $294 million
Middle East $215 million
Other $211 million
Americas $99 million
Africa $66 million
Europe $11 millionSOURCE: Dairy Australia, Australian Dairy Industry In Focus 2016.

35FOOD, FIBRE & FORESTRY FACTS — A SUMMARY OF AUSTRALIA’S AGRICULTURE SECTOR, 2017
FARM FACTS Dried fruits
Australian dried fruits — pick of the bunch
• Australian dried fruit growers are predominantly dotted along the Murray River in the Sunraysia region (around Mildura) and Swan Hill region in Victoria and NSW, and the Riverland region (around Waikerie and Renmark) in SA. There is also a relatively small group in the Bindoon region of WA.
SOURCE: Dried Fruits Australia, www.driedfruitsaustralia.org.au
• The total number of grape growers (dried and table) in Australia, by state is:
• 98% of Australia’s dried grapes are produced in the Mildura region of Victoria and NSW. Its success can be attributed to the region’s dry climate, soil type and irrigation systems.
SOURCE: Mildura Region Economic Profile, 2016.
• On average, each Australian eats 3.08kg of dried fruit per year.SOURCE: Horticulture Innovation Australia, 2015/16 Australian Horticulture Statistics Handbook.
• Total Australian dried fruit exports in 2015–16 totalled 5,000 tonnes and was valued at $19.4 million.
SOURCE: ABARES, Australian Commodity Statistics, 2016.
VIC 431
NSW 86
WA 73
SA 29
Australia 654SOURCE: Australian Bureau of Statistics, Agricultural
Commodities 2015/2016, Catalogue No.7121.0.

36 FOOD, FIBRE & FORESTRY FACTS — A SUMMARY OF AUSTRALIA’S AGRICULTURE SECTOR, 2017
FARM FACTS Forestry
Australian forestry — cutting to the chase
• In Australia, of the 769.2 million hectares, there is 124.7 million hectares of forest area, or 16% of the land mass.
SOURCE: ABARES, Australian Commodity Statistics, 2016.
• Australia’s 124.7 million hectares of forest cover about 16% of the continent. This represents about 3% of the world’s forest area on 5% of the world’s land area.
SOURCE: ABARES 2017, Australia’s forests at a glance 2017: with data to 2015–16.
• Queensland has 41% of Australia’s forest (51.0 million hectares), New South Wales has 18% (22.7 million hectares), Western Australia 15% (19.2 million hectares) and the Northern Territory 12% (15.2 million hectares).
SOURCE: ABARES 2017, Australia’s forests at a glance 2017: with data to 2015–16.
• The area of forests that are set aside for the protection of biodiversity conservation on public and private land is 39.2 million hectares.
SOURCE: ABARES 2017, Australia’s forests at a glance 2017: with data to 2015–16.
• The Australian forestry, logging and wood manufacturing industry employs 64,300 in the forest products industry.
SOURCE: ABARES, Australian Commodity Statistics, 2016.
• Australia’s forest industries contribute $23 billion of economic turnover each year.SOURCE: ABARES, Australian Forest and Wood Products Statistics, September and December Quarters 2016.
• The value of Australian wood product exports totalled $3.1 billion in 2015–16. SOURCE: ABARES, Australian Commodity Statistics, 2016.
• The major wood product exports include paper and paperboard ($898 million), woodchips ($1.1 billion), sawn wood ($103 million) and wood-based panels ($66 million).
SOURCE: ABARES 2017, Australia’s forests at a glance 2017: with data to 2015–16.

37FOOD, FIBRE & FORESTRY FACTS — A SUMMARY OF AUSTRALIA’S AGRICULTURE SECTOR, 2017
• The total volume of Australian logs harvested (including commercial plantations and native forests) is 30.1 million m3.
SOURCE: ABARES 2017, Australia’s forests at a glance 2017: with data to 2015–16.
• Forestry and forest product manufacturing industries contributed 0.5% to Australia’s GDP.SOURCE: ABARES 2017, Australia’s forests at a glance 2017: with data to 2015–16.
• At the end of 2010, 13,067 million tonnes of carbon was held in Australia’s forests and harvested wood products in service and in landfill (DCCEE 2012). Almost all this carbon (12,841 million tonnes; 98%) was stored in living forest.
SOURCE: ABARES 2017, Australia’s forests at a glance 2017: with data to 2015–16.
• The Australian Bureau of Statistics labour force survey (ABS 2017) estimated that in 2015–16 about 64,300 people were employed directly in the forestry industry, and with the inclusion of the full value chain (including frame and truss manufacturer) 120,000 are employed by the industry.
SOURCE: ABARES 2017, Australia’s forests at a glance 2017: with data to 2015–16.
37FOOD, FIBRE & FORESTRY FACTS — A SUMMARY OF AUSTRALIA’S AGRICULTURE SECTOR, 2017

38 FOOD, FIBRE & FORESTRY FACTS — A SUMMARY OF AUSTRALIA’S AGRICULTURE SECTOR, 2017
FARM FACTS Grains and oilseeds
Australian grains — in a field of their own
• In Australia, 52,350,000 tonnes of coarse grain and wheat was produced in 2016–17 (i.e. cereal crops primarily including barley, grain sorghum, maize, oats, triticale and wheat), covering 18,469,000 hectares of land.
The total production and area planted of each crop, nationally and on a State-by-State basis is listed below:
Cereal NSW VIC QLD SA WA TAS Australia
BarleyProduction (‘000t) 2,697 3,200 300 3,000 4,200 17 13,414Area (‘000ha) 870 940 95 800 1,325 5 4,035SorghumProduction (‘000t) 406 0 800 0 2 0 1,208Area (‘000ha) 140 0 300 0 1 0 441MaizeProduction (‘000t) 189 55 217 0 6 0 467Area (‘000ha) 21 5 43 0 1 0 70OatsProduction (‘000t) 477 440 31 175 750 7 1,879Area (‘000ha) 322 154 25 63 341 4 909TriticaleProduction (‘000t) 148 28 1 55 13 1 247Area (‘000ha) 50 10 3 25 10 0 96WheatProduction (‘000t) 11,375 5,200 1,925 6,600 10,000 34 35,134Area (‘000ha) 3,500 1,550 735 2,000 5,125 7 12,917
SOURCE: ABARES, Australian Crop Report, 2017, No.181.

39FOOD, FIBRE & FORESTRY FACTS — A SUMMARY OF AUSTRALIA’S AGRICULTURE SECTOR, 2017
• Australia’s grains industry accounts for more than 170,000 jobs across Australia from farm to export dock.
State of the Grain Industry, Grain Growers Limited, 2016.
• The total gross value for all cereal crops in Australia in 2016–17 is approximately $17.336 billion-a-year. The gross values of cereals (selected) for grain per crop nationally are listed right:
Cereal Australia ($m)
Barley 2,703Sorghum 258Oats 338Rice 326Wheat 8,592Triticale 47Total 12,264SOURCE: Australian Bureau of Statistics, Agricultural
Commodities Statistics March 2017.
Australian grains and oilseeds — to the world market• The annual export volume of coarse grains in 2016–17 was 8,560,000 tonnes and had an
export value of $2.372 billion.SOURCE: ABARES, Australian Commodity Statistics, March 2017.
• Globally, 1,331 million tonnes of coarse grain was produced in 2016–17, covering over 324 million hectares of land.
SOURCE: ABARES, Australian Commodities, March 2017.
• About 65% of Australia’s grain is exported, including up to 90% of that grown per annum in Western Australia and South Australia.
SOURCE: State of the Grain Industry, Grain Growers Limited, 2016.
• The annual export volume of wheat totals 22,784,000 tonnes, with an export value of $6.479 billion. Australia’s principal wheat markets include Indonesia, China, Vietnam, Republic of Korea and Japan.
SOURCE: ABARES, Australian Commodity Statistics, March 2017.
• Australia exported 3,258,000 tonnes of oilseeds in 2016–17, of which 3,063,000 tonnes was canola worth $1.749 billion.
SOURCE: ABARES, Australian Commodity Statistics, March 2017.

40 FOOD, FIBRE & FORESTRY FACTS — A SUMMARY OF AUSTRALIA’S AGRICULTURE SECTOR, 2017
FARM FACTS Pork
Australian pork — get some pork on your fork
• There are more than 2,800 piggeries in Australia, with over 275,000 breeding sows.
The State breakdown of national piggeries includes:
NSW QLD TAS
Properties: 699 Properties: 808 Properties: 46
Sows: 58,311 Sows: 65,103 Sows: 2,102
VIC SA WA
Properties: 517 Properties: 313 Properties: 208
Sows: 65,992 Sows: 46,283 Sows: 37,240SOURCE: Australian Pork Limited, September 2017.
• In 2016–17, the number of pigs slaughtered was 5.16m. SOURCE: Australian Pork Limited, Imports, Exports and Domestic Production Report, June 2017.
• Australian pork farmers produced 397.1kt of pork in 2016–17. SOURCE: Australian Pork Limited, Imports, Exports and Domestic Production Report, June 2017.
• Australians consumed over 27kg of pig meat per person in 2015–16; ranked second behind poultry.SOURCE: DAWR, http://www.agriculture.gov.au/SiteCollectionImages/abares/pork-infographic-large.png, accessed 5 September 2017.
• During 2016–17, Australian farmers exported 37.7kt of pork. SOURCE: Australian Pork Limited, Imports, Exports and Domestic Production Report, June 2017.

41FOOD, FIBRE & FORESTRY FACTS — A SUMMARY OF AUSTRALIA’S AGRICULTURE SECTOR, 2017
• The Australian pig herd is free from many serious viral and bacterial diseases afflicting other pork producing countries. This is why on-farm biosecurity and product integrity continues to be one of the most important aspects of Australian pork production.
SOURCE: Australian Pork, Get the facts on your pork industry, 2016.
• Greenhouse Gas (GHG) emissions produced by the pork industry are significantly lower than other agricultural sectors. The industry has a target to reduce this to 1kg CO2-e per kg of pork produced, with effluent ponds an ideal opportunity for emissions capture, destruction or use.
SOURCE: Australian Pork, September 2017.
• The Australian pork industry has taken a world-leading position by voluntarily committing to phase out the use of gestation stalls, meaning that sows will not be confined in sow stalls from five days after they are last mated until one week before farrowing, when they are moved into piglet protection pens. While 78% of sows are now group housed during pregnancy, at any point in time less than 9% of sows are now housed in a gestation stall.
SOURCE: Australian Pork, Get the facts on your pork industry, 2016, as updated September 2017.
41FOOD, FIBRE & FORESTRY FACTS — A SUMMARY OF AUSTRALIA’S AGRICULTURE SECTOR, 2017

42 FOOD, FIBRE & FORESTRY FACTS — A SUMMARY OF AUSTRALIA’S AGRICULTURE SECTOR, 2017
FARM FACTS Rice
Australian rice — boiling it down
• The 2016–17 rice crop harvest of just over 800,000 tonnes, was the largest in three years as a result of plentiful winter and spring rains in 2016 materially improving water availability.
SOURCE: SunRice Annual Report 2017.
• In 2016–17 there were 772 farmers who harvested rice, a significant increase on the 347 growers from the year prior.
SOURCE: SunRice Annual Report 2017.
• The average yields for the 2015–16 rice crop was 10.9 tonnes per hectare, outperforming the five-year average of 10.0 tonnes per hectare.
SOURCE: SunRice Annual Report 2017.
Australian rice — development and efficiency
• The Australian rice industry spends up to $18 million each year to develop increasingly water efficient varieties of rice, research innovative farming techniques that help conserve our natural resources and improve productivity.
SOURCE: Ricegrowers’ Association of Australia, Our Australian Rice Facts 2017.
• Australian rice growers use 50% less water to grow one kilo of rice than the world average and are recognised worldwide for growing high quality rice varieties suited to Australia’s climate known as temperate rice.
SOURCE: Ricegrowers’ Association of Australia, Our Australian Rice Facts 2017.
• Australian rice growers surpassed the international average production of 5.4 tonnes per hectare 45 years ago. Today the Australian industries five year average is 10 tonnes per hectare with the 2015–16 crop averaging 10.9 tonnes per hectare.
SOURCE: Ricegrowers’ Association of Australia, Our Australian Rice Facts 2017.

43FOOD, FIBRE & FORESTRY FACTS — A SUMMARY OF AUSTRALIA’S AGRICULTURE SECTOR, 2017
• The University of Canberra has shown that about 40 billion native frogs are found on rice farms throughout the rice growing region and the endangered Southern Bell Frog relies on the rice industry for its survival.
SOURCE: Ricegrowers’ Association of Australia, Our Australian Rice Facts 2017.
• Direct investment into research and development helps maintain Australia’s competitive advantage in areas such as irrigation, crop breeding, crop protection and product development.
SOURCE: Ricegrowers’ Association of Australia, Our Australian Rice Facts 2017.
• The rice industry is the first Australian agricultural industry to initiate a regional biodiversity plan and a greenhouse reduction strategy.
SOURCE: Ricegrowers’ Association of Australia, Our Australian Rice Facts 2017.
Australian rice — to the world market
• Rice is the main source of nutrition for more than half the world’s population and, in a normal production year, Australian rice provides the staple diet of about 20 million people every day.
SOURCE: Ricegrowers’ Association of Australia, Our Australian Rice Facts 2017.
• Rice is Australia’s third largest cereal grain export. The industry generates about $800 million revenue per annum, with around $500 million of this coming from value-added exports.
SOURCE: Ricegrowers’ Association of Australia, Our Australian Rice Facts 2017.
• Only 25 million of the 600 million tonnes of world annual rice production is traded outside the country of origin. Therefore, although Australian rice only represents about 0.2% of world rice production, our exports represent about 2% of world trade and 14% of medium grade trade. Australian rice growers are the most efficient in the world, operating with zero production or export subsidies.
SOURCE: Ricegrowers’ Association of Australia, Our Australian Rice Facts 2017.

44 FOOD, FIBRE & FORESTRY FACTS — A SUMMARY OF AUSTRALIA’S AGRICULTURE SECTOR, 2017
FARM FACTS Sheep meat
Australian sheep meat — raising the baa
• In 2014–15, there were 31,136 farms focused on sheep and lambs in Australia. The breakdown of the breeding ewes herd, by state and territory follows:
• As at 30 June 2015, Australia had an estimated national flock of 67,543,092 sheep and lambs.
SOURCE: Australian Bureau of Statistics, Agricultural Commodities 2015–16, Catalogue No. 7121.0.
• In 2016–17, Australia produced 506,239 tonnes (carcase weight) of lamb and 163,365 tonnes of mutton.
SOURCE: Meat & Livestock Australia, Fast Facts 2017: Australia’s Sheepmeat Industry.
• The annual gross value of Australian sheep and lambs (excluding the value of wool on skins but including live exports) is $3.2 billion, a decrease of 2% from the record high of $3.3 billion in 2014–15. The gross value ($m) on a state and territory basis is:
NSW VIC QLD SA WA TAS Australia
Breeding ewes numbers (million)
26 13.1 1.8 10.7 13.9 2 37.2
SOURCE: Meat & Livestock Australia, Fast Facts 2017: Australia’s Sheepmeat Industry.
NSW $734.5m VIC $1,323m
QLD $58m SA $535.5m
WA $512.9m TAS $75.5m
ACT $ 1.3m Australia $ 3,240.7mSOURCE: Australian Bureau of Statistics, Value of Agricultural Commodities Produced, 2015/2016,
Catalogue No. 7503.0.

45FOOD, FIBRE & FORESTRY FACTS — A SUMMARY OF AUSTRALIA’S AGRICULTURE SECTOR, 2017
• In 2016–17, Australians, on average, ate 9.5 kg of mutton and lamb per person.SOURCE: Meat & Livestock Australia, Fast Facts 2017: Australian Sheepmeat Industry.
• In 2015–16, the sheepmeat industry accounted for 36% of all farms with agricultural activity.SOURCE: Meat & Livestock Australia, Fast Facts 2017: Australian Sheepmeat Industry.
Australian sheep meat — to the world market
• Australia is the world’s largest exporter of sheepmeat, and is the world’s third largest producer of lamb and mutton.
SOURCE: Meat & Livestock Australia, Fast Facts 2017: Australian Sheepmeat Industry.
• In 2015–16, Australian lamb exports totalled 241,900 tonnes (shipped weight). Over the same period, 147,900 tonnes of Australian mutton was exported and 66,000 tonnes of live sheep were exported. The principal markets for Australian sheep meat exports are:
Lamb (shipped weight) United States – 53,600 tonnesChina – 36,200 tonnesUnited Arab Emirates – 20,700 tonnes
Mutton (shipped weight) China – 25,100 tonnesMalaysia – 14,900 tonnesUnited States – 13,800 tonnes
Live sheep (‘000)
Kuwait – 692Qatar – 470Jordan – 157
SOURCE: ABARES, Australian Commodity Statistics 2016.

46 FOOD, FIBRE & FORESTRY FACTS — A SUMMARY OF AUSTRALIA’S AGRICULTURE SECTOR, 2017
FARM FACTS Sheep meat (continued)
• In 2015–16, about 50% of the sheep meat Australia produced was exported, with the remaining used for domestic consumption.
SOURCE: ABARE, Australian Commodity Statistics 2016.
• Australian sheep meat production in 2014 accounted for approximately 8% of world production.
SOURCE: Meat & Livestock Australia, Fast Facts 2017: Australian Sheepmeat Industry.
• In 2015–16, lives sheep exports were valued at $2,27.5 million. SOURCE: ABARES, Australian Commodity Statistics 2016.
• In 2015–16, the gross value of Australian exports of sheep meat and live sheep was approximately $2,531 billion.
SOURCE: ABARES, Australian Commodity Statistics 2016.
• Domestic expenditure on lamb in 2016–17 totalled around $2.3 billion.SOURCE: Meat & Livestock Australia, Fast Facts 2017: Australian Sheepmeat Industry.
46 FOOD, FIBRE & FORESTRY FACTS — A SUMMARY OF AUSTRALIA’S AGRICULTURE SECTOR, 2017

FOOD, FIBRE & FORESTRY FACTS — A SUMMARY OF AUSTRALIA’S AGRICULTURE SECTOR, 2017 47FOOD, FIBRE & FORESTRY FACTS — A SUMMARY OF AUSTRALIA’S AGRICULTURE SECTOR, 2017
48 FOOD, FIBRE & FORESTRY FACTS — A SUMMARY OF AUSTRALIA’S AGRICULTURE SECTOR, 2017
FARM FACTS Sugar
Australian sugar — as sweet as it gets
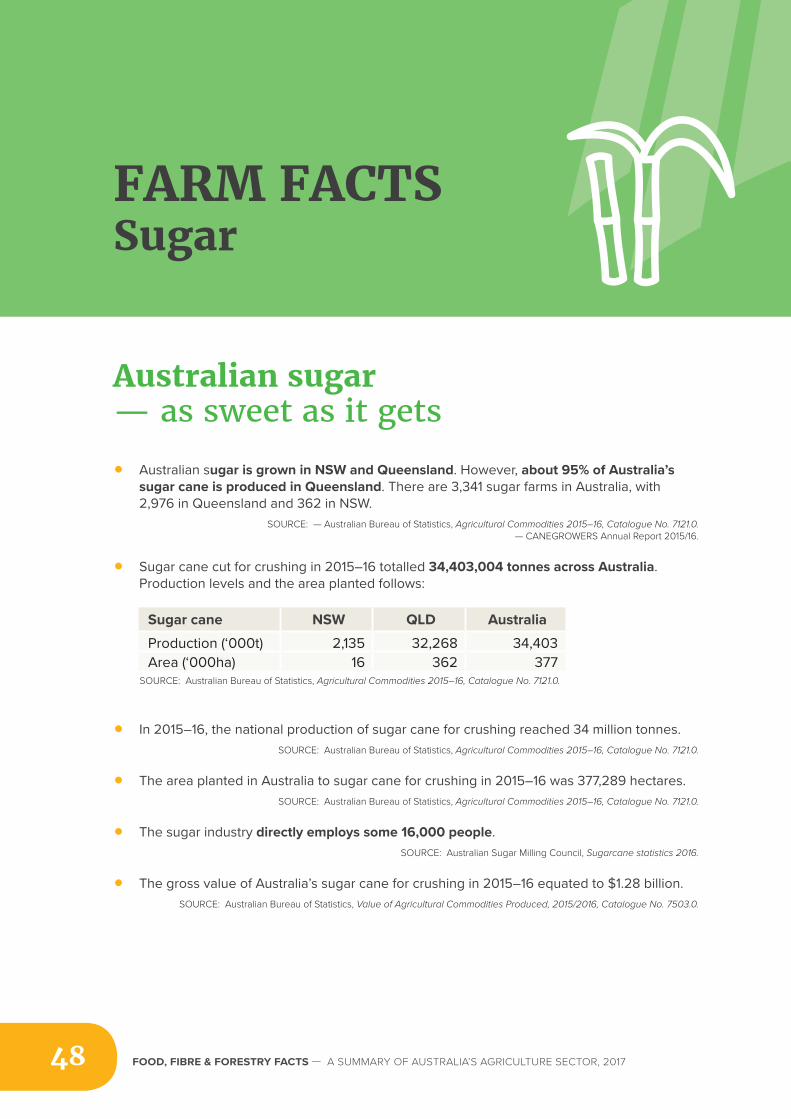
• Australian sugar is grown in NSW and Queensland. However, about 95% of Australia’s sugar cane is produced in Queensland. There are 3,341 sugar farms in Australia, with 2,976 in Queensland and 362 in NSW.
SOURCE: — Australian Bureau of Statistics, Agricultural Commodities 2015–16, Catalogue No. 7121.0. — CANEGROWERS Annual Report 2015/16.
• Sugar cane cut for crushing in 2015–16 totalled 34,403,004 tonnes across Australia. Production levels and the area planted follows:
• In 2015–16, the national production of sugar cane for crushing reached 34 million tonnes.SOURCE: Australian Bureau of Statistics, Agricultural Commodities 2015–16, Catalogue No. 7121.0.
• The area planted in Australia to sugar cane for crushing in 2015–16 was 377,289 hectares.SOURCE: Australian Bureau of Statistics, Agricultural Commodities 2015–16, Catalogue No. 7121.0.
• The sugar industry directly employs some 16,000 people.SOURCE: Australian Sugar Milling Council, Sugarcane statistics 2016.
• The gross value of Australia’s sugar cane for crushing in 2015–16 equated to $1.28 billion.SOURCE: Australian Bureau of Statistics, Value of Agricultural Commodities Produced, 2015/2016, Catalogue No. 7503.0.
Sugar cane NSW QLD Australia
Production (‘000t) 2,135 32,268 34,403Area (‘000ha) 16 362 377
SOURCE: Australian Bureau of Statistics, Agricultural Commodities 2015–16, Catalogue No. 7121.0.

49FOOD, FIBRE & FORESTRY FACTS — A SUMMARY OF AUSTRALIA’S AGRICULTURE SECTOR, 2017
Australian sugar — to the world market
• The world’s principal sugar exporters in 2015–16 were Brazil, Thailand, Australia and India.SOURCE: ABARES, Australian Commodity Statistics, 2016.
• In 2015–16, Australian sugar exports were worth $1.922 billion. The major markets for raw sugar in bulk (by volume) are:
The Republic of Korea 1,328,300 tonnes
Indonesia 991,800 tonnes
Japan 586,500 tonnes
Malaysia 274,700 tonnes
The United States of America 138,700 tonnes SOURCE: ABARES, Australian Commodity Statistics 2016.
49FOOD, FIBRE & FORESTRY FACTS — A SUMMARY OF AUSTRALIA’S AGRICULTURE SECTOR, 2017

50 FOOD, FIBRE & FORESTRY FACTS — A SUMMARY OF AUSTRALIA’S AGRICULTURE SECTOR, 2017
FARM FACTS Wool
Australian wool — riding on the sheep’s back
• The total wool produced in Australia is 324, 900 tonnes (greasy). The breakdown by State and Territory follows:
• The gross value of Australian wool (includes value of dead wool and wool on skins) is $2.96 billion, an increase of 10.8% from last year. The gross value per State and Territory ($m) is:
• Wool production for 2016–17 is forecast to increase by 4.3%, to 339 million kilograms (greasy) from the estimated 2015–16 production period and is largely the result of excellent seasonal conditions in many areas resulting in higher fleece weights.
SOURCE: Australian Wool Innovation Limited, Australian Wool Production Forecast Report, April 2017.
NSW 122,900 tonnes VIC 66,100 tonnes
QLD 6,900 tonnes SA 54,800 tonnes
WA 65,200 tonnes TAS 9,100 tonnesSOURCE: ABARES, Australian Commodity Statistic, 2016.
NSW $946m VIC $751m
QLD $62m SA $448m
WA $661m TAS $95m
ACT $ 1.7mSOURCE: Australian Bureau of Statistics, Value of Agricultural Commodities Produced, 2015/2016,
Catalogue No. 7503.0.

51FOOD, FIBRE & FORESTRY FACTS — A SUMMARY OF AUSTRALIA’S AGRICULTURE SECTOR, 2017
Australian wool — to the world market
• In 2015–16, the value of Australian wool exports was $3.281 billion. The major markets for Australian wool (by value) are China ($2.417 billion), India ($216 million) and Italy ($160 million).
SOURCE: ABARES, Australian Commodity Statistics, 2016.
• Wool is produced in all Australian states except the Northern Territory. New South Wales produces the greatest volume of wool, followed by Victoria, Western Australia and South Australia.
SOURCE: Department of Agriculture and Water Resources, www.agriculture.gov.au/ag-farm-food/meat-wool-dairy/wool#the-wool-levy
51FOOD, FIBRE & FORESTRY FACTS — A SUMMARY OF AUSTRALIA’S AGRICULTURE SECTOR, 2017
52 FOOD, FIBRE & FORESTRY FACTS — A SUMMARY OF AUSTRALIA’S AGRICULTURE SECTOR, 2017
About the National Farmers Federation
The National Farmers’ Federation (NFF) is the peak national body representing farmers and, more broadly, agriculture across Australia.
About the NFF
Since its inception in 1979, the NFF has earned a formidable reputation as a leader in the identification, development and achievement of policy outcomes – championing issues affecting farmers and dedicated to the advancement of Australian agriculture.
One of the keys to the NFF’s success has been its commitment to presenting innovative and forward-looking solutions to the issues affecting agriculture to meet current and emerging challenges for farmers and Australia’s vital agricultural productive capacity.
Vision“To be the voice of Australian agriculture.”
MissionTo influence the Australian Government, Parliament and the broader
community to achieve a strong, progressive and sustainable farming sector in Australia, through national and international representation and advocacy.
To provide collective strength and leadership.

53FOOD, FIBRE & FORESTRY FACTS — A SUMMARY OF AUSTRALIA’S AGRICULTURE SECTOR, 2017
Aims and objectivesMembership of the NFF is voluntary. As such, our members have the utmost commitment to state-of-the-art production techniques, science-based environmental management and world-leading animal husbandry standards. The NFF’s aims are:
• To ensure Australians are provided with food and fibre of the highest quality, while maintaining affordability for consumers.
• To champion the cause of Australian agriculture in embracing the very latest in technologies to deliver the very best products for domestic and, increasingly, international customers.
• To promote the interests of Australian farmers and to proactively interact with members to ensure Australian agriculture continues to be dynamic in meeting the ever-changing needs and expectations of the Australian community.
• To strive in achieving acceptance by governments of the major role Australian agriculture plays in the economic, environmental and social fabric of the nation, as well as farmers’ commitment to adequate self-regulation and review – thus, ensuring the highest standards across all facets of farm practice.
• To adopt all measures necessary to emphasise rightful recognition of Australian agriculture as the ‘backbone’ of the nation.

To achieve these aims, the NFF will:
• Initiate, foster and maintain a consultative, cooperative and communicative approach to dealing with governments, other farming and farm-related organisations, media, community groups and the public.
• Act as ‘the’ principal coordinating and peak policy development, lobbying and advocacy body for Australian farmers and agricultural interests.
• Encourage and facilitate united positions among member farm groups, as well as other relevant bodies, to achieve consensus in the policies and issues advanced.
• Recognise and promote the highest professional standards, backed by innovative farm practices, to ensure greater efficiency and competitiveness for the betterment of farmers and the Australian community.
• Stimulate greater awareness of modern farming excellence through improved communication between farmers and the Australian community.
54 FOOD, FIBRE & FORESTRY FACTS — A SUMMARY OF AUSTRALIA’S AGRICULTURE SECTOR, 2017

55FOOD, FIBRE & FORESTRY FACTS — A SUMMARY OF AUSTRALIA’S AGRICULTURE SECTOR, 2017
PET PRIMARY EMPLOYERS TASMANIA
Our members

nff.org.au farmers.org.au
@nationalfarmers @ozfarmers
@australianfarmers @nationalfarmersfederation
@AustralianFarmers