Embed Size (px)
Citation preview
FOOD PRICES AND CHILD OVERWEIGHT AND FOOD INSECURITY 1
Food Assistance and Children’s Eating Patterns, Food Insecurity, and Overweight:
The Influence of Local Food Prices
Taryn W. Morrissey, Alison Jacknowitz, and Katie Vinopal
American University
Draft-Please do not cite without permission.
April 2, 2012
This research was funded through the Institute for Research on Poverty (IRP) RIDGE Center for
National Food and Nutrition Assistance Research, which is supported by the Food Assistance
and Nutrition Research Program (FANRP) of USDA’s Economic Research Service (ERS). The
views and opinions expressed herein are those of the author and do not necessarily reflect those
of the Institute for Research on Poverty or the Food Assistance and Nutrition Research Program,
the Economic Research Service, or the United States Department of Agriculture.
FOOD PRICES AND CHILD OVERWEIGHT AND FOOD INSECURITY 2
Abstract
This study examines how local food prices influence children’s Body Mass Index (BMI),
overweight, food insecurity, and food consumption, and whether receipt of public food
assistance changes these associations. We link data from the Early Childhood Longitudinal
Study-Birth Cohort (ECLS-B), a nationally representative study of children from birth to age
five, to local food price data from the ACCRA Cost-of-Living Index (COLI) (~10,450
observations). Using Ordinary Least Squares (OLS) regression and within-child fixed effects
models that control for a range of explanatory variables, we exploit the variability in food price
data over time and among children who move residences. Results indicate that higher-priced
fruits and vegetables are associated with higher standardized measures of children’s BMI.
Surprisingly, higher-priced fast food is associated with a higher risk of being overweight.
Associations between food prices and children’s weight outcomes are stronger among children in
households receiving public food assistance, but food assistance receipt does not appear to
significantly mitigate nor exacerbate the associations between food prices and child outcomes.
There was no evidence that food prices are associated with children’s food consumption or
household-level food insecurity. Implications for policy are discussed.
FOOD PRICES AND CHILD OVERWEIGHT AND FOOD INSECURITY 3
Food Assistance and Children’s Eating Patterns, Food Insecurity, and Overweight:
The Influence of Local Food Prices
Introduction
Both under- and over-nutrition are important public health problems facing young
children in the United States. In 2009, approximately 23% of households with children aged six
and younger in the U.S. were food insecure (Nord, Coleman-Jensen, Andrews, & Carlson, 2010),
defined as “having limited or uncertain availability of food, or limited or uncertain ability to
acquire acceptable foods in socially acceptable ways”1 (Skalicky et al., 2006). More than 12% of
two- to five-year-old children were considered obese (defined as above the 95th
percentile by age
and gender) in 2009-2010, up from 5% in 1971-1974 (Ogden, Carroll, Kit, & Flegal, 2012).
Both food insecurity and obesity during early childhood are associated with poor short-
and long-term developmental outcomes. Food insecurity is associated with long-term health
problems (Alaimo, Olson, Fongillo, & Briefel, 2001), poorer mother-child attachment security
and cognitive development (Zaslow et al., 2009), and greater behavioral problems (Slack & Yoo,
2005). Likewise, being overweight in early childhood is associated with a greater likelihood of
being an obese adult, poorer physical health (Sturm, 2002), and social-emotional and academic
problems (Bradley et al., 2008; Crosnoe & Muller, 2004).
In addition to an increasingly sedentary lifestyle, a lack of affordable, healthy foods
contributes to the growing epidemic of childhood obesity (IOM, 2005). While the real price of
food has declined in recent decades, the real price of fruits and vegetables increased by 17%
between 1997 and 2003 (Cawley, 2010). Poorer-quality, energy-dense foods cost less than more
1 Food insecurity measures both the quality and quantity of food based on an 18-item scale developed by the USDA.
The scale captures experiences at the household level (in the last 12 months), such as running out of food,
perceptions that food in a household is of inadequate quality or quantity, and reduced food intake by adults or
children, all because of financial constraints (Bickel, Nord, Price, Hamilton, & Cook, 2000).
FOOD PRICES AND CHILD OVERWEIGHT AND FOOD INSECURITY 4
nutritious foods, and there is evidence that this price gap is widening (Monsivais & Drewnowski,
2007; Monsivais, Mclain, & Drewnowski, 2010). As a result, families facing tight budgets are
more likely to purchase lower-quality foods than healthier foods (Drewnoski, 2004; Drewnoski,
Darmon, & Briend, 2004). Research suggests that higher prices of fast food are associated with
lower body weight and body mass index (BMI; a measure of weight-for-height), while higher
fruit and vegetable prices have the opposite effect (Powell & Bao, 2009a; Powell & Chaloupka,
2010; Sturm & Datar, 2005, 2008). In addition, experimental work has found that children
decrease their consumption of certain foods when the price is increased (Epstein et al., 2006).
Associations between local food prices and child BMI appear to be larger among low-income
children as compared to their higher-income counterparts (Powell & Bao, 2009a; Powell &
Chaloupka, 2010; Sturm & Datar, 2005), presumably because their families have less disposable
income with which to adapt to a higher-price environment. Evidence exists that food assistance
and subsidized meals may help combat obesity among low-income children through the
provision of healthy foods (Hofferth & Curtin, 2005; Jones, Jahns, Laraia, & Haughton, 2003;
Kimbro & Rigby, 2010; Schmeiser, 2012); however, one study found that the Supplemental
Nutrition Assistance Program (SNAP; formerly known as the Food Stamp Program), which has
few nutritional restrictions, may contribute to child obesity in cities with high food prices
(Kimbro & Rigby, 2010).
A lack of access to affordable, nutritious foods is also presumed to underlie food
insecurity (Rose, 2010). To help families purchase healthy foods, the U.S. spent $78.8 billion in
fiscal year 2009 on domestic food assistance programs, much of which goes to families with
children (Oliveira, 2010). In 2008, 81% of low-income households with food-insecure children
received food assistance from one of the three largest programs: SNAP, the Special
FOOD PRICES AND CHILD OVERWEIGHT AND FOOD INSECURITY 5
Supplemental Nutrition Program for Women, Infants, and Children (WIC), or the National
School Lunch Program. SNAP serves nearly one-half of all children at some point in their lives
(Rank & Hirschl, 2009), and in 2009, WIC served more than 9 million women and their young
children (USDA, 2011). WIC provides healthy foods to pregnant and postpartum women and
their children to support healthy development, whereas the National School Lunch and Breakfast
Programs provide subsidized or free lunch or breakfast to eligible children in kindergarten
through 12th grade (Nord, Andrews, & Carlson, 2009). Research suggests that food assistance
receipt increases total household food expenditures and reduces food insecurity (Bartfeld & Ahn,
2011; Fox, Hamilton, & Lin, 2004; Rose, Habicht, & Devaney, 1998; Yen, Andrews, Chen, &
Eastwood, 2008), although selection into food assistance programs is problematic (Dunifon &
Kowaleski-Jones, 2003; Wilde, 2007). Few studies examine the influence of food prices on food
insecurity.
Although the effects of local food prices on children’s outcomes have received greater
research attention in recent years, several areas remain unexplored. Despite the importance of
adequate nutrition during early childhood, the majority of these studies have focused on
adolescent or school-aged children (Powell & Chaloupka, 2010; Sturm & Datar, 2005), while
less is known about how local food prices affect child outcomes at younger ages. Second, with
few exceptions (Kimbro & Rigby, 2010; Powell & Chaloupka, 2010), most studies have
estimated cross-sectional associations between food prices and child outcomes, which may be
biased by differences across individual children and their families that influence both the
propensity to live in high-cost areas and children’s outcomes. Third, to date, no study has looked
at the influences of local food prices on obesity, food insecurity, and eating habits, and how the
prices of different categories of food (e.g., fruits and vegetables vs. fast food) may differentially
FOOD PRICES AND CHILD OVERWEIGHT AND FOOD INSECURITY 6
influence these three outcomes.2 Fourth, the processes through which higher food prices may
affect children’s weight or food insecurity – presumably through changes in food consumption –
have not been identified. Finally, previous research regarding how food assistance receipt
differentially affects child outcomes across communities with high or low food prices (Kimbro &
Rigby, 2010) focused on a predominantly disadvantaged sample limited to 20 cities and only
examined obesity; whether food assistance moderates relations between food prices, child
obesity, and food insecurity remains unclear.
We address these gaps in the literature using two comprehensive datasets, namely the
Early Childhood Longitudinal Study-Birth Cohort (ECLS-B) containing child-level information
on child health and family dynamics, and the Council for Community and Economic Research’s
(C2ER) ACCRA Cost-of-Living Index (COLI ) data, which contains city-level information on
local food prices. Specifically, the two primary research objectives and hypotheses of this study
are:
1) Estimate how local food prices influence the food insecurity, weight outcomes, and eating
patterns of children from infancy to five years of age. We hypothesize that high-priced fruits
and vegetables and low-priced fast food may contribute to higher likelihood of being
overweight, higher BMI, and less healthy eating habits; high prices for both fruits and
vegetables and fast food may contribute to a greater likelihood of being food insecure.
2) Understand how participation in food assistance programs changes the relationship between
food prices and food insecurity, weight outcomes, and eating patterns of children from
infancy to five years of age. We expect that food assistance receipt serves as a buffer
between local food prices and children’s food insecurity; however, food assistance receipt
2 Note this study does not examine the relationship between food insecurity and obesity.
FOOD PRICES AND CHILD OVERWEIGHT AND FOOD INSECURITY 7
may exacerbate the anticipated relationship between food prices and child weight outcomes
and poor eating habits.
Methods
Data
Early Childhood Longitudinal Study-Birth Cohort (ECLS-B). The ECLS-B is a
longitudinal dataset collected by the National Center for Education Statistics (NCES). The
baseline sample of approximately 10,700 children was designed to be nationally representative
of children born in the United States in 2001 with an over-sample of Asian and American-Indian
children, twins, and low and very low birthweight children.3 The ECLS-B follows children from
birth through kindergarten with data collection occurring when the children are 9 months of age
(2001-02), 2 years of age (2003-04), approximately 4 years of age (2005-06, also known as the
preschool wave), and at two waves of kindergarten entry (2006-08). The 9-month data collection
also includes information from infants’ birth certificates. Two waves of data were collected at
kindergarten entry. In the fall of 2006, information was collected from all participating children,
approximately 75% of whom were in kindergarten or higher. In the fall of 2007, data were
collected from the remaining 25% of participants who had not yet entered kindergarten, as well
as from those who were repeating kindergarten in the 2007-08 school year. At each wave,
information about child and family characteristics were collected through interviews with parents
and child assessments. The ECLS-B contains residential zip codes for children at all waves of
data collection, allowing the dataset to be merged with contextual food price data.
ACCRA Cost of Living Index (COLI). The ACCRA COLI dataset collected by the
Council for Economic Research (C2ER; http://www.coli.org) is the main source of cost-of-living
3 The reported sample sizes are rounded to the nearest 50, per NCES regulations regarding disclosure of restricted-
use data.
FOOD PRICES AND CHILD OVERWEIGHT AND FOOD INSECURITY 8
data in the United States, including local food prices. The ACCRA COLI food price data,
collected from more than 300 metropolitan areas, have been reported quarterly since 1968. For
this study, data from 2001 through 2008, corresponding with the years of ECLS-B data
collection, were merged with the ECLS-B. The ACCRA data are measured at the Core Based
Statistical Area (CBSA)4 level, rather than by zip code or neighborhood. Since our food price
data are collected at the CBSA-level, which constitutes a large area geographically, and
important neighborhood-level differences in prices may not be detected.
To merge the ECLS-B and ACCRA data, children’s residential zip codes from the ECLS-
B were matched with their corresponding CBSA codes, and then merged with the ACCRA data.
ACCRA data are not collected in certain areas of the country, particularly rural areas; as a result,
we will not have corresponding food price data for some children in the ECLS-B. Approximately
5,650 children (53%) have food price data for at least one wave. This is comparable to previous
research using these data (e.g., Sturm & Datar [2005] included 33% of the Early Childhood
Longitudinal Study-Kindergarten Cohort sample). Despite these limitations, the ACCRA data
remain the best source for comprehensive regional food prices and have been used in more than
ten studies since 2004 (Powell & Chaloupka, 2010).
Analysis Sample
The analysis sample consists of children who reside in households with income below
300% of the Federal Poverty Level (FPL: $20,000 for a family of 4 in 2006) with ACCRA data.
Because we hypothesized that the health outcomes of children in lower-income families will be
more affected by food prices as compared to those in high-income families, we limited our
sample to observations of children living in families under 300% of the FPL. A child observation
4 CBSA codes replaced Metropolitan Statistical Area (MSA) codes in 2000.
FOOD PRICES AND CHILD OVERWEIGHT AND FOOD INSECURITY 9
is included for each wave the household has an income below 300% of the FPL; that is, an
individual child may be included in the sample at one wave and excluded in another, depending
on whether his or her family’s income is below 300% FPL. We define our analysis sample
broadly because many food-insecure households with children are well above the poverty line
(Nord et al., 2010), and the rates of obesity and eating patterns of children across the income
spectrum may be affected by local food prices. We only include an observation if the child in
that wave has ACCRA data and valid information for all of the independent variables. We allow
the sample size to vary by the dependent variable, as the three main dependent variables –
children’s weight outcomes, food insecurity, and food consumption – were measured over
different time periods, as explained below.
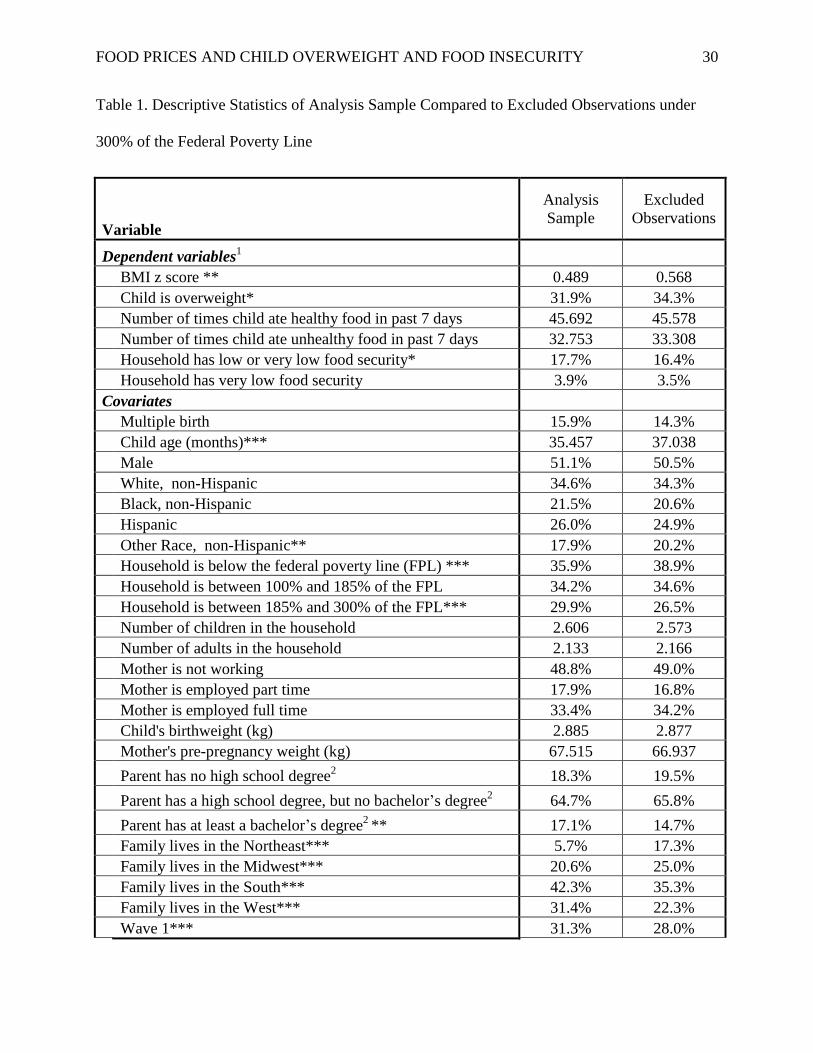
Given the large number of observations excluded to missing ACCRA data, Table 1
compares the characteristics of our analysis sample to those under 300% of FPL dropped from
our sample due to missing data (missing ACCRA food prices, other covariates, or dependent
variables). Our analysis sample averaged lower BMI z-scores and rates of overweight than those
dropped, not surprising given the higher rates of child obesity in rural areas (Liu et al., 2007).
Analysis sample households were more likely to be in the South and West, given the ACCRA
sampling. The analysis sample had higher rates of household food insecurity, parents who had
graduated college, and were less likely to be American Indian, Asian or Multiracial (i.e., other
race) or below the poverty line. Households were more likely to have incomes between 185 and
300% of FPL than excluded observations. It is important to note that the analysis sample does
not differ from excluded observations along the following dimensions: child gender, child
race/ethnicity, food consumption, household composition, maternal employment, or child’s birth
or mother’s pre-pregnancy weight.
FOOD PRICES AND CHILD OVERWEIGHT AND FOOD INSECURITY 10
Insert Table 1 here.
Measures
Child overweight and body mass index (BMI). This study relies on anthropometric
measures of child weight and height from the 2-year, 4-year, and both kindergarten waves of
data collection. Each physical measurement was obtained twice to minimize measurement error.
If the two measures were more than 5% apart a third measurement was taken. The two closest
measurements were then averaged together. Body mass index (BMI) was calculated using
measures of children’s weight and height. Using the Centers for Disease Control and Prevention
(CDC) standards (Kuczmarski et al., 2002), BMI z-scores with a mean of zero and standard
deviation of one were generated to allow for comparisons across age and gender. The binary
outcome of overweight5 (at or above the 85
th percentile for age and gender) is used (1 =
overweight or obese). Because there is no agreed upon definition of BMI for children under two
years of age, when examining weight outcomes, we study children 24 months and older.
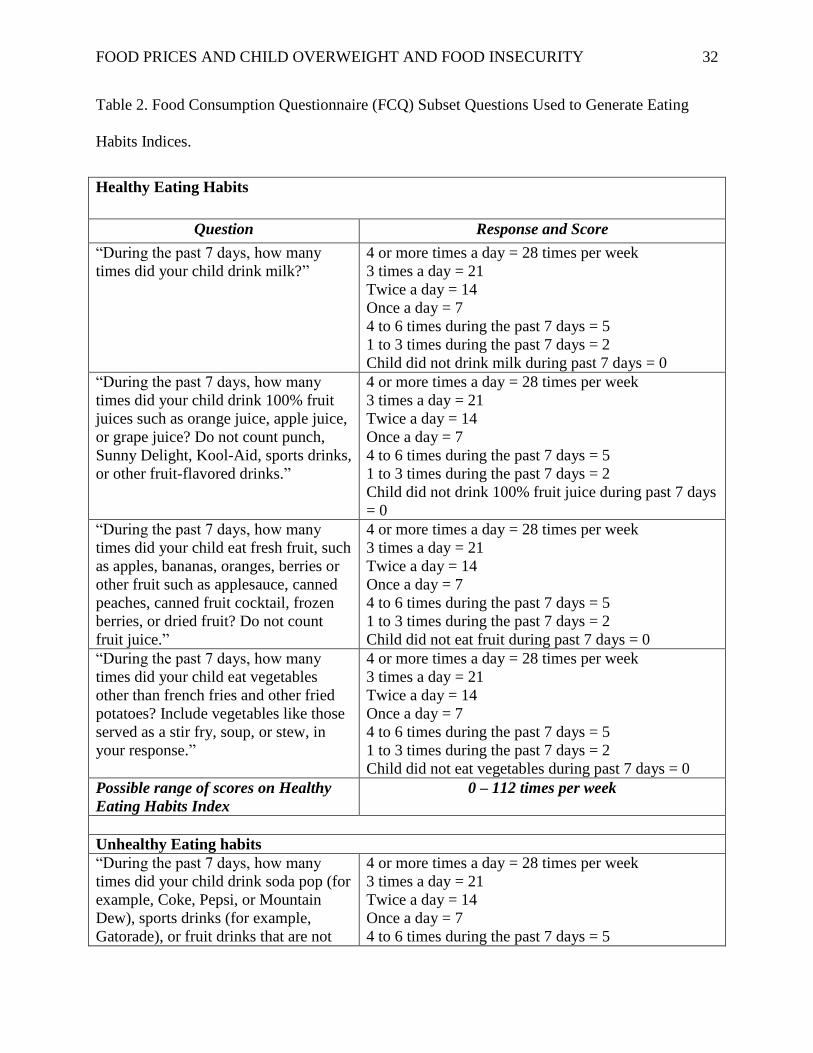
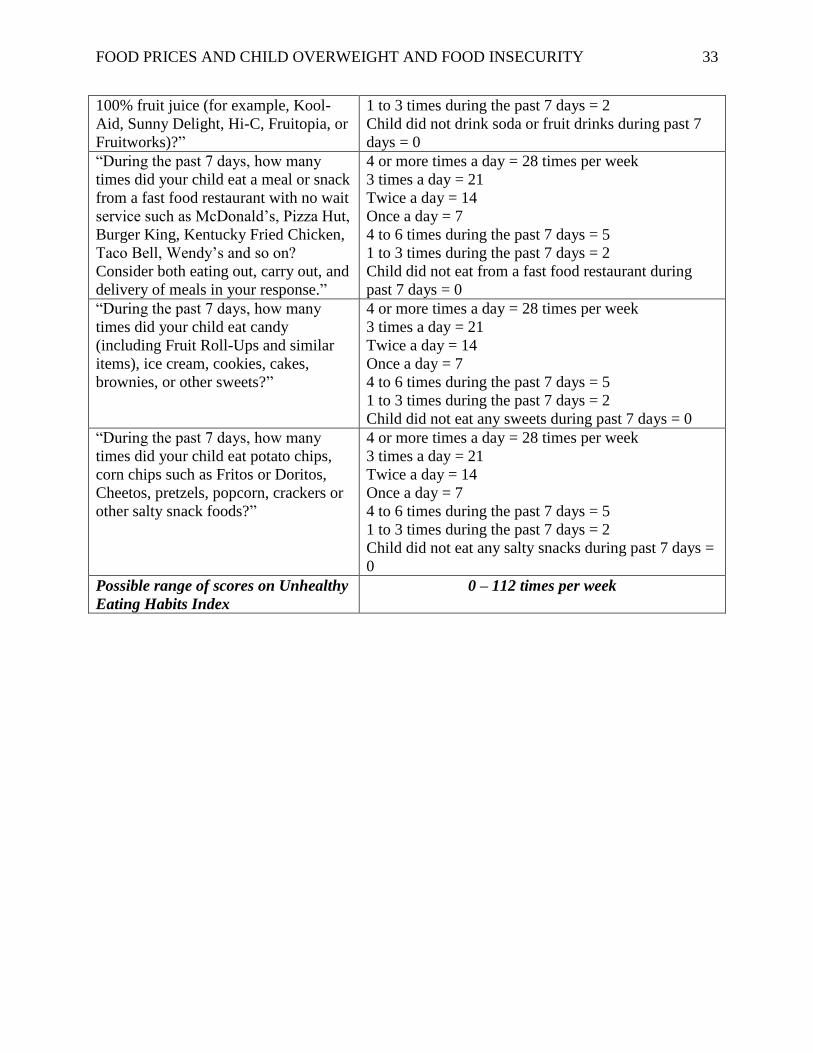
Child eating habits. Beginning at preschool, parents were asked about their children’s
eating habits (i.e., frequency in the past 7 days) using a subset of the Food Consumption
Questionnaire (FCQ), developed for the Youth Risk Behavior Surveillance Survey administered
by the CDC. Parents reported the frequency that their children consumed specific foods in the
past 7 days, including specific vegetables, fruit, milk, sweetened beverages (e.g., soda), and fast
food. Following Sturm and Datar (2011), qualitative response categories were translated into
continuous measures representing the number of times in the previous 7 days that the child ate or
drank a certain food. Midpoints were used for responses spanning several times (e.g., “1-3 times
during the past 7 days” was coded as “2 times per week”). Responses were used to generate 2
5 The CDC previously recommended the terms “at risk for overweight” for a BMI at or above the 85
th percentile for
and “overweight” for above the 95th
percentile, but, in 2010, modified its recommended terminology to child
overweight and obese: see http://www.cdc.gov/nchs/data/nhsr/nhsr025.pdf.
FOOD PRICES AND CHILD OVERWEIGHT AND FOOD INSECURITY 11
continuous eating habits indices representing the total number of times per week that the child
ate healthy or unhealthy foods. Higher scores on the Healthy Eating Index indicate healthier
eating; higher scores on the Unhealthy Eating Habits indicate poorer eating. Table 2 describes
the eating habits indices. For this variable, the preschool (4-year) and kindergarten waves of data
are analyzed.
Insert Table 2 here.
Food insecurity. At all waves of data collection, participating households were asked
about their experiences of food insecurity over the past 12 months using the 18-question standard
Core Food Security Module (CFSM) created by the U.S. Department of Agriculture (USDA).
Questions ask respondents about their experiences over the past 12 months regarding their food
purchases, consumption, and concerns (e.g., whether they were worried their food would run out
before they had money to buy more, whether they cut the size of or skip their own or their
children’s meals because there wasn’t enough money to buy food). From these questions, a raw
score, a scale score, and a categorical measure of food security at the following three levels were
generated: household food security, adult food security, and children’s food security. The raw
scores are the number of questions answered affirmatively (i.e., yes; often or sometimes; almost
every month; or some months but not every month). In this study, we use two binary indicators
of household food insecurity: one which includes both low and very low food security (1 = very
low or low food security), and another indicating the household has very low food security (1 =
very low food security).6,7
6 Note that the ECLS-B Users Guide refers to these categories as food secure, food insecure without hunger, and
food insecure with hunger (Nord et al., 2006). We use the above terms in accordance with the National Academies
of Sciences recommendation (Wunderlich & Norwood, 2006). 7 The household-level variables are calculated according to Bickel et al. (2000).
FOOD PRICES AND CHILD OVERWEIGHT AND FOOD INSECURITY 12
Local average annual food prices. The ACCRA COLI data contain CBSA-level
information on food prices for a total of 63 grocery items. In this study, we focus on 6 fruit and
vegetable items purchased for home consumption and 3 fast foods consumed away from home:
(1) fruits and vegetables (potatoes, bananas, lettuce, sweet peas, peaches, and frozen corn) and
(2) fast foods (the average price of a McDonald’s quarter-pounder with cheese [collected for at
least 5 different restaurants if there were more than 5 in the area, or at all McDonald’s in the area
if there were less than 5]; the average price of an 11”-12” thin-crust regular cheese pizza at Pizza
Hut and/or Pizza In; and the average price of a fried chicken drumstick and thigh at Kentucky
Fried Chicken and/or Church’s Fried Chicken). A total of 3 food price indices were calculated.
We averaged together the items’ prices for each of the two groups to create average indices for
(1) fruits and vegetables and (2) fast foods. In addition, we created a third index of weighted fruit
and vegetable food prices based on the item’s share in the U.S. Department of Agriculture’s
(USDA) Thrifty Food Plan consumer basket for fruits and vegetables corresponding with the age
of the child (e.g., for the 2-year wave, the weighted fruit and vegetable price index was based on
the USDA’s recommended intake of potatoes, bananas, lettuce, sweet peas, peaches, and corn for
2-year-olds) (USDA, 2007); however, the analyses presented here use the unweighted average,
as results using the weighted average did not vary from those using the unweighted average
(results not shown; available from authors upon request). Because areas are covered at different
times in the ACCRA COLI data collection (that is, food prices within a CBSA may be assessed
between 1 to 4 quarters each year), measures of annual averaged food prices indices were
calculated. All average prices are inflation-adjusted to 2008 dollars.
Receipt of public food assistance. At each wave of data, parents were asked about
participation in the Food Stamp and WIC programs over the past year, and after kindergarten
FOOD PRICES AND CHILD OVERWEIGHT AND FOOD INSECURITY 13
entry, about their children’s school lunch and breakfast participation. Responses were used to
create an overall dummy variable at each wave representing that the household had received any
food assistance (1 = received food stamps, WIC, school lunch, and/or school breakfast, 0 = did
not receive any public food assistance).
Covariates. We take advantage of the rich measures of child, maternal, and household
characteristics in the ECLS-B data to control for potential confounding factors that may be
associated with both local food prices and children’s weight outcomes. Fixed (i.e., time-
invariant) characteristics included child gender (1 = male), race/ethnicity, coded as a
multicategorical variable (non-Hispanic white, non-Hispanic black, Hispanic, other), whether the
child had a twin (1 = twin), age in months, and birthweight (in kg), which were taken from
information on children’s birth certificates. Mothers reported their and their child’s father’s
education at wave 1 (9 months), which was coded as a multicategorical variable (neither parent
graduated high school, at least one parent has a high school degree but no bachelor’s degree,
and at least one parent graduated from college). At 9 months, mothers reported their pre-
pregnancy weight (in kg). At each wave, mothers reported their family income, which was used
to generate a family’s income-to-needs ratio based on the FPL and then coded into a series of
dummy variables (family income below 100% FPL, family income between 100-185% FPL, and
family income between 185-300% FPL). Also at each wave, mothers reported the number of
children and adults living in the household and their employment status and weekly work hours,
which were recoded into three dummy variables (not employed, employed fewer than 35 hours
per week, employed 35 or more hours per week). The child’s geographic region was controlled
(Northeast, Midwest, West, South). The overall cost of living (COLI) index, which captured
prices of a basket of goods such as housing and clothing, was controlled for to capture
FOOD PRICES AND CHILD OVERWEIGHT AND FOOD INSECURITY 14
differences in prices across CBSAs. Finally, indicator variables for the wave of data collection
are included to control for fixed factors related to the time period of data collection.
Empirical Strategy
A series of Ordinary Least Squares (OLS) and linear probability models were used to
predict children’s health outcomes from measures of local food prices. First, to address the first
aim of estimating how local food prices influence children’s BMI, overweight, eating habits, and
food insecurity, OLS regression models were estimated as described in Equation 1.
Yit = β0 + β1FPit + β2CMHit + εit (1)
In Equation 1, Yit represents children’s BMI, overweight, eating habits, and food insecurity for
child i at time t; FPit represents the independent variables of interest, fruit and vegetable and fast
food price indices, and CMHit is a vector of child, maternal, and household characteristics. For
the binary dependent variables of overweight and food insecurity, linear probability models
(LPM)8 were estimated. Standard errors were clustered at the CBSA level. Because fruit and
vegetable and fast food price indices may be highly correlated, we also estimate models entering
each index separately. Because food prices may have a lagged effect on children’s weight
outcomes, we test associations between food prices at the previous wave and child BMI and
overweight.
To test the second objective of this study, how participation in public food assistance
programs changes the relationship between food prices and children’s health outcomes,
Equations 1 is re-estimated using a subsample of children whose households reported receiving
at least one public age-appropriate food assistance program at that wave (food stamps, WIC,
school lunch, and/or school breakfast), and then again using a subsample of children whose
8 Analogous logistic regression models were also conducted as sensitivity analyses. Because results were not
substantially different from the linear probability models, they are not reported but are available upon request.
FOOD PRICES AND CHILD OVERWEIGHT AND FOOD INSECURITY 15
households had not received food assistance at that wave to compare coefficients across the
subsamples.
Results
Descriptive Results
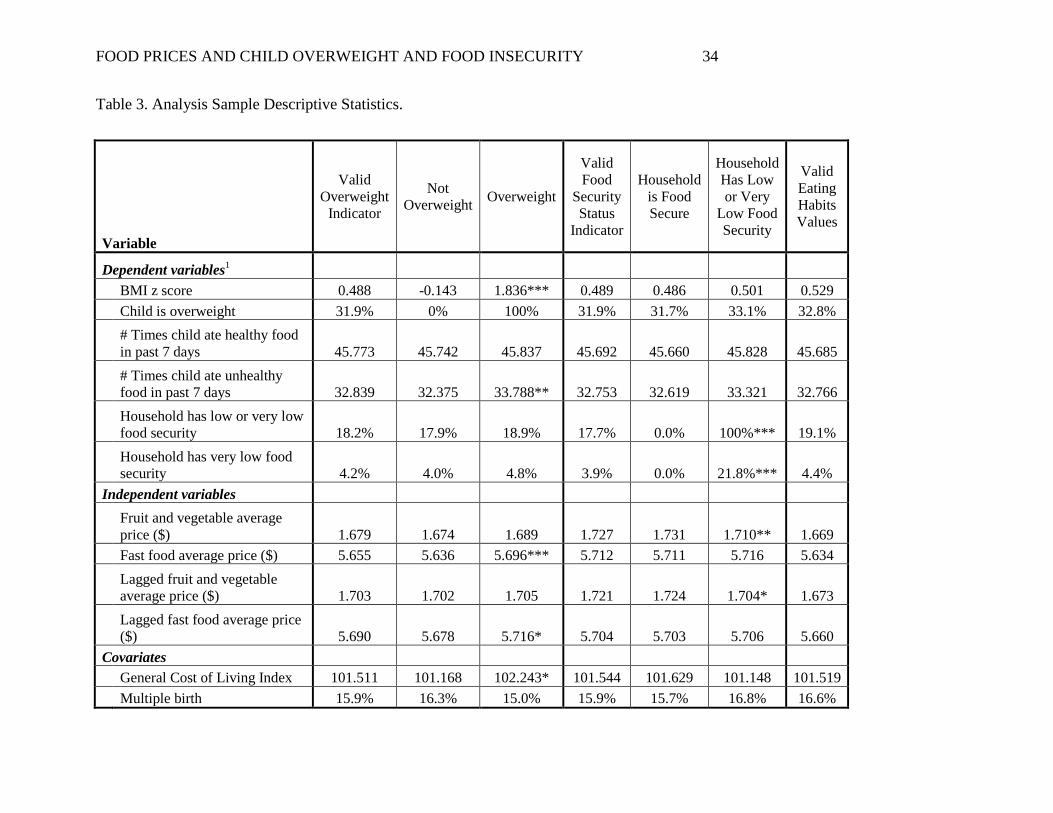
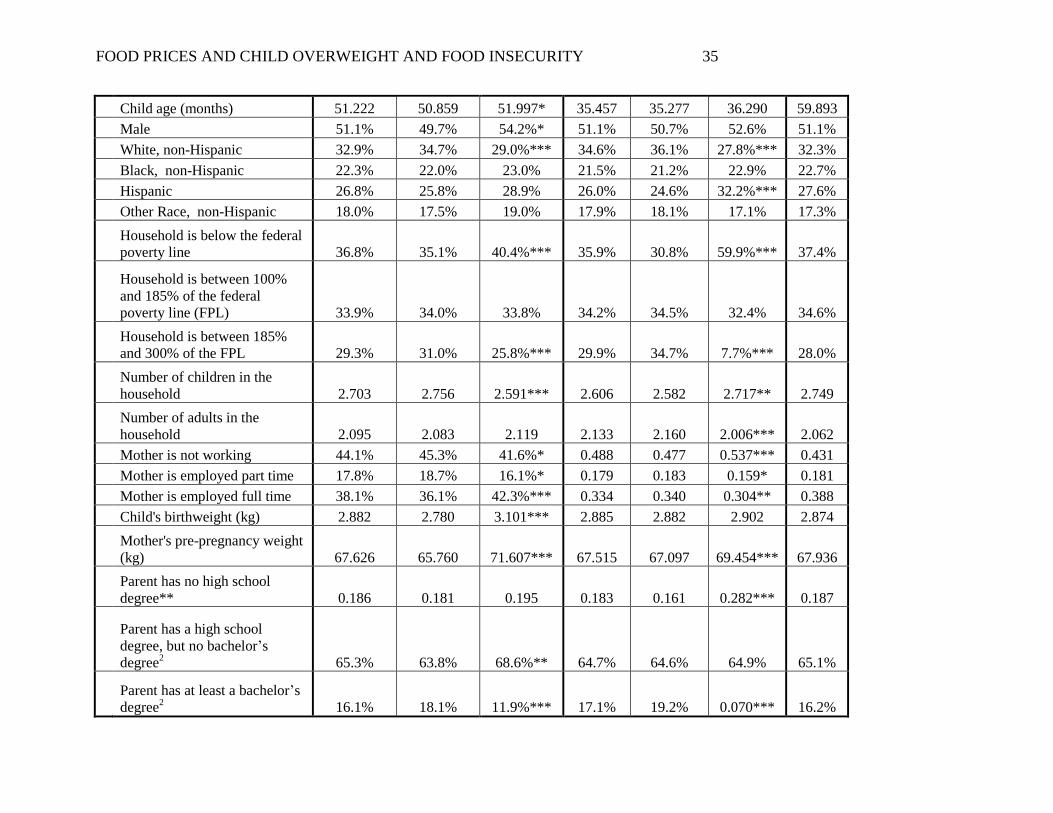
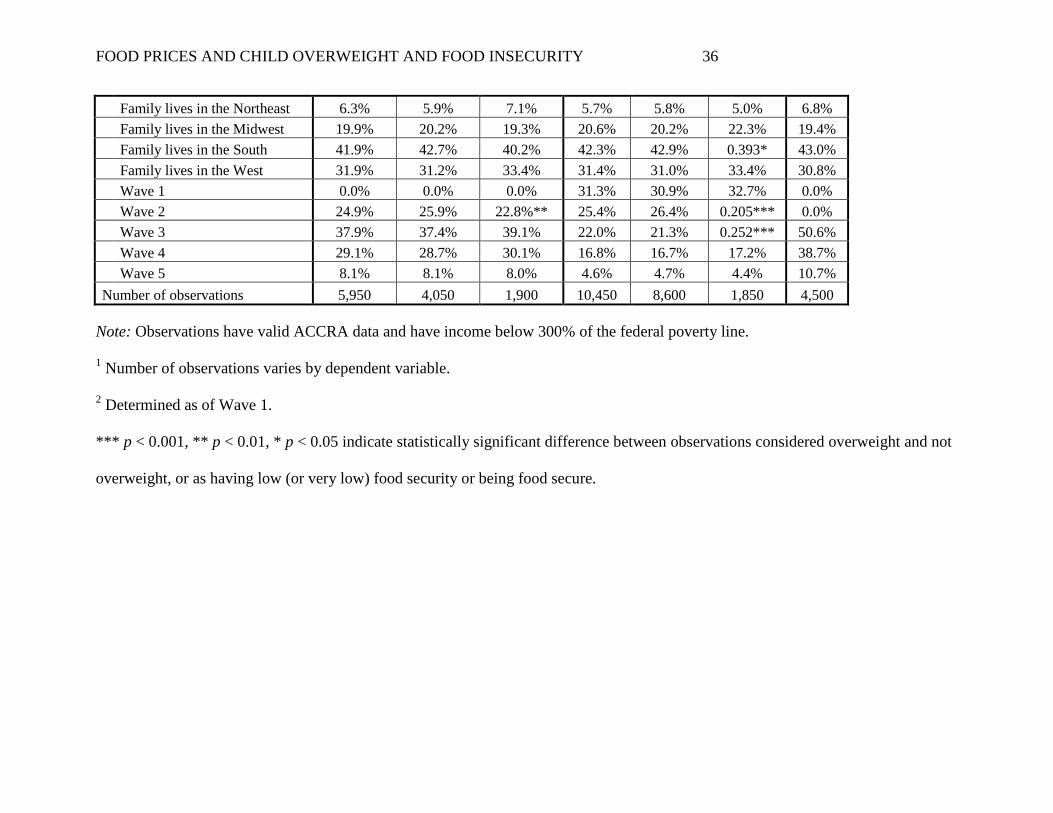
The analysis sample’s descriptive statistics, pooled across years, are displayed in Table 3.
The number of observations varies by dependent variable, as BMI z-scores are valid for children
older than 24 months (thus, not at wave 1 and half of the children at wave 2) and children’s
eating habits were not assessed at waves 1 and 2. On average, children’s BMIs were about one-
half of a standard deviation above the CDC’s recommendations for their age and gender. About
one-third of children were overweight (at or above the 85th
percentile), and about 18% of
children lived in households that had low or very low food security. Children living in food
secure households were more likely to live in areas with higher average fruit and vegetable
prices, and overweight children were more likely to live in areas with higher average fast food
prices. As expected, there were several significant differences in covariates between overweight
and not overweight children, and between children in food secure households and those in food
insecure households, particularly in child race/ethnicity, family poverty, maternal employment,
and parent education.
Insert Table 3 here.
Regression Results
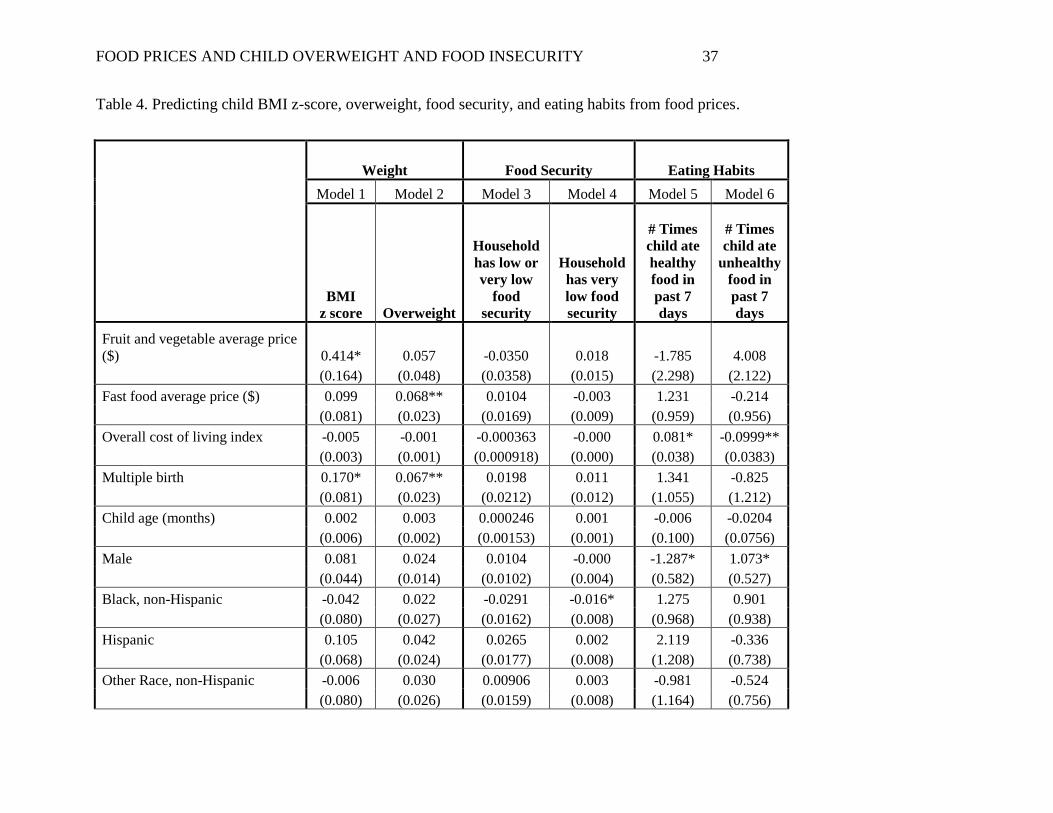
Table 4 displays the OLS results predicting child BMI, overweight, eating habits, and
household-level food insecurity from average annual food prices, controlling for the overall
COLI in the CBSA and a range of child, maternal, and household characteristics. Consistent with
hypotheses, fruit and vegetable prices are positively associated with higher child BMI z-scores.
FOOD PRICES AND CHILD OVERWEIGHT AND FOOD INSECURITY 16
An increase of $1 in the average annual price of fruits and vegetables is associated with an
increase in children’s BMI z-scores of 0.41, or two-fifths of a standard deviation increase. The
overall COLI is negatively related to children’s BMI z-scores, such that those living in generally
low-cost areas had higher BMI z-scores, on average, than those in higher-cost areas.
Surprisingly, higher average fast food prices are associated with a 6.8 percentage point increase
in the likelihood of being overweight. As expected, household composition, family poverty
status, maternal employment and pre-pregnancy weight, and child birthweight are related to
children’s weight outcomes.
In contrast with expectations, food prices are unrelated to either measure of household-
level food insecurity. Consistent with previous research, non-Hispanic Black children and those
living in households below 100 or 185% of FPL with fewer adults and lower parental education
were more likely to experience household food insecurity. Fruit and vegetable and fast food
prices are also not related to mothers’ reports of children’s food consumption. Likewise,
sensitivity tests predicting children’s consumption of individual food items (fruits, vegetables,
and fast foods) from local fruit and vegetable and fast food prices did not reveal any significant
associations (results not shown; available from authors upon request). Interestingly, living in
higher-cost areas (i.e., high overall COLI) is associated with greater consumption of healthy
foods, whereas living in lower-cost areas (i.e., low overall COLI) is associated with lower
consumption of unhealthy foods. Boys tended to eat fewer healthy foods and more unhealthy
foods than girls. Households living below the poverty line reported a higher consumption of
healthy foods among their children. These families may more often eat less expensive, home-
cooked meals, which tend to be healthier than those eaten out. Households with more adults
averaged greater consumption of unhealthy foods, whereas those with non-employed mothers
FOOD PRICES AND CHILD OVERWEIGHT AND FOOD INSECURITY 17
averaged lower consumption of these foods. Child birthweight and parent education are
associated with both healthy and unhealthy food consumption, such that higher birthweight
children and those whose parents had lower education ate more of both healthy and unhealthy
foods.
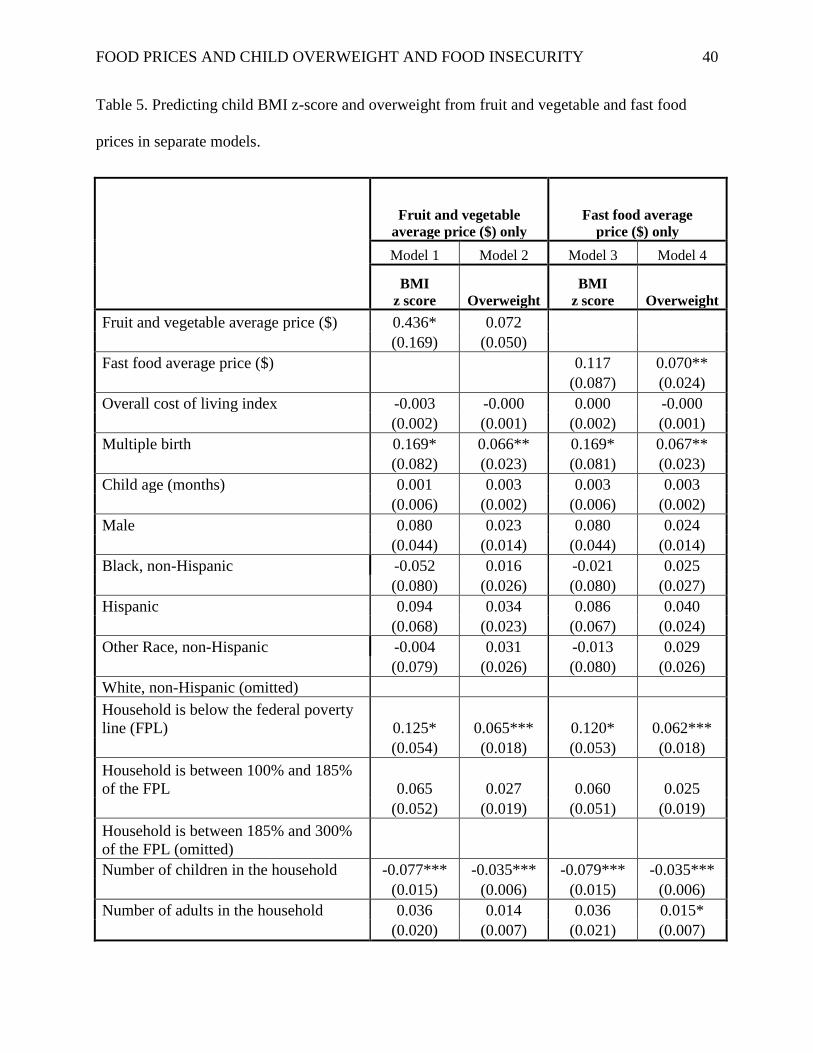
Analyses that included fruit and vegetable and fast food prices in separate models, as
displayed in Table 5, show similar patterns and magnitudes of results suggesting that the fruit
and vegetable and fast food prices are not highly correlated.
Insert Table 4 here.
Insert Table 5 here.
Because food prices may have a lagged effect on children’s weight outcomes, we test
associations between food prices at the previous wave and child BMI and overweight,
controlling for concurrent measures of child, maternal, and household characteristics. As shown
in Table 6, there is no evidence that food prices have a lagged effect on children’s weight
outcomes.
Insert Table 6 here.
Moderation Results
To test whether public food assistance receipt moderates associations between local food
prices and children’s BMI z-scores, overweight, food insecurity or eating habits, the OLS models
described above are run on first the subsample reporting receipt of any public food assistance
(food stamps, WIC, or school lunch/breakfast), and then on the subsample not receiving food
assistance. Results, shown in Table 7, indicate that among those children living in households
that receive food assistance, a $1 increase in local average fruit and vegetable prices is associated
with an increase of 0.52 (more than half a standard deviation) in children’s BMI z-scores; this
FOOD PRICES AND CHILD OVERWEIGHT AND FOOD INSECURITY 18
association is positive but small and non-significant among families not receiving food
assistance. Likewise, local average fast food prices are associated with an 8.5 percentage point
increase in the likelihood of being overweight among children in food assistance-receiving
families only. However, in models including interactions between food prices and public food
assistance receipt (run separately for fruit and vegetable and fast food prices), interactions were
not statistically significant, indicating that food assistance receipt does not exacerbate nor
mitigate the associations between food prices and child weight outcomes, food consumption, or
household food insecurity (results not shown; available from authors upon request).
Insert Table 7 here.
Sensitivity Analyses
While a rich set of explanatory variables is included, it is likely that the food price
estimates generated from Equation 1 are biased. To limit potential omitted variable bias, within-
child fixed effects (FE) models, described in Equation 2, were also estimated as sensitivity
analyses.
Yit – Yi. = β0it – β0i. + β1(FPit – FPi.) + β2(CMHit – CMHi.)+ β3(YEARit – YEARi.) +
εit – εi. (2)
FE models use within-child comparisons to examine how a child’s health at a specific time point
deviates from that same child’s average health measured across all time points, as predicted by
food prices at a single time point, from which is subtracted the average food prices across all
time points. Each variable in the equation is averaged over all data collection points for each
child (e.g., FPi., the average local food price across assessments across all data collection
points), and this average value is then subtracted from the value at a particular time point for that
specific child. As a result, all fixed (time-invariant) effects drop out of the model. Therefore,
FOOD PRICES AND CHILD OVERWEIGHT AND FOOD INSECURITY 19
only time-varying child, maternal, and household characteristics (e.g., child age) and the year of
data collection are included in the model. We exploit the variation in prices over time for each
child and the relatively large number of children in the ECLS-B who move to areas that vary in
local food prices. As required by FE models, there is substantial variation in the predictors and
outcomes. More than half (53%) of the sample moved to a different CBSA at least once from the
9 month to kindergarten entry waves. Inflation-adjusted average annual fruit and vegetable prices
changed by $0.03 to $0.09 each year (range: -0.09 to +0.03); inflation-adjusted average annual
fast food prices changed by $0.05 to $0.07 each year (range: -0.07 to +0.05). Children’s BMI z-
scores increased an average of 0.003 and 0.183 between each wave. As they grew older, children
decreased the number of times per week they ate healthy food items (-2.15 to -2.70 between each
wave) and the number of times they ate unhealthy food items remained similar across waves.
Results (not shown; available from authors upon request) show patterns similar to the
OLS models. A $1 increase in the average price of fruits and vegetables predicts a 0.46 increase
in a child’s BMI z-score, whereas a $1 increase in the price of fast food predicts a 15 percentage
point increase in a child’s likelihood of being overweight. As with the OLS models, there is no
evidence of a lagged effect of food prices on children’s weight outcomes. However, changes in
local food prices are related to changes in the likelihood of experiencing very low food security
(but not low or very low food security). A $1 increase in the average price of fruits and
vegetables predicts a 4 percentage point increase in the likelihood that a household experiences
very low food security. Changes in local food prices are not associated with changes in
children’s food consumption.
Discussion and Next Steps
The goal of this study was to estimate how local food prices influence the food insecurity,
FOOD PRICES AND CHILD OVERWEIGHT AND FOOD INSECURITY 20
obesity, and eating patterns of children from infancy to five years of age, and to understand how
participation in food assistance programs changes the relationship between food prices and
children’s weight outcomes, food insecurity, and eating patterns. In general, results suggest that
higher-priced foods are associated with higher BMI and rates of overweight among young
children, but, surprisingly, food prices seem largely unrelated to household food security and
parents’ reports of children’s eating habits.
Consistent with previous research using cross-sectional data or data on older populations
(Powell & Bao, 2009a; Powell, Han, & Chaloupka, 2010; Sturm & Datar, 2008), children living
in areas with higher-priced fruits and vegetables averaged higher measures of standardized BMI
scores, compared to their peers in areas with lower-priced fruits and vegetables. The magnitude
of this association is considerable; an increase of $1 in the average annual price of fruits and
vegetables is linked with an increase in children’s BMI z-scores of two-fifths of a standard
deviation. Likewise, within child FE models, which control for stable characteristics and provide
more conservative estimates, indicate that a $1 increase in the average annual price of fruits and
vegetables is linked with a half of a standard deviation increase in a child’s BMI z-scores.
However, given that inflation-adjusted fruit and vegetable prices averaged $1.68 (SD = 0.23;
range $1.08-$2.71), an increase of $1, or more than four standard deviations, would represent a
substantial increase in price. While this increase may be unlikely to occur within an area, the
range of prices across CBSAs suggests that residential moves may expose children to areas with
substantial variation in prices. Unfortunately, our sample of children who moved to different
CBSAs, with both their pre- and post-move residence having full food price data, was limited
(fewer than 300 children); however, future research should exploit residential moves as a means
for testing the relationship between food prices and child weight outcomes.
FOOD PRICES AND CHILD OVERWEIGHT AND FOOD INSECURITY 21
In contrast with our expectations, higher fast food prices were associated with an increase
in the likelihood of being overweight in both the OLS and FE models. This may be the result of
endogeniety; that is, fast food outlets may respond to increased demand or preferences for fast
food with higher prices. Indeed, while the literature on the relationship between fruit and
vegetable prices and child BMI is relatively consistent, the research on fast food prices and child
weight outcomes is more mixed. While some studies have found a negative association between
fast food prices and BMI or obesity among adolescents or adults (Han & Powell, 2011; Powell et
al., 2010), longitudinal analyses using fixed effects models find lower or non-significant
associations (Han & Powell, 2011; Powell, 2009; Powell & Bao, 2009b; Sturm & Datar, 2008).
In general, the literature suggests that the weight outcomes of adolescents and adults may be
sensitive to the prices of both healthy and fast foods, whereas the weight outcomes of young
children may be sensitive to healthy foods only (e.g., Powell & Bao, 2009). This may be because
children increase their fast food consumption as they age, and also begin to use their own money
to purchase foods when they are older. The weight outcomes of children across the age spectrum
may be affected by fruit and vegetable prices in that their parents make purchasing decisions on
foods consumed at home at least partially based on price. However, compared to previous
research, the data used in the current study were collected relatively recently (2001-08), and may
reflect a shift in this general age pattern. More research on this finding is needed.
Importantly, the relationships between food prices and children’s weight outcomes are
strong and present among the subsample receiving public food assistance. That is, among
children in households who receive SNAP, WIC, or school lunch or breakfast, there is a positive
relationship between fruit and vegetable prices and children’s BMI, and between fast food prices
and children’s likelihood of being overweight. Food prices are unassociated with weight
FOOD PRICES AND CHILD OVERWEIGHT AND FOOD INSECURITY 22
outcomes among children in households under 300% of FPL not receiving food assistance. It
may be that receipt of food assistance is an indicator of nutritional need; whereas non-receiving
households have access to other support systems or family members that help provide food,
those who turn to public assistance do not, and these families may be more sensitive to prices.
Indeed, previous research indicates that low-income adolescents’ weight outcomes are more
sensitive to the prices of fruits and vegetables and fast foods than their higher-income
counterparts (Powell & Bao, 2009a; Powell & Chaloupka, 2009; Sturm & Datar, 2005). In
addition, it is possible that the Food Stamp Program (currently SNAP), the largest public food
assistance program in the U.S., is not adequately indexed to the local cost of living, and families
have to purchase less expensive, nutritionally low-quality foods in areas with high food prices.
However, it is important to note that, among our subsample of those with family incomes below
300% of FPL, the associations between food prices and child weight outcomes, eating habits,
and household food insecurity did not statistically differ between households receiving food
assistance and those who did not. Additional research and specification of public food assistance
is required.
Surprisingly, the mechanism through which food prices are expected to affect children’s
BMI and overweight status, their food consumption, was unassociated with food prices. This was
true for the composite measures of eating habits (healthy and unhealthy foods) and the individual
measures of fruit, vegetable, and fast food consumption. The use of parents’ reports of children’s
food consumption across the previous 7 days is a major limitation to these analyses. Parents,
particularly those who are employed, may not be aware of what their children are eating, and the
recall of foods eaten over the last week is subject to memory loss. Further, children’s food
consumption questions were administered at preschool and kindergarten entry only. Future
FOOD PRICES AND CHILD OVERWEIGHT AND FOOD INSECURITY 23
research should incorporate more refined measures of children’s food consumption, such as daily
diaries, and test whether nutrition is a mediating factor between fruit and vegetable prices and
children’s BMI and overweight.
Also in contrast with expectations, local food prices were largely unrelated to household-
level food insecurity, with one exception; in the FE models, an increase in local average fruit and
vegetable prices is associated with a small increase in the likelihood that the household
experiences very low food security. Although low-income families’ inability to afford food is the
premise underlying our public food assistance system, there has been very little research
examining local food prices and food insecurity, particularly among young children. It may be
that the variability in food prices across time and CBSAs is too limited to reveal associations
between food prices and food insecurity. Alternatively, our specifications of categorical food
security at the household level (as opposed to scores or security at the child and adult level) may
mask associations. Further, CBSAs may represent too large of a geographic area for capturing
local food prices, and thus, our CBSA-level food price data are not adequate for capturing
associations between local food prices and household food insecurity.
These preliminary results provide several avenues for further research. First, models
estimating associations between food prices and food insecurity using different specifications of
food security (child-, adult-, and household-level scores and categorical measures, including
marginal food security) will be tested. Secondly, as with the BMI and overweight outcomes, it
may be that food prices are significantly related to food insecurity and food consumption among
children in families receiving public food assistance only; the moderating effect of food
assistance on food security and children’s eating habits will be tested. Finally, different
specifications for food assistance, separating food stamps, WIC, and school lunch/breakfast
FOOD PRICES AND CHILD OVERWEIGHT AND FOOD INSECURITY 24
receipt, will be tested. Whereas WIC and the National School Lunch and Breakfast Programs
provide foods or packages, SNAP provides vouchers with which recipients purchase food.
Because of this flexibility and limited budget, they may be purchasing less healthy foods in areas
where fruits and vegetables are expensive, operating differently than WIC or school
lunch/breakfast receipt. Finally, we will estimate models with different specifications of the food
price variables including each food price index relative to the overall food price variable.
FOOD PRICES AND CHILD OVERWEIGHT AND FOOD INSECURITY 25
References
Alaimo, K., Olson, C. M., Fongillo, E. A., & Briefel, R. R. (2001). Food insufficiency, family
income, and health in U.S. preschool adn school-aged children. American Journal of
Public Health, 91(5), 781-786.
Bartfeld, J. S., & Ahn, H. M. (2011). The School Breakfast Program Strengthens Household
Food Security among Low Income Households with Elementary School Children.
Journal of Nutrition, 141(3), 470-475.
Bickel, G., Nord, M., Price, C., Hamilton, W., & Cook, J. (2000). Guide to Measuring
Household Food Security Revised 2000. VA: USDA, FNS.
Bradley, R., Houts, R., Nader, P., O'Brien, M., Belsky, J., Crosnoe, R., & Network, N. E. C. C.
R. (2008). Body Mass Index and its relation to internalizing and externalizing problems
from infancy through middle childhood. The Journal of Pediatrics, 153(5), 629-634.
Cawley, J. (2010). The economics of childhood obesity. Health Affairs, 29(3), 364-371.
Crosnoe, R., & Muller, C. (2004). Body mass index, academic achievement and school context:
Examining the educational experiences of adolescents at risk of obesity. Journal of
Health and Social Behavior, 45, 393-407.
Drewnoski, A. (2004). Obesity and the food environment: Dietary energy density and diet costs.
American Journal of Preventive Medicine, 27(3S), 154-162.
Drewnoski, A., Darmon, N., & Briend, A. (2004). Replacing fats and sweets with vegetables and
fruit—a question of cost. American Journal of Public Health, 94, 1555-1559.
Dunifon, R., & Kowaleski-Jones, L. (2003). The influences of participation in the National
School Lunch Program and food insecurity on child well-being. Social Service Review,
77(1), 72-92.
FOOD PRICES AND CHILD OVERWEIGHT AND FOOD INSECURITY 26
Epstein, L. H., Handley, E. A., Dearing, K. K., Cho, D. D., Roemmich, J. N., & Paluch, R. A., et
al. (2006). Purchases of food in youth: Influence of price and income. Psychological
Science, 17(1), 82-89.
Fox, M. K., Hamilton, W., & Lin, B.-H. (2004). Effects of food assistance and nutrition
programs on nutrition and health Food Assistance and Nutrition Research Program.
Washington, DC: Economic Research Service, U.S. Department of Agriculture.
Han, E., & Powell, L. (2011). Effect of food prices on the prevalence of obesity among young
adults. Public Health, 125, 129-135.
Hofferth, S., & Curtin, S. (2005). Poverty, food programs, and childhood obesity. Journal of
Policy Analysis and Management, 24(4), 703-726.
IOM. (2005). Preventing Childhood Obesity: Health in the Balance. Washington, DC: Institute
of Medicine, National Academies Press.
Jones, S. J., Jahns, L., Laraia, B. A., & Haughton, B. (2003). Lower risk of overweight in school-
age food insecure girls who participate in food assistance. Archives of Pediatric and
Adolescent Medcine, 157, 780-784.
Kimbro, R., & Rigby, E. (2010). Federal food policy and childhood obesity: A solution or part of
the problem? Health Affairs, 29(3), 411-428.
Kuczmarski, R. J., Ogden, C. L., Guo, S. S., Grummer-Strawn, L. M., Flegal, K. M., Mei, Z., . . .
Johnson, C. L. (2002). 2000 CDC Growth Charts for the United States: Methods and
development. Vital Health Statistics, 11, 1-190.
Liu, J., Bennet, K. J., Harun, N., Zheng, X., Probst, J. C., & Pate, R. R. (2007). Overweight and
physical inactivity among rural children aged 10-17: A national and state portrait.
Columbia, SC: South Carolina Rural Health Research Center.
FOOD PRICES AND CHILD OVERWEIGHT AND FOOD INSECURITY 27
Monsivais, P., & Drewnowski, A. (2007). The rising cost of low-energy-density foods. Journal
of the American Dietetic Association, 107(12), 2071-2076.
Monsivais, P., Mclain, J., & Drewnowski, A. (2010). The rising disparity in the price of healthful
foods: 2004–2008. Food Policy, 35(6), 514-520.
Nord, M., Andrews, M., & Carlson, S. (2009). Household food security in the U.S., 2008.
Washington, DC: U.S. Department of Agriculture, Economic Research Service.
Nord, M., Coleman-Jensen, A., Andrews, M., & Carlson, S. (2010). Household food security in
the United States, 2009. Washington, DC: Economic Research Service, U.S. Department
of Agriculture.
Ogden, C. L., Carroll, M. D., Kit, B. K., & Flegal, K. M. (2012). Prevalence of Obesity and
Trends in Body Mass Index Among US Children and Adolescents, 1999-2010. JAMA:
The Journal of the American Medical Association, 307(5), 483-490. doi:
10.1001/jama.2012.40
Oliveira, V. (2010). The Food Assistance Landscape: FY 2009 Annual Report Economic
Information Bulletin No. 6-7. Washington, DC U.S. Department of Agriculture,
Economic Research Service.
Powell, L. (2009). Fast food costs and adolescent body mass index: Evidence from panel data.
Journal of Health Economics, 28(5), 963-970. doi: 10.1016/j.jhealeco.2009.06.009
Powell, L., & Bao, Y. (2009a). Food prices, access to food outlets and child weight. Economics
and Human Biology, 7(1), 64-72.
Powell, L., & Bao, Y. (2009b). Food prices, access to food outlets and children's weight.
Economics and Human Biology, 7, 64-72.
FOOD PRICES AND CHILD OVERWEIGHT AND FOOD INSECURITY 28
Powell, L., & Chaloupka, F. J. (2009). Food prices and obesity: Evidence and policy
implications for taxes and subsidies. Milbank Quarterly, 87(1), 229-257.
Powell, L., & Chaloupka, F. J. (2010). Economic contextual factors and child body mass index.
NBER volume on Economic Aspects of Obesity. National Bureau of Economic Research.
Cambridge, MA. Retrieved from http://www.nber.org/chapters/c11818.pdf
Powell, L., Han, E., & Chaloupka, F. J. (2010). Economic Contextual Factors, Food
Consumption, and Obesity among U.S. Adolescents. The Journal of Nutrition, 140(6),
1175-1180. doi: 10.3945/jn.109.111526
Rank, M. R., & Hirschl, T. A. (2009). Estimating the risk of food stamp use and impoverishment
during childhood. Archives of Pediatric and Adolescent Medcine, 163(11), 994-999.
Rose, D. (2010). Access to healthy food: A key focus for research on domestic food insecurity.
Journal of Nutrition, 140(6), 1167-1169.
Rose, D., Habicht, J., & Devaney, B. (1998). Household participation in the Food Stamp and
WIC Programs increase the nutritient intakes of preschool children. Journal of Nutrition,
128(3), 548-555.
Schmeiser, M. D. (2012). The impact of long-term participation in the supplemental nutrition
assistance program on child obesity. Health Economics, 21(4), 386-404. doi:
10.1002/hec.1714
Skalicky, A., Meyers, A. F., Adams, W. G., Yang, Z., Cook, J. T., & Frank, D. A. (2006). Food
insecurity and iron deficiency in anemia in low-income infants and toddlers in the United
States. Maternal and Child Health Journal, 10(2), 177-185.
Slack, K. S., & Yoo, J. (2005). Food hardship and child behavior problems among low-income
children. Social Service Review, 79, 511-536.
FOOD PRICES AND CHILD OVERWEIGHT AND FOOD INSECURITY 29
Sturm, R. (2002). The effects of obesity, smoking, and drinking on medical problems and costs.
Health Affairs, 21, 241-253.
Sturm, R., & Datar, A. (2005). Body mass index in elementary school children, metropolitan
area food prices and food outlet density. Public Health, 119(12), 1059-1068.
Sturm, R., & Datar, A. (2008). Food prices and weight gain during elementary school: 5-year
update. Public Health, 122(11), 1140-1143. doi: 10.1016/j.puhe.2008.04.001
USDA. (2007). Thrifty Food Plan, 2006. Washington, DC: Center for Nutrition Policy and
Promotion, U.S. Department of Agriculture.
USDA. (2011). WIC Program Participation and Costs, from
http://www.fns.usda.gov/pd/wisummary.htm
Wilde, P. E. (2007). Measuring the effect of Food Stamps on food insecurity and hunger:
Research and policy considerations. Journal of Nutrition, 137, 307-310.
Yen, S., Andrews, M., Chen, Z., & Eastwood, D. (2008). Food Stamp Program Participation and
Food Insecurity: An Instrumental Variables Approach. American Journal of Agricultural
Economics, 90(1), 117-132.
Zaslow, M., Bronte-Tinkew, J., Capps, R., Horowitz, A., Moore, K. A., & Weinstein, D. (2009).
Food insecurity during infancy: Implications for attachment and mental proficiency in
toddlerhood. Maternal and Child Health Journal, 13(1), 66-80.
FOOD PRICES AND CHILD OVERWEIGHT AND FOOD INSECURITY 30
Table 1. Descriptive Statistics of Analysis Sample Compared to Excluded Observations under
300% of the Federal Poverty Line
Variable
Analysis
Sample
Excluded
Observations
Dependent variables1
BMI z score ** 0.489 0.568
Child is overweight* 31.9% 34.3%
Number of times child ate healthy food in past 7 days 45.692 45.578
Number of times child ate unhealthy food in past 7 days 32.753 33.308
Household has low or very low food security* 17.7% 16.4%
Household has very low food security 3.9% 3.5%
Covariates
Multiple birth 15.9% 14.3%
Child age (months)*** 35.457 37.038
Male 51.1% 50.5%
White, non-Hispanic 34.6% 34.3%
Black, non-Hispanic 21.5% 20.6%
Hispanic 26.0% 24.9%
Other Race, non-Hispanic** 17.9% 20.2%
Household is below the federal poverty line (FPL) *** 35.9% 38.9%
Household is between 100% and 185% of the FPL 34.2% 34.6%
Household is between 185% and 300% of the FPL*** 29.9% 26.5%
Number of children in the household 2.606 2.573
Number of adults in the household 2.133 2.166
Mother is not working 48.8% 49.0%
Mother is employed part time 17.9% 16.8%
Mother is employed full time 33.4% 34.2%
Child's birthweight (kg) 2.885 2.877
Mother's pre-pregnancy weight (kg) 67.515 66.937
Parent has no high school degree2 18.3% 19.5%
Parent has a high school degree, but no bachelor’s degree2 64.7% 65.8%
Parent has at least a bachelor’s degree2
** 17.1% 14.7%
Family lives in the Northeast*** 5.7% 17.3%
Family lives in the Midwest*** 20.6% 25.0%
Family lives in the South*** 42.3% 35.3%
Family lives in the West*** 31.4% 22.3%
Wave 1*** 31.3% 28.0%
FOOD PRICES AND CHILD OVERWEIGHT AND FOOD INSECURITY 31
Wave 2 25.4% 25.7%
Wave 3*** 22.0% 23.6%
Wave 4* 16.8% 17.6%
Wave 5 4.6% 5.1%
Number of observations 10,450 13,800 1 The number of observations varies by dependent variable.
2 Determined as of Wave 1.
***p < 0.001, ** p < 0.01, * p < 0.05
FOOD PRICES AND CHILD OVERWEIGHT AND FOOD INSECURITY 32
Table 2. Food Consumption Questionnaire (FCQ) Subset Questions Used to Generate Eating
Habits Indices.
Healthy Eating Habits
Question Response and Score
“During the past 7 days, how many
times did your child drink milk?”
4 or more times a day = 28 times per week
3 times a day = 21
Twice a day = 14
Once a day = 7
4 to 6 times during the past 7 days = 5
1 to 3 times during the past 7 days = 2
Child did not drink milk during past 7 days = 0
“During the past 7 days, how many
times did your child drink 100% fruit
juices such as orange juice, apple juice,
or grape juice? Do not count punch,
Sunny Delight, Kool-Aid, sports drinks,
or other fruit-flavored drinks.”
4 or more times a day = 28 times per week
3 times a day = 21
Twice a day = 14
Once a day = 7
4 to 6 times during the past 7 days = 5
1 to 3 times during the past 7 days = 2
Child did not drink 100% fruit juice during past 7 days
= 0
“During the past 7 days, how many
times did your child eat fresh fruit, such
as apples, bananas, oranges, berries or
other fruit such as applesauce, canned
peaches, canned fruit cocktail, frozen
berries, or dried fruit? Do not count
fruit juice.”
4 or more times a day = 28 times per week
3 times a day = 21
Twice a day = 14
Once a day = 7
4 to 6 times during the past 7 days = 5
1 to 3 times during the past 7 days = 2
Child did not eat fruit during past 7 days = 0
“During the past 7 days, how many
times did your child eat vegetables
other than french fries and other fried
potatoes? Include vegetables like those
served as a stir fry, soup, or stew, in
your response.”
4 or more times a day = 28 times per week
3 times a day = 21
Twice a day = 14
Once a day = 7
4 to 6 times during the past 7 days = 5
1 to 3 times during the past 7 days = 2
Child did not eat vegetables during past 7 days = 0
Possible range of scores on Healthy
Eating Habits Index
0 – 112 times per week
Unhealthy Eating habits
“During the past 7 days, how many
times did your child drink soda pop (for
example, Coke, Pepsi, or Mountain
Dew), sports drinks (for example,
Gatorade), or fruit drinks that are not
4 or more times a day = 28 times per week
3 times a day = 21
Twice a day = 14
Once a day = 7
4 to 6 times during the past 7 days = 5
FOOD PRICES AND CHILD OVERWEIGHT AND FOOD INSECURITY 33
100% fruit juice (for example, Kool-
Aid, Sunny Delight, Hi-C, Fruitopia, or
Fruitworks)?”
1 to 3 times during the past 7 days = 2
Child did not drink soda or fruit drinks during past 7
days = 0
“During the past 7 days, how many
times did your child eat a meal or snack
from a fast food restaurant with no wait
service such as McDonald’s, Pizza Hut,
Burger King, Kentucky Fried Chicken,
Taco Bell, Wendy’s and so on?
Consider both eating out, carry out, and
delivery of meals in your response.”
4 or more times a day = 28 times per week
3 times a day = 21
Twice a day = 14
Once a day = 7
4 to 6 times during the past 7 days = 5
1 to 3 times during the past 7 days = 2
Child did not eat from a fast food restaurant during
past 7 days = 0
“During the past 7 days, how many
times did your child eat candy
(including Fruit Roll-Ups and similar
items), ice cream, cookies, cakes,
brownies, or other sweets?”
4 or more times a day = 28 times per week
3 times a day = 21
Twice a day = 14
Once a day = 7
4 to 6 times during the past 7 days = 5
1 to 3 times during the past 7 days = 2
Child did not eat any sweets during past 7 days = 0
“During the past 7 days, how many
times did your child eat potato chips,
corn chips such as Fritos or Doritos,
Cheetos, pretzels, popcorn, crackers or
other salty snack foods?”
4 or more times a day = 28 times per week
3 times a day = 21
Twice a day = 14
Once a day = 7
4 to 6 times during the past 7 days = 5
1 to 3 times during the past 7 days = 2
Child did not eat any salty snacks during past 7 days =
0
Possible range of scores on Unhealthy
Eating Habits Index
0 – 112 times per week
FOOD PRICES AND CHILD OVERWEIGHT AND FOOD INSECURITY 34
Table 3. Analysis Sample Descriptive Statistics.
Variable
Valid
Overweight
Indicator
Not
Overweight Overweight
Valid
Food
Security
Status
Indicator
Household
is Food
Secure
Household
Has Low
or Very
Low Food
Security
Valid
Eating
Habits
Values
Dependent variables1
BMI z score 0.488 -0.143 1.836*** 0.489 0.486 0.501 0.529
Child is overweight 31.9% 0% 100% 31.9% 31.7% 33.1% 32.8%
# Times child ate healthy food
in past 7 days 45.773 45.742 45.837 45.692 45.660 45.828 45.685
# Times child ate unhealthy
food in past 7 days 32.839 32.375 33.788** 32.753 32.619 33.321 32.766
Household has low or very low
food security 18.2% 17.9% 18.9% 17.7% 0.0% 100%*** 19.1%
Household has very low food
security 4.2% 4.0% 4.8% 3.9% 0.0% 21.8%*** 4.4%
Independent variables
Fruit and vegetable average
price ($) 1.679 1.674 1.689 1.727 1.731 1.710** 1.669
Fast food average price ($) 5.655 5.636 5.696*** 5.712 5.711 5.716 5.634
Lagged fruit and vegetable
average price ($) 1.703 1.702 1.705 1.721 1.724 1.704* 1.673
Lagged fast food average price
($) 5.690 5.678 5.716* 5.704 5.703 5.706 5.660
Covariates
General Cost of Living Index 101.511 101.168 102.243* 101.544 101.629 101.148 101.519
Multiple birth 15.9% 16.3% 15.0% 15.9% 15.7% 16.8% 16.6%
FOOD PRICES AND CHILD OVERWEIGHT AND FOOD INSECURITY 35
Child age (months) 51.222 50.859 51.997* 35.457 35.277 36.290 59.893
Male 51.1% 49.7% 54.2%* 51.1% 50.7% 52.6% 51.1%
White, non-Hispanic 32.9% 34.7% 29.0%*** 34.6% 36.1% 27.8%*** 32.3%
Black, non-Hispanic 22.3% 22.0% 23.0% 21.5% 21.2% 22.9% 22.7%
Hispanic 26.8% 25.8% 28.9% 26.0% 24.6% 32.2%*** 27.6%
Other Race, non-Hispanic 18.0% 17.5% 19.0% 17.9% 18.1% 17.1% 17.3%
Household is below the federal
poverty line 36.8% 35.1% 40.4%*** 35.9% 30.8% 59.9%*** 37.4%
Household is between 100%
and 185% of the federal
poverty line (FPL) 33.9% 34.0% 33.8% 34.2% 34.5% 32.4% 34.6%
Household is between 185%
and 300% of the FPL 29.3% 31.0% 25.8%*** 29.9% 34.7% 7.7%*** 28.0%
Number of children in the
household 2.703 2.756 2.591*** 2.606 2.582 2.717** 2.749
Number of adults in the
household 2.095 2.083 2.119 2.133 2.160 2.006*** 2.062
Mother is not working 44.1% 45.3% 41.6%* 0.488 0.477 0.537*** 0.431
Mother is employed part time 17.8% 18.7% 16.1%* 0.179 0.183 0.159* 0.181
Mother is employed full time 38.1% 36.1% 42.3%*** 0.334 0.340 0.304** 0.388
Child's birthweight (kg) 2.882 2.780 3.101*** 2.885 2.882 2.902 2.874
Mother's pre-pregnancy weight
(kg) 67.626 65.760 71.607*** 67.515 67.097 69.454*** 67.936
Parent has no high school
degree** 0.186 0.181 0.195 0.183 0.161 0.282*** 0.187
Parent has a high school
degree, but no bachelor’s
degree2 65.3% 63.8% 68.6%** 64.7% 64.6% 64.9% 65.1%
Parent has at least a bachelor’s
degree2 16.1% 18.1% 11.9%*** 17.1% 19.2% 0.070*** 16.2%
FOOD PRICES AND CHILD OVERWEIGHT AND FOOD INSECURITY 36
Family lives in the Northeast 6.3% 5.9% 7.1% 5.7% 5.8% 5.0% 6.8%
Family lives in the Midwest 19.9% 20.2% 19.3% 20.6% 20.2% 22.3% 19.4%
Family lives in the South 41.9% 42.7% 40.2% 42.3% 42.9% 0.393* 43.0%
Family lives in the West 31.9% 31.2% 33.4% 31.4% 31.0% 33.4% 30.8%
Wave 1 0.0% 0.0% 0.0% 31.3% 30.9% 32.7% 0.0%
Wave 2 24.9% 25.9% 22.8%** 25.4% 26.4% 0.205*** 0.0%
Wave 3 37.9% 37.4% 39.1% 22.0% 21.3% 0.252*** 50.6%
Wave 4 29.1% 28.7% 30.1% 16.8% 16.7% 17.2% 38.7%
Wave 5 8.1% 8.1% 8.0% 4.6% 4.7% 4.4% 10.7%
Number of observations 5,950 4,050 1,900 10,450 8,600 1,850 4,500
Note: Observations have valid ACCRA data and have income below 300% of the federal poverty line.
1 Number of observations varies by dependent variable.
2 Determined as of Wave 1.
*** p < 0.001, ** p < 0.01, * p < 0.05 indicate statistically significant difference between observations considered overweight and not
overweight, or as having low (or very low) food security or being food secure.
FOOD PRICES AND CHILD OVERWEIGHT AND FOOD INSECURITY 37
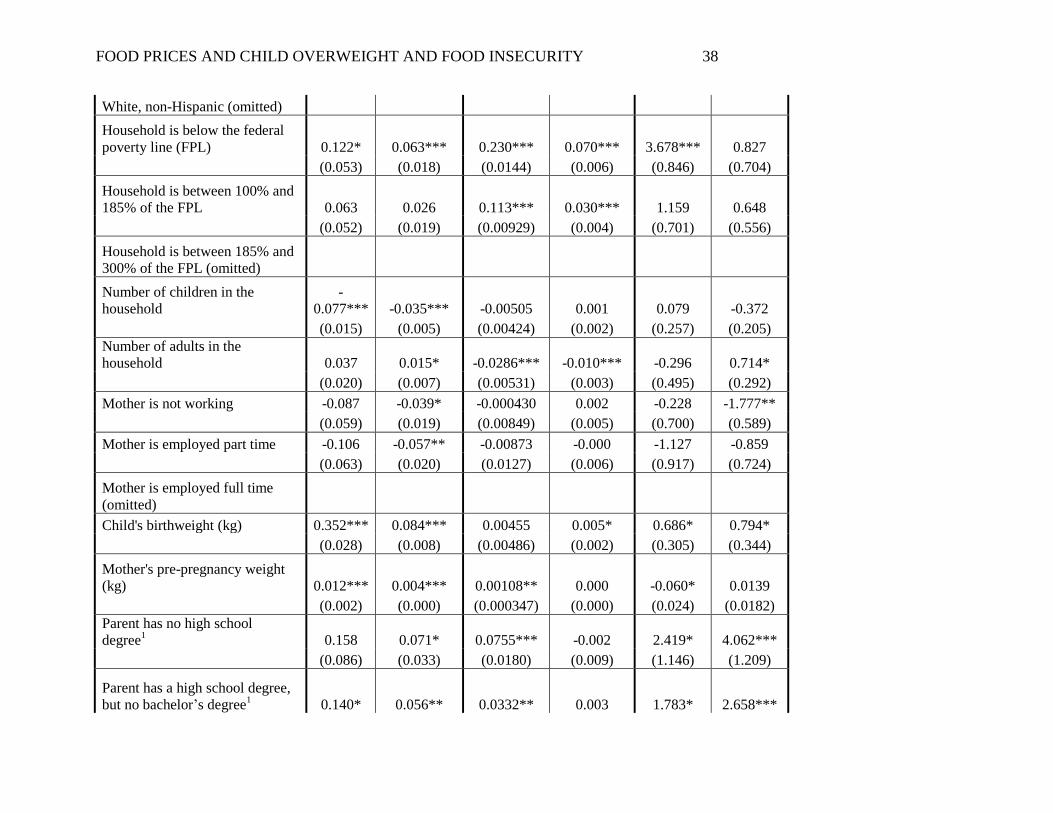
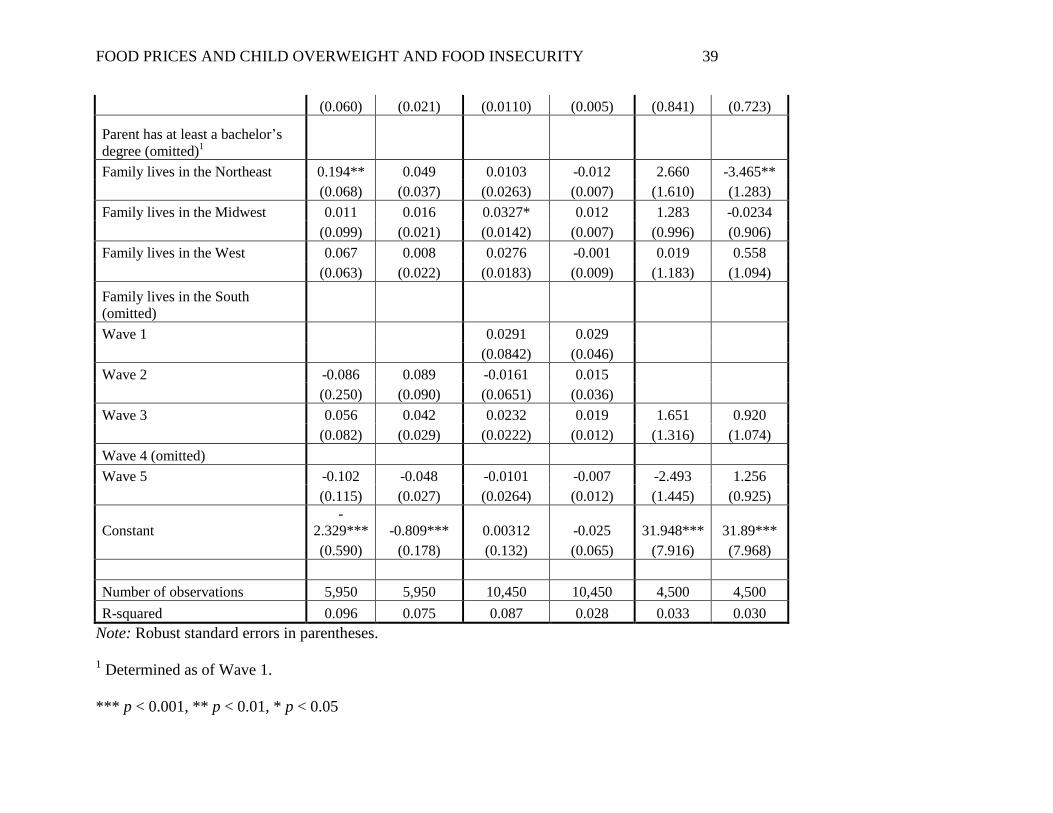
Table 4. Predicting child BMI z-score, overweight, food security, and eating habits from food prices.
Weight Food Security Eating Habits
Model 1 Model 2 Model 3 Model 4 Model 5 Model 6
BMI
z score Overweight
Household
has low or
very low
food
security
Household
has very
low food
security
# Times
child ate
healthy
food in
past 7
days
# Times
child ate
unhealthy
food in
past 7
days
Fruit and vegetable average price
($) 0.414* 0.057 -0.0350 0.018 -1.785 4.008
(0.164) (0.048) (0.0358) (0.015) (2.298) (2.122)
Fast food average price ($) 0.099 0.068** 0.0104 -0.003 1.231 -0.214
(0.081) (0.023) (0.0169) (0.009) (0.959) (0.956)
Overall cost of living index -0.005 -0.001 -0.000363 -0.000 0.081* -0.0999**
(0.003) (0.001) (0.000918) (0.000) (0.038) (0.0383)
Multiple birth 0.170* 0.067** 0.0198 0.011 1.341 -0.825
(0.081) (0.023) (0.0212) (0.012) (1.055) (1.212)
Child age (months) 0.002 0.003 0.000246 0.001 -0.006 -0.0204
(0.006) (0.002) (0.00153) (0.001) (0.100) (0.0756)
Male 0.081 0.024 0.0104 -0.000 -1.287* 1.073*
(0.044) (0.014) (0.0102) (0.004) (0.582) (0.527)
Black, non-Hispanic -0.042 0.022 -0.0291 -0.016* 1.275 0.901
(0.080) (0.027) (0.0162) (0.008) (0.968) (0.938)
Hispanic 0.105 0.042 0.0265 0.002 2.119 -0.336
(0.068) (0.024) (0.0177) (0.008) (1.208) (0.738)
Other Race, non-Hispanic -0.006 0.030 0.00906 0.003 -0.981 -0.524
(0.080) (0.026) (0.0159) (0.008) (1.164) (0.756)
FOOD PRICES AND CHILD OVERWEIGHT AND FOOD INSECURITY 38
White, non-Hispanic (omitted)
Household is below the federal
poverty line (FPL) 0.122* 0.063*** 0.230*** 0.070*** 3.678*** 0.827
(0.053) (0.018) (0.0144) (0.006) (0.846) (0.704)
Household is between 100% and
185% of the FPL 0.063 0.026 0.113*** 0.030*** 1.159 0.648
(0.052) (0.019) (0.00929) (0.004) (0.701) (0.556)
Household is between 185% and
300% of the FPL (omitted)
Number of children in the
household
-
0.077*** -0.035*** -0.00505 0.001 0.079 -0.372
(0.015) (0.005) (0.00424) (0.002) (0.257) (0.205)
Number of adults in the
household 0.037 0.015* -0.0286*** -0.010*** -0.296 0.714*
(0.020) (0.007) (0.00531) (0.003) (0.495) (0.292)
Mother is not working -0.087 -0.039* -0.000430 0.002 -0.228 -1.777**
(0.059) (0.019) (0.00849) (0.005) (0.700) (0.589)
Mother is employed part time -0.106 -0.057** -0.00873 -0.000 -1.127 -0.859
(0.063) (0.020) (0.0127) (0.006) (0.917) (0.724)
Mother is employed full time
(omitted)
Child's birthweight (kg) 0.352*** 0.084*** 0.00455 0.005* 0.686* 0.794*
(0.028) (0.008) (0.00486) (0.002) (0.305) (0.344)
Mother's pre-pregnancy weight
(kg) 0.012*** 0.004*** 0.00108** 0.000 -0.060* 0.0139
(0.002) (0.000) (0.000347) (0.000) (0.024) (0.0182)
Parent has no high school
degree1 0.158 0.071* 0.0755*** -0.002 2.419* 4.062***
(0.086) (0.033) (0.0180) (0.009) (1.146) (1.209)
Parent has a high school degree,
but no bachelor’s degree1 0.140* 0.056** 0.0332** 0.003 1.783* 2.658***
FOOD PRICES AND CHILD OVERWEIGHT AND FOOD INSECURITY 39
(0.060) (0.021) (0.0110) (0.005) (0.841) (0.723)
Parent has at least a bachelor’s
degree (omitted)1
Family lives in the Northeast 0.194** 0.049 0.0103 -0.012 2.660 -3.465**
(0.068) (0.037) (0.0263) (0.007) (1.610) (1.283)
Family lives in the Midwest 0.011 0.016 0.0327* 0.012 1.283 -0.0234
(0.099) (0.021) (0.0142) (0.007) (0.996) (0.906)
Family lives in the West 0.067 0.008 0.0276 -0.001 0.019 0.558
(0.063) (0.022) (0.0183) (0.009) (1.183) (1.094)
Family lives in the South
(omitted)
Wave 1 0.0291 0.029
(0.0842) (0.046)
Wave 2 -0.086 0.089 -0.0161 0.015
(0.250) (0.090) (0.0651) (0.036)
Wave 3 0.056 0.042 0.0232 0.019 1.651 0.920
(0.082) (0.029) (0.0222) (0.012) (1.316) (1.074)
Wave 4 (omitted)
Wave 5 -0.102 -0.048 -0.0101 -0.007 -2.493 1.256
(0.115) (0.027) (0.0264) (0.012) (1.445) (0.925)
Constant
-
2.329*** -0.809*** 0.00312 -0.025 31.948*** 31.89***
(0.590) (0.178) (0.132) (0.065) (7.916) (7.968)
Number of observations 5,950 5,950 10,450 10,450 4,500 4,500
R-squared 0.096 0.075 0.087 0.028 0.033 0.030
Note: Robust standard errors in parentheses.
1 Determined as of Wave 1.
*** p < 0.001, ** p < 0.01, * p < 0.05
FOOD PRICES AND CHILD OVERWEIGHT AND FOOD INSECURITY 40
Table 5. Predicting child BMI z-score and overweight from fruit and vegetable and fast food
prices in separate models.
Fruit and vegetable
average price ($) only
Fast food average
price ($) only
Model 1 Model 2 Model 3 Model 4
BMI
z score Overweight
BMI
z score Overweight
Fruit and vegetable average price ($) 0.436* 0.072
(0.169) (0.050)
Fast food average price ($) 0.117 0.070**
(0.087) (0.024)
Overall cost of living index -0.003 -0.000 0.000 -0.000
(0.002) (0.001) (0.002) (0.001)
Multiple birth 0.169* 0.066** 0.169* 0.067**
(0.082) (0.023) (0.081) (0.023)
Child age (months) 0.001 0.003 0.003 0.003
(0.006) (0.002) (0.006) (0.002)
Male 0.080 0.023 0.080 0.024
(0.044) (0.014) (0.044) (0.014)
Black, non-Hispanic -0.052 0.016 -0.021 0.025
(0.080) (0.026) (0.080) (0.027)
Hispanic 0.094 0.034 0.086 0.040
(0.068) (0.023) (0.067) (0.024)
Other Race, non-Hispanic -0.004 0.031 -0.013 0.029
(0.079) (0.026) (0.080) (0.026)
White, non-Hispanic (omitted)
Household is below the federal poverty
line (FPL) 0.125* 0.065*** 0.120* 0.062***
(0.054) (0.018) (0.053) (0.018)
Household is between 100% and 185%
of the FPL 0.065 0.027 0.060 0.025
(0.052) (0.019) (0.051) (0.019)
Household is between 185% and 300%
of the FPL (omitted)
Number of children in the household -0.077*** -0.035*** -0.079*** -0.035***
(0.015) (0.006) (0.015) (0.006)
Number of adults in the household 0.036 0.014 0.036 0.015*
(0.020) (0.007) (0.021) (0.007)
FOOD PRICES AND CHILD OVERWEIGHT AND FOOD INSECURITY 41
Mother is not working -0.088 -0.040* -0.089 -0.040*
(0.059) (0.019) (0.060) (0.019)
Mother is employed part time -0.107 -0.058** -0.103 -0.057**
(0.063) (0.020) (0.064) (0.020)
Mother is employed full time (omitted)
Child's birthweight (kg) 0.353*** 0.085*** 0.348*** 0.083***
(0.028) (0.008) (0.028) (0.008)
Mother's prepregnancy weight (kg) 0.012*** 0.004*** 0.012*** 0.004***
(0.002) (0.000) (0.002) (0.000)
Parent has no highschool degree1 0.162 0.074* 0.160 0.071*
(0.087) (0.033) (0.086) (0.033)
Parent has a highschool degree, but no
bachelors degree1 0.144* 0.058** 0.143* 0.056**
(0.060) (0.021) (0.060) (0.021)
Parent has at least a bachelors degree
(omitted)1
Household lives in the northeast 0.190** 0.046 0.200** 0.050
(0.071) (0.039) (0.062) (0.037)
Household lives in the midwest 0.012 0.017 -0.038 0.010
(0.101) (0.022) (0.102) (0.022)
Household lives in the west 0.072 0.011 0.017 0.001
(0.064) (0.022) (0.060) (0.022)
Household lives in the south (omitted)
Wave 1
Wave 2 -0.098 0.081 -0.057 0.093
(0.255) (0.091) (0.252) (0.090)
Wave 3 0.055 0.041 0.034 0.039
(0.083) (0.030) (0.080) (0.029)
Wave 4 (omitted) -0.095 -0.047
Wave 5 -0.090 -0.040 (0.112) (0.027)
(0.115) (0.028)
Constant -1.932*** -0.538** -2.196*** -0.791***
(0.534) (0.173) (0.604) (0.182)
Observations 5,950 5,950 5,950 5,950
R-squared 0.096 0.073 0.094 0.075
Note: Robust standard errors in parentheses.
1 Determined as of Wave 1.
*** p < 0.001, ** p < 0.01, * p < 0.05
FOOD PRICES AND CHILD OVERWEIGHT AND FOOD INSECURITY 42
Table 6. Predicting child BMI z-score and overweight from lagged food prices.
Model 1 Model 2
BMI
z score Overweight
Lagged fruit and vegetable average price ($) 0.227 -0.011
(0.156) (0.045)
Lagged fast food average price ($) 0.143 0.049
(0.083) (0.027)
Overall cost of living index -0.002 -0.000
(0.002) (0.001)
Multiple birth 0.184* 0.074**
(0.092) (0.027)
Child age (months) 0.003 0.004
(0.007) (0.002)
Male 0.075 0.019
(0.045) (0.015)
Black, non-Hispanic -0.010 0.033
(0.090) (0.031)
Hispanic 0.127 0.042
(0.073) (0.026)
Other Race, non-Hispanic -0.011 0.033
(0.091) (0.029)
White, non-Hispanic (omitted)
Household is below the federal poverty line 0.095 0.054**
(0.057) (0.018)
Household is between 100% and 185% of the
federal poverty line 0.053 0.022
(0.055) (0.020)
Household is between 185% and 300% of the
federal poverty line (omitted)
Number of children in the household -0.072*** -0.033***
(0.016) (0.006)
Number of adults in the household 0.051* 0.019*
(0.023) (0.008)
Mother is not working -0.087 -0.038*
(0.062) (0.019)
Mother is employed part time -0.070 -0.042*
(0.065) (0.019)
Mother is employed full time (omitted)
FOOD PRICES AND CHILD OVERWEIGHT AND FOOD INSECURITY 43
Child's birthweight (kg) 0.337*** 0.079***
(0.032) (0.009)
Mother's pre-pregnancy weight (kg) 0.012*** 0.004***
(0.002) (0.001)
Parent has no high school degree1 0.158 0.071*
(0.090) (0.035)
Parent has a high school degree, but no
bachelor’s degree1 0.155* 0.063**
(0.061) (0.022)
Parent has at least a bachelor’s degree
(omitted)1
Family lives in the Northeast 0.201** 0.067
(0.071) (0.046)
Family lives in the Midwest -0.009 0.013
(0.107) (0.025)
Family lives in the West 0.035 0.002
(0.061) (0.023)
Family lives in the South (omitted)
Wave 1
Wave 2 -0.106 0.121
(0.288) (0.102)
Wave 3 0.030 0.057
(0.094) (0.035)
Wave 4 (omitted)
Wave 5 -0.096 -0.039
(0.128) (0.029)
Constant -2.540*** -0.750***
(0.749) (0.213)
Number of observations 5,200 5,200
R-squared 0.090 0.069
Note: Robust standard errors in parentheses.
1 Determined as of Wave 1.
*** p < 0.001, ** p < 0.01, * p < 0.05
FOOD PRICES AND CHILD OVERWEIGHT AND FOOD INSECURITY 44
Table 7. Predicting child outcomes among subsamples of children in households receiving public food assistance (food stamps, WIC,
and/or free or reduced-price lunch and those in households not receiving any public food assistance.
Weight Food Security Status Eating Habits
Model 1 Model 2 Model 3 Model 4 Model 5 Model 6
BMI
z score Overweight
Household has
low or very low
food security
Household
has very low
food security
# Times child
ate healthy
food in past 7
days
# Times child
ate unhealthy
food in past 7
days
Receives SNAP, WIC, or free/reduced school lunch
Fruit and vegetable average price ($) 0.522* 0.100 -0.0528 0.021 -0.983 4.522
(0.214) (0.058) (0.0443) (0.021) (2.914) (2.645)
Fast food average price ($) 0.145 0.085** 0.0188 -0.003 0.472 0.528
(0.101) (0.030) (0.0221) (0.014) (1.156) (0.961)
Number of observations 3700 3700 6900 6900 2800 2800
R-squared 0.099 0.070 0.062 0.022 0.029 0.037
Does not receive SNAP, WIC, or free/reduced school lunch
Fruit and vegetable average price ($) 0.175 -0.023 5.28e-05 0.013 -2.244 3.418
(0.167) (0.070) (0.0344) (0.018) (3.477) (2.577)
Fast food average price ($) -0.020 0.029 -0.0192 -0.008 2.581 -1.037
(0.085) (0.034) (0.0139) (0.006) (1.727) (1.468)
Number of observations 2250 2250 3600 3600 1750 1750
R-squared 0.117 0.087 0.064 0.026 0.045 0.042
FOOD PRICES AND CHILD OVERWEIGHT AND FOOD INSECURITY 45
Note: Robust standard errors in parentheses.
*** p < 0.001, ** p < 0.01, * p < 0.05