Embed Size (px)
Citation preview
at SciVerse ScienceDirect
Journal of Environmental Radioactivity 111 (2012) 83e99
Contents lists available
Journal of Environmental Radioactivity
journal homepage: www.elsevier .com/locate/ jenvrad
Food safety regulations: what we learned from the Fukushima nuclear accident
Nobuyuki Hamada*, Haruyuki OginoRadiation Safety Research Center, Nuclear Technology Research Laboratory, Central Research Institute of Electric Power Industry (CRIEPI), 2-11-1 Iwado-kita,Komae, Tokyo 201-8511, Japan
a r t i c l e i n f o
Article history:Received 13 June 2011Received in revised form4 August 2011Accepted 8 August 2011Available online 11 October 2011
Keywords:Emergency exposure situationExisting exposure situationFood safety regulationFukushima nuclear accidentGraded triphasic reference levelInternal radiation exposure
Abbreviations: BSS, International Basic Safety Stareactor; CAC, Codex Alimentarius Commission; CF, Cointervention level; FAO, Food and Agriculture OrganiFSC, Food Safety Commission of Japan; IAEA, InternatICRP, International Commission on Radiological ProteILO, International Labour Organization; JRIA, Japan RadMinistry of Agriculture, Forestry and Fisheries of Jaintake; MHLW, Ministry of Health, Labour and WelfarHealth and Welfare of Japan; NERHQ, Nuclear EmergeNISA, Nuclear and Industrial Safety Agency of Japan; NJapan; NSC, Nuclear Safety Commission of Japan; Olevel; ORL, Operational reference level; PAHO, Pan AmPWR, Pressurized water reactor; RCIL, Radioactive cotion level; RL, Reference level; TEPCO, Tokyo Electric PHealth Organization.* Corresponding author. Tel.: þ81 3 3480 2111; fax
E-mail address: [email protected] (N.
0265-931X/$ e see front matter � 2011 Elsevier Ltd.doi:10.1016/j.jenvrad.2011.08.008
a b s t r a c t
On 11 March 2011, the magnitude-9.0 earthquake and a substantial tsunami struck off the northeastcoast of Japan. The Fukushima nuclear power plants were inundated and stricken, followed by radio-nuclide releases outside the crippled reactors. Provisional regulation values for radioactivity in food anddrink were set on 17 March and were adopted from the preset index values, except that for radioiodinesin water and milk ingested by infants. For radiocesiums, uranium, plutonium and transuranic a emitters,index values were defined in all food and drink not to exceed a committed effective dose of 5 mSv/year.Index values for radioiodines were defined not to exceed a committed equivalent dose to the thyroid of50 mSv/year, and set in water, milk and some vegetables, but not in other foodstuffs. Index values werecalculated as radioactive concentrations of indicator radionuclides (131I for radioiodines, 134Cs and 137Csfor radiocesiums) by postulating the relative radioactive concentration of coexisting radionuclides (e.g.,132I, 133I, 134I, 135I and 132Te for 131I). Surveys were thence conducted to monitor levels of 131I, 134Cs and137Cs. Provisional regulation values were exceeded in tap water, raw milk and some vegetables, andrestrictions on distribution and consumption began on 21 March. Fish contaminated with radioiodines atlevels of concern were then detected, so that the provisional regulation value for radioiodines in seafoodadopted from that in vegetables were additionally set on 5 April. Overall, restrictions started within 25days after the first excess in each food or drink item, and maximum levels were detected in leafyvegetables (54,100 Bq/kg for 131I, and a total of 82,000 Bq/kg for 134Cs and 137Cs). This paper focuses onthe logic behind such food safety regulations, and discusses its underlying issues. The outlines of the foodmonitoring results for 24,685 samples and the enforced restrictions will also be described.
� 2011 Elsevier Ltd. All rights reserved.
1. Introduction
The Great East Japan Earthquake occurred at 14:46 (Japanstandard time) on 11 March 2011. This undersea quake registered
ndards; BWR, Boiling waternversion factor; DIL, Derivedzation of the United Nations;ional Atomic Energy Agency;ction; IL, Intervention level;ioisotope Association; MAFF,pan; MDFI, Mean daily foode of Japan; MHW, Ministry ofncy Response Headquarters;PA, National Police Agency ofIL, Operational interventionerican Health Organization;ncentration giving interven-ower Company; WHO, World
: þ81 3 3480 3113.Hamada).
All rights reserved.
amomentmagnitude of 9.0, the largest ever known to hit Japan andfourth largest in the world since 1900. The epicenter was 130 kmeast of the Oshika Peninsula located in the northeastern coast of themain Japanese island of Honshu, and the hypocenter was 24 km inunderwater depth. The quake unleashed a substantial tsunami(reportedlyw 40.5m high, highest in the recorded history of Japan)that traveled up to 10 km inland. This massive disaster causeddevastating damage over a wide area: as of 12 June 2011, loss of15,421 lives has been confirmed, and 7937 people are still missing(NPA, 2011).
Two nuclear power plants that Tokyo Electric Power Company(TEPCO) owns are situated in the Futaba District of FukushimaPrefecture. The tsunami measuring over 14 m in height swepttoward the sites at about 1 h after the quake, and overwhelmed thesite’s sea defenses designed to withstand 5.7 m high tsunamis. Theplants were thus inundated and stricken. As the first ever experi-ence in Japan, the Prime Minister declared nuclear emergencysituations for the accidents at the Fukushima nuclear power plants1 and 2 at 19:03 on 11 March 2011 and 7:45 on 12 March 2011,respectively. The Japanese government urged residents of the
N. Hamada, H. Ogino / Journal of Environmental Radioactivity 111 (2012) 83e9984
evacuation-designated zone to stay away, and those of itssurrounding annular zone to stay indoors. Nuclear EmergencyResponse Headquarters (NERHQ) was set up in the Cabinet inaccordance with Article 16 of the Act on Special Measures Con-cerning Nuclear Emergency Preparedness, where the PrimeMinister acted as its chief.
All operating boiling water reactors (BWRs) were automati-cally shutdown upon the quake, but overheated due to inoperablenuclear fuel cooling systems. Partial core melt and hydrogenexplosions took place, followed by radionuclide releases outsidereactors. A preliminary estimate made by the Nuclear SafetyCommission of Japan (NSC) indicated that 150 PBq of 131I and 12PBq of 137Cs were spewed into the atmosphere from 11 March2011 to 5 April 2011 (NSC, 2011). Likewise, the Nuclear andIndustrial Safety Agency of Japan (NISA) preliminarily estimatedthe atmospheric release of 130 PBq of 131I and 6.1 PBq of 137Cs(NISA, 2011a). An updated estimate made by NISA indicated that160 PBq of 131I, 18 PBq of 134Cs and 15 PBq of 137Cs were dis-charged from reactor units 1e3 of the Fukushima nuclear powerplant 1 into the atmosphere during 11e16 March 2011 (NISA,2011b). Such radioactivity has spread across the entire northernhemisphere. Also, TEPCO preliminarily estimated the outflow of520-ton water containing 2800 TBq of 131I, 940 TBq of 134Cs and940 TBq of 137Cs into the open sea from 1 April 2011 to 6 April2011 (TEPCO, 2011a). On 12 April 2011, such Fukushima nuclearaccident was provisionally rated at the top Level 7 on the Inter-national Nuclear and Radiological Event Scale (NISA, 2011a). Thelevel is on a par with the Chernobyl nuclear accident in 1986, butits two differences from the Fukushima nuclear accident shouldbe born in mind. On one hand, the current estimate implies thatthe amount of discharged radionuclides in the Fukushima acci-dent (w770 PBq of 131I and 137Cs) is about one-seventh of that inthe Chernobyl accident (5200 PBq) (NISA, 2011a, 2011b). On theother, the radionuclide release is continuing over a longer periodof time in the Fukushima accident compared to the Chernobylaccident. On 17 April 2011, TEPCO offered a two-stage timelinehoping to achieve stable cooling by July 2011 and cold shutdownsby October 2011 to January 2012 (TEPCO, 2011b).
Internal exposure occurs, when radionuclides enter and areabsorbed into the body. Ingestion of food is the most significantroute of radionuclide intake for members of the public (ICRP,1992b). Taking account of the fallout from the Fukushimanuclear power plant 1, the Department of Food Safety at theMinistry of Health, Labour and Welfare of Japan (MHLW) putregulatory limits of radioactivity in food and drink (referredhereinafter to as food) stipulated as “provisional regulationvalues” on 17 March 2011, and issued a notice that food exceedingprovisional regulation values should be regulated under Article 6,Item 2 of the Food Sanitation Act and should not be ingested(MHLW, 2011b). Since then, the distribution (shipment and sale)and/or consumption of food contaminated above provisionalregulation values have been temporarily restricted. This paperfocuses on the logic behind implemented food safety regulations,and discusses its underlying issues. The outlines of available foodmonitoring data and the enforced restrictions shall also bedescribed.
2. Index values as a predecessor of provisional regulationvalues
NSC issued the guideline for nuclear disaster countermeasuresin June 1980, where “index values” were provided as evaluationcriteria to launch discussion on whether NERHQ needs to restrictfood consumption (NSC, 1980). So far, index values have under-gone three revisions while the guideline itself was revised 14
times until August 2010. The initial index value was set in 1980 for131I not to exceed a total dose equivalent to the thyroid gland of 15mSv when infants consumed contaminated milk, drinking waterand leafy vegetables. Following the Chernobyl nuclear accident,the index value for 131I was changed, and the new index valueswere set for radiocesium, radiostrontium, plutonium and other a-emitting transuranic elements in 1998. Following the JCO criti-cality accident in 1999, the additional index value was set foruranium in 2005, serving as the latest index values.
MHLW set the provisional regulation values on 17 March 2011(MHLW, 2011b), without an assessment by the Food SafetyCommission of Japan (FSC), and hence requested FSC to assess thevalidity of provisional regulation values on 20 March 2011. Afterone-week deliberations, FSC drew up a report (FSC, 2011a) on 29March 2011, guaranteeing that the ongoing measures based onprovisional regulation values are effective enough to ensure foodsafety for consumption, domestic distribution and exportation(FSC, 2011b). Consequently, MHLW decided to use the ongoingprovisional regulation values for the time being on 4 April 2011(MHLW, 2011g, 2011h). However, the provisional regulation valuefor radioiodines in seafood was additionally set on the next day(MHLW, 2011k), because fish contaminated at levels of concernbegan to emerge (see Section 3.2.2). Table 1 lists the provisionalregulation values effective as of 12 June 2011. Provisional regu-lation values were adopted from the preceding index values,except the value for radioiodines in drinking water and milkconsumed by infants, and that in seafood (see Section 4.2).
3. Food monitoring data and restrictions on distribution andconsumption
3.1. Potable tap water
3.1.1. Policy on the enforcement of restrictions on consumptionOn 19 March 2011, MHLW notified local government authorities
and regional water suppliers that tap water contaminated abovethe provisional regulation value should not be consumed, but canbe consumed even by infants if its substitute is unavailable (MHLW,2011e). This notice also indicated that the use of such water in dailylife (e.g., for washing hands, bathing and laundry) is safely allow-able, because the estimated dose to be received (correctly,a committed effective dose, see Section 4.1) may be of the order ofnSv (MHLW, 2011e). This dose estimation assumed dermal contactto water as well as inhalation of air volatilized from water besidesdrinking, as radionuclide exposure scenarios associated with theuse of tap water contaminated at 300 Bq/L of 131I or 200 Bq/L of137Cs. Given that the body is soaked for 30min in the bathing water,the dose posed by dermal contact due to bathing were estimatedfor 131I and 137Cs with equations (1) and (2), respectively, wheredose coefficients for water immersion of skin (nSv cm3 Bq�1 s�1)were taken from Eckerman and Ryman (1993), and both yielded 20nSv/d. Actual dose should be less considering evaporation of waterin wet body, hands and clothes after bathing, washing hands andlaundry, respectively. Providing the daily use of 100-L water inkitchen and bathroom, closed living space of 40 m3, inhalationvolume of 20 m3/d, volatilization rate of 0.001, the dose was esti-mated to be 300 and 390 nSv/d for 131I and 137Cs using equations (3)and (4), respectively, where inhalation dose coefficients (nSv/Bq)were taken from the Ministry of Health and Welfare of Japan(MHW, 2000).
0:3�Bq=cm3
�� 1800 ðs=dÞ � 0:037
�nSv cm3Bq�1s�1
�
¼ 20 ðnSv=dÞ (1)
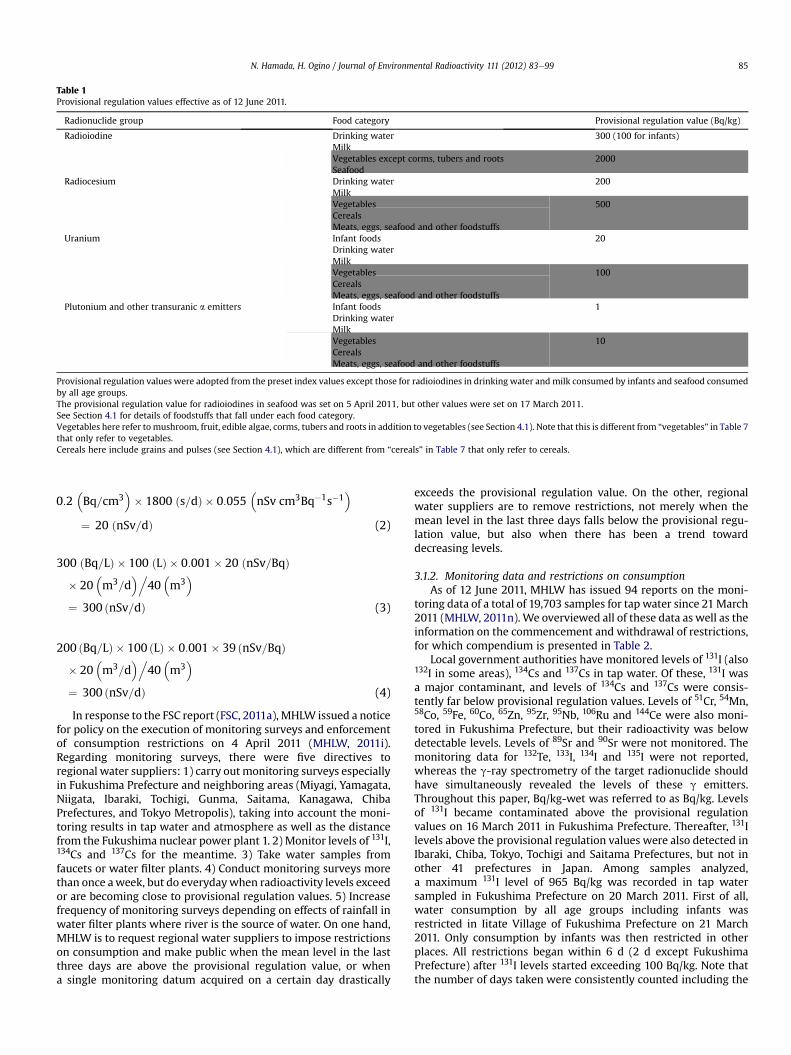
Table 1Provisional regulation values effective as of 12 June 2011.
Radionuclide group Food category Provisional regulation value (Bq/kg)
Radioiodine Drinking water 300 (100 for infants)MilkVegetables except corms, tubers and rootsSeafood
2000
Radiocesium Drinking water 200MilkVegetables 500CerealsMeats, eggs, seafood and other foodstuffs
Uranium Infant foods 20Drinking waterMilkVegetables 100CerealsMeats, eggs, seafood and other foodstuffs
Plutonium and other transuranic a emitters Infant foods 1Drinking waterMilkVegetables 10CerealsMeats, eggs, seafood and other foodstuffs
Provisional regulation values were adopted from the preset index values except those for radioiodines in drinking water and milk consumed by infants and seafood consumedby all age groups.The provisional regulation value for radioiodines in seafood was set on 5 April 2011, but other values were set on 17 March 2011.See Section 4.1 for details of foodstuffs that fall under each food category.Vegetables here refer to mushroom, fruit, edible algae, corms, tubers and roots in addition to vegetables (see Section 4.1). Note that this is different from “vegetables” in Table 7that only refer to vegetables.Cereals here include grains and pulses (see Section 4.1), which are different from “cereals” in Table 7 that only refer to cereals.
N. Hamada, H. Ogino / Journal of Environmental Radioactivity 111 (2012) 83e99 85
0:2�Bq=cm3
�� 1800 ðs=dÞ � 0:055
�nSv cm3Bq�1s�1
�
¼ 20 ðnSv=dÞ (2)
300 ðBq=LÞ � 100 ðLÞ � 0:001� 20 ðnSv=BqÞ� 20
�m3=d
�.40
�m3
�
¼ 300 ðnSv=dÞ (3)
200 ðBq=LÞ � 100 ðLÞ � 0:001� 39 ðnSv=BqÞ� 20
�m3=d
�.40
�m3
�
¼ 300 ðnSv=dÞ (4)
In response to the FSC report (FSC, 2011a), MHLW issued a noticefor policy on the execution of monitoring surveys and enforcementof consumption restrictions on 4 April 2011 (MHLW, 2011i).Regarding monitoring surveys, there were five directives toregional water suppliers: 1) carry outmonitoring surveys especiallyin Fukushima Prefecture and neighboring areas (Miyagi, Yamagata,Niigata, Ibaraki, Tochigi, Gunma, Saitama, Kanagawa, ChibaPrefectures, and Tokyo Metropolis), taking into account the moni-toring results in tap water and atmosphere as well as the distancefrom the Fukushima nuclear power plant 1. 2) Monitor levels of 131I,134Cs and 137Cs for the meantime. 3) Take water samples fromfaucets or water filter plants. 4) Conduct monitoring surveys morethan once aweek, but do everydaywhen radioactivity levels exceedor are becoming close to provisional regulation values. 5) Increasefrequency of monitoring surveys depending on effects of rainfall inwater filter plants where river is the source of water. On one hand,MHLW is to request regional water suppliers to impose restrictionson consumption and make public when the mean level in the lastthree days are above the provisional regulation value, or whena single monitoring datum acquired on a certain day drastically
exceeds the provisional regulation value. On the other, regionalwater suppliers are to remove restrictions, not merely when themean level in the last three days falls below the provisional regu-lation value, but also when there has been a trend towarddecreasing levels.
3.1.2. Monitoring data and restrictions on consumptionAs of 12 June 2011, MHLW has issued 94 reports on the moni-
toring data of a total of 19,703 samples for tap water since 21March2011 (MHLW, 2011n). We overviewed all of these data as well as theinformation on the commencement and withdrawal of restrictions,for which compendium is presented in Table 2.
Local government authorities have monitored levels of 131I (also132I in some areas), 134Cs and 137Cs in tap water. Of these, 131I wasa major contaminant, and levels of 134Cs and 137Cs were consis-tently far below provisional regulation values. Levels of 51Cr, 54Mn,58Co, 59Fe, 60Co, 65Zn, 95Zr, 95Nb, 106Ru and 144Ce were also moni-tored in Fukushima Prefecture, but their radioactivity was belowdetectable levels. Levels of 89Sr and 90Sr were not monitored. Themonitoring data for 132Te, 133I, 134I and 135I were not reported,whereas the g-ray spectrometry of the target radionuclide shouldhave simultaneously revealed the levels of these g emitters.Throughout this paper, Bq/kg-wet was referred to as Bq/kg. Levelsof 131I became contaminated above the provisional regulationvalues on 16 March 2011 in Fukushima Prefecture. Thereafter, 131Ilevels above the provisional regulation values were also detected inIbaraki, Chiba, Tokyo, Tochigi and Saitama Prefectures, but not inother 41 prefectures in Japan. Among samples analyzed,a maximum 131I level of 965 Bq/kg was recorded in tap watersampled in Fukushima Prefecture on 20 March 2011. First of all,water consumption by all age groups including infants wasrestricted in Iitate Village of Fukushima Prefecture on 21 March2011. Only consumption by infants was then restricted in otherplaces. All restrictions began within 6 d (2 d except FukushimaPrefecture) after 131I levels started exceeding 100 Bq/kg. Note thatthe number of days taken were consistently counted including the
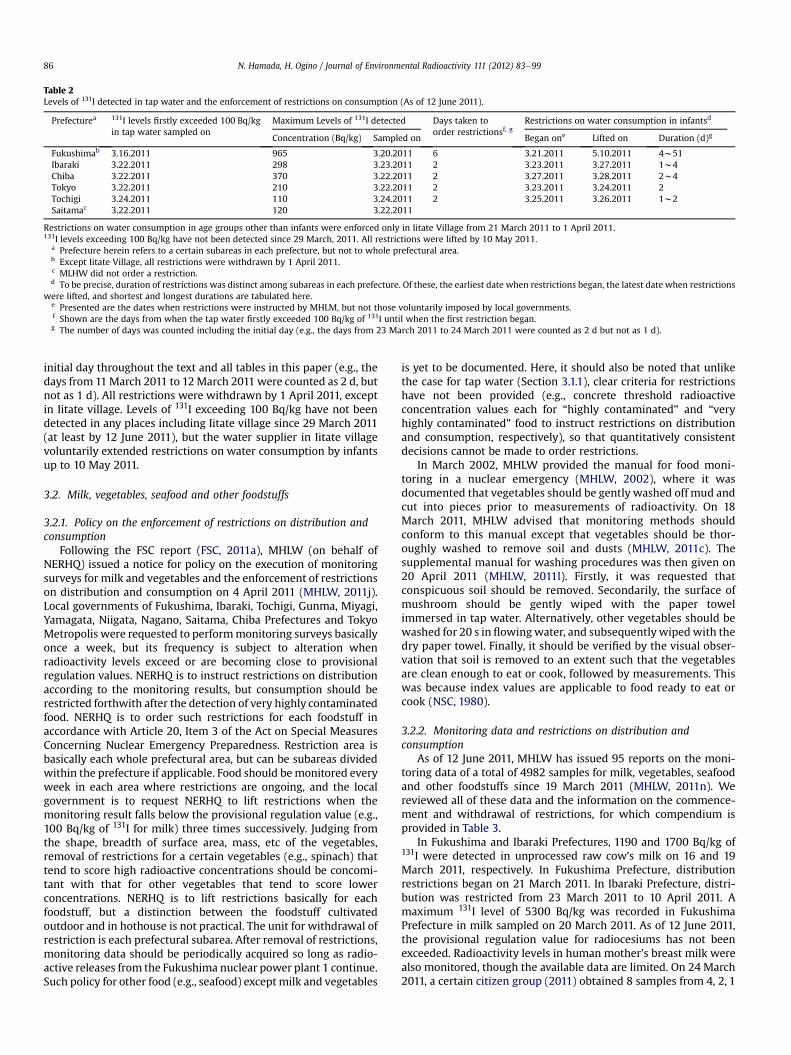
Table 2Levels of 131I detected in tap water and the enforcement of restrictions on consumption (As of 12 June 2011).
Prefecturea 131I levels firstly exceeded 100 Bq/kgin tap water sampled on
Maximum Levels of 131I detected Days taken toorder restrictionsf, g
Restrictions on water consumption in infantsd
Concentration (Bq/kg) Sampled on Began one Lifted on Duration (d)g
Fukushimab 3.16.2011 965 3.20.2011 6 3.21.2011 5.10.2011 4w51Ibaraki 3.22.2011 298 3.23.2011 2 3.23.2011 3.27.2011 1w4Chiba 3.22.2011 370 3.22.2011 2 3.27.2011 3.28.2011 2w4Tokyo 3.22.2011 210 3.22.2011 2 3.23.2011 3.24.2011 2Tochigi 3.24.2011 110 3.24.2011 2 3.25.2011 3.26.2011 1w2Saitamac 3.22.2011 120 3.22.2011
Restrictions on water consumption in age groups other than infants were enforced only in Iitate Village from 21 March 2011 to 1 April 2011.131I levels exceeding 100 Bq/kg have not been detected since 29 March, 2011. All restrictions were lifted by 10 May 2011.
a Prefecture herein refers to a certain subareas in each prefecture, but not to whole prefectural area.b Except Iitate Village, all restrictions were withdrawn by 1 April 2011.c MLHW did not order a restriction.d To be precise, duration of restrictions was distinct among subareas in each prefecture. Of these, the earliest date when restrictions began, the latest date when restrictions
were lifted, and shortest and longest durations are tabulated here.e Presented are the dates when restrictions were instructed by MHLM, but not those voluntarily imposed by local governments.f Shown are the days from when the tap water firstly exceeded 100 Bq/kg of 131I until when the first restriction began.g The number of days was counted including the initial day (e.g., the days from 23 March 2011 to 24 March 2011 were counted as 2 d but not as 1 d).
N. Hamada, H. Ogino / Journal of Environmental Radioactivity 111 (2012) 83e9986
initial day throughout the text and all tables in this paper (e.g., thedays from 11March 2011 to 12March 2011 were counted as 2 d, butnot as 1 d). All restrictions were withdrawn by 1 April 2011, exceptin Iitate village. Levels of 131I exceeding 100 Bq/kg have not beendetected in any places including Iitate village since 29 March 2011(at least by 12 June 2011), but the water supplier in Iitate villagevoluntarily extended restrictions on water consumption by infantsup to 10 May 2011.
3.2. Milk, vegetables, seafood and other foodstuffs
3.2.1. Policy on the enforcement of restrictions on distribution andconsumption
Following the FSC report (FSC, 2011a), MHLW (on behalf ofNERHQ) issued a notice for policy on the execution of monitoringsurveys for milk and vegetables and the enforcement of restrictionson distribution and consumption on 4 April 2011 (MHLW, 2011j).Local governments of Fukushima, Ibaraki, Tochigi, Gunma, Miyagi,Yamagata, Niigata, Nagano, Saitama, Chiba Prefectures and TokyoMetropolis were requested to performmonitoring surveys basicallyonce a week, but its frequency is subject to alteration whenradioactivity levels exceed or are becoming close to provisionalregulation values. NERHQ is to instruct restrictions on distributionaccording to the monitoring results, but consumption should berestricted forthwith after the detection of very highly contaminatedfood. NERHQ is to order such restrictions for each foodstuff inaccordance with Article 20, Item 3 of the Act on Special MeasuresConcerning Nuclear Emergency Preparedness. Restriction area isbasically each whole prefectural area, but can be subareas dividedwithin the prefecture if applicable. Food should bemonitored everyweek in each area where restrictions are ongoing, and the localgovernment is to request NERHQ to lift restrictions when themonitoring result falls below the provisional regulation value (e.g.,100 Bq/kg of 131I for milk) three times successively. Judging fromthe shape, breadth of surface area, mass, etc of the vegetables,removal of restrictions for a certain vegetables (e.g., spinach) thattend to score high radioactive concentrations should be concomi-tant with that for other vegetables that tend to score lowerconcentrations. NERHQ is to lift restrictions basically for eachfoodstuff, but a distinction between the foodstuff cultivatedoutdoor and in hothouse is not practical. The unit for withdrawal ofrestriction is each prefectural subarea. After removal of restrictions,monitoring data should be periodically acquired so long as radio-active releases from the Fukushima nuclear power plant 1 continue.Such policy for other food (e.g., seafood) exceptmilk and vegetables
is yet to be documented. Here, it should also be noted that unlikethe case for tap water (Section 3.1.1), clear criteria for restrictionshave not been provided (e.g., concrete threshold radioactiveconcentration values each for “highly contaminated” and “veryhighly contaminated” food to instruct restrictions on distributionand consumption, respectively), so that quantitatively consistentdecisions cannot be made to order restrictions.
In March 2002, MHLW provided the manual for food moni-toring in a nuclear emergency (MHLW, 2002), where it wasdocumented that vegetables should be gently washed off mud andcut into pieces prior to measurements of radioactivity. On 18March 2011, MHLW advised that monitoring methods shouldconform to this manual except that vegetables should be thor-oughly washed to remove soil and dusts (MHLW, 2011c). Thesupplemental manual for washing procedures was then given on20 April 2011 (MHLW, 2011l). Firstly, it was requested thatconspicuous soil should be removed. Secondarily, the surface ofmushroom should be gently wiped with the paper towelimmersed in tap water. Alternatively, other vegetables should bewashed for 20 s in flowingwater, and subsequently wipedwith thedry paper towel. Finally, it should be verified by the visual obser-vation that soil is removed to an extent such that the vegetablesare clean enough to eat or cook, followed by measurements. Thiswas because index values are applicable to food ready to eat orcook (NSC, 1980).
3.2.2. Monitoring data and restrictions on distribution andconsumption
As of 12 June 2011, MHLW has issued 95 reports on the moni-toring data of a total of 4982 samples for milk, vegetables, seafoodand other foodstuffs since 19 March 2011 (MHLW, 2011n). Wereviewed all of these data and the information on the commence-ment and withdrawal of restrictions, for which compendium isprovided in Table 3.
In Fukushima and Ibaraki Prefectures, 1190 and 1700 Bq/kg of131I were detected in unprocessed raw cow’s milk on 16 and 19March 2011, respectively. In Fukushima Prefecture, distributionrestrictions began on 21 March 2011. In Ibaraki Prefecture, distri-bution was restricted from 23 March 2011 to 10 April 2011. Amaximum 131I level of 5300 Bq/kg was recorded in FukushimaPrefecture in milk sampled on 20 March 2011. As of 12 June 2011,the provisional regulation value for radiocesiums has not beenexceeded. Radioactivity levels in human mother’s breast milk werealso monitored, though the available data are limited. On 24 March2011, a certain citizen group (2011) obtained 8 samples from 4, 2, 1
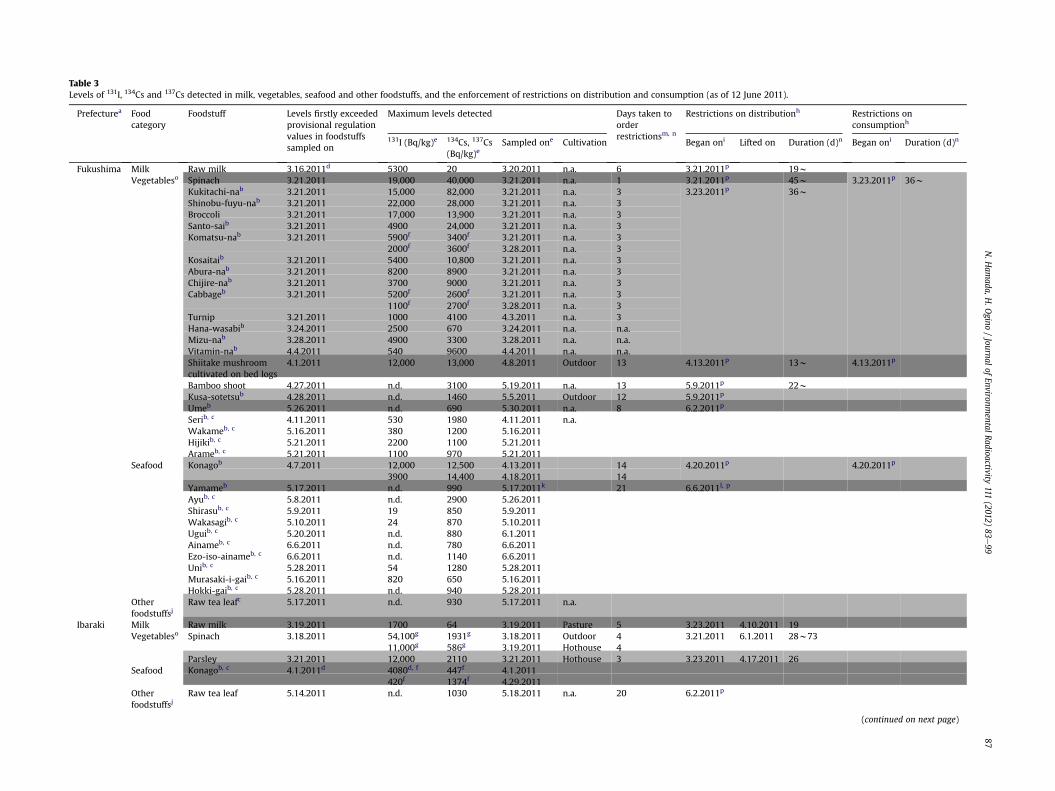
Table 3Levels of 131I, 134Cs and 137Cs detected in milk, vegetables, seafood and other foodstuffs, and the enforcement of restrictions on distribution and consumption (as of 12 June 2011).
Prefecturea Foodcategory
Foodstuff Levels firstly exceededprovisional regulationvalues in foodstuffssampled on
Maximum levels detected Days taken toorderrestrictionsm, n
Restrictions on distributionh Restrictions onconsumptionh
131I (Bq/kg)e 134Cs, 137Cs(Bq/kg)e
Sampled one Cultivation Began oni Lifted on Duration (d)n Began oni Duration (d)n
Fukushima Milk Raw milk 3.16.2011d 5300 20 3.20.2011 n.a. 6 3.21.2011p 19wVegetableso Spinach 3.21.2011 19,000 40,000 3.21.2011 n.a. 1 3.21.2011p 45w 3.23.2011p 36w
Kukitachi-nab 3.21.2011 15,000 82,000 3.21.2011 n.a. 3 3.23.2011p 36wShinobu-fuyu-nab 3.21.2011 22,000 28,000 3.21.2011 n.a. 3Broccoli 3.21.2011 17,000 13,900 3.21.2011 n.a. 3Santo-saib 3.21.2011 4900 24,000 3.21.2011 n.a. 3Komatsu-nab 3.21.2011 5900f 3400f 3.21.2011 n.a. 3
2000f 3600f 3.28.2011 n.a. 3Kosaitaib 3.21.2011 5400 10,800 3.21.2011 n.a. 3Abura-nab 3.21.2011 8200 8900 3.21.2011 n.a. 3Chijire-nab 3.21.2011 3700 9000 3.21.2011 n.a. 3Cabbageb 3.21.2011 5200f 2600f 3.21.2011 n.a. 3
1100f 2700f 3.28.2011 n.a. 3Turnip 3.21.2011 1000 4100 4.3.2011 n.a. 3Hana-wasabib 3.24.2011 2500 670 3.24.2011 n.a. n.a.Mizu-nab 3.28.2011 4900 3300 3.28.2011 n.a. n.a.Vitamin-nab 4.4.2011 540 9600 4.4.2011 n.a. n.a.Shiitake mushroomcultivated on bed logs
4.1.2011 12,000 13,000 4.8.2011 Outdoor 13 4.13.2011p 13w 4.13.2011p
Bamboo shoot 4.27.2011 n.d. 3100 5.19.2011 n.a. 13 5.9.2011p 22wKusa-sotetsub 4.28.2011 n.d. 1460 5.5.2011 Outdoor 12 5.9.2011p
Umeb 5.26.2011 n.d. 690 5.30.2011 n.a. 8 6.2.2011p
Serib, c 4.11.2011 530 1980 4.11.2011 n.a.Wakameb, c 5.16.2011 380 1200 5.16.2011Hijikib, c 5.21.2011 2200 1100 5.21.2011Arameb, c 5.21.2011 1100 970 5.21.2011
Seafood Konagob 4.7.2011 12,000 12,500 4.13.2011 14 4.20.2011p 4.20.2011p
3900 14,400 4.18.2011 14Yamameb 5.17.2011 n.d. 990 5.17.2011k 21 6.6.2011l, p
Ayub, c 5.8.2011 n.d. 2900 5.26.2011Shirasub, c 5.9.2011 19 850 5.9.2011Wakasagib, c 5.10.2011 24 870 5.10.2011Uguib, c 5.20.2011 n.d. 880 6.1.2011Ainameb, c 6.6.2011 n.d. 780 6.6.2011Ezo-iso-ainameb, c 6.6.2011 n.d. 1140 6.6.2011Unib, c 5.28.2011 54 1280 5.28.2011Murasaki-i-gaib, c 5.16.2011 820 650 5.16.2011Hokki-gaib, c 5.28.2011 n.d. 940 5.28.2011
Otherfoodstuffsj
Raw tea leafc 5.17.2011 n.d. 930 5.17.2011 n.a.
Ibaraki Milk Raw milk 3.19.2011 1700 64 3.19.2011 Pasture 5 3.23.2011 4.10.2011 19Vegetableso Spinach 3.18.2011 54,100g 1931g 3.18.2011 Outdoor 4 3.21.2011 6.1.2011 28w73
11,000g 586g 3.19.2011 Hothouse 4Parsley 3.21.2011 12,000 2110 3.21.2011 Hothouse 3 3.23.2011 4.17.2011 26
Seafood Konagob, c 4.1.2011d 4080d, f 447f 4.1.2011420f 1374f 4.29.2011
Otherfoodstuffsj
Raw tea leaf 5.14.2011 n.d. 1030 5.18.2011 n.a. 20 6.2.2011p
(continued on next page)
N.H
amada,H
.Ogino
/Journal
ofEnvironm
entalRadioactivity111
(2012)83
e99
87
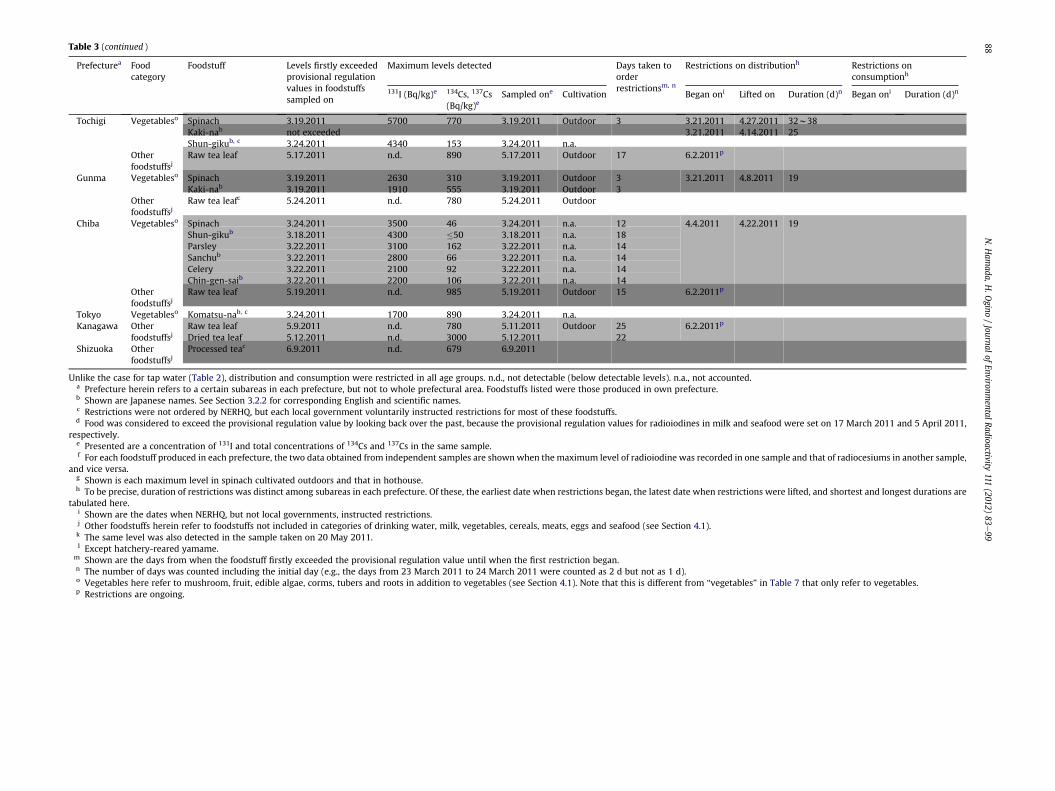
Table 3 (continued )
Prefecturea Foodcategory
Foodstuff Levels firstly exceededprovisional regulationvalues in foodstuffssampled on
Maximum levels detected Days taken toorderrestrictionsm, n
Restrictions on distributionh Restrictions onconsumptionh
131I (Bq/kg)e 134Cs, 137Cs(Bq/kg)e
Sampled one Cultivation Began oni ifted on Duration (d)n Began oni Duration (d)n
Tochigi Vegetableso Spinach 3.19.2011 5700 770 3.19.2011 Outdoor 3 3.21.2011 .27.2011 32w38Kaki-nab not exceeded 3.21.2011 .14.2011 25Shun-gikub, c 3.24.2011 4340 153 3.24.2011 n.a.
Otherfoodstuffsj
Raw tea leaf 5.17.2011 n.d. 890 5.17.2011 Outdoor 17 6.2.2011p
Gunma Vegetableso Spinach 3.19.2011 2630 310 3.19.2011 Outdoor 3 3.21.2011 .8.2011 19Kaki-nab 3.19.2011 1910 555 3.19.2011 Outdoor 3
Otherfoodstuffsj
Raw tea leafc 5.24.2011 n.d. 780 5.24.2011 Outdoor
Chiba Vegetableso Spinach 3.24.2011 3500 46 3.24.2011 n.a. 12 4.4.2011 .22.2011 19Shun-gikub 3.18.2011 4300 �50 3.18.2011 n.a. 18Parsley 3.22.2011 3100 162 3.22.2011 n.a. 14Sanchub 3.22.2011 2800 66 3.22.2011 n.a. 14Celery 3.22.2011 2100 92 3.22.2011 n.a. 14Chin-gen-saib 3.22.2011 2200 106 3.22.2011 n.a. 14
Otherfoodstuffsj
Raw tea leaf 5.19.2011 n.d. 985 5.19.2011 Outdoor 15 6.2.2011p
Tokyo Vegetableso Komatsu-nab, c 3.24.2011 1700 890 3.24.2011 n.a.Kanagawa Other
foodstuffsjRaw tea leaf 5.9.2011 n.d. 780 5.11.2011 Outdoor 25 6.2.2011p
Dried tea leaf 5.12.2011 n.d. 3000 5.12.2011 22Shizuoka Other
foodstuffsjProcessed teac 6.9.2011 n.d. 679 6.9.2011
Unlike the case for tap water (Table 2), distribution and consumption were restricted in all age groups. n.d., not detectable (below detectable levels). n.a., not accoun ed.a Prefecture herein refers to a certain subareas in each prefecture, but not to whole prefectural area. Foodstuffs listed were those produced in own prefecture.b Shown are Japanese names. See Section 3.2.2 for corresponding English and scientific names.c Restrictions were not ordered by NERHQ, but each local government voluntarily instructed restrictions for most of these foodstuffs.d Food was considered to exceed the provisional regulation value by looking back over the past, because the provisional regulation values for radioiodines in milk d seafood were set on 17 March 2011 and 5 April 2011,
respectively.e Presented are a concentration of 131I and total concentrations of 134Cs and 137Cs in the same sample.f For each foodstuff produced in each prefecture, the two data obtained from independent samples are shownwhen the maximum level of radioiodine was recorded one sample and that of radiocesiums in another sample,
and vice versa.g Shown is each maximum level in spinach cultivated outdoors and that in hothouse.h To be precise, duration of restrictions was distinct among subareas in each prefecture. Of these, the earliest date when restrictions began, the latest date when rest tions were lifted, and shortest and longest durations are
tabulated here.i Shown are the dates when NERHQ, but not local governments, instructed restrictions.j Other foodstuffs herein refer to foodstuffs not included in categories of drinking water, milk, vegetables, cereals, meats, eggs and seafood (see Section 4.1).k The same level was also detected in the sample taken on 20 May 2011.l Except hatchery-reared yamame.
m Shown are the days from when the foodstuff firstly exceeded the provisional regulation value until when the first restriction began.n The number of days was counted including the initial day (e.g., the days from 23 March 2011 to 24 March 2011 were counted as 2 d but not as 1 d).o Vegetables here refer to mushroom, fruit, edible algae, corms, tubers and roots in addition to vegetables (see Section 4.1). Note that this is different from “veget les” in Table 7 that only refer to vegetables.p Restrictions are ongoing.
N.H
amada,H
.Ogino
/Journal
ofEnvironm
entalRadioactivity111
(2012)83
e99
88
L
44
4
4
t
an
in
ric
ab
N. Hamada, H. Ogino / Journal of Environmental Radioactivity 111 (2012) 83e99 89
and 1 mothers living in Ibaraki, Fukushima, Miyagi and ChibaPrefectures, respectively. Of these, 36.3 and 31.8 Bq/kg of radio-iodine were detected in samples obtained from two mothers eachliving in Chiba and Ibaraki Prefectures, respectively. Thereafter,levels decreased to 14.8 and 8.5 Bq/kg of radioiodine in samplesobtained from these two mothers on 30 March 2011. Radiocesiumwas below detectable levels in all samples. MHLW reported thatmaximum levels were 8.0 Bq/kg of 131I, 134Cs below detectablelevels and 2.4 Bq/kg of 137Cs among 23 samples, which werecollected on 24 or 25 April 2011 from 4, 9, 2, 1 and 7 mothers livingin Fukushima, Ibaraki, Chiba, Saitama Prefectures and TokyoMetropolis, respectively (MHLW, 2011m).
First of all vegetables, spinach exceeded provisional regulationvalues in Ibaraki and Fukushima Prefectures on 18 and 21 March2011, respectively (n.b., vegetables herein refer to mushroom,fruit, algae, corms, tubers and edible roots in addition to vegeta-bles, see Section 4.1). Thereafter, provisional regulation valueswere also exceeded in broccoli, cabbage, celery, turnip, parsley,bamboo shoot, shiitake mushroom (cultivated outdoors on bedlogs), ume (Japanese apricot, Prunus mume), kusa-sotetsu (ostrichfern, Matteuccia struthiopteris), shungiku (garland chrysan-themum, Glebionis caronaria), sanchu (celtuce, Lactuca sativa var.angustana), seri (water dropwort,Oenanthe javanica), hana-wasabi(Japanese horseradish, Wasabia japonica), kosaitai (purple-stemmustard, Brassica chinensis f. honsaitai), chin-gen-sai (qing-geng-cai, B. rapa var. chinensis), komatsu-na (Japanese mustard spinach,B. rapa var. perviridis), chijire-na (rape blossoms, B. rapa var.amplexicaulu), abura-na (rape, B. campestris), mizu-na (potherbmustard, B. campestris var. laciniifoli), vitamin-na (B. campestris cv.vitamin-na), santo-sai (Shantung cabbage, B. campestris var.amplexicaulis), other leafy vegetables belonging to Brassiaceae(kaki-na, kukitachi-na, shinobu-fuyu-na), and brown algae such aswakame (Undaria pinnatifida), hijiki (Sargassum fusiforme) andarame (Eisenia bicyclis). In Fukushima Prefecture, consumptionand/or distribution of headed and non-headed leafy vegetables,flower-headed brassicas, turnip, bamboo shoot, kusa-sotetsu, log-cultivated shiitake mushroom and ume were restricted. Vegeta-bles whose distribution was restricted in Ibaraki, Tochigi, Gunmaand Chiba Prefectures include spinach, kaki-na, shungiku, chin-gen-sai, sanchu, parsley and celery. Among all vegetables, themaximum concentration of 131I (54,100 Bq/kg) and the maximumtotal concentrations of 134Cs and 137Cs (82,000 Bq/kg) weredetected in spinach and kukitachi-na, respectively. Not onlyvegetables cultivated outdoors but also those in hothouse excee-ded provisional regulation values.
The provisional regulation value for radioiodines in seafood(2000 Bq/kg of 131I) was hurriedly set on 5 April 2011 (MHLW,2011k), by which time such value had not existed (see Section 4).This was because 4080 Bq/kg of 131I was detected in konago (juve-nile sand lance, Ammodytes personatus) sampled in Ibaraki Prefec-ture on 1 April 2011. Restrictions on distribution and consumptionof konago began on 20 April 2011 in Fukushima Prefecture. In May2011 or later, other fish and shellfish exceeding 500 Bq/kg of 134Csand 137Cs started being detected, including yamame (landlockedsalmon, Oncorhynchus masou), ayu (sweetfish, Plecoglossus altivelis),shirasu (general name for the young of sardines, eels, ayu, etc),wakasagi (Japanese pond smelt, Hypomesus nipponensis), ugui(Japanese dace, Tribolodon hakonensis), ainame (fat greenling, Hex-agrammos otakii), Ezo-iso-ainame (Physiculus maximowiczi), uni (seaurchin, echinoderms belonging to Echinoidea) including murasaki-uni (purple sea urchin, Anthocidaris crassispina), murasaki-i-gai(blue mussel, Mytilus galloprovincialis) and Hokki-gai (Sakhalinsurf clam, Pseudocardium sachalinense). Of these, distribution and/orconsumption of konago and yamame (except hatchery-reared one)were restricted in Fukushima Prefecture. Among all seafood,
maximum concentrations (12,000 Bq/kg of 131I, and 14,400 Bq/kg of134Cs and 137Cs) were detected in konago.
Unprocessed raw tea leaf, dried tea leaf, and processed teaexceeded the provisional regulation value for radiocesiums in otherfoodstuffs (referring herein to food not included in categories ofdrinking water, milk, vegetables, cereals, meats, eggs, seafood, seeSection 4.1). The distribution of tea leaf was restricted in Ibaraki,Tochigi, Chiba and Kanagawa Prefectures. It should be noted thatprovisional regulation values for radioiodines in such foodstuffshave not been set, reminiscent of the case for seafood asaforementioned.
Meats including beef have not exceeded the provisional regu-lation value for radiocesiums. Incidentally, on 14 April 2011, theMinistry of Agriculture, Forestry and Fisheries of Japan (MAFF) putthe limit to regulate contaminated livestock feed for cattle, whichwas stipulated as “provisional tolerance values” (MAFF, 2011).Values set were 300 Bq/kg of 134Cs and 137Cs in roughage for beefcattle and daily cattle, and 5000 Bq/kg of 134Cs and 137Cs for othercattle, 70 Bq/kg of 131I for daily cattle (MAFF, 2011). However, theprovisional tolerance value for 131I in cattle excluding daily cattlewas not set, because there was no provisional regulation value setfor radioiodines in meats. Alternatively, it was advised thatroughage harvested from areas where restrictions on distributionof crops (i.e., vegetables) on account of excess radioiodines have notbeen enforced should be fed to cattle excluding daily cattle (MAFF,2011). According to the monitoring results, pasturage, feeding ofcontaminated pasture grass, and rearing of some beef and dailycattle were temporarily suspended in the whole area or subareas ofIwate, Miyagi, Fukushima, Ibaraki, Tochigi, Gunma and ChibaPrefectures. Maximum concentrations (170 Bq/kg of 131I, and 9200Bq/kg of 134Cs and 137Cs) were detected in the pasture grasssampled in Fukushima Prefecture on 27 April 2011.
All together, restrictions on consumption of food (excludingwater) were enforced only in Fukushima Prefecture. Distributionrestrictions were enforced in Fukushima, Ibaraki, Tochigi, Gunma,Chiba and Kanagawa Prefectures. In TokyoMetropolis and ShizuokaPrefecture, only one komatsu-na sample taken on 24 March 2011and one processed tea sample taken on 9 June 2011 exceeded theprovisional regulation values for radioiodines and radiocesiums,respectively, and restrictions were not enforced. In the rest of other39 Prefectures in Japan, no samples exceeded provisional regula-tion values.
4. Logic behind provisional regulation values
4.1. Approaches taken to calculate the index values
As described in Section 2, provisional regulation values wereadopted from the index values, except the value for radioiodines indrinking water and milk consumed by infants as well as that inseafood. Here, approaches taken to calculate the index values aredescribed.
In internal exposure situations, tissues or organs receive radia-tion emitted during the decay of incorporated radionuclide asa function of time following the intake, and temporal dose distri-bution should be therefore considered. A committed equivalentdose is the time integral of the equivalent dose rate to be deliveredto a particular tissue or organ (ICRP, 1995). A committed effectivedose (to the whole body) is the sum of the committed tissue ororgan equivalent doses each multiplied by tissue weighting factors(ICRP, 1995). The integration time amounts to a period of 50 y foradults, and the period from intake to the age of 70 y for others(ICRP, 1995).
When off-site members of the public have the possibility toreceive excess exposure to radiation released from the crippled
N. Hamada, H. Ogino / Journal of Environmental Radioactivity 111 (2012) 83e9990
nuclear facility, intervention (achievable measures to minimizeexposure) for radiation protection needs to be considered. Inter-vention level (IL) is the avertable dose serving as a basis to judge thenecessity of intervention. Derived intervention level (DIL) is thedose secondarily set for the restriction of consumption and distri-bution not to exceed IL. Herein, IL is expressed in the committeddose per annum (mSv/y), and the index values expressed inradioactive concentrations (Bq/kg) fall under DIL. To determine theindex values, the radioactive concentration giving IL (RCIL) wascalculated for each radionuclide group using equation (5) (Suga andIchikawa, 2000).
RCILjk ¼ IL=GFWjk
PiCFijfif1� expð�liTÞg=li
(5)
Generations were divided into five age groups: infants (0e1 y ofage; representative age at 3 months), children (1e6 y; 5 y), juve-niles (7e12 y; 10 y), adolescents (12e17 y; 15 y) and adults (�17 y).Food was classified into five categories: 1) drinking water, 2) milk(cow’s milk, powdered milk, human mother’s breast milk, dailyproducts and related others), 3) vegetables (mushroom, fruit, algae,corms, tubers and roots in addition to vegetables), 4) cereals(grains, rice and pulses), and 5) meats (including poultry), eggs,seafood (seawater fish, freshwater fish, shellfish and other fisheryproducts) and other foodstuffs. Factor G is the number of foodcategories considered in each radionuclide group (e.g., G ¼ 3 and 5for radioiodines and radiocesiums, respectively). Factor F is themarket dilution factor for long-lived radionuclides (i.e., theconsumption rate of contaminated food versus non-contaminatedfood), assuming that the consumption of non-contaminated foodreduces overall radionuclide intake (e.g., F ¼ 1 and 0.5 for radio-iodines and radiocesiums, respectively). Variable T (d) is a period oftime for food intake per annum (T¼ 365). FactorWjk (kg/d or L/d) isthemean daily food intake (MDFI) for age group j and food categoryk. Values of MDFI for adults originate from the data in the NationalNutrition Survey conducted in 1986 (MHW, 1988), and those forinfants and children were adapted from the data obtained by theNational Institute of Radiological Sciences (Chiba, Japan) (Suga andIchikawa, 2000). MDFI of milk and drinking water consumed byinfants includes the mass of breast milk, cow’s milk, powderedmilk, and water used to dissolve the milk powder.
For radionuclide i, li (d�1) is a decay constant. As it is evidentthat a denominator in the equation (5) contains an exponentialfunction, calculation of index values takes account of the radionu-clide decay, such that {1-exp(-liT)}/li reflects the cumulativeradioactivity level. It is also assumed that once contaminated priorto the initial intake, no additional contaminations occur subse-quently in food. Factor fi is the postulated radioactivity level ofcoexisting radionuclide i relative to that of indicator radionu-clide(s). Namely, fi is set as 1 for indicator radionuclide(s) that arerepresentative of each radionuclide group. By the use of fi values,RCIL calculated only from the concentration of indicator radionu-clide(s) can take into account the contribution of other coexistingradionuclides to the committed dose.
Factor CFij (mSv/Bq) is a conversion factor (CF) for radionuclide iand age group j. CF is a committed dose per unit intake, and can beused as an ingestion dose coefficient to convert the radioactivitylevel (Bq) into a committed dose (mSv). CF for a committed effec-tive dose is the sum of that for committed tissue or organ equiva-lent doses eachmultiplied by tissue weighting factors. Whereas theInternational Commission on Radiological Protection (ICRP) hasprovided age-specific CF values each for six age groups (ICRP,1992b), only three groups (infants, children and adults) weredealt to calculate RCIL (Suga and Ichikawa, 2000). CF values weretaken from those listed in ICRP Publication 67 (ICRP, 1992b) and
International Basic Safety Standards (BSS) published in 1996 by theInternational Atomic Energy Agency (IAEA) (IAEA, 1996), with theexception of those for 133I, 134I and 135I. CF for a committed equiv-alent dose to the thyroid posed by ingestion of 133I, 134I and 135I foradults was calculated using the LUDEP 2.0 program (Jarvis et al.,1996). This resulting value was then approximated to calculatesuch CF for infants and children, providing the same ratio ofa committed equivalent dose to the thyroid in adults to that ininfants or children by the ingestion of 132I whose half-life is akin tohalf-lives of 133I, 134I and 135I.
As far as IL is concerned, ICRP issued Publication 40 (ICRP,1984), and proposed the concept of upper and lower limits onthe dose level in the first one year after a nuclear accident.Implementation of measures would largely be necessary aboveupper limits, but would not be justified below lower limits. Prac-tical IL values should be set in between. Lower and upper limitsrecommended for food regulations were effective doses of 5 and50 mSv, and equivalent doses of 50 and 500 mSv to any selectivelyexposed individual organ or tissue (n.b., values not limited for thethyroid), respectively. In 1988, the World Health Organization(WHO) indicated that an effective dose of 5 mSv/y and an equiv-alent dose to the thyroid of 50 mSv/y are IL for food regulations(WHO, 1988). In 1992, ICRP in its Publication 63 (ICRP, 1992a)recommended that an effective dose of 10 mSv/y for any singlefoodstuff is IL that would almost always be justified, where opti-mized concrete values are in the range of 1e10 kBq/kg for b/gemitters and 10e100 Bq/kg for a emitters. Here, 1 kBq/kg (lowerlimit for b/g emitters) correspond to 5.5 mSv/y, given the worldmean annual food intake (excluding drinking water) of 550 kg byan adult (WHO, 1988) and a rough CF value of 1 � 10�5 mSv/Bq(FSC, 2011a). The same holds true for 10 Bq/kg (lower limit fora emitters) given a rough CF value of 1 � 10�3 mSv/Bq (FSC,2011a). Taking these situations into account, NSC decided toemploy values on the considerably safe side, namely, a committedequivalent dose to the thyroid of 50 mSv/y for radioiodines, anda committed effective dose of 5 mSv/y each for radiocesiums,uranium, plutonium and other transuranic a emitters.
Finally, RCILjk is the RCIL of indicator radionuclide(s) for agegroup j and food category k. To yield the index value, the calculatedRCIL valueminimal among infants, children and adults for each foodcategory was rounded off to a smaller value on the safe side (Sugaand Ichikawa, 2000). Further details of approaches taken to calcu-late the index values for radioiodines and radiocesiums are providedbelow, for which parameters used are listed in Tables 4 and 5.
4.1.1. RadioiodinesA radioiodine group consists of 131I, 132I, 133I, 134I, 135I and 132Te.
Of these, 131I is an indicator radionuclide (i.e., fi¼ 1 for 131I). fi valuesfor coexisting radionuclides were calculated as the ratio of eachsimulated radioactive concentration inside the reactor at 0.5 d aftershutdown of the pressurized water reactor (PWR) where fuelhaving an initial concentration of 3% is burned at 30 GWd/ton.ORIGEN2 code (Croff, 1980) was used to simulate concentrations ofeach radionuclide, and a time point of 0.5 d was chosen to excludeshort-lived radionuclides that are unlikely to contaminate food(Suga and Ichikawa, 2000).
As mentioned in Section 4.1, a committed equivalent dose to thethyroid of 50 mSv/y was employed. Two-thirds were then assignedas IL to three food categories (drinking water, milk, and vegetablesexcluding corms, tubers and roots) on a per capita basis (i.e., IL/G ¼ 33.3 mSv/3 ¼ 11.1 mSv/food category) (NSC, 1980). Corms,tubers and roots growing underground should have less chance ofbeing contaminated through the air than other vegetables, andwere therefore excluded from the category of vegetables. The restone-third (i.e., 16.7 mSv) was assigned to other foods (i.e., seafood,
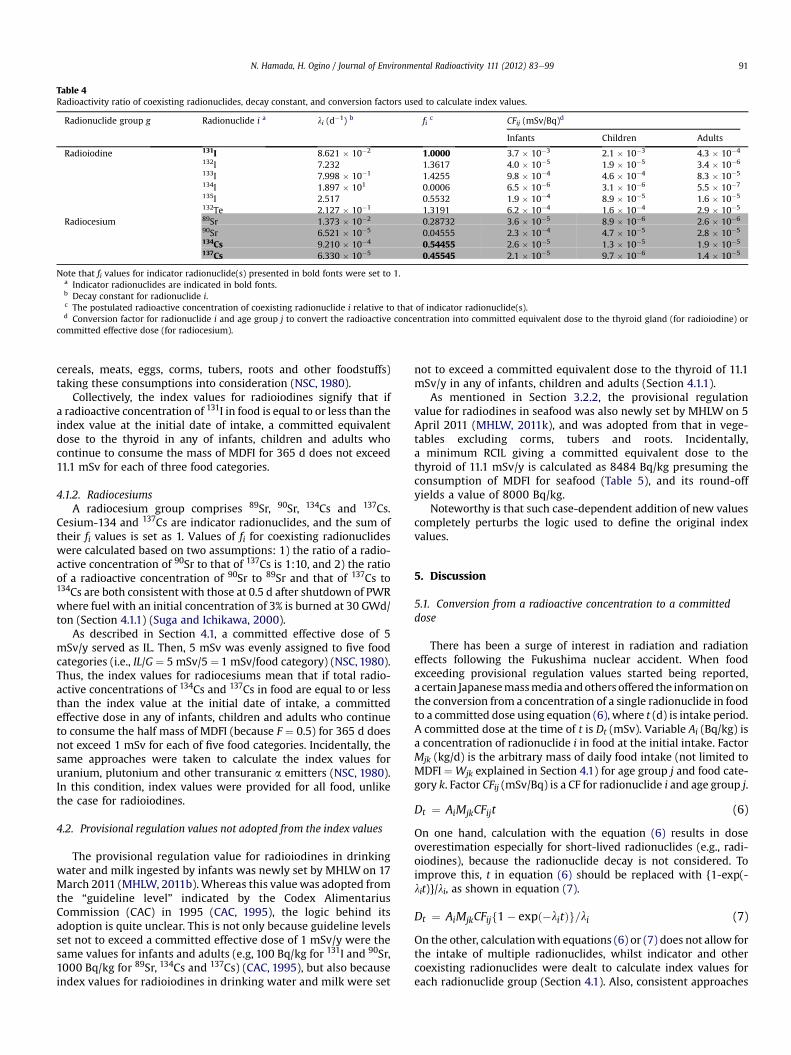
Table 4Radioactivity ratio of coexisting radionuclides, decay constant, and conversion factors used to calculate index values.
Radionuclide group g Radionuclide i a li (d�1) b fic CFij (mSv/Bq)d
Infants Children Adults
Radioiodine 131I 8.621 � 10�2 1.0000 3.7 � 10�3 2.1 � 10�3 4.3 � 10�4
132I 7.232 1.3617 4.0 � 10�5 1.9 � 10�5 3.4 � 10�6
133I 7.998 � 10�1 1.4255 9.8 � 10�4 4.6 � 10�4 8.3 � 10�5
134I 1.897 � 101 0.0006 6.5 � 10�6 3.1 � 10�6 5.5 � 10�7
135I 2.517 0.5532 1.9 � 10�4 8.9 � 10�5 1.6 � 10�5
132Te 2.127 � 10�1 1.3191 6.2 � 10�4 1.6 � 10�4 2.9 � 10�5
Radiocesium 89Sr 1.373 � 10�2 0.28732 3.6 � 10�5 8.9 � 10�6 2.6 � 10�6
90Sr 6.521 � 10�5 0.04555 2.3 � 10�4 4.7 � 10�5 2.8 � 10�5
134Cs 9.210 � 10�4 0.54455 2.6 � 10�5 1.3 � 10�5 1.9 � 10�5
137Cs 6.330 � 10�5 0.45545 2.1 � 10�5 9.7 � 10�6 1.4 � 10�5
Note that fi values for indicator radionuclide(s) presented in bold fonts were set to 1.a Indicator radionuclides are indicated in bold fonts.b Decay constant for radionuclide i.c The postulated radioactive concentration of coexisting radionuclide i relative to that of indicator radionuclide(s).d Conversion factor for radionuclide i and age group j to convert the radioactive concentration into committed equivalent dose to the thyroid gland (for radioiodine) or
committed effective dose (for radiocesium).
N. Hamada, H. Ogino / Journal of Environmental Radioactivity 111 (2012) 83e99 91
cereals, meats, eggs, corms, tubers, roots and other foodstuffs)taking these consumptions into consideration (NSC, 1980).
Collectively, the index values for radioiodines signify that ifa radioactive concentration of 131I in food is equal to or less than theindex value at the initial date of intake, a committed equivalentdose to the thyroid in any of infants, children and adults whocontinue to consume the mass of MDFI for 365 d does not exceed11.1 mSv for each of three food categories.
4.1.2. RadiocesiumsA radiocesium group comprises 89Sr, 90Sr, 134Cs and 137Cs.
Cesium-134 and 137Cs are indicator radionuclides, and the sum oftheir fi values is set as 1. Values of fi for coexisting radionuclideswere calculated based on two assumptions: 1) the ratio of a radio-active concentration of 90Sr to that of 137Cs is 1:10, and 2) the ratioof a radioactive concentration of 90Sr to 89Sr and that of 137Cs to134Cs are both consistent with those at 0.5 d after shutdown of PWRwhere fuel with an initial concentration of 3% is burned at 30 GWd/ton (Section 4.1.1) (Suga and Ichikawa, 2000).
As described in Section 4.1, a committed effective dose of 5mSv/y served as IL. Then, 5 mSv was evenly assigned to five foodcategories (i.e., IL/G ¼ 5 mSv/5 ¼ 1 mSv/food category) (NSC, 1980).Thus, the index values for radiocesiums mean that if total radio-active concentrations of 134Cs and 137Cs in food are equal to or lessthan the index value at the initial date of intake, a committedeffective dose in any of infants, children and adults who continueto consume the half mass of MDFI (because F ¼ 0.5) for 365 d doesnot exceed 1 mSv for each of five food categories. Incidentally, thesame approaches were taken to calculate the index values foruranium, plutonium and other transuranic a emitters (NSC, 1980).In this condition, index values were provided for all food, unlikethe case for radioiodines.
4.2. Provisional regulation values not adopted from the index values
The provisional regulation value for radioiodines in drinkingwater and milk ingested by infants was newly set by MHLW on 17March 2011 (MHLW, 2011b). Whereas this value was adopted fromthe “guideline level” indicated by the Codex AlimentariusCommission (CAC) in 1995 (CAC, 1995), the logic behind itsadoption is quite unclear. This is not only because guideline levelsset not to exceed a committed effective dose of 1 mSv/y were thesame values for infants and adults (e.g, 100 Bq/kg for 131I and 90Sr,1000 Bq/kg for 89Sr, 134Cs and 137Cs) (CAC, 1995), but also becauseindex values for radioiodines in drinking water and milk were set
not to exceed a committed equivalent dose to the thyroid of 11.1mSv/y in any of infants, children and adults (Section 4.1.1).
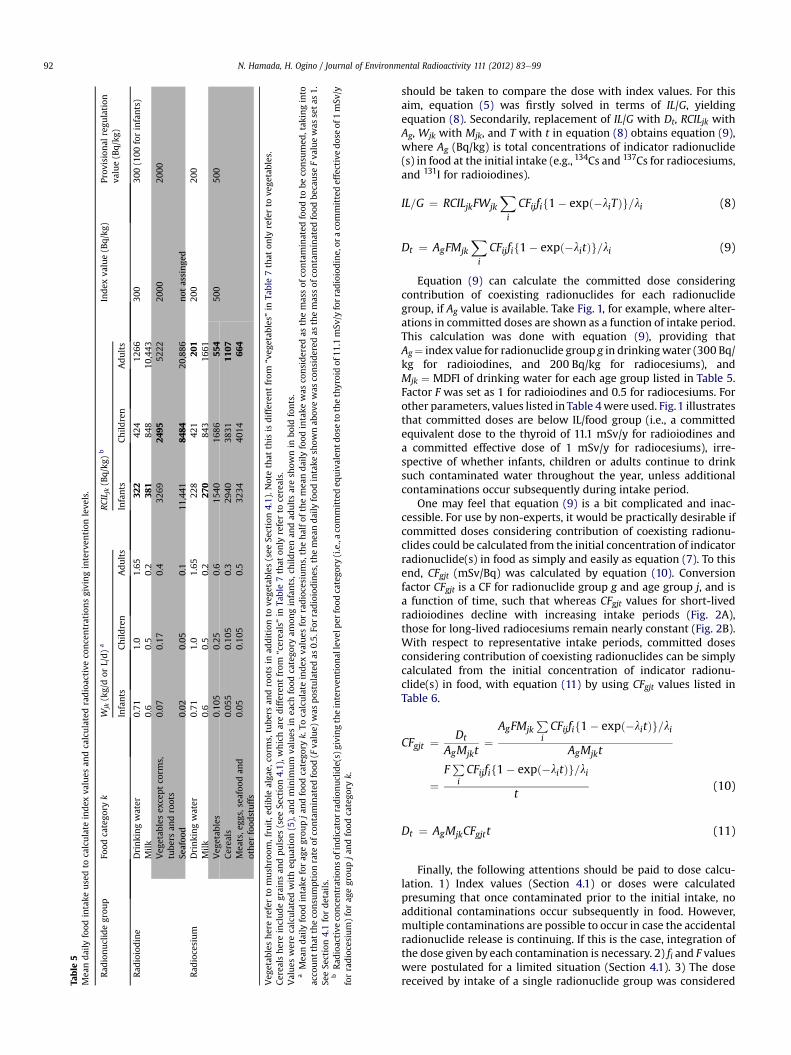
As mentioned in Section 3.2.2, the provisional regulationvalue for radiodines in seafood was also newly set by MHLW on 5April 2011 (MHLW, 2011k), and was adopted from that in vege-tables excluding corms, tubers and roots. Incidentally,a minimum RCIL giving a committed equivalent dose to thethyroid of 11.1 mSv/y is calculated as 8484 Bq/kg presuming theconsumption of MDFI for seafood (Table 5), and its round-offyields a value of 8000 Bq/kg.
Noteworthy is that such case-dependent addition of new valuescompletely perturbs the logic used to define the original indexvalues.
5. Discussion
5.1. Conversion from a radioactive concentration to a committeddose
There has been a surge of interest in radiation and radiationeffects following the Fukushima nuclear accident. When foodexceeding provisional regulation values started being reported,a certain Japanesemassmedia andothers offered the informationonthe conversion from a concentration of a single radionuclide in foodto a committed dose using equation (6), where t (d) is intake period.A committed dose at the time of t is Dt (mSv). Variable Ai (Bq/kg) isa concentration of radionuclide i in food at the initial intake. FactorMjk (kg/d) is the arbitrary mass of daily food intake (not limited toMDFI ¼ Wjk explained in Section 4.1) for age group j and food cate-gory k. Factor CFij (mSv/Bq) is a CF for radionuclide i and age group j.
Dt ¼ AiMjkCFijt (6)
On one hand, calculation with the equation (6) results in doseoverestimation especially for short-lived radionuclides (e.g., radi-oiodines), because the radionuclide decay is not considered. Toimprove this, t in equation (6) should be replaced with {1-exp(-lit)}/li, as shown in equation (7).
Dt ¼ AiMjkCFijf1� expð�litÞg=li (7)
On the other, calculationwith equations (6) or (7) does not allow forthe intake of multiple radionuclides, whilst indicator and othercoexisting radionuclides were dealt to calculate index values foreach radionuclide group (Section 4.1). Also, consistent approaches
Table
5Mea
ndaily
food
intake
usedto
calculate
index
values
andcalculatedradioactive
concentrationsgivinginterven
tion
leve
ls.
Rad
ionuclidegrou
pFo
odcatego
ryk
Wjk(kg/dor
L/d)a
RCIL jk(Bq/kg
)b
Index
value(Bq/kg
)Prov
isional
regu
lation
value(Bq/kg
)Infants
Child
ren
Adults
Infants
Child
ren
Adults
Rad
ioiodine
Drinkingwater
0.71
1.0
1.65
322
424
1266
300
300(100
forinfants)
Milk
0.6
0.5
0.2
381
848
10,443
Veg
etab
lesex
ceptco
rms,
tube
rsan
droots
0.07
0.17
0.4
3269
2495
5222
2000
2000
Seafoo
d0.02
0.05
0.1
11,441
8484
20,886
not
assinge
dRad
iocesium
Drinkingwater
0.71
1.0
1.65
228
421
201
200
200
Milk
0.6
0.5
0.2
270
843
1661
Veg
etab
les
0.10
50.25
0.6
1540
1686
554
500
500
Cerea
ls0.05
50.10
50.3
2940
3831
1107
Mea
ts,e
ggs,seafoo
dan
dother
food
stuffs
0.05
0.10
50.5
3234
4014
664
Veg
etab
lesherereferto
mush
room
,fruit,e
dible
alga
e,co
rms,tube
rsan
drootsin
additionto
vege
tables
(see
Section4.1).N
otethat
this
isdifferentfrom
“veg
etab
les”
inTa
ble7that
only
referto
vege
tables.
Cerea
lshereincludegrainsan
dpulses
(see
Section4.1),w
hicharedifferentfrom
“cerea
ls”in
Table7that
only
referto
cereals.
Values
werecalculatedwitheq
uation(5),an
dminim
um
values
inea
chfood
catego
ryam
onginfants,c
hild
renan
dad
ultsaresh
ownin
bold
fonts.
aMea
ndaily
food
intake
forag
egrou
pja
ndfood
catego
ryk.
Tocalculate
index
values
forradiocesiums,thehalfof
themea
ndaily
food
intake
was
considered
asthemassof
contaminated
food
tobe
consu
med
,tak
inginto
acco
untthat
theco
nsu
mption
rate
ofco
ntaminated
food
(Fva
lue)
was
postulatedas
0.5.
Forradioiodines,themea
ndaily
food
intake
show
nab
ovewas
considered
asthemassof
contaminated
food
because
Fva
luewas
setas
1.Se
eSe
ction4.1fordetails.
bRad
ioactive
concentrationsof
indicator
radionuclide(s)
givingtheinterven
tion
alleve
lper
food
catego
ry(i.e.,aco
mmittedeq
uivalen
tdoseto
thethyroidof
11.1
mSv
/yforradioiodine,or
aco
mmittedeffectivedoseof
1mSv
/yforradiocesium)forag
egrou
pjan
dfood
catego
ryk.
N. Hamada, H. Ogino / Journal of Environmental Radioactivity 111 (2012) 83e9992
should be taken to compare the dose with index values. For thisaim, equation (5) was firstly solved in terms of IL/G, yieldingequation (8). Secondarily, replacement of IL/G with Dt, RCILjk withAg, Wjk with Mjk, and T with t in equation (8) obtains equation (9),where Ag (Bq/kg) is total concentrations of indicator radionuclide(s) in food at the initial intake (e.g., 134Cs and 137Cs for radiocesiums,and 131I for radioiodines).
IL=G ¼ RCILjkFWjk
Xi
CFijfif1� expð�liTÞg=li (8)
Dt ¼ AgFMjk
Xi
CFijfif1� expð�litÞg=li (9)
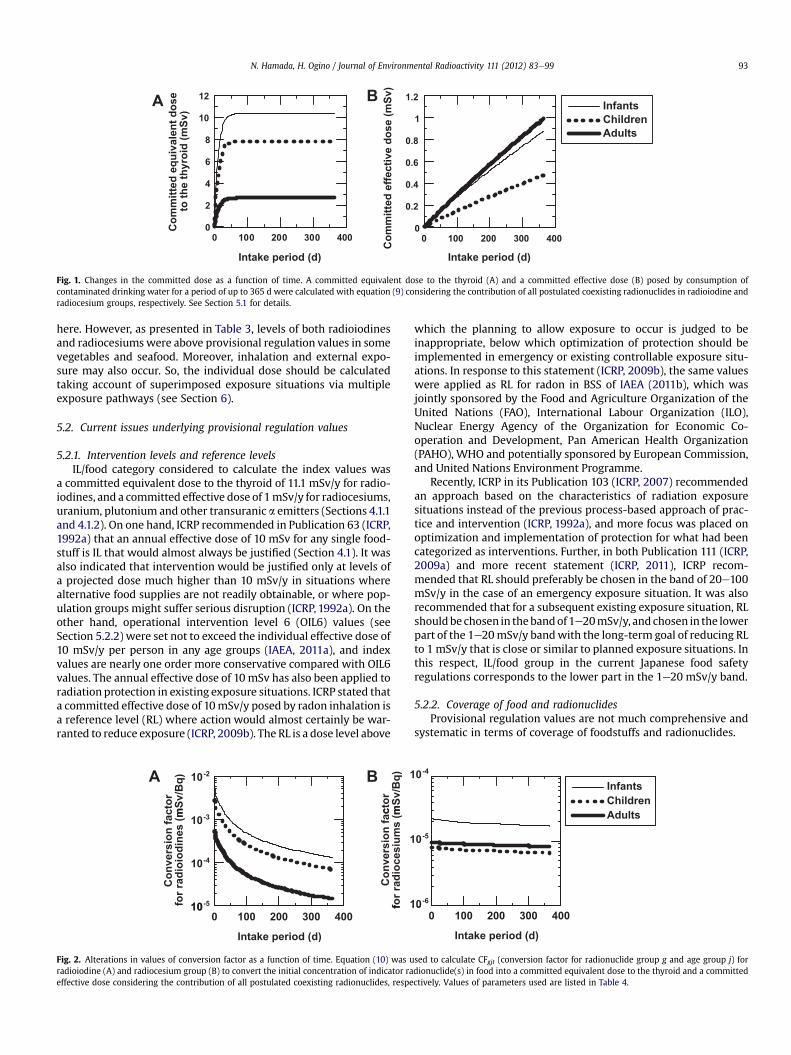
Equation (9) can calculate the committed dose consideringcontribution of coexisting radionuclides for each radionuclidegroup, if Ag value is available. Take Fig. 1, for example, where alter-ations in committed doses are shown as a function of intake period.This calculation was done with equation (9), providing thatAg¼ index value for radionuclide group g in drinkingwater (300 Bq/kg for radioiodines, and 200 Bq/kg for radiocesiums), andMjk ¼ MDFI of drinking water for each age group listed in Table 5.Factor F was set as 1 for radioiodines and 0.5 for radiocesiums. Forother parameters, values listed in Table 4were used. Fig.1 illustratesthat committed doses are below IL/food group (i.e., a committedequivalent dose to the thyroid of 11.1 mSv/y for radioiodines anda committed effective dose of 1 mSv/y for radiocesiums), irre-spective of whether infants, children or adults continue to drinksuch contaminated water throughout the year, unless additionalcontaminations occur subsequently during intake period.
One may feel that equation (9) is a bit complicated and inac-cessible. For use by non-experts, it would be practically desirable ifcommitted doses considering contribution of coexisting radionu-clides could be calculated from the initial concentration of indicatorradionuclide(s) in food as simply and easily as equation (7). To thisend, CFgjt (mSv/Bq) was calculated by equation (10). Conversionfactor CFgjt is a CF for radionuclide group g and age group j, and isa function of time, such that whereas CFgjt values for short-livedradioiodines decline with increasing intake periods (Fig. 2A),those for long-lived radiocesiums remain nearly constant (Fig. 2B).With respect to representative intake periods, committed dosesconsidering contribution of coexisting radionuclides can be simplycalculated from the initial concentration of indicator radionu-clide(s) in food, with equation (11) by using CFgjt values listed inTable 6.
CFgjt ¼ Dt
AgMjkt¼
AgFMjkPiCFijfif1� expð�litÞg=li
AgMjkt
¼FPiCFijfif1� expð�litÞg=li
t(10)
Dt ¼ AgMjkCFgjtt (11)
Finally, the following attentions should be paid to dose calcu-lation. 1) Index values (Section 4.1) or doses were calculatedpresuming that once contaminated prior to the initial intake, noadditional contaminations occur subsequently in food. However,multiple contaminations are possible to occur in case the accidentalradionuclide release is continuing. If this is the case, integration ofthe dose given by each contamination is necessary. 2) fi and F valueswere postulated for a limited situation (Section 4.1). 3) The dosereceived by intake of a single radionuclide group was considered
0
0.2
0.4
0.6
0.8
1
1.2
0 100 200 300 400
Infants
Children
Adults
Co
mm
itted
effective d
ose (m
Sv)
Intake period (d)
0
2
4
6
8
10
12
0 100 200 300 400
Co
mm
itted
eq
uivalen
t d
ose
to
th
e th
yro
id
(m
Sv)
Intake period (d)
BA
Fig. 1. Changes in the committed dose as a function of time. A committed equivalent dose to the thyroid (A) and a committed effective dose (B) posed by consumption ofcontaminated drinking water for a period of up to 365 d were calculated with equation (9) considering the contribution of all postulated coexisting radionuclides in radioiodine andradiocesium groups, respectively. See Section 5.1 for details.
N. Hamada, H. Ogino / Journal of Environmental Radioactivity 111 (2012) 83e99 93
here. However, as presented in Table 3, levels of both radioiodinesand radiocesiumswere above provisional regulation values in somevegetables and seafood. Moreover, inhalation and external expo-sure may also occur. So, the individual dose should be calculatedtaking account of superimposed exposure situations via multipleexposure pathways (see Section 6).
5.2. Current issues underlying provisional regulation values
5.2.1. Intervention levels and reference levelsIL/food category considered to calculate the index values was
a committed equivalent dose to the thyroid of 11.1 mSv/y for radio-iodines, and a committed effective dose of 1mSv/y for radiocesiums,uranium, plutonium and other transuranic a emitters (Sections 4.1.1and 4.1.2). On one hand, ICRP recommended in Publication 63 (ICRP,1992a) that an annual effective dose of 10 mSv for any single food-stuff is IL that would almost always be justified (Section 4.1). It wasalso indicated that intervention would be justified only at levels ofa projected dose much higher than 10 mSv/y in situations wherealternative food supplies are not readily obtainable, or where pop-ulation groups might suffer serious disruption (ICRP, 1992a). On theother hand, operational intervention level 6 (OIL6) values (seeSection 5.2.2) were set not to exceed the individual effective dose of10 mSv/y per person in any age groups (IAEA, 2011a), and indexvalues are nearly one order more conservative compared with OIL6values. The annual effective dose of 10 mSv has also been applied toradiation protection in existing exposure situations. ICRP stated thata committed effective dose of 10mSv/y posed by radon inhalation isa reference level (RL) where action would almost certainly be war-ranted to reduce exposure (ICRP, 2009b). The RL is a dose level above
1
cto
r
mS
v/B
q)
10-2
to
r
mS
v/B
q) BA
1
1
Co
nv
ers
io
n fac
fo
r ra
dio
ce
siu
ms
(m
10-5
10-4
10-3
Co
nv
ers
io
n fa
c
fo
r rad
io
io
din
es (m
1f10
0 100 200 300 400
Intake period (d)
Fig. 2. Alterations in values of conversion factor as a function of time. Equation (10) was uradioiodine (A) and radiocesium group (B) to convert the initial concentration of indicator raeffective dose considering the contribution of all postulated coexisting radionuclides, respe
which the planning to allow exposure to occur is judged to beinappropriate, below which optimization of protection should beimplemented in emergency or existing controllable exposure situ-ations. In response to this statement (ICRP, 2009b), the same valueswere applied as RL for radon in BSS of IAEA (2011b), which wasjointly sponsored by the Food and Agriculture Organization of theUnited Nations (FAO), International Labour Organization (ILO),Nuclear Energy Agency of the Organization for Economic Co-operation and Development, Pan American Health Organization(PAHO), WHO and potentially sponsored by European Commission,and United Nations Environment Programme.
Recently, ICRP in its Publication 103 (ICRP, 2007) recommendedan approach based on the characteristics of radiation exposuresituations instead of the previous process-based approach of prac-tice and intervention (ICRP, 1992a), and more focus was placed onoptimization and implementation of protection for what had beencategorized as interventions. Further, in both Publication 111 (ICRP,2009a) and more recent statement (ICRP, 2011), ICRP recom-mended that RL should preferably be chosen in the band of 20e100mSv/y in the case of an emergency exposure situation. It was alsorecommended that for a subsequent existing exposure situation, RLshouldbe chosen in thebandof 1e20mSv/y, andchosen in the lowerpart of the 1e20mSv/y bandwith the long-term goal of reducing RLto 1 mSv/y that is close or similar to planned exposure situations. Inthis respect, IL/food group in the current Japanese food safetyregulations corresponds to the lower part in the 1e20 mSv/y band.
5.2.2. Coverage of food and radionuclidesProvisional regulation values are not much comprehensive and
systematic in terms of coverage of foodstuffs and radionuclides.
0-4
Infants
Children
0-6
0-5
Adults
0
0 100 200 300 400
Intake period (d)
sed to calculate CFgjt (conversion factor for radionuclide group g and age group j) fordionuclide(s) in food into a committed equivalent dose to the thyroid and a committedctively. Values of parameters used are listed in Table 4.
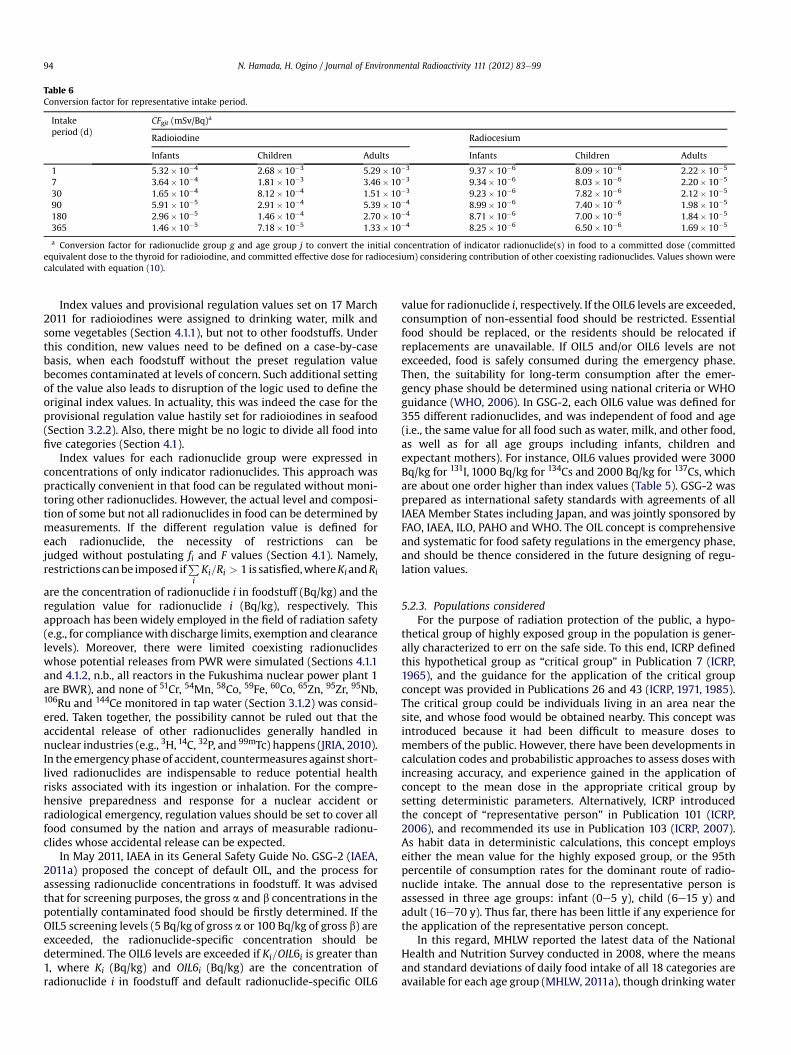
Table 6Conversion factor for representative intake period.
Intakeperiod (d)
CFgjt (mSv/Bq)a
Radioiodine Radiocesium
Infants Children Adults Infants Children Adults
1 5.32� 10�4 2.68� 10�3 5.29� 10�3 9.37� 10�6 8.09� 10�6 2.22� 10�5
7 3.64� 10�4 1.81� 10�3 3.46� 10�3 9.34� 10�6 8.03� 10�6 2.20� 10�5
30 1.65� 10�4 8.12� 10�4 1.51� 10�3 9.23� 10�6 7.82� 10�6 2.12� 10�5
90 5.91� 10�5 2.91� 10�4 5.39� 10�4 8.99� 10�6 7.40� 10�6 1.98� 10�5
180 2.96� 10�5 1.46� 10�4 2.70� 10�4 8.71� 10�6 7.00� 10�6 1.84� 10�5
365 1.46� 10�5 7.18� 10�5 1.33� 10�4 8.25� 10�6 6.50� 10�6 1.69� 10�5
a Conversion factor for radionuclide group g and age group j to convert the initial concentration of indicator radionuclide(s) in food to a committed dose (committedequivalent dose to the thyroid for radioiodine, and committed effective dose for radiocesium) considering contribution of other coexisting radionuclides. Values shown werecalculated with equation (10).
N. Hamada, H. Ogino / Journal of Environmental Radioactivity 111 (2012) 83e9994
Index values and provisional regulation values set on 17 March2011 for radioiodines were assigned to drinking water, milk andsome vegetables (Section 4.1.1), but not to other foodstuffs. Underthis condition, new values need to be defined on a case-by-casebasis, when each foodstuff without the preset regulation valuebecomes contaminated at levels of concern. Such additional settingof the value also leads to disruption of the logic used to define theoriginal index values. In actuality, this was indeed the case for theprovisional regulation value hastily set for radioiodines in seafood(Section 3.2.2). Also, there might be no logic to divide all food intofive categories (Section 4.1).
Index values for each radionuclide group were expressed inconcentrations of only indicator radionuclides. This approach waspractically convenient in that food can be regulated without moni-toring other radionuclides. However, the actual level and composi-tion of some but not all radionuclides in food can be determined bymeasurements. If the different regulation value is defined foreach radionuclide, the necessity of restrictions can bejudged without postulating fi and F values (Section 4.1). Namely,restrictions canbe imposed if
PiKi=Ri > 1 is satisfied,whereKiandRi
are the concentration of radionuclide i in foodstuff (Bq/kg) and theregulation value for radionuclide i (Bq/kg), respectively. Thisapproach has been widely employed in the field of radiation safety(e.g., for compliancewith discharge limits, exemption and clearancelevels). Moreover, there were limited coexisting radionuclideswhose potential releases from PWR were simulated (Sections 4.1.1and 4.1.2, n.b., all reactors in the Fukushima nuclear power plant 1are BWR), and none of 51Cr, 54Mn, 58Co, 59Fe, 60Co, 65Zn, 95Zr, 95Nb,106Ru and 144Ce monitored in tap water (Section 3.1.2) was consid-ered. Taken together, the possibility cannot be ruled out that theaccidental release of other radionuclides generally handled innuclear industries (e.g., 3H, 14C, 32P, and 99mTc) happens (JRIA, 2010).In the emergency phase of accident, countermeasures against short-lived radionuclides are indispensable to reduce potential healthrisks associated with its ingestion or inhalation. For the compre-hensive preparedness and response for a nuclear accident orradiological emergency, regulation values should be set to cover allfood consumed by the nation and arrays of measurable radionu-clides whose accidental release can be expected.
In May 2011, IAEA in its General Safety Guide No. GSG-2 (IAEA,2011a) proposed the concept of default OIL, and the process forassessing radionuclide concentrations in foodstuff. It was advisedthat for screening purposes, the gross a and b concentrations in thepotentially contaminated food should be firstly determined. If theOIL5 screening levels (5 Bq/kg of gross a or 100 Bq/kg of gross b) areexceeded, the radionuclide-specific concentration should bedetermined. The OIL6 levels are exceeded if Ki=OIL6i is greater than1, where Ki (Bq/kg) and OIL6i (Bq/kg) are the concentration ofradionuclide i in foodstuff and default radionuclide-specific OIL6
value for radionuclide i, respectively. If the OIL6 levels are exceeded,consumption of non-essential food should be restricted. Essentialfood should be replaced, or the residents should be relocated ifreplacements are unavailable. If OIL5 and/or OIL6 levels are notexceeded, food is safely consumed during the emergency phase.Then, the suitability for long-term consumption after the emer-gency phase should be determined using national criteria or WHOguidance (WHO, 2006). In GSG-2, each OIL6 value was defined for355 different radionuclides, and was independent of food and age(i.e., the same value for all food such as water, milk, and other food,as well as for all age groups including infants, children andexpectant mothers). For instance, OIL6 values provided were 3000Bq/kg for 131I, 1000 Bq/kg for 134Cs and 2000 Bq/kg for 137Cs, whichare about one order higher than index values (Table 5). GSG-2 wasprepared as international safety standards with agreements of allIAEA Member States including Japan, and was jointly sponsored byFAO, IAEA, ILO, PAHO and WHO. The OIL concept is comprehensiveand systematic for food safety regulations in the emergency phase,and should be thence considered in the future designing of regu-lation values.
5.2.3. Populations consideredFor the purpose of radiation protection of the public, a hypo-
thetical group of highly exposed group in the population is gener-ally characterized to err on the safe side. To this end, ICRP definedthis hypothetical group as “critical group” in Publication 7 (ICRP,1965), and the guidance for the application of the critical groupconcept was provided in Publications 26 and 43 (ICRP, 1971, 1985).The critical group could be individuals living in an area near thesite, and whose food would be obtained nearby. This concept wasintroduced because it had been difficult to measure doses tomembers of the public. However, there have been developments incalculation codes and probabilistic approaches to assess doses withincreasing accuracy, and experience gained in the application ofconcept to the mean dose in the appropriate critical group bysetting deterministic parameters. Alternatively, ICRP introducedthe concept of “representative person” in Publication 101 (ICRP,2006), and recommended its use in Publication 103 (ICRP, 2007).As habit data in deterministic calculations, this concept employseither the mean value for the highly exposed group, or the 95thpercentile of consumption rates for the dominant route of radio-nuclide intake. The annual dose to the representative person isassessed in three age groups: infant (0e5 y), child (6e15 y) andadult (16e70 y). Thus far, there has been little if any experience forthe application of the representative person concept.
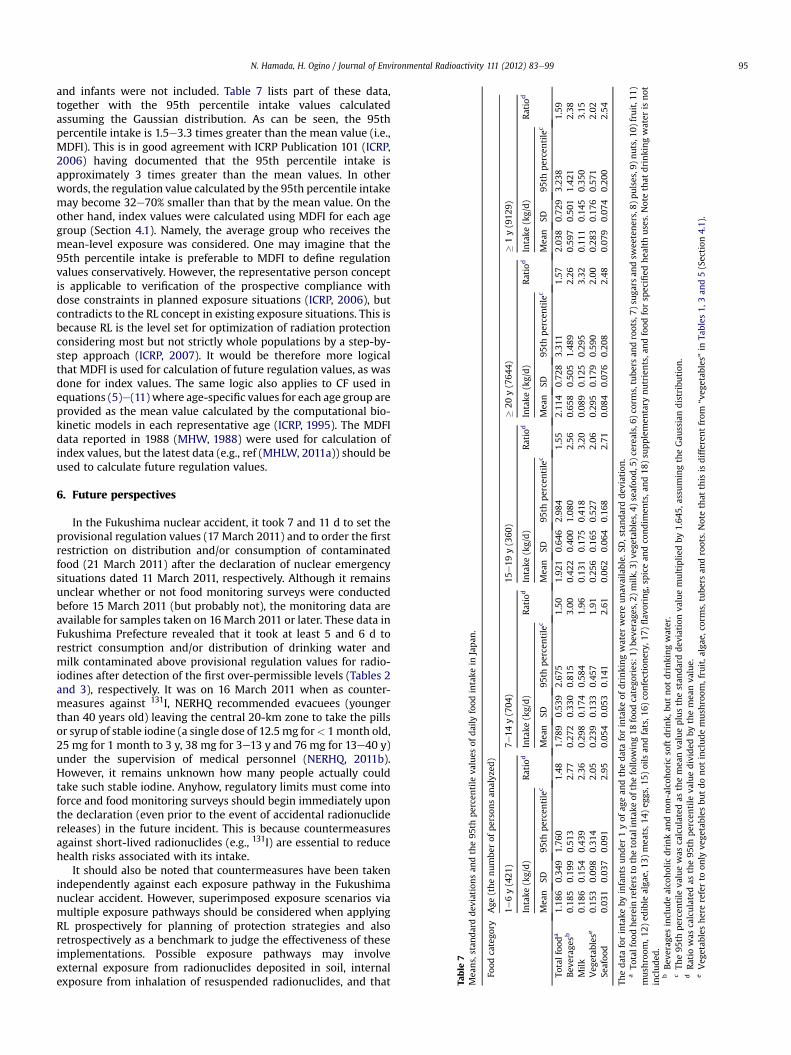
In this regard, MHLW reported the latest data of the NationalHealth and Nutrition Survey conducted in 2008, where the meansand standard deviations of daily food intake of all 18 categories areavailable for each age group (MHLW, 2011a), though drinking water
Table
7Mea
ns,stan
darddev
iation
san
dthe95
thpercentile
values
ofdaily
food
intake
inJapan
.
Food
catego
ryAge
(thenumbe
rof
personsan
alyz
ed)
1e6y(421
)7e
14y(704
)15
e19
y(360
)�
20y(764
4)�
1y(912
9)
Intake
(kg/d)
Ratio
dIntake
(kg/d)
Ratio
dIntake
(kg/d)
Ratio
dIntake
(kg/d)
Ratio
dIntake
(kg/d)
Ratio
d
Mea
nSD
95th
percentile
cMea
nSD
95th
percentile
cMea
nSD
95th
percentile
cMea
nSD
95th
percentile
cMea
nSD
95th
percentile
c
Totalfood
a1.18
60.34
91.76
01.48
1.78
90.53
92.67
51.50
1.92
10.64
62.98
41.55
2.11
40.72
83.31
11.57
2.03
80.72
93.23
81.59
Bev
erag
esb
0.18
50.19
90.51
32.77
0.27
20.33
00.81
53.00
0.42
20.40
01.08
02.56
0.65
80.50
51.48
92.26
0.59
70.50
11.42
12.38
Milk
0.18
60.15
40.43
92.36
0.29
80.17
40.58
41.96
0.13
10.17
50.41
83.20
0.08
90.12
50.29
53.32
0.11
10.14
50.35
03.15
Veg
etab
lese
0.15
30.09
80.31
42.05
0.23
90.13
30.45
71.91
0.25
60.16
50.52
72.06
0.29
50.17
90.59
02.00
0.28
30.17
60.57
12.02
Seafoo
d0.03
10.03
70.09
12.95
0.05
40.05
30.14
12.61
0.06
20.06
40.16
82.71
0.08
40.07
60.20
82.48
0.07
90.07
40.20
02.54
Thedataforintake
byinfants
under
1yof
agean
dthedataforintake
ofdrinkingwater
wereunav
ailable.
SD,standarddev
iation
.aTo
talfoo
dhereinrefers
tothetotalintake
ofthefollo
wing18
food
catego
ries:1
)be
verage
s,2)
milk
,3)ve
getables,4
)seafoo
d,5
)cereals,6)
corm
s,tube
rsan
droots,7)
suga
rsan
dsw
eeteners,8)
pulses,9
)nuts,1
0)fruit,1
1)mush
room
,12)
edible
alga
e,13
)mea
ts,1
4)eg
gs,1
5)oils
andfats,1
6)co
nfectionery,
17)flav
oring,
spicean
dco
ndim
ents,a
nd18
)su
pplemen
tary
nutrients,a
ndfood
forsp
ecified
hea
lthuses.Notethat
drinkingwater
isnot
included
.bBev
erag
esincludealco
holic
drinkan
dnon
-alcoh
oric
softdrink,
butnot
drinkingwater.
cTh
e95
thpercentile
valuewas
calculatedas
themea
nva
lueplusthestan
darddev
iation
valuemultiplie
dby
1.64
5,assu
mingtheGau
ssiandistribution
.dRatio
was
calculatedas
the95
thpercentile
valuedivided
bythemea
nva
lue.
eVeg
etab
lesherereferto
only
vege
tables
butdonot
includemush
room
,fruit,a
lgae
,corms,tube
rsan
droots.Notethat
this
isdifferentfrom
“veg
etab
les”
inTa
bles
1,3an
d5(Section
4.1).
N. Hamada, H. Ogino / Journal of Environmental Radioactivity 111 (2012) 83e99 95
and infants were not included. Table 7 lists part of these data,together with the 95th percentile intake values calculatedassuming the Gaussian distribution. As can be seen, the 95thpercentile intake is 1.5e3.3 times greater than the mean value (i.e.,MDFI). This is in good agreement with ICRP Publication 101 (ICRP,2006) having documented that the 95th percentile intake isapproximately 3 times greater than the mean values. In otherwords, the regulation value calculated by the 95th percentile intakemay become 32e70% smaller than that by the mean value. On theother hand, index values were calculated using MDFI for each agegroup (Section 4.1). Namely, the average group who receives themean-level exposure was considered. One may imagine that the95th percentile intake is preferable to MDFI to define regulationvalues conservatively. However, the representative person conceptis applicable to verification of the prospective compliance withdose constraints in planned exposure situations (ICRP, 2006), butcontradicts to the RL concept in existing exposure situations. This isbecause RL is the level set for optimization of radiation protectionconsidering most but not strictly whole populations by a step-by-step approach (ICRP, 2007). It would be therefore more logicalthat MDFI is used for calculation of future regulation values, as wasdone for index values. The same logic also applies to CF used inequations (5)e(11) where age-specific values for each age group areprovided as the mean value calculated by the computational bio-kinetic models in each representative age (ICRP, 1995). The MDFIdata reported in 1988 (MHW, 1988) were used for calculation ofindex values, but the latest data (e.g., ref (MHLW, 2011a)) should beused to calculate future regulation values.
6. Future perspectives
In the Fukushima nuclear accident, it took 7 and 11 d to set theprovisional regulation values (17 March 2011) and to order the firstrestriction on distribution and/or consumption of contaminatedfood (21 March 2011) after the declaration of nuclear emergencysituations dated 11 March 2011, respectively. Although it remainsunclear whether or not food monitoring surveys were conductedbefore 15 March 2011 (but probably not), the monitoring data areavailable for samples taken on 16 March 2011 or later. These data inFukushima Prefecture revealed that it took at least 5 and 6 d torestrict consumption and/or distribution of drinking water andmilk contaminated above provisional regulation values for radio-iodines after detection of the first over-permissible levels (Tables 2and 3), respectively. It was on 16 March 2011 when as counter-measures against 131I, NERHQ recommended evacuees (youngerthan 40 years old) leaving the central 20-km zone to take the pillsor syrup of stable iodine (a single dose of 12.5mg for< 1month old,25 mg for 1 month to 3 y, 38 mg for 3e13 y and 76 mg for 13e40 y)under the supervision of medical personnel (NERHQ, 2011b).However, it remains unknown how many people actually couldtake such stable iodine. Anyhow, regulatory limits must come intoforce and food monitoring surveys should begin immediately uponthe declaration (even prior to the event of accidental radionuclidereleases) in the future incident. This is because countermeasuresagainst short-lived radionuclides (e.g., 131I) are essential to reducehealth risks associated with its intake.
It should also be noted that countermeasures have been takenindependently against each exposure pathway in the Fukushimanuclear accident. However, superimposed exposure scenarios viamultiple exposure pathways should be considered when applyingRL prospectively for planning of protection strategies and alsoretrospectively as a benchmark to judge the effectiveness of theseimplementations. Possible exposure pathways may involveexternal exposure from radionuclides deposited in soil, internalexposure from inhalation of resuspended radionuclides, and that
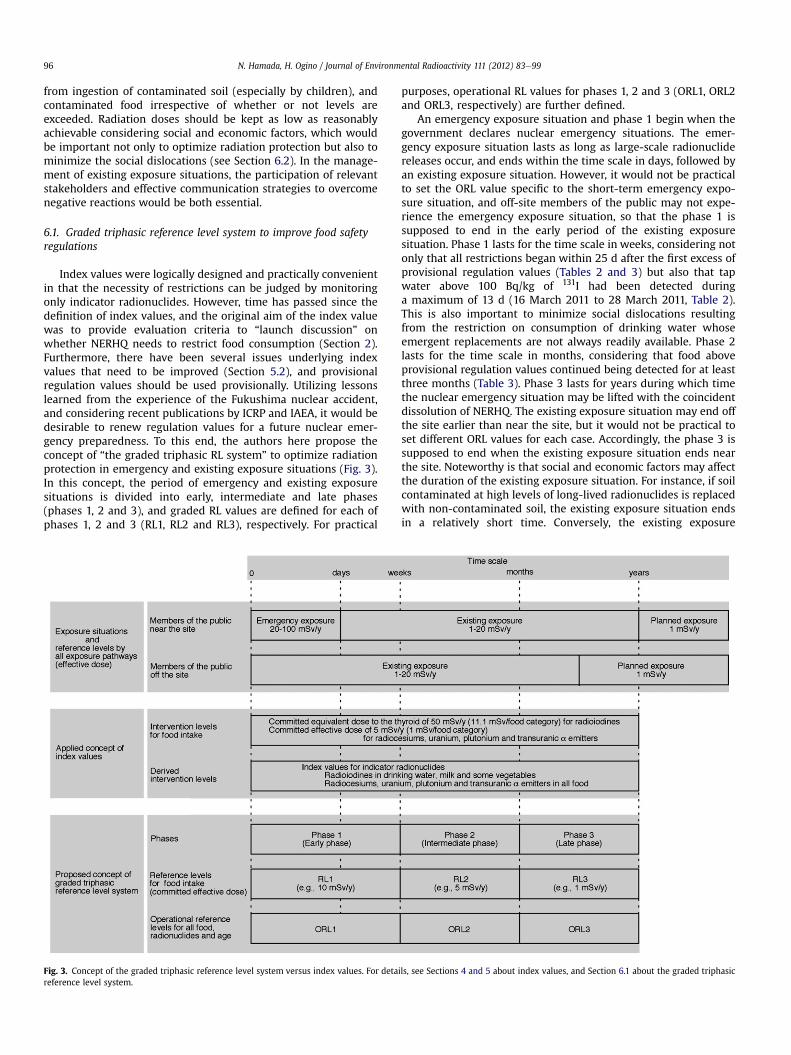
N. Hamada, H. Ogino / Journal of Environmental Radioactivity 111 (2012) 83e9996
from ingestion of contaminated soil (especially by children), andcontaminated food irrespective of whether or not levels areexceeded. Radiation doses should be kept as low as reasonablyachievable considering social and economic factors, which wouldbe important not only to optimize radiation protection but also tominimize the social dislocations (see Section 6.2). In the manage-ment of existing exposure situations, the participation of relevantstakeholders and effective communication strategies to overcomenegative reactions would be both essential.
6.1. Graded triphasic reference level system to improve food safetyregulations
Index values were logically designed and practically convenientin that the necessity of restrictions can be judged by monitoringonly indicator radionuclides. However, time has passed since thedefinition of index values, and the original aim of the index valuewas to provide evaluation criteria to “launch discussion” onwhether NERHQ needs to restrict food consumption (Section 2).Furthermore, there have been several issues underlying indexvalues that need to be improved (Section 5.2), and provisionalregulation values should be used provisionally. Utilizing lessonslearned from the experience of the Fukushima nuclear accident,and considering recent publications by ICRP and IAEA, it would bedesirable to renew regulation values for a future nuclear emer-gency preparedness. To this end, the authors here propose theconcept of “the graded triphasic RL system” to optimize radiationprotection in emergency and existing exposure situations (Fig. 3).In this concept, the period of emergency and existing exposuresituations is divided into early, intermediate and late phases(phases 1, 2 and 3), and graded RL values are defined for each ofphases 1, 2 and 3 (RL1, RL2 and RL3), respectively. For practical
Fig. 3. Concept of the graded triphasic reference level system versus index values. For detareference level system.
purposes, operational RL values for phases 1, 2 and 3 (ORL1, ORL2and ORL3, respectively) are further defined.
An emergency exposure situation and phase 1 begin when thegovernment declares nuclear emergency situations. The emer-gency exposure situation lasts as long as large-scale radionuclidereleases occur, and ends within the time scale in days, followed byan existing exposure situation. However, it would not be practicalto set the ORL value specific to the short-term emergency expo-sure situation, and off-site members of the public may not expe-rience the emergency exposure situation, so that the phase 1 issupposed to end in the early period of the existing exposuresituation. Phase 1 lasts for the time scale in weeks, considering notonly that all restrictions began within 25 d after the first excess ofprovisional regulation values (Tables 2 and 3) but also that tapwater above 100 Bq/kg of 131I had been detected duringa maximum of 13 d (16 March 2011 to 28 March 2011, Table 2).This is also important to minimize social dislocations resultingfrom the restriction on consumption of drinking water whoseemergent replacements are not always readily available. Phase 2lasts for the time scale in months, considering that food aboveprovisional regulation values continued being detected for at leastthree months (Table 3). Phase 3 lasts for years during which timethe nuclear emergency situation may be lifted with the coincidentdissolution of NERHQ. The existing exposure situation may end offthe site earlier than near the site, but it would not be practical toset different ORL values for each case. Accordingly, the phase 3 issupposed to end when the existing exposure situation ends nearthe site. Noteworthy is that social and economic factors may affectthe duration of the existing exposure situation. For instance, if soilcontaminated at high levels of long-lived radionuclides is replacedwith non-contaminated soil, the existing exposure situation endsin a relatively short time. Conversely, the existing exposure
ils, see Sections 4 and 5 about index values, and Section 6.1 about the graded triphasic
N. Hamada, H. Ogino / Journal of Environmental Radioactivity 111 (2012) 83e99 97
situation lasts according to the half-life of radionuclides, not onlyif such contaminated soil is not replaced, but also if members ofthe public (especially evacuees from the site) wish to reside insuch environment. In a subsequent planned exposure situation, aneffective dose posed by all exposure pathways is set as 1 mSv/yper person, and food safety regulations should no longer berequired. NERHQ should determine the duration of each phase(i.e., application period of each ORL values) according to the scaleand status of accident and food contamination. In the Fukushimanuclear accident, the example period of phase 1 may be the firstthree weeks after 11 March 2011. Food contaminated aboveprovisional regulation values have been detected at least for theinitial three months (Table 3), and stable cooling of reactors willhopefully be achieved by July 2011 (TEPCO, 2011b). So, theexample period of phase 2 may be the four months after the endof phase 1. The period of subsequent phase 3 depends on thesocial and economic factors as mentioned.
For RL values, an annual individual committed effective doseshould be consistently used for simplicity, as recently done by ICRP(2007) and IAEA (2011a). For emergency exposure situations, ICRPpreviously recommended an annual effective dose of 10 mSv/foodstuff as IL in Publication 63 (ICRP, 1992a). However, a totalcommitted effective dose of 190 mSv will be received by food givenconsumption of all 19 food categories (18 categories listed in thefootnote of Table 7, plus drinking water), so that an annual indi-vidual committed effective dose would be preferable to an annualcommitted effective dose per foodstuff. Recently, the band of20e100 mSv/y per person was recommended as RL in ICRP Publi-cation 103 (ICRP, 2007) for all countermeasures combined in anoverall protection strategy. Accordingly, a committed effective doseof 10 mSv/y per person (the one-tenth of the uppermost part of theband, 0.1 �100 mSv) is here proposed as the example RL1, and hasalso been used to calculate the OIL6 values (IAEA, 2011a). The “one-tenth” approach was taken to avoid excess of doses posed by allexposure pathways. For existing exposure situations, ICRP inPublication 103 (ICRP, 2007) recently recommended the band of1e20 mSv/y per person as RL. Here, a committed effective dose of 1mSv/y per person (the lowest part of the band, the one-tenth of RL1,and also the same level considered in CAC (1995)) is proposed asthe example RL3. Values of RL2 should be set in between RL1 andRL3 values. In this respect, the round-off value of these logarithmicmean is 3.2 mSv, but an effective dose of 5 mSv/y is used as thecurrent Japanese guideline level for commercial jet aircraft crewmembers in existing exposure situations (Yasuda et al., 2011). So, 5mSv/y is preferably proposed as the example RL2.
ORL values in each phase should be defined according to theapproaches taken to calculate OIL6 values (IAEA, 2011a), but shouldbe set not to exceed each corresponding RL value. For calculation,the latest MDFI data of all food (e.g., 19 categories) consumed by thenation in each age group should be used, and ORL values may beperiodically updated using the latest data. All measurable radio-nuclides whose accidental release can be expected (e.g., 355radionuclides as considered in OIL6 values (IAEA, 2011a)) should beconsidered, though this approach still requires the use of thepostulated ratio of some radionuclides whose measurement istechnically difficult (e.g., 90Sr). Resulting ORL1 and ORL3 valuesmaybe of the order similar to OIL6 values (IAEA, 2011a) and provisionalregulation values, respectively. Resulting ORL2 values are the half ofORL1 values and five-fold higher than ORL3 values. Like OIL6values, these ORL values are applicable to all age, food and radio-nuclides. Application of ORL values should follow the procedure ofOIL5 and OIL6 values. Namely, for screening purposes, the grossa and b concentrations should be firstly determined in the poten-tially contaminated food. If the screening levels (5 Bq/kg of grossa or 100 Bq/kg of gross b, i.e., OIL5 (IAEA, 2011a)) are exceeded,
individual radionuclide concentrations should be determined. ORLlevels are exceeded if
PiKi=ORLpi is greater than 1, where Ki and
ORLpi are the concentration of radionuclide i in foodstuff (Bq/kg)and the ORL value specific to phase p (i.e., p ¼ 1, 2 or 3) andradionuclide i, respectively. If ORL levels are not exceeded, food issafely consumed in any age groups in each phase. If exceeded,distribution and/or consumption should be restricted depending onthe obtainability of replacements.
6.2. Justification of the implemented intervention
The massive social dislocations occurred soon after thecommencement of restrictions on consumption of tap water inMarch 2011. Because of buy-up, bottled drinking water disappearedfrom grocery stores in many prefectures even where radionuclideconcentrations in tap water were below detectable levels (e.g.,Fukuoka and Osaka Prefectures). On 23 March 2011, the TokyoMetropolitan government decided to mitigate the social disloca-tions by distributing 240,000 bottles of drinking water for free toabout 80,000 infant residents of Tokyo Metropolis. The maximumlevel (210 Bq/kg of 131I) in tap water sampled in Tokyo on 22 March2011was above the provisional regulation value for infants (100 Bq/kg) but still below the index value (300 Bq/kg) (Tables 2 and 5). Asdescribed in Section 4.2, the logic behind the adoption of 100 Bq/kgis quite unclear. If all provisional regulation values were to faithfullyconform to logically designed index values, restrictions onconsumption of water would not be necessary except Fukushimaand Chiba Prefectures, and less social dislocations might beobserved. Incidentally, other food such as instant noodles and milkalso became sold out in many prefectures, and various false rumorswere circulated such that “drinking” povidone iodine gargle isa good countermeasure for radioiodines.
On 18 March 2011, MHLW assigned 13,000 counts/min as thescreening level for surface decontaminations of evacuees fromthe central 20-km and surrounding stay-indoor zones or otherswho have passed through these zones (MHLW, 2011d). However,only 3 d later, MHLW (2011f) hurriedly changed such screeninglevel to 100,000 counts/min by employing the internationalstandard indicated by IAEA (2006). This value corresponds to a g-ray dose rate of 1 mSv/h at 10 cm away from the skin (IAEA,2006), and has been applied as OIL4 in GSG-2 (IAEA, 2011a).Conversely, this was not the case for food safety regulations, andprovisional regulation values were not eased. Tap water above100 Bq/kg of 131I had been detected during �13 d (Section 6.1). Ifthe provisional regulation value were to employ the interna-tionally agreed OIL6 level for the emergency phase (IAEA, 2011a),such restrictions would not be required even in Fukushima andChiba Prefectures.
Taking into account radiological and social impacts, the justifi-cation of restrictions on consumption enforced following theFukushima nuclear accident needs to be verified by the futureretrospective reviewing of overall countermeasures.
7. Conclusions
Here we have outlined the food monitoring data of 24,685samples and the enforced restrictions, predicated on the infor-mation available as of 12 June 2011 (Section 3). All restrictions onconsumption of tap water began within 6 d after the first excess ofthe provisional regulation value for radioiodines (Table 2), but thecommencement of restrictions was concurrent with the massivesocial dislocations manifested as the buy-up of bottled water(Section 6.2). This may be attributable at least in part to illogicaladaptation of index values. The justification of enforced
N. Hamada, H. Ogino / Journal of Environmental Radioactivity 111 (2012) 83e9998
restrictions should be hereafter verified retrospectively. Allrestrictions were lifted within 51 d, whereas tap water exceeding100 Bq/kg of 131I had been detected for �13 d (Table 2). Radio-cesium levels in tap water were consistently far below the provi-sional regulation value. All restrictions on distribution and/orconsumption of milk, vegetables, seafood and tea leaf beganwithin25 d after the first excess of provisional regulation values (Table 3),but some of such restrictions have yet to be withdrawn inFukushima, Ibaraki, Tochigi, Chiba and Kanagawa Prefectures as of12 June 2011. Among all items, the maximum concentration of 131I(54,100 Bq/kg) was detected in spinach and the maximum totalconcentrations of 134Cs and 137Cs (82,000 Bq/kg) in kukitachi-na.Collectively, food contaminated above provisional regulationvalues must have been consumed for �3 weeks.
Wealsohavedemonstrated the logic and issuesbehind food safetyregulations implemented following the Fukushima nuclear accident(Sections 2, 4 and 5). Index values were logically designed and prac-tically convenient. However, food and radionuclides were notcomprehensively covered, and the same values were given to emer-gency and existing exposure situations. Also, different provisionalregulationvalues for radioiodines indrinkingwater andmilkwere setto infants and others. To address these issues, we have proposed theconceptof thegraded triphasicRL systemsoas tooptimize food safetyregulations in each of early, intermediate and late phases, whereexample phase-specific graded RL values and the logic for corre-sponding phase- and radionuclide-specific ORL values applicable toall food, radionuclides and age were provided (Section 6.1).
This paper was devoted to the aspect of food safety regulations,but the information on other aspects of the Fukushima nuclearaccident also starts to be reported (NERHQ, 2011a). The overalllessons learned from the experience of this accident should lead toan improved nuclear emergency preparedness all over the world.Comprehensively planned countermeasures against multipleexposure pathways should be taken immediately upon the occur-rence of the future incident.
Conflict of interest
The authors hereby declare that there are no conflicts of interest.
Acknowledgments
Thanks are due to Drs. Kazuo Yoshida, Takatoshi Hattori, Tosh-iyasu Iwasaki and other members in the Radiation Safety ResearchCenter of CRIEPI for comments on the manuscript.
References1
CAC, 1995. Codex General Standard for Contaminants and Toxins in Food andFeed. Codex Standard, Rome, Italy. http://www.codexalimentarius.net/download/standards/17/CXS_193e.pdf last accessed on 12 June 2011, pp.193e1995.
Citizen group for breast milk inspection and for mother and child supports, 2011.http://bonyuutyousa.net/, last accessed on 12 June 2011, (in Japanese).
Croff, A.G., 1980. ORIGEN2 e A Revised and Updated Version of the Oak RidgeIsotope Generation and Depletion Code. Tennessee, USA, ORNL-5621. http://www.ornl.gov/info/reports/1980/3445603828473.pdf last accessed on 12June 2011.
Eckerman, K.F., Ryman, J.C., 1993. External Exposure to Radionuclides in Air, Waterand Soil. United States Environmental Protection Agency. Federal GuidanceReport No. 12, EPA-402-R-93e081.
1 Titles in Japanese documents were translated by the authors when the Englishtitle was unavailable. For some Japanese documents, the provisional translatedversions were also available, but most of them provided less information than theoriginal Japanese versions. Therefore, the Japanese documents were preferablyreferenced here for most cases. For convenience, URL is provided for freelydownloadable documents.
FSC, 2011a. Emergency Report on Radioactive Nuclides. http://www.fsc.go.jp/sonota/emerg/iicho_danwa_20110408.pdf last accessed on 12 June 2011, (in Japanese).
FSC, 2011b. On the Occasion of Completing an Emergency Report on RadioactiveNuclides in Foods. http://www.fsc.go.jp/english/emerg/radiolog_iincho_danwa.pdf last accessed on 12 June 2011.
IAEA, 1996. International Basic Safety Standards for Protection Against IonizingRadiation and for the Safety of Radiation Sources. IAEA. Safety Series No. 115.
IAEA, 2006. Manual for First Responders to a Radiological Emergency. http://www-pub.iaea.org/MTCD/publications/PDF/epr_Firstresponder_web.pdf last accessedon 12 June 2011.
IAEA, 2011a. Criteria for Use in Preparedness and Response for a Nuclear orRadiological Emergency, General Safety Guide No. GSG-2. http://www-pub.iaea.org/MTCD/publications/PDF/Pub1467_web.pdf last accessed on 12 June 2011.
IAEA, 2011b. International Basic Safety Standards 2011 Edition, General SafetyRequirements Part 3, No. GSR Part 3. http://www-ns.iaea.org/committees/files/bsscomments/1035/DS379-Draft5.0-21Mar2011.pdf last accessed on 12 June 2011.
ICRP, 1965. Principles of Environmental Monitoring Related to the Handling ofRadioactive Materials. ICRP Publication 7. Ann. ICRP/ICRP Publication 7, 1965.
ICRP, 1971. Recommendations of the ICRP. ICRP Publication 26. Ann. ICRP 1(3).ICRP, 1984. Statement from the 1984 Meeting of the ICRP. ICRP Publication 40. Ann.
ICRP 14(2).ICRP, 1985. Principles of Monitoring for the Radiation Protection of the Public. ICRP
Publication 43. Ann. ICRP 15(1).ICRP, 1992a. Principles for Intervention for Protection of the Public in a Radiological
Emergency. ICRP Publication 63. Ann. ICRP 22(4).ICRP, 1992b. Age-Dependent Doses to Members of the Public from Intake of
Radionuclides: Part 2 Ingestion Dose Coefficients. ICRP Publication 67. Ann. ICRP22(3e4).
ICRP, 1995. Age-Dependent Doses to the Members of the Public from Intake ofRadionuclides: Part 5 Compilation of Ingestion and Inhalation Coefficients. ICRPPublication 72. Ann. ICRP 26(1).
ICRP, 2006. Assessing Dose of the Representative Person for the Purpose of Radi-ation Protection of the Public and the Optimization of Radiological Protection:Broadening the Process. ICRP Publication 101. Ann. ICRP 36(3).
ICRP, 2007. The 2007 Recommendations of the International Commission onRadiological Protection. ICRP Publication 103. Ann. ICRP 37(2e4).
ICRP, 2009a. Application of the Commission’s Recommendations to the Protectionof People Living in Long-Term Contaminated Areas after a Nuclear Accident ora Radiation Emergency. ICRP Publication 111. Ann. ICRP 39(3). http://www.icrp.org/docs/P111(Special%2520Free%2520Release).pdf.
ICRP, 2009b. Statement on Radon. http://www.icrp.org/docs/ICRP_Statement_on_Radon(November_2009).pdf last accessed on 12 June 2011.
ICRP, 2011. Fukushima Nuclear Power Plant Accident. http://www.icrp.org/docs/Fukushima%2520Nuclear%2520Power%2520Plant%2520Accident.pdf lastaccessed on 12 June 2011.
Jarvis, N.S., Birchall, A., James, A.C., Bailey, M.R., Dorrian, M.-D., 1996. LUDEP 2.0:Personal Computer Program for Calculating Internal Doses Using the ICRPPublication 66 Respiratory Tract Model. National Radiological Protection Board,Chilton, UK. NRPB-SR287.
JRIA, 2010. Statistics on the Use of Radiation in Japan. http://www.jrias.or.jp/index.cfm/6,1246,c,html/1246/20101222-144214.pdf last accessed on 12 June 2011, (inJapanese and English).
MAFF, 2011. Production and Use of Livestock Feed Following the Nuclear Accident.http://www.maff.go.jp/j/kanbo/joho/saigai/c_minasama_3.html last accessedon 12 June 2011, (in Japanese).
MHLW, 2002. Manual for Monitoring of Food in a Nuclear Emergency. http://www.mhlw.go.jp/stf/houdou/2r9852000001558e-img/2r98520000015cfn.pdf lastaccessed on 12 June 2011, (in Japanese).
MHLW, 2011a. Report on the 2008 National Health and Nutrition Survey. http://www.mhlw.go.jp/bunya/kenkou/eiyou/dl/h20-houkoku-01a.pdf last accessedon 20 12 June 2011, (in Japanese).
MHLW, 2011b. Handling of Radionuclide-Contaminated Foods. http://www.mhlw.go.jp/stf/houdou/2r9852000001558e-img/2r9852000001559v.pdf last acce-ssed on 12 June 2011, (in Japanese).
MHLW, 2011c. Notice with Regard to Inspection Based on the Manual for Moni-toring of Food in a Nuclear Emergency. http://www.mhlw.go.jp/stf/houdou/2r98520000014tr1-img/2r98520000015is5.pdf last accessed on 12 June 2011,(in Japanese).
MHLW, 2011d. Request for Health Consultations in Terms of Radiation Effects.http://www.mhlw.go.jp/stf/houdou/2r98520000014tr1-img/2r98520000015fth.pdf last accessed on 12 June 2011, (in Japanese).
MHLW, 2011e. Response to Contamination of Tap Water following Accidents at theFukushima Nuclear Power Plants 1 and 2. http://www.mhlw.go.jp/stf/houdou/2r98520000014tr1-img/2r98520000015k18.pdf last accessed on 12 June 2011,(in Japanese).
MHLW, 2011f. Revised Request for Health Consultations in terms of Radiation Effects.http://www.mhlw.go.jp/stf/houdou/2r98520000015ox9-img/2r98520000015pqe.pdf last accessed on 12 June 2011, (in Japanese).
MHLW, 2011g.Handlingof Provisional RegulationValue for Radionuclides inTapWater.http://www.mhlw.go.jp/stf/houdou/2r98520000017x7l-img/2r98520000017xbh.pdf last accessed on 12 June 2011, (in Japanese).
MHLW, 2011h. Handling of Provisional Regulation Value for Radionuclides in Food.http://www.mhlw.go.jp/stf/houdou/2r98520000017tmu-att/2r98520000017trg.pdf last accessed on 12 June 2011, (in Japanese).
N. Hamada, H. Ogino / Journal of Environmental Radioactivity 111 (2012) 83e99 99
MHLW, 2011i. Policy on the Monitoring of Radionuclides in Tap Water. http://www.mhlw.go.jp/stf/houdou/2r98520000017x7l-img/2r98520000017xbn.pdf lastaccessed on 12 June 2011, (in Japanese).
MHLW, 2011j. Concepts of Inspection Planning and the Instruction and Cancellationof Items and Areas to which Restriction on Distribution and/or Intake of FoodConcerned Applies. http://www.mhlw.go.jp/stf/houdou/2r98520000017tmu-att/2r98520000017ts1.pdf last accessed on 12 June 2011, (in Japanese).
MHLW, 2011k. Provisional Regulation Value for Radioiodines in Seafood. http://www.mhlw.go.jp/stf/houdou/2r98520000017z1u-att/2r98520000017z7d.pdflast accessed on 12 June 2011, (in Japanese).
MHLW, 2011l. Notice with Regard to Inspection Based on the Manual for Monitoringof Food in a Nuclear Emergency. http://www.mhlw.go.jp/stf/houdou/2r98520000019v70-img/2r9852000001a0nj.pdf last accessed on 12 June2011, (in Japanese).
MHLW, 2011m. Inspections on Radioactive Concentrations in Breast Milk. http://www.mhlw.go.jp/stf/houdou/2r9852000001azxj.html last accessed on 12 June2011, (in Japanese).
MHLW, 2011n. Information related to the Great East Japan Earthquake. http://www.mhlw.go.jp/stf/houdou/2r98520000014j15.html last accessed on 12 June 2011,(in Japanese).
MHW,1988.Reporton the1986NationalNutritionSurvey. http://www.nih.go.jp/eiken/chosa/kokumin_eiyou/1986.html last accessed on 12 June 2011, (in Japanese).
MHW, 2000. Methods for Dosimetry and Calculations of Effective and EquivalentDoses, Notification No. 398 of the Ministry of Health and Welfare of Japan.http://web.sapmed.ac.jp/rco/download/ko12.12.26-3.pdf last accessed on 12June 2011, (in Japanese).
NERHQ, 2011a. Report of JapaneseGovernment to the IAEAMinisterial Conference onNuclear Safety e The Accident at TEPCO’s Fukushima Nuclear Power Stations.http://www.kantei.go.jp/foreign/kan/topics/201106/iaea_houkokusho_e.htmllast accessed on 12 June 2011.
NERHQ, 2011b. The Great East Japan Earthquake. http://www.kantei.go.jp/saigai/pdf/201106021700jisin.pdf last accessed on 12 June 2011, (in Japanese).
NISA, 2011a. INES (the International Nuclear and Radiological Event Scale) rating onthe events in Fukushima Dai-ichi Nuclear Power Station by the Tohoku District
e off the Pacific Ocean Earthquake. http://www.nisa.meti.go.jp/english/files/en20110412-4.pdf last accessed on 12 June 2011.
NISA, 2011b. Evaluation for the Status of Reactor Cores in Units 1-3 of theFukushima Nuclear Power Plant 1. http://www.meti.go.jp/earthquake/nuclear/pdf/20110606-1nisa.pdf last accessed on 12 June 2011, (in Japanese).
NSC, 1980. Guideline for Nuclear Disaster Measures. http://www.nsc.go.jp/shinsashishin/pdf/history/59-15.pdf last accessed on 12 June 2011, (in Japanese).
NSC, 2011. A Testing Estimate for the Amount of 131I and 137Cs Released from theFukushima Nuclear Power Plant 1 into the Atmosphere. http://www.nsc.go.jp/info/20110412.pdf last accessed on 12 June 2011, (in Japanese).
NPA, 2011. Damage Situation and Police Countermeasures Associated with 2011Tohoku District e off the Pacific Ocean Earthquake. http://www.npa.go.jp/archive/keibi/biki/higaijokyo_e.pdf last accessed on 12 June 2011.
Suga, S., Ichikawa, R., 2000. On the revision of control index levels on the ingestionof food and water in the guidelines for radiological emergency preparednessand countermeasures in Japan. Jap. J. Health Phys. 35, 449e466. http://www.journalarchive.jst.go.jp/jnlpdf.php%3Fcdjournal¼jhps1966&cdvol¼35&noissue¼4&startpage¼449&lang¼ja&from¼jnltoc last accessed on 12 June 2011, (inJapanese with English title and abstract).
TEPCO, 2011a. Outflow of Radioactive Water from the Concrete Crack Near IntakeCanal for Unit 2 of Fukushima Dai-ichi Nuclear Power Station. http://www.tepco.co.jp/en/press/corp-com/release/betu11_e/images/110421e2.pdf last accessedon 12 June 2011.
TEPCO, 2011b. Roadmap Towards Restoration from the Accident at FukushimaDai-ichi Nuclear Power Plant Station. http://www.tepco.co.jp/en/press/corp-com/release/11041707-e.html last accessed on 12 June 2011.
WHO, 1988. Derived Intervention Levels for Radionuclides in Foods e Guidelines forApplication After Widespread Radioactive Contamination Resulting froma Major Accident, Geneva, Switzerland.
WHO, 2006. Guidelines for drinking-water quality: incorporating first and secondaddenda, vol. 1, Recommendations e third ed., Geneva, Switzerland.
Yasuda, H., Sato, T., Yonehara, H., Kosako, T., Fujitaka, K., Sasaki, Y., 2011. Manage-ment of cosmic radiation exposure for aircraft crew in Japan. Radiat. Prot. Dosim146, 123e125.